Shareholder Report
Jul. 31, 2026
USD ($)
holding
Jul. 31, 2026
USD ($)
holding
This annual shareholder report contains important information about the TBG Dividend Focus ETF (the “Fund”) for the period of August 1, 2025 to July 31, 2026 (the “Period”). You can find additional information about the Fund at https://tbgdividendgrowth.com/. You can also request this information by contacting us at (215) 330-4476. For information regarding your Fund shares or account, including account balances, transactions, or distributions, please contact your financial intermediary. This report describes changes to the Fund that occurred during the reporting period. | |||||||||||
Availability of Additional Information
For additional information about the Fund, including its prospectus, financial information, holdings, and proxy information, visit https://tbgdividendgrowth.com/. You can also request information by calling (215) 330-4476.
Householding
Householding is an option available to certain investors of the Fund. Householding is a method of delivery, based on the preference of the individual investor, in which a single copy of certain shareholder documents can be delivered to investors who share the same address, even if their accounts are registered under different names. Householding for the Fund is available through certain broker-dealers. If you are interested in enrolling in householding and receiving a single copy of prospectuses and other shareholder documents or you are currently enrolled in householding and wish to change your householding status, please contact your broker-dealer.
| WHAT WERE THE FUND COSTS FOR THE PERIOD? (based on a hypothetical $10,000 investment) | |||||||||||
| COST OF $10,000 INVESTMENT | COST PAID AS A PERCENTAGE OF $10,000 INVESTMENT | ||||||||||
| $63 | 0.57% | ||||||||||
WHAT FACTORS INFLUENCED PERFORMANCE FOR THE PERIOD? | ||
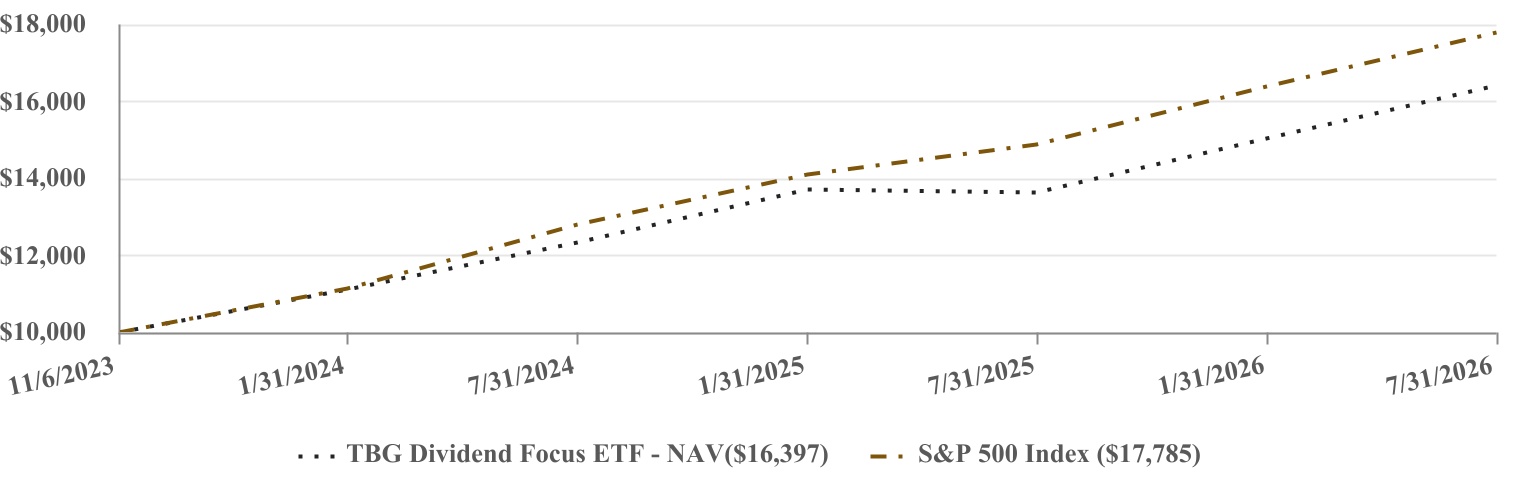
The Fund returned 20.33% (NAV) for the Period, compared with 19.56% for the S&P 500 Index. Performance reflected broad participation across a portfolio of dividend-paying companies selected for financial strength, free cash flow generation, and the ability to sustain and grow distributions. Relative performance was influenced by the Fund's differentiated sector positioning. An overweight to Energy benefited results amid strong performance in the sector, while an underweight to Information Technology limited participation in that sector's gains. Consistent with the Fund's dividend growth mandate, 31 of the Fund's 37 equity holdings as of fiscal year-end increased their dividends during the Period. The Fund continues to use bottom-up fundamental analysis to identify well-run companies with durable cash flows, sustainable payout profiles, and the capacity to both reinvest in their businesses and return growing income to shareholders.
PERFORMANCE OF A HYPOTHETICAL $10,000 INVESTMENT | |||||||||||
| PERFORMANCE | ||||||||||||||
| One Year | Since Inception (11/6/2023) | |||||||||||||
| TBG Dividend Focus ETF - NAV | 20.33% | 19.83% | ||||||||||||
| S&P 500 Index | 19.56% | 23.44% | ||||||||||||
The Fund’s past performance is not a good predictor of how the Fund will perform in the future. The graph and table do not reflect the deduction of taxes that a shareholder would pay on fund distributions or redemption of fund shares. | ||||||||||||||
Visit https://tbgdividendgrowth.com/ for more recent performance information. | ||||||||||||||
KEY FUND STATISTICS (as of Period End) | ||||||||||||||||||||
| Net Assets | $260,304,415 | Fund Advisory fees | $1,217,342 | |||||||||||||||||
| # of Portfolio Holdings | 38 | Fees Waived and/or Expenses Reimbursed | $(39,027) | |||||||||||||||||
| Portfolio Turnover Rate* | 30% | Net Fund Advisory Fees | $1,178,315 | |||||||||||||||||
| *Portfolio turnover is not annualized and is calculated without regard to short-term securities having a maturity of less than one year. Excludes impact of in-kind transactions. | ||||||||||||||||||||
| SECTOR WEIGHTING (as a % of Net Assets) | |||||
| Health Care | 15.2% | ||||
| Financials | 13.8% | ||||
| Energy | 12.9% | ||||
| Real Estate | 10.7% | ||||
| Consumer Staples | 9.8% | ||||
| Consumer Discretionary | 9.2% | ||||
| Information Technology | 8.0% | ||||
| Utilities | 6.3% | ||||
| Communication Services | 3.8% | ||||
| Industrials | 3.7% | ||||
| Materials | 1.4% | ||||
| TOP 10 HOLDINGS (as a % of Net Assets) | |||||
| Blackstone, Inc. | 4.5% | ||||
| Merck & Co, Inc. | 4.2% | ||||
| Verizon Communications, Inc. | 3.8% | ||||
| Chevron Corp. | 3.7% | ||||
| Procter & Gamble Co. | 3.5% | ||||
| Simon Property Group, Inc. | 3.4% | ||||
| Brookfield Infrastructure Corp. - Class A | 3.3% | ||||
| PepsiCo, Inc. | 3.3% | ||||
| Johnson & Johnson | 3.2% | ||||
| Accenture PLC - Class A | 3.0% | ||||
Material Fund Changes
This is a summary of certain changes to the Fund since August 1, 2025. For more complete information, you may review the Fund’s current prospectus, dated November 30, 2025, at https://tbgdividendgrowth.com/or upon request at (215) 330-4476.
The Fund’s management fee was reduced to an annual rate of 0.45% of its average daily net assets effective July 20, 2026. The sub-advisory fee rate received by Madison Avenue Financial Solutions, LLC was also reduced to an annual rate of 0.23% of the Fund’s average daily net assets effective July 20, 2026.
From June 8, 2026, through July 19, 2026, the Fund’s investment adviser contractually agreed to reduce its management fee from 0.59% to 0.45% of the Fund’s average daily net assets. This agreement was terminated by the Trustees effective July 20, 2026, when the Fund’s management fee was formally reduced to 0.45% of the Fund’s average daily net assets. The agreement did not provide for recoupment of waived management fees.