Shareholder Report
Jul. 31, 2026
USD ($)
holding
This annual shareholder report contains important information about the DAC 3D Dividend Growth ETF (the “Fund”) for the period of December 4, 2025 to July 31, 2026 (the “Period”). You can find additional information about the Fund at https://dacapitaletf.com/. You can also request this information by contacting us at (215) 330-4476. For information regarding your Fund shares or account, including account balances, transactions, or distributions, please contact your financial intermediary. | |||||||||||
Availability of Additional Information
For additional information about the Fund, including its prospectus, financial information, holdings, and proxy information, visit https://dacapitaletf.com/. You can also request information by calling (215) 330-4476.
Householding
Householding is an option available to certain investors of the Fund. Householding is a method of delivery, based on the preference of the individual investor, in which a single copy of certain shareholder documents can be delivered to investors who share the same address, even if their accounts are registered under different names. Householding for the Fund is available through certain broker-dealers. If you are interested in enrolling in householding and receiving a single copy of prospectuses and other shareholder documents or you are currently enrolled in householding and wish to change your householding status, please contact your broker-dealer.
| WHAT WERE THE FUND COSTS FOR THE PERIOD? (based on a hypothetical $10,000 investment) | |||||||||||
| COST OF $10,000 INVESTMENT | COST PAID AS A PERCENTAGE OF $10,000 INVESTMENT | ||||||||||
| $44 | 0.65% | ||||||||||
WHAT FACTORS INFLUENCED PERFORMANCE FOR THE PERIOD? | ||
During the Period, the Fund delivered strong absolute returns. The Period began with heightened market volatility driven by escalating conflict in the Middle East and rising inflation expectations stemming from a sharp increase in oil prices. However, sentiment improved as corporate earnings growth exceeded expectations, while growing skepticism about the sustainability of accelerating AI-related investment spending helped broaden market leadership beyond the largest technology companies.
Among the Fund’s strongest absolute and relative performers was Comfort Systems USA (FIX: NYSE), which capitalized on continued capital spending associated with data center and AI infrastructure development, and the reshoring of U.S. manufacturing
capacity. The Fund’s Energy holdings also generated strong returns, led by Canadian oil sands producer Canadian Natural Resources (CNQ: NYSE). The sector benefited from higher commodity prices and ongoing supply concerns related to continued geopolitical tensions in the Middle East. Within Information Technology, security selection proved particularly beneficial. Semiconductor equipment manufacturer KLA Corporation (KLAC: NASDAQ) and analog semiconductor leader Texas Instruments (TXN: NASDAQ) were among the Fund’s top contributors, reflecting strong demand trends tied to expanding semiconductor and AI infrastructure investment.
Despite overall strength within Information Technology, Oracle Corporation (ORCL: NASDAQ) negatively impacted Fund performance as investors grew increasingly concerned about the funding requirements and return profile of the company’s AI-related data center investments. Similarly, Intuit Inc. (INTU: NASDAQ) detracted from results after its performance during the 2026 tax season fell modestly short of market expectations. Within the Fund’s otherwise strong Health Care allocation, Zoetis Inc. (ZTS: NYSE) faced increased competitive pressures and pricing challenges. Consumer Discretionary was the Fund’s only sector detractor during the Period, with Lowe’s Companies, Inc. (LOW: NYSE) and NIKE, Inc. (NKE: NYSE) hurting performance, reflecting broad-based weakness as elevated energy costs, higher interest rates, and a more cautious consumer environment pressured discretionary spending.
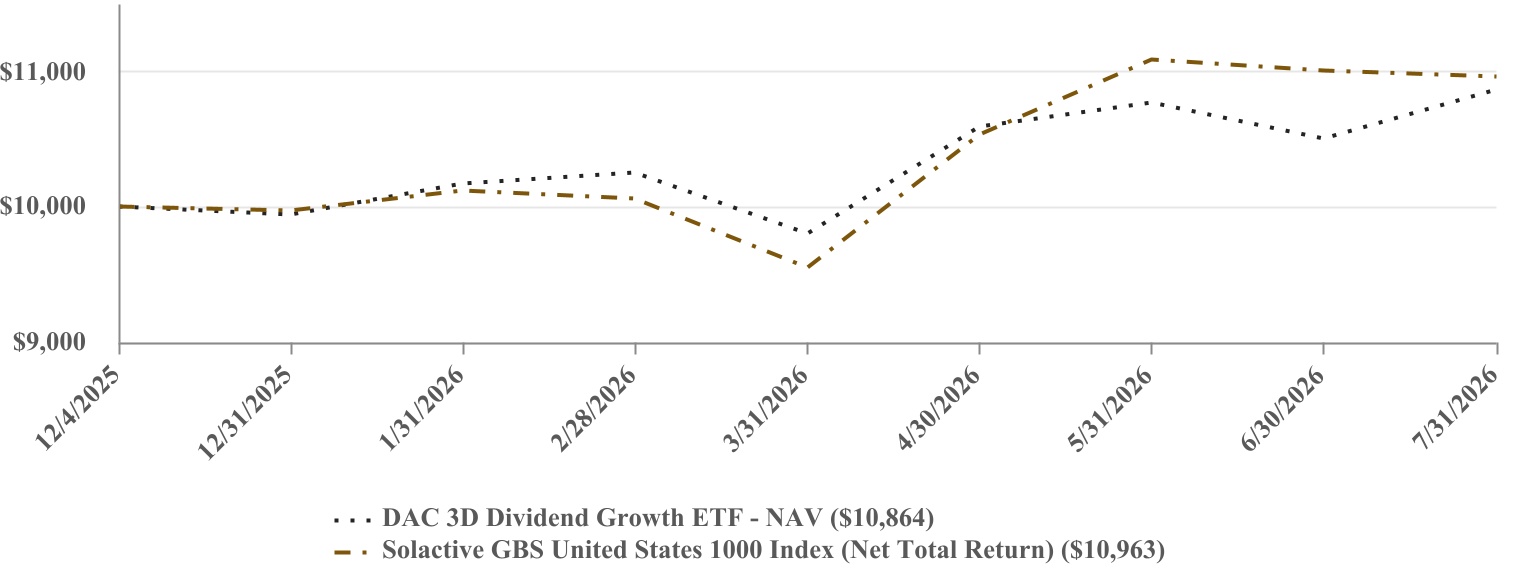
| PERFORMANCE | ||||||||
Since Inception (12/4/2025) | ||||||||
DAC 3D Dividend Growth ETF- NAV | 8.64% | |||||||
| Solactive GBS United States 1000 Index (Net Total Return) | 9.63% | |||||||
The Fund’s past performance is not a good predictor of how the Fund will perform in the future. The graph and table do not reflect the deduction of taxes that a shareholder would pay on fund distributions or redemption of fund shares. Net total return figures assume the reinvestment of dividends after deduction of withholding tax, applying the maximum rate to nonresident individual investors who do not benefit from double taxation treaties. | ||||||||
Visit https://dacapitaletf.com/ for more recent performance information. | ||||||||
KEY FUND STATISTICS (as of Period End) | ||||||||||||||||||||
| Net Assets | $17,530,787 | Portfolio Turnover Rate* | 25% | |||||||||||||||||
| # of Portfolio Holdings | 37 | Fund Advisory Fees Paid | $58,784 | |||||||||||||||||
| *Portfolio turnover is not annualized and is calculated without regard to short-term securities having a maturity of less than one year. Excludes impact of in-kind transactions. | ||||||||||||||||||||
| SECTOR WEIGHTING (as a % of Net Assets) | |||||
| Information Technology | 24.8% | ||||
| Health Care | 16.7% | ||||
| Financials | 15.9% | ||||
| Industrials | 13.4% | ||||
| Consumer Discretionary | 8.8% | ||||
| Energy | 6.8% | ||||
| Consumer Staples | 3.9% | ||||
| Utilities | 3.8% | ||||
| Materials | 2.9% | ||||
| Real Estate | 2.0% | ||||
| TOP 10 HOLDINGS (as a % of Net Assets) | |||||
| Microsoft Corp. | 6.4% | ||||
| Broadcom, Inc. | 5.0% | ||||
| Oracle Corp. | 4.1% | ||||
JPMorgan Chase & Co. | 4.1% | ||||
| Costco Wholesale Corp. | 3.9% | ||||
| UnitedHealth Group, Inc. | 3.9% | ||||
| NextEra Energy, Inc. | 3.8% | ||||
| Visa, Inc. - Class A | 3.7% | ||||
| Goldman Sachs Group, Inc. | 3.7% | ||||
| HEICO Corp. | 3.5% | ||||