Shareholder Report
Jul. 31, 2026
USD ($)
holding
Jul. 31, 2026
USD ($)
holding
This annual shareholder report contains important information about the Warren Street Global Equity ETF (the “Fund”) for the period of December 8, 2025 to July 31, 2026 (the “Period”). You can find additional information about the Fund at https://warrenstreetetf.com/. You can also request this information by contacting us at (215) 330-4476. For information regarding your Fund shares or account, including account balances, transactions, or distributions, please contact your financial intermediary. | |||||||||||
Availability of Additional Information
For additional information about the Fund, including its prospectus, financial information, holdings, and proxy information, visit https://warrenstreetetf.com/. You can also request information by calling (215) 330-4476.
Householding
Householding is an option available to certain investors of the Fund. Householding is a method of delivery, based on the preference of the individual investor, in which a single copy of certain shareholder documents can be delivered to investors who share the same address, even if their accounts are registered under different names. Householding for the Fund is available through certain broker-dealers. If you are interested in enrolling in householding and receiving a single copy of prospectuses and other shareholder documents or you are currently enrolled in householding and wish to change your householding status, please contact your broker-dealer.
| WHAT WERE THE FUND COSTS FOR THE PERIOD? (based on a hypothetical $10,000 investment) | |||||||||||
| COST OF $10,000 INVESTMENT | COST PAID AS A PERCENTAGE OF $10,000 INVESTMENT | ||||||||||
| $41 | 0.60% | ||||||||||
| WHAT FACTORS INFLUENCED PERFORMANCE FOR THE PERIOD? | ||
The Fund delivered strong absolute returns during the Period despite market volatility marked by geopolitical turmoil in the Middle East and Technology sector concerns linked to AI disruption. Positive performance is attributed to regional asset allocation decisions—particularly in Emerging Markets—driven by attractive valuations and a broadening of the AI ecosystem across global supply chains.
Sector positioning and disciplined valuation management within the Technology and Communication Services sectors positively influenced performance. During the Period, the Fund reduced exposure to certain AI beneficiaries and technology-adjacent names trading at elevated valuations and reallocated to broad-based, quality-factor strategies across market caps. Later in the Period, tactical style shifts in Emerging Markets also contributed to strength by balancing legacy growth positions with value positions. Notable detractors came from individual stocks in the Healthcare sector driven by dampening forecasts for medical device volumes and waning sentiment on biotech drug pipelines.
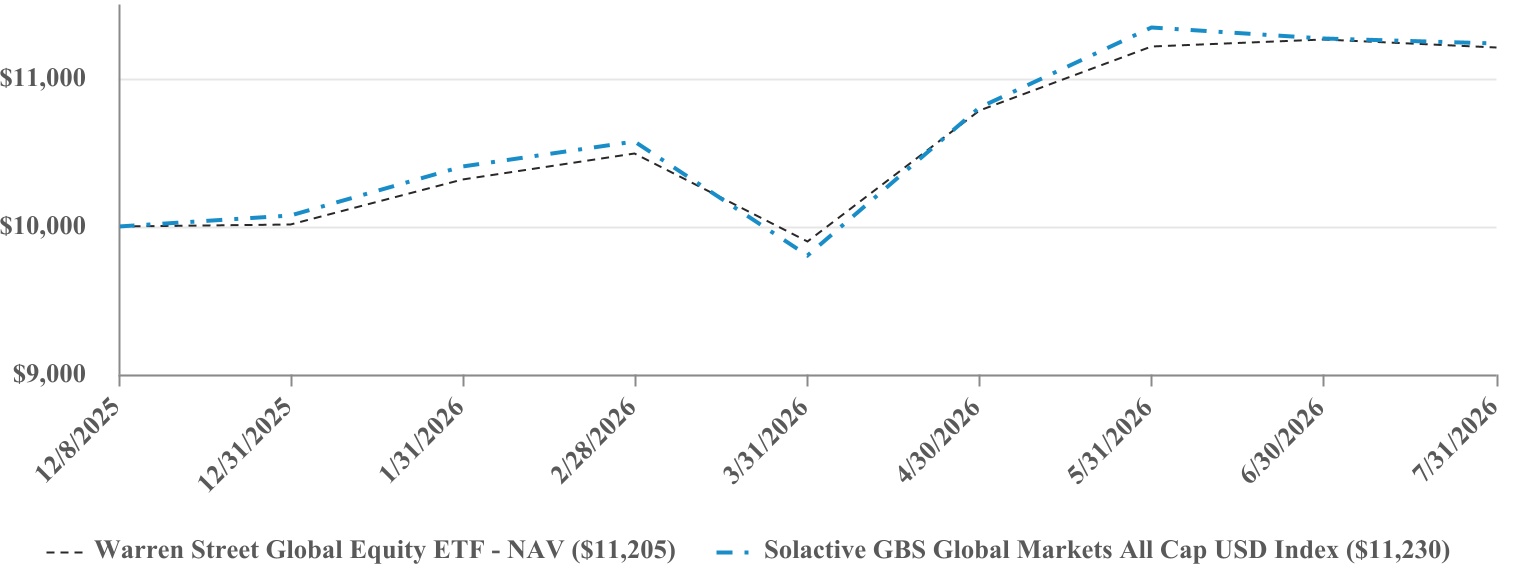
PERFORMANCE OF A HYPOTHETICAL $10,000 INVESTMENT | |||||||||||
| PERFORMANCE | ||||||||
Since Inception (12/8/2025) | ||||||||
| Warren Street Global Equity ETF - NAV | 12.05% | |||||||
| Solactive GBS Global Markets All Cap USD Index | 12.30% | |||||||
The Fund’s past performance is not a good predictor of how the Fund will perform in the future. The graph and table do not reflect the deduction of taxes that a shareholder would pay on fund distributions or redemption of fund shares. Visit https://https://warrenstreetetf.com/for more recent performance information. | ||||||||
| KEY FUND STATISTICS (as of Period End) | ||||||||||||||||||||
| Net Assets | $60,547,955 | Portfolio Turnover Rate* | 41% | |||||||||||||||||
| # of Portfolio Holdings | 135 | Fund Advisory Fees Paid | $193,504 | |||||||||||||||||
| *Portfolio turnover is not annualized and is calculated without regard to short-term securities having a maturity of less than one year. Excludes impact of in-kind transactions. | ||||||||||||||||||||
| ASSET WEIGHTING (as a % of Net Assets) | |||||
| Global Equity ETFs | 50.6% | ||||
| Domestic ETFs | 41.9% | ||||
| Common Stocks | 6.3% | ||||
| Real Estate Investment Trusts | 0.5% | ||||
| TOP 10 HOLDINGS (as a % of Net Assets) | |||||
| iShares Global Equity Factor ETF | 16.9% | ||||
| Vanguard S&P 500 ETF | 9.2% | ||||
| iShares MSCI ACWI ex U.S. ETF | 8.1% | ||||
| JPMorgan US Quality Factor ETF | 5.7% | ||||
| iShares Core S&P 500 ETF | 5.5% | ||||
| State Street SPDR Portfolio S&P 500 ETF | 5.4% | ||||
| WisdomTree Emerging Markets EX-State-Owned Enterprises Fund | 4.3% | ||||
| Avantis Emerging Markets Equity ETF | 4.0% | ||||
| State Street SPDR Portfolio Developed World ex-US ETF | 3.8% | ||||
| State Street SPDR MSCI EAFE StrategicFactors ETF | 3.4% | ||||