Shareholder Report
Jul. 31, 2026
USD ($)
holding
This annual shareholder report contains important information about the Manzil Russell Halal USA Broad Market ETF (the “Fund”) for the period of November 18, 2025 to July 31, 2026 (the “Period”). You can find additional information about the Fund at https://manzilfunds.com/. You can also request this information by contacting us at (215) 330-4476. For information regarding your Fund shares or account, including account balances, transactions, or distributions, please contact your financial intermediary. | |||||||||||
Availability of Additional Information
For additional information about the Fund, including its prospectus, financial information, holdings, and proxy information, visit https://manzilfunds.com/. You can also request information by calling (215) 330-4476.
Householding
Householding is an option available to certain investors of the Fund. Householding is a method of delivery, based on the preference of the individual investor, in which a single copy of certain shareholder documents can be delivered to investors who share the same address, even if their accounts are registered under different names. Householding for the Fund is available through certain broker-dealers. If you are interested in enrolling in householding and receiving a single copy of prospectuses and other shareholder documents or you are currently enrolled in householding and wish to change your householding status, please contact your broker-dealer.
| WHAT WERE THE FUND COSTS FOR THE PERIOD? (based on a hypothetical $10,000 investment) | |||||||||||
| COST OF $10,000 INVESTMENT | COST PAID AS A PERCENTAGE OF $10,000 INVESTMENT | ||||||||||
| $30 | 0.40% | ||||||||||
| WHAT FACTORS INFLUENCED PERFORMANCE FOR THE PERIOD? | |||||||||||
The Fund’s return for the Period was 16.91% (NAV) while, the Fund’s underlying index, the Russell Ideal Ratings Manzil Halal USA Broad Market Custom Index (the "Index"), returned 16.99%. The difference of approximately 0.08% is attributable to Fund operating expenses and portfolio transaction costs.
From the Period, U.S. large- and mid-capitalization equities, particularly within the semiconductor and AI infrastructure sectors, experienced significant growth. This occurred against a backdrop of persistent inflation, which remained above the Federal Reserve’s 2% target throughout the Period, and evolving monetary policy.
Due to the exclusion of interest-based financial companies under our Shariah-compliance screening, the Index maintains a higher allocation to the Technology sector. This structural positioning enabled the Fund to capture more of the growth in AI infrastructure and semiconductor stocks compared to the broader Solactive GBS United States 1000 Index.
Contributors
•Broadcom Inc., Micron Technology, Inc., and Advanced Micro Devices, Inc.: Following an AI-related industry product announcement on November 24, 2025, shares of Broadcom Inc., Micron Technology, Inc., and Advanced Micro Devices, Inc. rallied.
Detractors
•Tesla, Inc.: Shares declined, following the release of second-quarter 2026 earnings.
•Semiconductor sector holdings: The Fund's exposure to semiconductor stocks detracted from performance in July 2026, as the sector faced a broader decline in technology-sector share prices.
| HOW DID THE FUND PERFORM FOR THE PERIOD? | |||||||||||
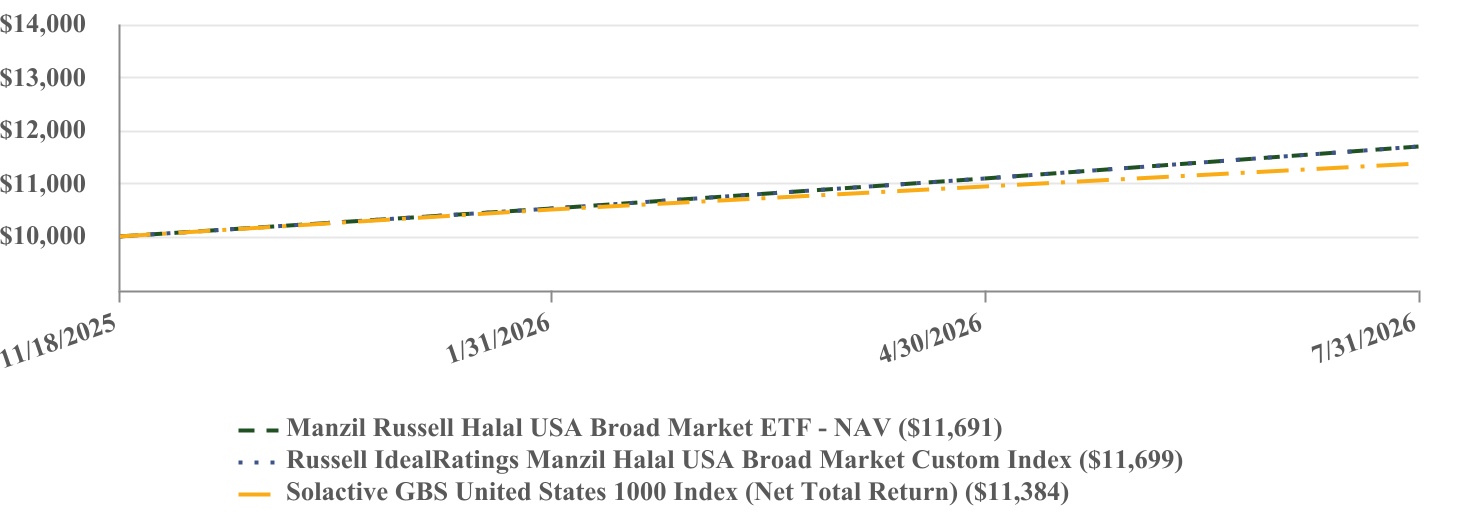
| PERFORMANCE | |||||||||||
Since Inception (11/18/2025) | |||||||||||
| Manzil Russell Halal USA Broad Market ETF - NAV | 16.91% | ||||||||||
| Russell IdealRatings Manzil Halal USA Broad Market Custom Index | 16.99% | ||||||||||
| Solactive GBS United States 1000 Index (Net Total Return) | 13.84% | ||||||||||
The Fund’s past performance is not a good predictor of how the Fund will perform in the future. The graph and table do not reflect the deduction of taxes that a shareholder would pay on Fund distributions or redemption of Fund shares. Net total return figures assume the reinvestment of dividends after deduction of withholding tax, applying the maximum rate to nonresident individual investors who do not benefit from double taxation treaties. | |||||||||||
Visit https://manzilfunds.com/ for more recent performance information. | |||||||||||
| KEY FUND STATISTICS (as of Period End) | |||||||||||||||||||||||
Net Assets | $24,462,439 | Portfolio Turnover Rate* | 11% | ||||||||||||||||||||
| # of Portfolio Holdings | 489 | Fund Advisory Fees Paid | $26,127 | ||||||||||||||||||||
| *Portfolio turnover is not annualized and is calculated without regard to short-term securities having a maturity of less than one year. Excludes impact of in-kind transactions. | |||||||||||||||||||||||
| SECTOR WEIGHTING (as a % of Net Assets) | |||||
| Information Technology | 47.1% | ||||
| Health Care | 15.8% | ||||
| Industrials | 12.7% | ||||
| Consumer Discretionary | 9.5% | ||||
| Materials | 4.1% | ||||
| Consumer Staples | 3.7% | ||||
| Energy | 2.6% | ||||
| Real Estate | 2.4% | ||||
| Communication Services | 1.4% | ||||
| Utilities | 0.3% | ||||
| TOP 10 HOLDINGS (as a % of Net Assets) | |||||
| Apple, Inc. | 15.8% | ||||
| Broadcom, Inc. | 6.4% | ||||
| Eli Lilly & Co. | 3.3% | ||||
| Micron Technology, Inc. | 3.3% | ||||
| Tesla, Inc. | 3.2% | ||||
| Advanced Micro Devices, Inc. | 2.7% | ||||
| Johnson & Johnson | 2.2% | ||||
| Applied Materials, Inc. | 1.4% | ||||
| Lam Research Corp. | 1.3% | ||||
| Procter & Gamble Co. | 1.2% | ||||