Shareholder Report
Jul. 31, 2026
USD ($)
holding
Jul. 31, 2025
Jul. 31, 2026
USD ($)
holding
This annual shareholder report contains important information about the Bushido Capital US Equity ETF (the “Fund”) for the period of August 1, 2025 to July 31, 2026 (the “Period”). You can find additional information about the Fund at https://bushidoetf.com/smri/. You can also request this information by contacting us at (215) 330-4476. For information regarding your Fund shares or account, including account balances, transactions, or distributions, please contact your financial intermediary. | |||||||||||
Availability of Additional Information
For additional information about the Fund, including its prospectus, financial information, holdings, and proxy information, visit https://bushidoetf.com/smri/. You can also request information by calling (215) 330-4476.
Householding
Householding is an option available to certain investors of the Fund. Householding is a method of delivery, based on the preference of the individual investor, in which a single copy of certain shareholder documents can be delivered to investors who share the same address, even if their accounts are registered under different names. Householding for the Fund is available through certain broker-dealers. If you are interested in enrolling in householding and receiving a single copy of prospectuses and other shareholder documents or you are currently enrolled in householding and wish to change your householding status, please contact your broker-dealer.
| WHAT WERE THE FUND COSTS FOR THE PERIOD? (based on a hypothetical $10,000 investment) | |||||||||||
| COST OF $10,000 INVESTMENT | COST PAID AS A PERCENTAGE OF $10,000 INVESTMENT | ||||||||||
| $85 | 0.71% | ||||||||||
| WHAT FACTORS INFLUENCED PERFORMANCE FOR THE PERIOD? | |||||||||||
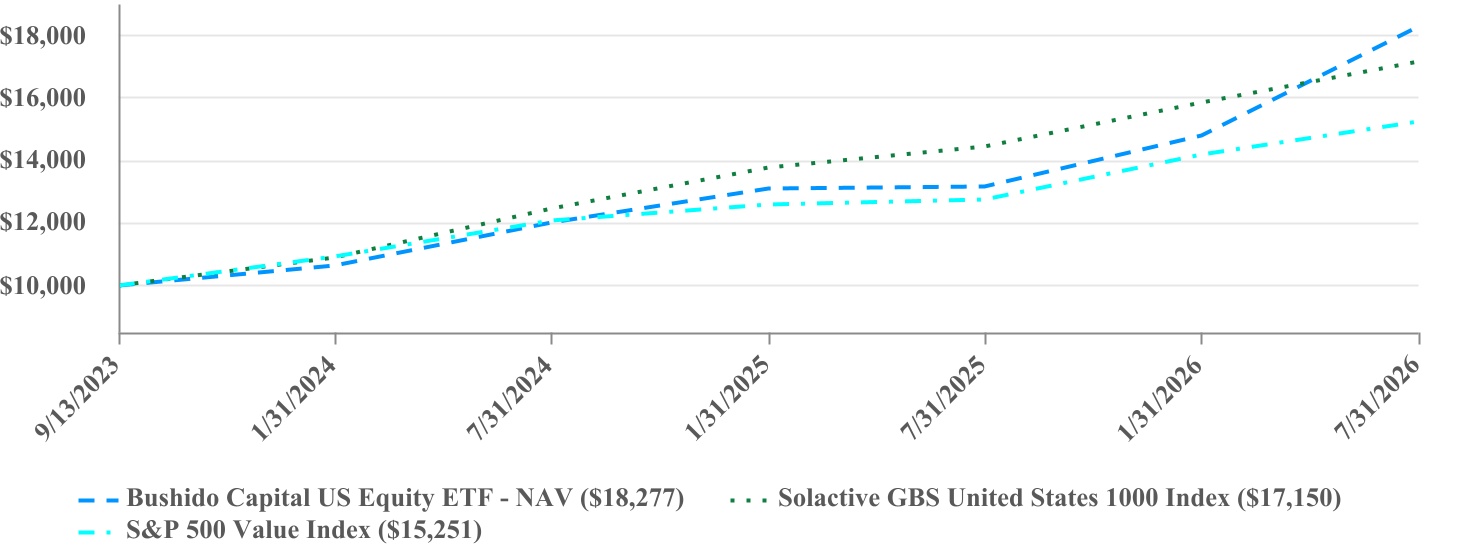
During the period, the Fund returned 38.76%, outperforming both the S&P 500 Value Index and Solactive GBS United States 1000 Index for fiscal year 2026. The performance reflects the Fund's disciplined, systematic investment process, anchored by valuation analysis, which kept the Fund invested in businesses whose prices we judged to be disconnected from their estimated intrinsic value. The resilience of the U.S. equity market, particularly from March through July 2026, provided the environment in which that discipline was rewarded, and the majority of the Fund's outperformance was generated in that period.
Top Contributors:
•Dell Technologies Inc., SanDisk Corp., Centene Corp., Valero Energy Corp., and Marathon Petroleum Corp. were among the top contributors to performance during the fiscal year.
•Stock selection in the Utilities, Materials, and Communication Services sectors, and overweight in the Energy and Information Technology sectors were the top contributors to performance during the fiscal year.
•Our investment process focuses on free cash flow generation, and our performance during the Period was helped by having exposure to specific businesses exhibiting increasing free cash flows (SanDisk, Dell, Valero & Marathon Petroleum) while being underweight the Mag 7 cohort which, collectively, have seen a degradation in their free cash flow generation.
Top Detractors:
•Cognizant Technology Solutions Corp., GoDaddy Inc., Gartner Inc., DocuSign Inc., and PayPal Holdings Inc. were among the top detractors from performance during the fiscal year.
•Stock selection in the Health Care, Energy, and Consumer Discretionary sectors, and overweight in the Consumer Discretionary sector were the top detractors from performance during the fiscal year.
| PERFORMANCE OF A HYPOTHETICAL $10,000 INVESTMENT | |||||||||||
| PERFORMANCE | ||||||||||||||
| One Year | Since Inception (9/13/2023) | |||||||||||||
| Bushido Capital US Equity ETF - NAV | 38.76% | 23.27% | ||||||||||||
| Solactive GBS United States 1000 Index | 18.71% | 20.58% | ||||||||||||
| S&P 500 Value Index | 19.71% | 15.77% | ||||||||||||
| The Solactive GBS United States 1000 Index is provided as a broad measure of market performance. The S&P 500 Value Index is provided as a measure of the Fund’s investment strategy and universe. | ||||||||||||||
| The Fund’s past performance is not a good predictor of how the Fund will perform in the future. The graph and table do not reflect the deduction of taxes that a shareholder would pay on Fund distributions or redemption of fund shares. | ||||||||||||||
Visit https://bushidoetf.com/smri/ for more recent performance information. | ||||||||||||||
| KEY FUND STATISTICS (as of Period End) | ||||||||||||||||||||
| Net Assets | $645,206,149 | Portfolio Turnover Rate* | 168% | |||||||||||||||||
| # of Portfolio Holdings | 51 | Fund Advisory Fees Paid | $3,664,174 | |||||||||||||||||
| *Portfolio turnover is not annualized and is calculated without regard to short-term securities having a maturity of less than one year. Excludes impact of in-kind transactions. | ||||||||||||||||||||
| SECTOR WEIGHTING (as a % of Net Assets) | |||||
| Health Care | 26.3% | ||||
| Energy | 22.6% | ||||
| Information Technology | 22.5% | ||||
| Consumer Discretionary | 9.7% | ||||
| Industrials | 8.2% | ||||
| Communication Services | 3.7% | ||||
| Utilities | 3.5% | ||||
| Materials | 3.4% | ||||
| TOP 10 HOLDINGS (as a % of Net Assets) | |||||
| Tenet Healthcare Corp. | 2.6% | ||||
| Workday, Inc. - Class A | 2.5% | ||||
| Accenture PLC - Class A | 2.4% | ||||
| Veeva Systems, Inc. - Class A | 2.3% | ||||
| Valero Energy Corp. | 2.3% | ||||
| Marathon Petroleum Corp. | 2.3% | ||||
| Adobe, Inc. | 2.3% | ||||
| Phillips 66 | 2.3% | ||||
| Intuit, Inc. | 2.2% | ||||
| Expedia Group, Inc. | 2.2% | ||||
This annual shareholder report contains important information about the Bushido Capital US SMID Cap Equity ETF (the “Fund”) for the period of August 1, 2025 to July 31, 2026 (the “Period”). You can find additional information about the Fund at https://bushidoetf.com/rnin/. You can also request this information by contacting us at (215) 330-4476. For information regarding your Fund shares or account, including account balances, transactions, or distributions, please contact your financial intermediary. | |||||||||||
Availability of Additional Information
For additional information about the Fund, including its prospectus, financial information, holdings, and proxy information, visit https://bushidoetf.com/rnin/. You can also request information by calling (215) 330-4476.
Householding
Householding is an option available to certain investors of the Fund. Householding is a method of delivery, based on the preference of the individual investor, in which a single copy of certain shareholder documents can be delivered to investors who share the same address, even if their accounts are registered under different names. Householding for the Fund is available through certain broker-dealers. If you are interested in enrolling in householding and receiving a single copy of prospectuses and other shareholder documents or you are currently enrolled in householding and wish to change your householding status, please contact your broker-dealer.
| WHAT WERE THE FUND COSTS FOR THE PERIOD? (based on a hypothetical $10,000 investment) | |||||||||||
| COST OF $10,000 INVESTMENT | COST PAID AS A PERCENTAGE OF $10,000 INVESTMENT | ||||||||||
| $80 | 0.67% | ||||||||||
| WHAT FACTORS INFLUENCED PERFORMANCE FOR THE PERIOD? | |||||||||||
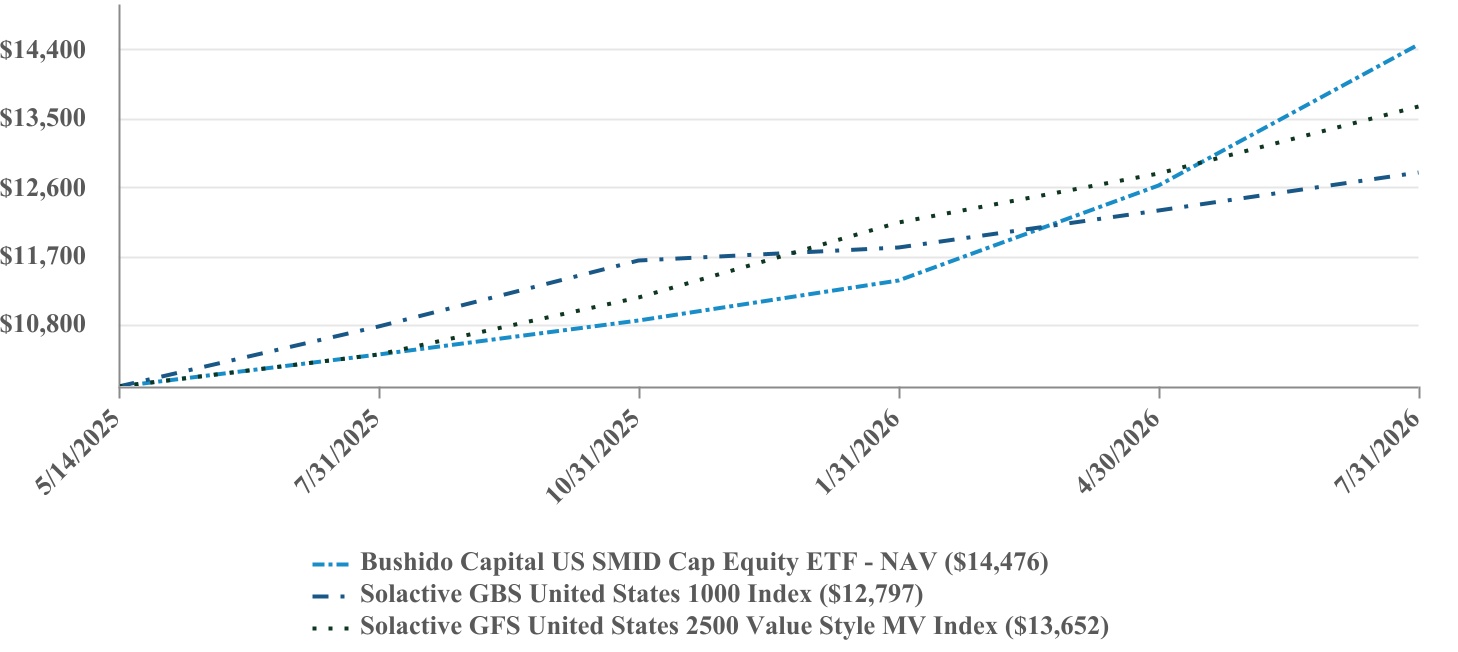
During the Period, the Fund returned 39.07%, outperforming the Solactive GFS United States 2500 Value Style MV Index and Solactive GBS United States 1000 Index in the fiscal year 2026. The performance reflects the Fund's disciplined, systematic investment process, anchored by valuation analysis, which kept the Fund invested in businesses whose prices we judged to be disconnected from their
estimated intrinsic value. The resilience of the U.S. equity market, particularly from March through July 2026, provided the environment in which that discipline was rewarded, and the majority of the Fund's outperformance was generated in that period.
Top Contributors:
•Oscar Health Inc., Par Pacific Holdings Inc., SM Energy Co., APA Corp., and RingCentral Inc. were among the top contributors to performance during the fiscal year.
•Overweight in the Energy and Information Technology sectors, and stock selection in the Consumer Discretionary, Energy, and Materials sectors were the top contributors to performance during the fiscal year.
Top Detractors:
•ZoomInfo Technologies Inc., StubHub Holdings Inc., Concentrix Corp., HP Inc., and Molina Healthcare Inc. were among the top detractors from performance during the fiscal year.
•Stock selection in the Industrials, Health Care, and Communication Services sectors, and overweight in Consumer Discretionary and Communication Services sectors were the top detractors from performance during the fiscal year.
| PERFORMANCE OF A HYPOTHETICAL $10,000 INVESTMENT | |||||||||||
| PERFORMANCE | ||||||||||||||
| One Year | Since Inception (5/14/2025) | |||||||||||||
Bushido Capital US SMID Cap Equity ETF - NAV | 39.07% | 35.63% | ||||||||||||
Solactive GBS United States 1000 Index | 18.71% | 22.53% | ||||||||||||
Solactive GFS United States 2500 Value Style MV Index | 31.17% | 29.24% | ||||||||||||
| The Solactive GBS United States 1000 Index is provided as a broad measure of market performance. The Solactive GFS United States 2500 Value Style MV Index is provided as a measure of the Fund’s investment strategy and universe. | ||||||||||||||
The Fund’s past performance is not a good predictor of how the Fund will perform in the future. The graph and table do not reflect the deduction of taxes that a shareholder would pay on fund distributions or redemption of fund shares. | ||||||||||||||
Visit https://bushidoetf.com/rnin/ for more recent performance information. | ||||||||||||||
| KEY FUND STATISTICS (as of Period End) | ||||||||||||||||||||
| Net Assets | $182,414,981 | Portfolio Turnover Rate* | 181% | |||||||||||||||||
| # of Portfolio Holdings | 82 | Fund Advisory Fees Paid | $915,012 | |||||||||||||||||
| *Portfolio turnover is not annualized and is calculated without regard to short-term securities having a maturity of less than one year. Excludes impact of in-kind transactions. | ||||||||||||||||||||
| INVESTMENT WEIGHTING (as a % of Net Assets) | |||||
| Information Technology | 26.0% | ||||
| Consumer Discretionary | 18.0% | ||||
| Energy | 15.0% | ||||
| Health Care | 11.6% | ||||
| Communication Services | 10.2% | ||||
| Industrials | 9.8% | ||||
| Consumer Staples | 5.7% | ||||
| Financials | 2.4% | ||||
| Materials | 1.1% | ||||
| TOP 10 HOLDINGS (as a % of Net Assets) | |||||
| Par Pacific Holdings, Inc. | 1.9% | ||||
| RingCentral, Inc. - Class A | 1.7% | ||||
| Blackbaud, Inc. | 1.7% | ||||
| BILL Holdings, Inc. | 1.5% | ||||
| EPAM Systems, Inc. | 1.5% | ||||
| HubSpot, Inc. | 1.5% | ||||
| GigaCloud Technology, Inc. - Class A | 1.5% | ||||
| Workday, Inc. - Class A | 1.4% | ||||
| Sprinklr, Inc. Class A | 1.4% | ||||
| Globant SA | 1.4% | ||||