Shareholder Report
Jul. 31, 2026
USD ($)
Holding
This report describes changes to the Fund that occurred during the reporting period.
What were the Fund costs for the last year?
(Based on a hypothetical $10,000 investment)
| Fund Name | Costs of a $10,000 investment | Costs paid as a percentage of a $10,000 investment |
| Hartford Total Return Bond ETF | $29 | 0.29% |
How did the Fund perform last year and what impacted its performance?
Management's Discussion of Fund Performance
United States (U.S.) fixed income sectors generated positive total returns during the trailing twelve-month period ended July 31, 2026. The period was defined by elevated macro uncertainty, with increasingly divergent regional policy paths, persistent inflation, and shifting geopolitical risks. On an excess return basis, credit sectors produced positive returns over duration-equivalent government bonds on tighter spreads, strong investor demand, and positive fund flows. Most developed markets’ sovereign yields finished the period higher, though the move was not uniform. U.S. Treasury yields were volatile throughout the period as markets balanced resilient economic growth, persistent inflation, and evolving expectations for Federal Reserve policy. The performance described below is relative to the Bloomberg US Aggregate Bond Index, the Fund’s performance benchmark.
Top Contributors to Performance
- The Fund’s allocation to structured finance was the top positive contributor to results led by an allocation to Non-Agency Residential Mortgage-Backed Securities (RMBS). Exposure to other securitized sectors including Commercial Mortgage-Backed Securities (CMBS), Collateralized Loan Obligations (CLOs), and Asset-Backed Securities (ABS) contributed positively to relative performance. Positioning within agency MBS also benefited results despite an increase in volatility.
- Out-of-benchmark exposure to High Yield aided results over the period, particularly Industrials.
Top Detractors to Performance
- Duration and yield curve positioning were the main detractors from relative performance.
- The Fund’s underweight in Investment Grade Credit, particularly positioning within Industrials and Financials, detracted from relative performance.
The Fund held tactical interest rate positions during the period, including interest rate futures and swaps. Overall duration and yield curve positioning detracted from relative results. During the period, the Fund used currency forwards and options to implement non-U.S. rate and currency positions which had a negligible impact on performance, in aggregate. Credit default swaps (CDX, CDS) and credit swaps ITRAXX were used to manage credit exposure and overall portfolio risk. High yield credit default swaps positions had a positive impact on performance during the period, and investment grade CDX also had a small positive impact.
The views expressed reflect the opinions of Wellington Management Company, LLP as of the date of this report and are subject to change based on what we consider to be changes in market, economic or other conditions. These views are not intended to be a forecast of future events and are no guarantee of future results.
Comparison of Change in Value of $ 10,000 Investment
The graph below represents the hypothetical growth of a $10,000 investment in the Fund and the comparative index. The Fund’s past performance is not a good predictor of the Fund’s future performance.
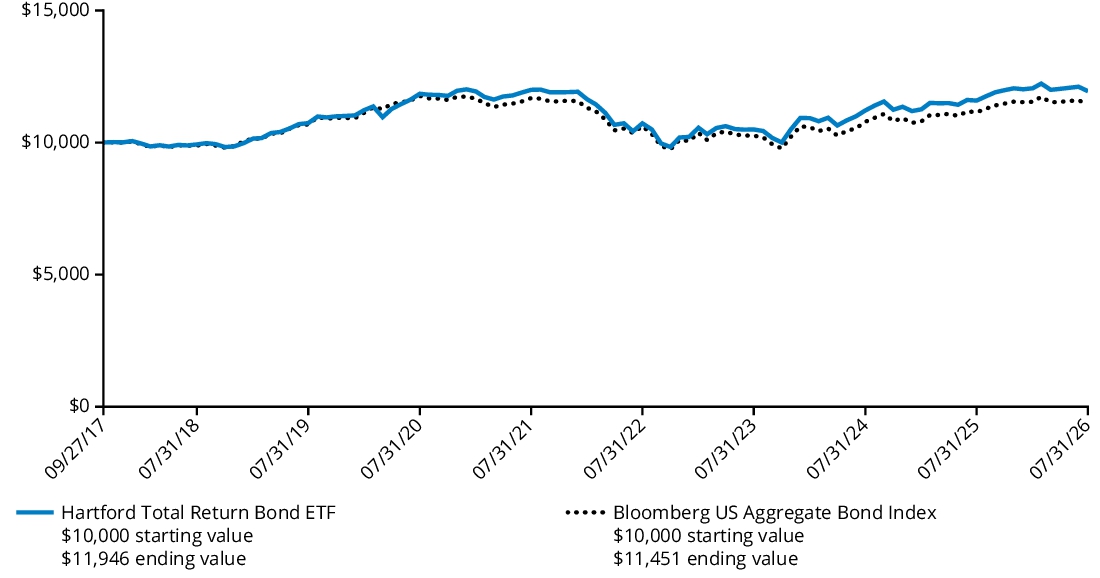
| Average Annual Total Returns For the Periods Ended July 31, 2026 |
1 Year | 5 Years | Since Inception (September 27, 2017) |
| Fund | 3.07% | -0.08% | 2.03% |
| Bloomberg US Aggregate Bond Index | 2.71% | -0.40% | 1.54% |
Key Fund Statistics
as of July 31, 2026
| Fund's net assets | $2,208,622,351 |
| Total number of portfolio holdings | 1,799 |
| Total investment management fees paid | $6,287,749 |
| Portfolio turnover rate (excludes to be announced (TBA) roll transactions, and in-kind creation or redemption transactions, if any) |
94% |
Graphical Representation of Holdings
as of July 31, 2026
The table below shows the investment makeup of the Fund, representing the percentage of net assets of the Fund.
Composition by Security Type
| U.S. Government Agencies^ | 42.6 | % |
| U.S. Government Securities | 30.7 | % |
| Asset-Backed & Commercial Mortgage-Backed Securities | 22.8 | % |
| Corporate Bonds | 17.7 | % |
| Foreign Government Obligations | 2.2 | % |
| Senior Floating Rate Interests | 1.1 | % |
| Convertible Bonds | 0.1 | % |
| Municipal Bonds | 0.0 | %† |
| Preferred Stocks | 0.0 | %† |
| Short-Term Investments | 0.3 | % |
| Other Assets & Liabilities | -17.5 | % |
| Total | 100.0 | % |
| ^ |
All, or a portion of the securities categorized as U.S. Government Agencies, were agency mortgage-backed securities. |
| † |
Percentage rounds to zero. |
Material Fund Changes
This is a summary of certain changes to the Fund since August 1, 2025. For more complete information, you may review the Fund's prospectus dated November 26, 2025, which is currently available at hartfordfunds.com/reports-etf or upon request by calling 1-800-456-7526 or sending an e-mail to orders@mysummaryprospectus.com.
Effective as of November 26, 2025, “Counterparty Risk” was added as a principal risk of the Fund.
Effective as of November 26, 2025, “Counterparty Risk” was added as a principal risk of the Fund.
This is a summary of certain changes to the Fund since August 1, 2025. For more complete information, you may review the Fund's prospectus dated November 26, 2025, which is currently available at hartfordfunds.com/reports-etf or upon request by calling 1-800-456-7526 or sending an e-mail to orders@mysummaryprospectus.com.
What were the Fund costs for the last year?
(Based on a hypothetical $10,000 investment)
| Fund Name | Costs of a $10,000 investment | Costs paid as a percentage of a $10,000 investment |
| Hartford Municipal Opportunities ETF | $30 | 0.29% |
How did the Fund perform last year and what impacted its performance?
Management's Discussion of Fund Performance
United States (U.S.) fixed income sectors generated positive total returns during the trailing twelve-month period ended July 31, 2026. The period was defined by elevated macro uncertainty, with increasingly divergent regional policy paths, persistent inflation, and shifting geopolitical risks. On an excess return basis, credit sectors produced positive returns over duration-equivalent government bonds on tighter spreads, strong investor demand, and positive fund flows. Most developed markets’ sovereign yields finished the period higher, though the move was not uniform. U.S. Treasury yields were volatile throughout the period as markets balanced resilient economic growth, persistent inflation, and evolving expectations for Federal Reserve policy. The performance described below is relative to the Bloomberg Municipal 1-15 Year Blend (1-17) Index, the Fund’s performance benchmark.
Top Contributors to Performance
- Security selection within High-Yield Healthcare and Investment-Grade Industrial Development sectors contributed meaningfully to performance during the period.
- Duration and yield curve positioning also contributed to performance, as we were overweight longer maturities while yields rallied during the period.
Top Detractors to Performance
- Our underweight allocation within Investment-Grade General Obligation (GO) bonds detracted from performance, specifically within the local and state GO sectors during the period.
- Our underweight allocation within Investment-Grade Sewer and Water, multiple Utilities, Transportation, and Lease sectors also detracted from performance during the period.
The views expressed reflect the opinions of Wellington Management Company, LLP as of the date of this report and are subject to change based on what we consider to be changes in market, economic or other conditions. These views are not intended to be a forecast of future events and are no guarantee of future results.
Comparison of Change in Value of $ 10,000 Investment
The graph below represents the hypothetical growth of a $10,000 investment in the Fund and the comparative indices. The Fund’s past performance is not a good predictor of the Fund’s future performance.
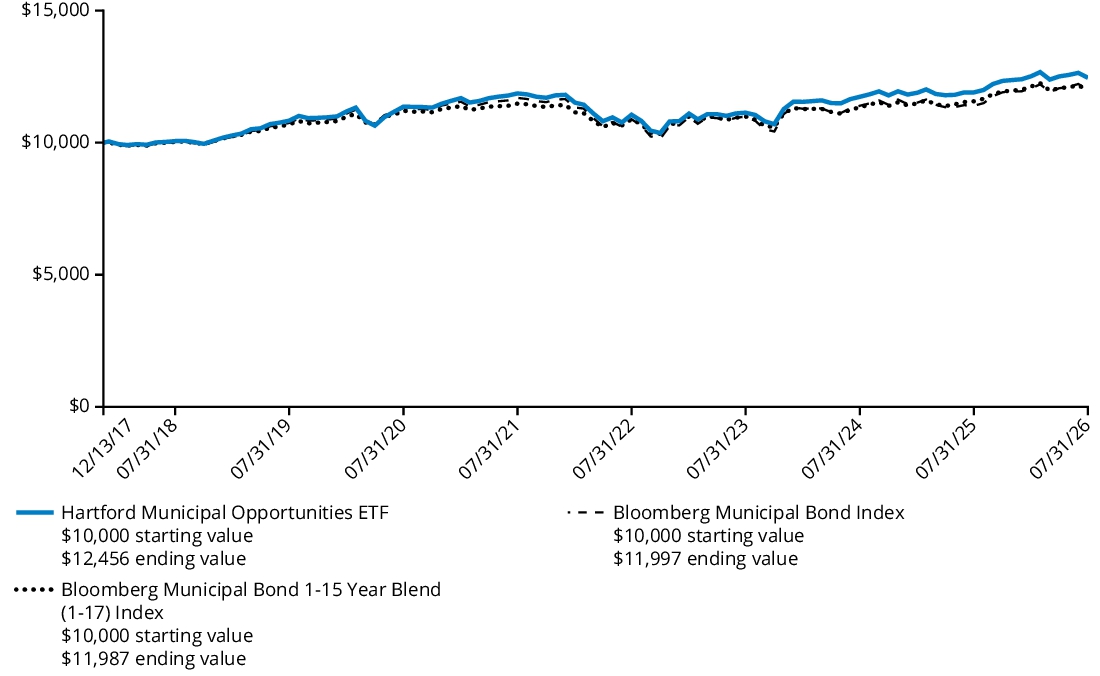
| Average Annual Total Returns For the Periods Ended July 31, 2026 |
1 Year | 5 Years | Since Inception (December 13, 2017) |
| Fund | 4.65% | 0.98% | 2.58% |
| Bloomberg Municipal Bond 1-15 Year Blend (1-17) Index | 3.64% | 0.87% | 2.14% |
| Bloomberg Municipal Bond Index | 5.26% | 0.51% | 2.16% |
Key Fund Statistics
as of July 31, 2026
| Fund's net assets | $784,488,265 |
| Total number of portfolio holdings (excluding derivatives, if any) | 624 |
| Total investment management fees paid | $1,972,452 |
| Portfolio turnover rate (excludes in-kind creation or redemption transactions, if any) | 36% |
Graphical Representation of Holdings
as of July 31, 2026
The table below shows the investment makeup of the Fund, representing the percentage of net assets of the Fund.
Composition by State
| Texas | 10.5 | % |
| Illinois | 8.4 | % |
| Alabama | 7.5 | % |
| New York | 5.8 | % |
| California | 5.5 | % |
| Wisconsin | 4.5 | % |
| Massachusetts | 4.3 | % |
| Georgia | 3.3 | % |
| Florida | 3.2 | % |
| Washington | 3.2 | % |
| Other Non-Municipal Bonds | 1.9 | % |
| Other Municipal Bonds* | 38.4 | % |
| Short-Term Investments | 0.8 | % |
| Other Assets & Liabilities | 2.7 | % |
| Total | 100.0 | % |
| * | Ten largest state allocations are presented. Additional state allocations are found in Other Municipal Bonds. |
This report describes changes to the Fund that occurred during the reporting period.
What were the Fund costs for the last year?
(Based on a hypothetical $10,000 investment)
| Fund Name | Costs of a $10,000 investment | Costs paid as a percentage of a $10,000 investment |
| Hartford Schroders Tax-Aware Bond ETF | $40 | 0.39% |
How did the Fund perform last year and what impacted its performance?
Management's Discussion of Fund Performance
United States (U.S.) fixed income sectors, as measured by the Bloomberg Aggregate Bond Index, generated positive total returns during the trailing twelve-month period ending July 31, 2026. Credit sectors produced positive excess returns over duration-equivalent government bonds despite spreads remaining relatively unchanged for the period as the extra income earned resulted in outperformance relative to duration-neutral Treasuries. Other risk assets such as Agency Mortgages were notably ahead of credit as lower rate volatility was supportive. Tax-Exempt Municipals were generally the best Investment-Grade sector in terms of excess returns to Treasuries as elevated yields attracted consistent cash flows into the sector despite heavy supply. The performance described below is relative to the Bloomberg Municipal Bond Index, the Fund’s performance benchmark.
Top Contributors to Performance
- Sector selection within the Tax-Exempt Municipal sector was materially positive with the underweight to GO (General Obligation) bonds, overweight to Federal Agency, overweight to Corporate-Supported and overweight to Health Care sectors, notable contributors. The additional yield pick-up for the structured sectors such as Federal Agency and Corporate-Supported was attractive and new issuance was sufficient to meet demand.
- Duration impacts were notably positive as yields rose modestly over the period and the portfolio benefitted from a shorter duration relative to the benchmark.
- Yield curve impacts were also notably positive as being overweight at longer maturities in a flattening curve environment was constructive.
Top Detractors to Performance
- Security selection within Tax-Exempt Municipals was notably negative with GO’s, Health Care and Utilities, the largest detractors. The impact was spread across multiple issuers although Texas school district bonds were notable as possible reductions in state income taxes were viewed as a negative for the sector.
- Tax-Exempt Federal Agency, Utilities, Transportation and Sales Tax Revenue also detracted as a result of security selection. With higher yields over the period, the longer duration of the sectors contributed negatively.
The views expressed in this section reflect the opinions of the Fund's sub-adviser, Schroder Investment Management North America Ltd. as of the date of this report and are subject to change based on changes in market, economic or other conditions. These views are not intended to be a forecast of future events and are no guarantee of future results.
Comparison of Change in Value of $ 10,000 Investment
The graph below represents the hypothetical growth of a $10,000 investment in the Fund and the comparative index. The Fund’s past performance is not a good predictor of the Fund’s future performance.
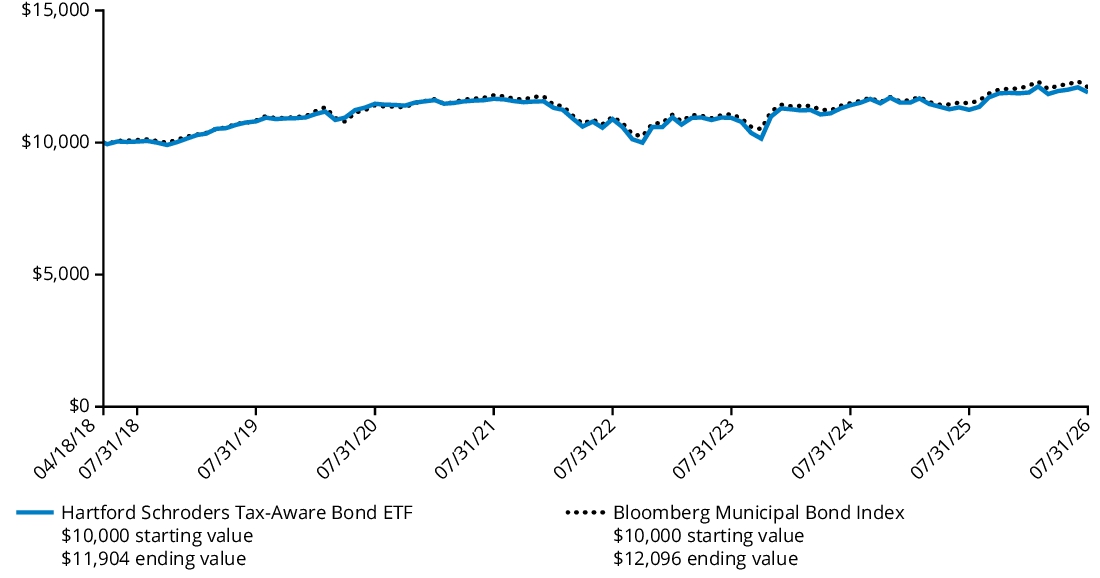
| Average Annual Total Returns For the Periods Ended July 31, 2026 |
1 Year | 5 Years | Since Inception (April 18, 2018) |
| Fund | 5.91% | 0.42% | 2.13% |
| Bloomberg Municipal Bond Index | 5.26% | 0.51% | 2.32% |
Key Fund Statistics
as of July 31, 2026
| Fund's net assets | $288,206,377 |
| Total number of portfolio holdings | 173 |
| Total investment management fees paid | $1,261,819 |
| Portfolio turnover rate (excludes in-kind creation or redemption transactions, if any) | 59% |
Graphical Representation of Holdings
as of July 31, 2026
The table below shows the investment makeup of the Fund, representing the percentage of net assets of the Fund.
Composition by Security Type
| Municipal Bonds | 73.6 | % |
| U.S. Government Securities | 5.8 | % |
| U.S. Government Agencies^ | 4.6 | % |
| Corporate Bonds | 2.9 | % |
| Short-Term Investments | 12.0 | % |
| Other Assets & Liabilities | 1.1 | % |
| Total | 100.0 | % |
| ^ |
All, or a portion of the securities categorized as U.S. Government Agencies, were agency mortgage-backed securities. |
Material Fund Changes
This is a summary of certain changes to the Fund since August 1, 2025. For more complete information, you may review the Fund's prospectus dated November 26, 2025, which is currently available at hartfordfunds.com/reports-etf or upon request by calling 1-800-456-7526 or sending an e-mail to orders@mysummaryprospectus.com.
Effective as of November 26, 2025, the Fund’s principal investment strategy was revised to remove the reference to investments in to-be-announced transactions (TBAs). In addition, “To-Be-Announced (TBA) Transactions Risk” was removed from the principal risk of the Fund and designated instead as a secondary risk.
Effective as of November 26, 2025, the Fund’s principal investment strategy was revised to remove the reference to investments in to-be-announced transactions (TBAs). In addition, “To-Be-Announced (TBA) Transactions Risk” was removed from the principal risk of the Fund and designated instead as a secondary risk.
This is a summary of certain changes to the Fund since August 1, 2025. For more complete information, you may review the Fund's prospectus dated November 26, 2025, which is currently available at hartfordfunds.com/reports-etf or upon request by calling 1-800-456-7526 or sending an e-mail to orders@mysummaryprospectus.com.
What were the Fund costs for the last year?
(Based on a hypothetical $10,000 investment)
| Fund Name | Costs of a $10,000 investment | Costs paid as a percentage of a $10,000 investment |
| Hartford AAA CLO ETF | $25 | 0.24% |
How did the Fund perform last year and what impacted its performance?
Management's Discussion of Fund Performance
United States (U.S.) fixed income sectors generated positive total returns during the trailing twelve-month period ended July 31, 2026. The period was defined by elevated macro uncertainty, with increasingly divergent regional policy paths, persistent inflation, and shifting geopolitical risks. On an excess return basis, credit sectors produced positive returns over duration-equivalent government bonds on tighter spreads, strong investor demand, and positive fund flows. Most developed markets’ sovereign yields finished the period higher, though the move was not uniform. U.S. Treasury yields were volatile throughout the period as markets balanced resilient economic growth, persistent inflation, and evolving expectations for Federal Reserve policy. The performance described below is relative to the JP Morgan CLOIE AAA Index, the Fund’s performance benchmark.
Top Contributors to Performance
- The Fund’s credit quality positioning was a contributor to performance during the period. The fund has flexibility to invest up to 20% in AA or A-rated CLOs to enhance income and total return potential. The fund averaged an allocation of approximately 14% outside of AAA-rated CLOs during the period which provided the portfolio with additional yield and return.
- The Fund’s security selection was the primary contributor to relative returns during the period, specifically within AAA CLOs.
- Out-of-benchmark exposure to single A CLOs was additive.
Top Detractors to Performance
- The Fund’s underweight allocation to AAA CLOs was a slight detractor to returns over the period.
The views expressed reflect the opinions of Wellington Management Company, LLP as of the date of this report and are subject to change based on what we consider to be changes in market, economic or other conditions. These views are not intended to be a forecast of future events and are no guarantee of future results.
Comparison of Change in Value of $ 10,000 Investment
The graph below represents the hypothetical growth of a $10,000 investment in the Fund and the comparative index. The Fund’s past performance is not a good predictor of the Fund’s future performance.
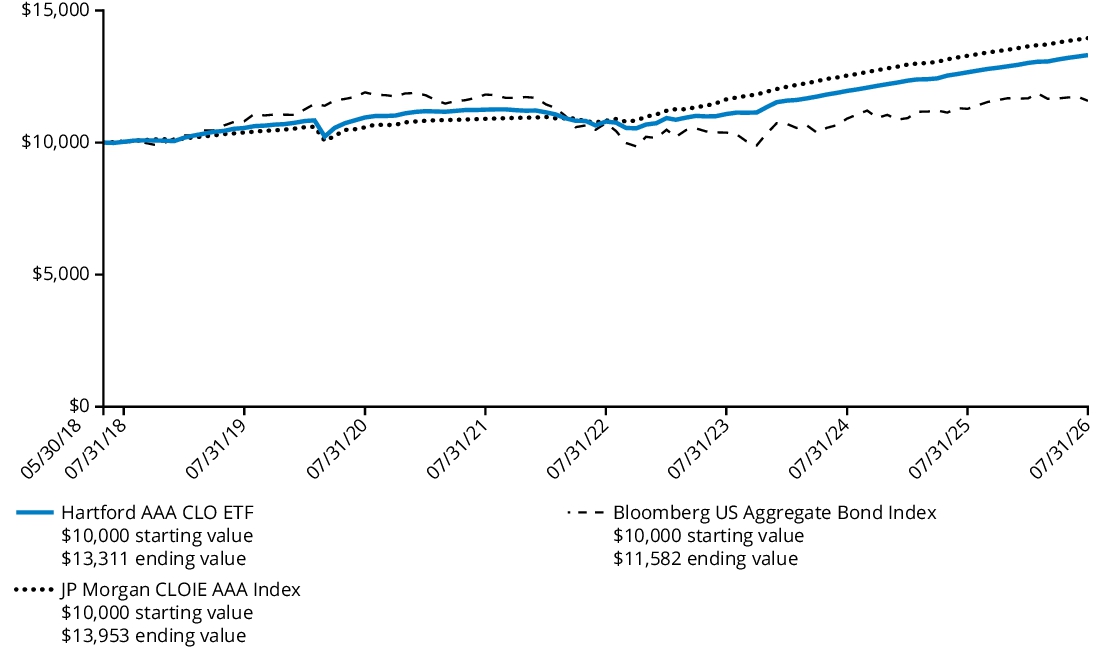
| Average Annual Total Returns For the Periods Ended July 31, 2026 |
1 Year | 5 Years | Since Inception (May 30, 2018) |
| Fund | 5.14% | 3.43% | 3.56% |
| JP Morgan CLOIE AAA Index | 5.02% | 5.07% | 4.16% |
| Bloomberg US Aggregate Bond Index | 2.71% | -0.40% | 1.81% |
Key Fund Statistics
as of July 31, 2026
| Fund's net assets | $110,757,494 |
| Total number of portfolio holdings (excluding derivatives, if any) | 136 |
| Total investment management fees paid | $254,038 |
| Portfolio turnover rate (excludes in-kind creation or redemption transactions, if any) | 51% |
Graphical Representation of Holdings
as of July 31, 2026
The table below shows the investment makeup of the Fund, representing the percentage of net assets of the Fund.
Composition by Security Type
| Asset-Backed & Commercial Mortgage-Backed Securities | 97.0 | % |
| Short-Term Investments | 0.5 | % |
| Other Assets & Liabilities | 2.5 | % |
| Total | 100.0 | % |
This report describes changes to the Fund that occurred during the reporting period.
What were the Fund costs for the last year?
(Based on a hypothetical $10,000 investment)
| Fund Name | Costs of a $10,000 investment | Costs paid as a percentage of a $10,000 investment |
| Hartford Core Bond ETF | $29 | 0.29% |
How did the Fund perform last year and what impacted its performance?
Management's Discussion of Fund Performance
United States (U.S.) fixed income sectors generated positive total returns during the trailing twelve-month period ended July 31, 2026. The period was defined by elevated macro uncertainty, with increasingly divergent regional policy paths, persistent inflation, and shifting geopolitical risks. On an excess return basis, credit sectors produced positive returns over duration-equivalent government bonds on tighter spreads, strong investor demand, and positive fund flows. Most developed markets’ sovereign yields finished the period higher, though the move was not uniform. U.S. Treasury yields were volatile throughout the period as markets balanced resilient economic growth, persistent inflation, and evolving expectations for Federal Reserve policy. The performance described below is relative to the Bloomberg US Aggregate Bond Index, the Fund’s performance benchmark.
Top Contributors to Performance
- The Fund’s allocation to structured finance was the top positive contributor to results led by an allocation to Non-Agency Residential Mortgage-Backed Securities (RMBS). Exposure to other securitized sectors including Commercial Mortgage-Backed Securities (CMBS), Collateralized Loan Obligations (CLOs), and Asset-Backed Securities (ABS) contributed positively to relative performance. Positioning within agency MBS also aided results.
- .An allocation to Treasury Inflation Protected securities (TIPS) modestly benefited results.
Top Detractors to Performance
- Duration and yield curve positioning were the main detractors from relative performance.
- Within Investment Grade Credit, an overall underweight to Industrials and Financials hurt relative performance.
The Fund held tactical interest rate positions during the period, including interest rate futures, swaps and options. Overall duration and yield curve positioning detracted from relative results. Credit default swaps (CDX, CDS) were used to manage credit exposure and overall portfolio risk, this position had a small positive impact on performance.
The views expressed reflect the opinions of Wellington Management Company, LLP as of the date of this report and are subject to change based on what we consider to be changes in market, economic or other conditions. These views are not intended to be a forecast of future events and are no guarantee of future results.
Comparison of Change in Value of $ 10,000 Investment
The graph below represents the hypothetical growth of a $10,000 investment in the Fund and the comparative index. The Fund’s past performance is not a good predictor of the Fund’s future performance.
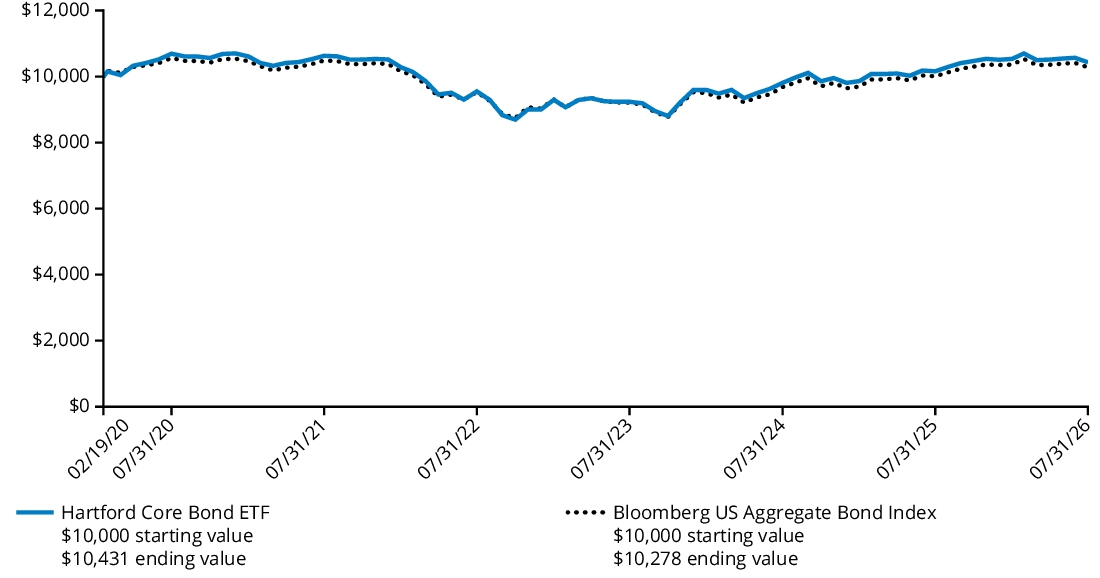
| Average Annual Total Returns For the Periods Ended July 31, 2026 |
1 Year | 5 Years | Since Inception (February 19, 2020) |
| Fund | 2.67% | -0.37% | 0.66% |
| Bloomberg US Aggregate Bond Index | 2.71% | -0.40% | 0.42% |
Key Fund Statistics
as of July 31, 2026
| Fund's net assets | $398,559,320 |
| Total number of portfolio holdings | 788 |
| Total investment management fees paid | $1,027,920 |
| Portfolio turnover rate (excludes to be announced (TBA) roll transactions, and in-kind creation or redemption transactions, if any) |
72% |
Graphical Representation of Holdings
as of July 31, 2026
The table below shows the investment makeup of the Fund, representing the percentage of net assets of the Fund.
Composition by Security Type
| U.S. Government Securities | 46.3 | % |
| U.S. Government Agencies^ | 36.6 | % |
| Asset-Backed & Commercial Mortgage-Backed Securities | 19.5 | % |
| Corporate Bonds | 12.8 | % |
| Foreign Government Obligations | 1.0 | % |
| Short-Term Investments | 0.2 | % |
| Other Assets & Liabilities | -16.4 | % |
| Total | 100.0 | % |
| ^ |
All, or a portion of the securities categorized as U.S. Government Agencies, were agency mortgage-backed securities. |
Material Fund Changes
This is a summary of certain changes to the Fund since August 1, 2025. For more complete information, you may review the Fund's prospectus dated November 26, 2025, which is currently available at hartfordfunds.com/reports-etf or upon request by calling 1-800-456-7526 or sending an e-mail to orders@mysummaryprospectus.com.
Effective as of November 26, 2025, “Counterparty Risk” was added as a principal risk of the Fund.
Effective as of November 26, 2025, “Counterparty Risk” was added as a principal risk of the Fund.
This is a summary of certain changes to the Fund since August 1, 2025. For more complete information, you may review the Fund's prospectus dated November 26, 2025, which is currently available at hartfordfunds.com/reports-etf or upon request by calling 1-800-456-7526 or sending an e-mail to orders@mysummaryprospectus.com.
This report describes changes to the Fund that occurred during the reporting period.
What were the Fund costs for the last year?
(Based on a hypothetical $10,000 investment)
| Fund Name | Costs of a $10,000 investment | Costs paid as a percentage of a $10,000 investment |
| Hartford Strategic Income ETF | $50 | 0.49% |
How did the Fund perform last year and what impacted its performance?
Management's Discussion of Fund Performance
United States (U.S.) fixed income sectors generated positive total returns during the trailing twelve-month period ended July 31, 2026. The period was defined by elevated macro uncertainty, with increasingly divergent regional policy paths, persistent inflation, and shifting geopolitical risks. On an excess return basis, credit sectors produced positive returns over duration-equivalent government bonds on tighter spreads, strong investor demand, and positive fund flows. Most developed markets’ sovereign yields finished the period higher, though the move was not uniform. U.S. Treasury yields were volatile throughout the period as markets balanced resilient economic growth, persistent inflation, and evolving expectations for Federal Reserve policy. The performance described below is relative to the Bloomberg US Aggregate Index, the Fund’s performance benchmark.
Top Contributors to Performance
- An allocation to High Yield was the top positive contributor to relative performance, led by Industrials and Financials. The Fund’s modest allocation to convertible bonds focused on digitization and healthcare innovation themes also aided relative performance. An allocation to Bank Loans had a positive impact on results.
- The Fund’s exposure to Emerging Market (EM) debt, both EM Corporate and select EM Sovereign debt, had a positive impact on relative performance amid spread narrowing.
- The Fund’s allocation to structured finance sectors had a positive impact on results. The Fund’s positioning within Non-Agency Residential Mortgage-Backed Securities (RMBS) benefited relative performance. Exposure to other securitized sectors including Commercial Mortgage-Backed Securities (CMBS), and Asset-Backed Securities (ABS) also contributed positively to relative results.
- The Fund implemented tactical duration and yield curve positioning relative to the benchmark which helped results over the period.
Top Detractors to Performance
- The Fund’s underweight positioning to agency MBS passthroughs hurt relative results.
- The Fund’s underweight positioning to Investment Grade Credit negatively affected relative performance.
During the period, the Fund used futures, currency forwards and currency options to implement non-U.S. rate and currency positions and also made use of interest rate swaps and total return swaps to manage interest rate risk and duration of the portfolio. This derivative positioning aided relative results, in aggregate. Credit swaps (CDS, CDX and iTRAXX) were used to manage credit exposure and overall portfolio risk. High yield credit derivative positions contributed positively to results.
The views expressed reflect the opinions of Wellington Management Company, LLP as of the date of this report and are subject to change based on what we consider to be changes in market, economic or other conditions. These views are not intended to be a forecast of future events and are no guarantee of future results.
Comparison of Change in Value of $ 10,000 Investment
The graph below represents the hypothetical growth of a $10,000 investment in the Fund and the comparative index. The Fund’s past performance is not a good predictor of the Fund’s future performance.
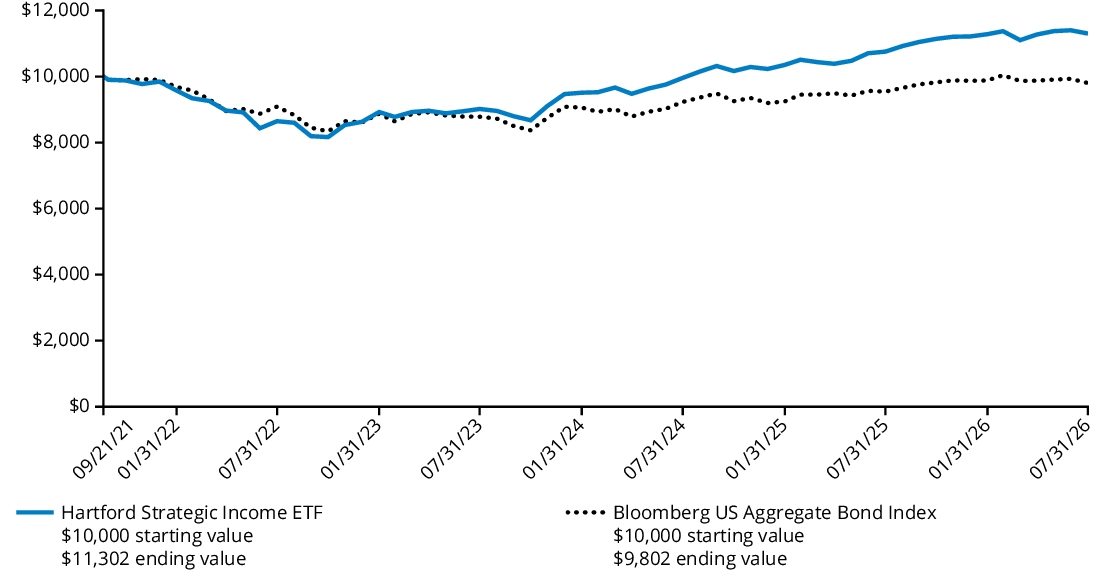
| Average Annual Total Returns For the Periods Ended July 31, 2026 |
1 Year | Since Inception (September 21, 2021) |
| Fund | 5.10% | 2.55% |
| Bloomberg US Aggregate Bond Index | 2.71% | -0.42% |
Key Fund Statistics
as of July 31, 2026
| Fund's net assets | $1,072,099,870 |
| Total number of portfolio holdings | 1,412 |
| Total investment management fees paid | $2,587,946 |
| Portfolio turnover rate (excludes to be announced (TBA) roll transactions, and in-kind creation or redemption transactions, if any) |
211% |
Graphical Representation of Holdings
as of July 31, 2026
The table below shows the investment makeup of the Fund, representing the percentage of net assets of the Fund.
Composition by Security Type
| U.S. Government Securities | 23.9 | % |
| Corporate Bonds | 23.2 | % |
| U.S. Government Agencies^ | 20.8 | % |
| Asset-Backed & Commercial Mortgage-Backed Securities | 18.9 | % |
| Senior Floating Rate Interests | 10.8 | % |
| Foreign Government Obligations | 5.6 | % |
| Convertible Bonds | 3.0 | % |
| Preferred Stocks | 0.8 | % |
| Exchange-Traded Funds | 0.4 | % |
| Common Stocks | 0.0 | %† |
| Convertible Preferred Stocks | 0.0 | %† |
| Purchased Options | 0.0 | %† |
| Warrants | 0.0 | %† |
| Short-Term Investments | 6.1 | % |
| Other Assets & Liabilities | -13.5 | % |
| Total | 100.0 | % |
| ^ |
All, or a portion of the securities categorized as U.S. Government Agencies, were agency mortgage-backed securities. |
| † |
Percentage rounds to zero. |
Material Fund Changes
This is a summary of certain changes to the Fund since August 1, 2025. For more complete information, you may review the Fund's prospectus dated November 26, 2025, which is currently available at hartfordfunds.com/reports-etf or upon request by calling 1-800-456-7526 or sending an e-mail to orders@mysummaryprospectus.com.
Effective as of November 26, 2025, “Counterparty Risk” was added as a principal risk of the Fund.
Effective as of November 26, 2025, “Counterparty Risk” was added as a principal risk of the Fund.
This is a summary of certain changes to the Fund since August 1, 2025. For more complete information, you may review the Fund's prospectus dated November 26, 2025, which is currently available at hartfordfunds.com/reports-etf or upon request by calling 1-800-456-7526 or sending an e-mail to orders@mysummaryprospectus.com.
What were the Fund costs for the last year?
(Based on a hypothetical $10,000 investment)
| Fund Name | Costs of a $10,000 investment | Costs paid as a percentage of a $10,000 investment |
| Hartford Large Cap Growth ETF | $62 | 0.59% |
How did the Fund perform last year and what impacted its performance?
Management's Discussion of Fund Performance
United States (U.S.) equities, as measured by the Russell 1000 Growth Index, posted positive results for the twelve-month period ending July 31, 2026. The performance described below is relative to the Russell 1000 Growth Index, the Fund’s performance benchmark.
Top Contributors to Performance
- Security selection was the primary driver of the Fund’s positive performance specifically stock selection in the Information Technology sector.
- The largest individual relative contributors during the period included an out of benchmark allocation to ARM Holdings (Information Technology) and an underweight to Micron Technology (Information Technology).
Top Detractors to Performance
- Sector allocation, a result of the Fund’s bottom-up stock selection process, detracted from returns. Allocation effect was driven by our underweight to Health Care and Industrials and overweight to Real Estate.
- The largest individual relative detractors during the period included an underweight to Apple (Information Technology) and an overweight to Netflix (Communication Services).
The views expressed reflect the opinions of Wellington Management Company, LLP as of the date of this report and are subject to change based on what we consider to be changes in market, economic or other conditions. These views are not intended to be a forecast of future events and are no guarantee of future results.
Comparison of Change in Value of $ 10,000 Investment
The graph below represents the hypothetical growth of a $10,000 investment in the Fund and the comparative indices. The Fund’s past performance is not a good predictor of the Fund’s future performance.
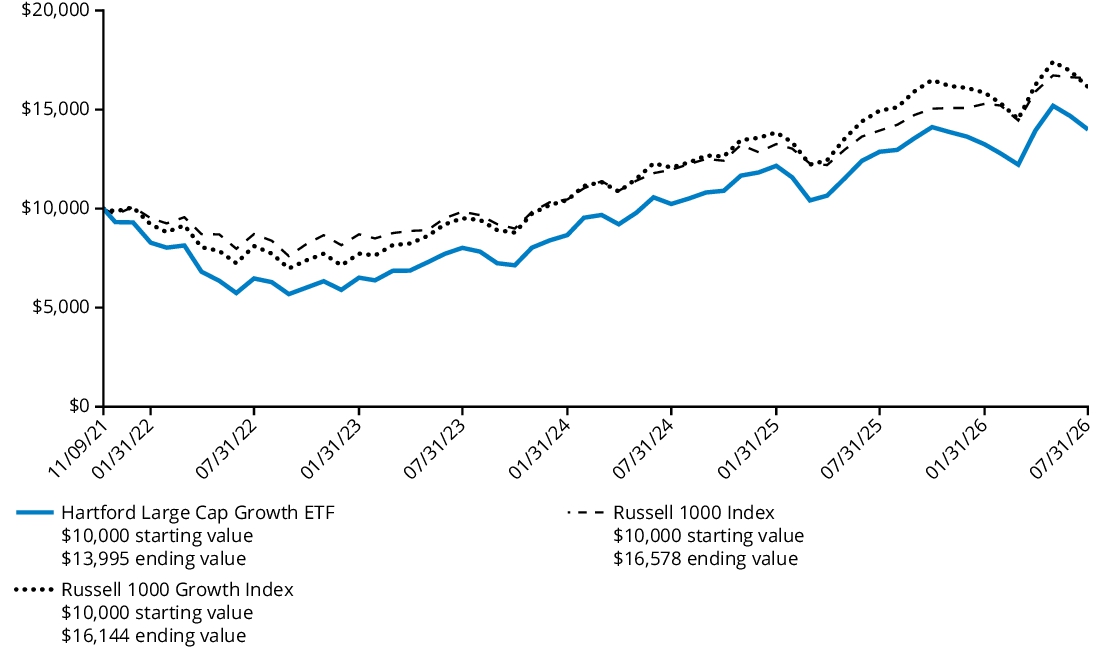
| Average Annual Total Returns For the Periods Ended July 31, 2026 |
1 Year | Since Inception (November 09, 2021) |
| Fund | 8.74% | 7.38% |
| Russell 1000 Growth Index | 8.03% | 10.56% |
| Russell 1000 Index | 18.94% | 11.22% |
Key Fund Statistics
as of July 31, 2026
| Fund's net assets | $200,832,093 |
| Total number of portfolio holdings (excluding derivatives, if any) | 50 |
| Total investment management fees paid | $1,071,403 |
| Portfolio turnover rate (excludes in-kind creation or redemption transactions, if any) | 94% |
Graphical Representation of Holdings
as of July 31, 2026
The table below shows the investment makeup of the Fund, representing the percentage of net assets of the Fund.
Composition by Sector *
| Information Technology | 56.2 | % |
| Communication Services | 20.2 | % |
| Consumer Discretionary | 8.2 | % |
| Health Care | 6.8 | % |
| Industrials | 4.7 | % |
| Financials | 2.1 | % |
| Energy | 0.4 | % |
| Short-Term Investments | 0.7 | % |
| Other Assets & Liabilities | 0.7 | % |
| Total | 100.0 | % |
| * |
For Fund compliance purposes, the Fund may not use the same classification system. These classifications are used for financial reporting purposes. |
This report describes changes to the Fund that occurred during the reporting period.
What were the Fund costs for the last year?
(Based on a hypothetical $10,000 investment)
| Fund Name | Costs of a $10,000 investment | Costs paid as a percentage of a $10,000 investment |
| Hartford Alpha Capture Value ETF | $52 | 0.45% |
How did the Fund perform last year and what impacted its performance?
Management's Discussion of Fund Performance
The Fund transitioned from the Hartford Quality Value ETF to the Hartford Alpha Capture Value ETF during the twelve-month period. The commentary covers the period since inception of the Hartford Alpha Capture Value ETF: April 30, 2026 through July 31, 2026.
United States (U.S.) value equities, as measured by the Russell 1000 Value Index, rose over the three-month period ending July 31, 2026. Despite anxiety about the inflationary impacts of the U.S.-Iran conflict and the prospect of higher interest rates, equity markets were propelled to a series of record highs by robust corporate earnings, elevated earnings-growth expectations, solid economic data, and massive demand for Artificial Intelligence (AI). The performance described below is relative to the Russell 1000 Value Index, the Fund’s performance benchmark.
Top Contributors to Performance
- Security selection within the Materials, Consumer Staples, and Information Technology sectors contributed positively to relative performance.
- An underweight allocation to Materials also contributed positively to relative performance.
- Top individual contributors over the period were an overweight position in Flex (Information Technology), not holding Walmart (Consumer Staples), and an out-of-benchmark position in Eli Lilly (Health Care).
Top Detractors to Performance
- Sector allocation, a result of the Fund’s bottom-up stock selection process, was the primary relative detractor during the period due to the Fund’s underweight to Information Technology and overweights to Utilities and Energy.
- Security selection was also a modest relative detractor during the period, driven by weak selection within the Industrials, Financials, and Consumer Discretionary sectors.
- The largest individual detractors over the period were not holding Applied Materials (Information Technology) and overweight positions in ConocoPhillips (Energy) and Kroger (Consumer Staples).
The views expressed reflect the opinions of Wellington Management Company, LLP as of the date of this report and are subject to change based on what we consider to be changes in market, economic or other conditions. These views are not intended to be a forecast of future events and are no guarantee of future results.
Comparison of Change in Value of $ 10,000 Investment
The graph below represents the hypothetical growth of a $10,000 investment in the Fund and the comparative indices. The Fund’s past performance is not a good predictor of the Fund’s future performance.
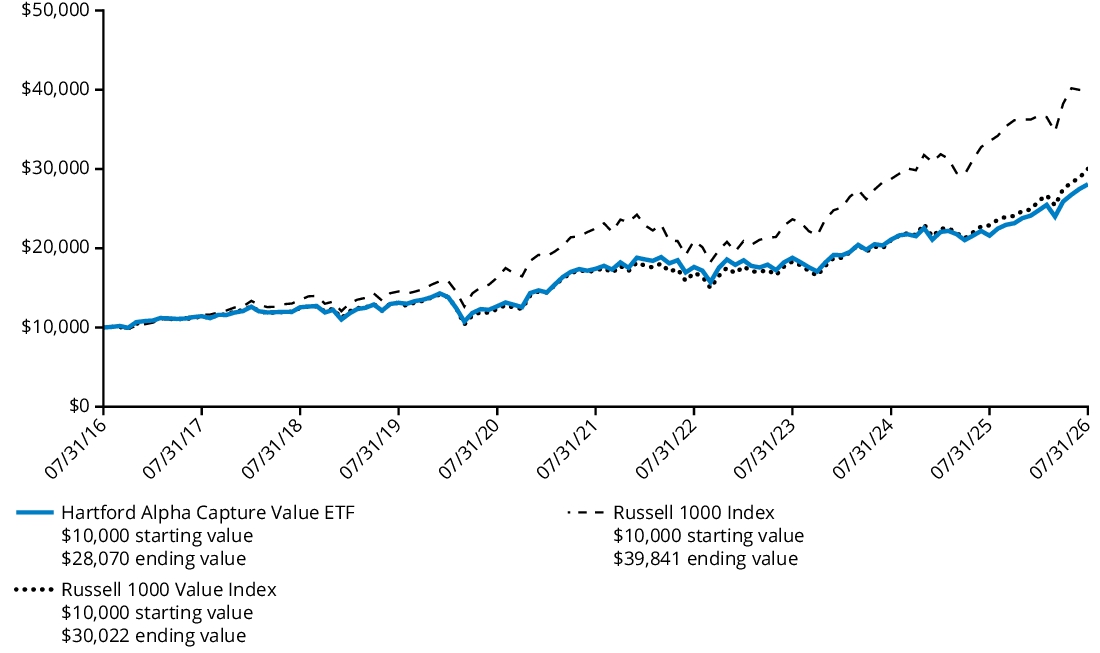
| Average Annual Total Returns For the Periods Ended July 31, 2026 |
1 Year | 5 Years | 10 Years |
| Fund | 30.04% | 10.03% | 10.87% |
| Russell 1000 Value Index | 31.19% | 11.83% | 11.62% |
| Russell 1000 Index | 18.94% | 12.12% | 14.82% |
Key Fund Statistics
as of July 31, 2026
| Fund's net assets | $180,275,911 |
| Total number of portfolio holdings (excluding derivatives, if any) | 108 |
| Total investment management fees paid | $811,471 |
| Portfolio turnover rate (excludes in-kind creation or redemption transactions, if any) | 118% |
Graphical Representation of Holdings
as of July 31, 2026
The table below shows the investment makeup of the Fund, representing the percentage of net assets of the Fund.
Composition by Sector *
| Financials | 20.0 | % |
| Information Technology | 18.4 | % |
| Health Care | 14.7 | % |
| Industrials | 11.2 | % |
| Consumer Discretionary | 10.2 | % |
| Utilities | 6.4 | % |
| Energy | 5.8 | % |
| Consumer Staples | 5.5 | % |
| Real Estate | 3.1 | % |
| Communication Services | 2.1 | % |
| Materials | 2.0 | % |
| Short-Term Investments | 0.5 | % |
| Other Assets & Liabilities | 0.1 | % |
| Total | 100.0 | % |
| * |
For Fund compliance purposes, the Fund may not use the same classification system. These classifications are used for financial reporting purposes. |
Material Fund Changes
This is a summary of certain changes to the Fund since August 1, 2025. For more complete information, you may review the Fund's prospectus dated November 26, 2025, which is currently available at hartfordfunds.com/reports-etf or upon request by calling 1-800-456-7526 or sending an e-mail to orders@mysummaryprospectus.com.
Effective as of April 30, 2026, the Fund's name, ticker symbol, principal investment strategy, and portfolio manager were changed. As a result of the changes to the principal investment strategy, the principal risks of Quantitative Investing Risk and Active Trading Risk were added.
Effective as of April 30, 2026, the Fund's name, ticker symbol, principal investment strategy, and portfolio manager were changed. As a result of the changes to the principal investment strategy, the principal risks of Quantitative Investing Risk and Active Trading Risk were added.
This is a summary of certain changes to the Fund since August 1, 2025. For more complete information, you may review the Fund's prospectus dated November 26, 2025, which is currently available at hartfordfunds.com/reports-etf or upon request by calling 1-800-456-7526 or sending an e-mail to orders@mysummaryprospectus.com.
What were the Fund costs for the last year?
(Based on a hypothetical $10,000 investment)
| Fund Name | Costs of a $10,000 investment* | Costs paid as a percentage of a $10,000 investment^ |
| Hartford Dynamic Bond ETF | $51 | 0.60% |
| * | Cost of a $10,000 investment for a full twelve-month period would have been higher. |
| ^ | Annualized. |
How did the Fund perform last year and what impacted its performance?
Management's Discussion of Fund Performance
United States (U.S.) fixed income sectors generated positive total returns during the trailing twelve-month period ended July 31, 2026. The period was defined by elevated macro uncertainty, with increasingly divergent regional policy paths, persistent inflation, and shifting geopolitical risks. On an excess return basis, credit sectors produced positive returns over duration-equivalent government bonds on tighter spreads, strong investor demand, and positive fund flows. Most developed markets’ sovereign yields finished the period higher, though the move was not uniform. U.S. Treasury yields were volatile throughout the period as markets balanced resilient economic growth, persistent inflation, and evolving expectations for Federal Reserve policy. The performance described below is relative to the Bloomberg US Aggregate Bond Index, the Fund’s performance benchmark, since the ETF inception date of September 23, 2025.
Top Contributors to Performance
- The Fund’s allocation to Investment Grade Credit, which was led by Financials and an allocation to High Yield Credit mainly Industrials, were among the top contributors to the positive results.
- The Fund’s allocation to Emerging Market Government-Related Credit positioning contributed positively to relative results.
Top Detractors to Performance
- The Fund’s duration and yield curve positioning detracted modestly from performance during the period.
- The Fund’s allocation to Emerging Market High Yield Corporates hurt results.
During the period, the Fund employed the tactical use of interest rate futures and credit default index swaps to hedge exposure and gain liquid exposure to credit risk. Credit default index swaps contributed positively to performance while interest rate future positions had a negligible impact on results.
The views expressed reflect the opinions of Wellington Management Company, LLP as of the date of this report and are subject to change based on what we consider to be changes in market, economic or other conditions. These views are not intended to be a forecast of future events and are no guarantee of future results.
Comparison of Change in Value of $ 10,000 Investment
The graph below represents the hypothetical growth of a $10,000 investment in the Fund and the comparative index. The Fund’s past performance is not a good predictor of the Fund’s future performance.
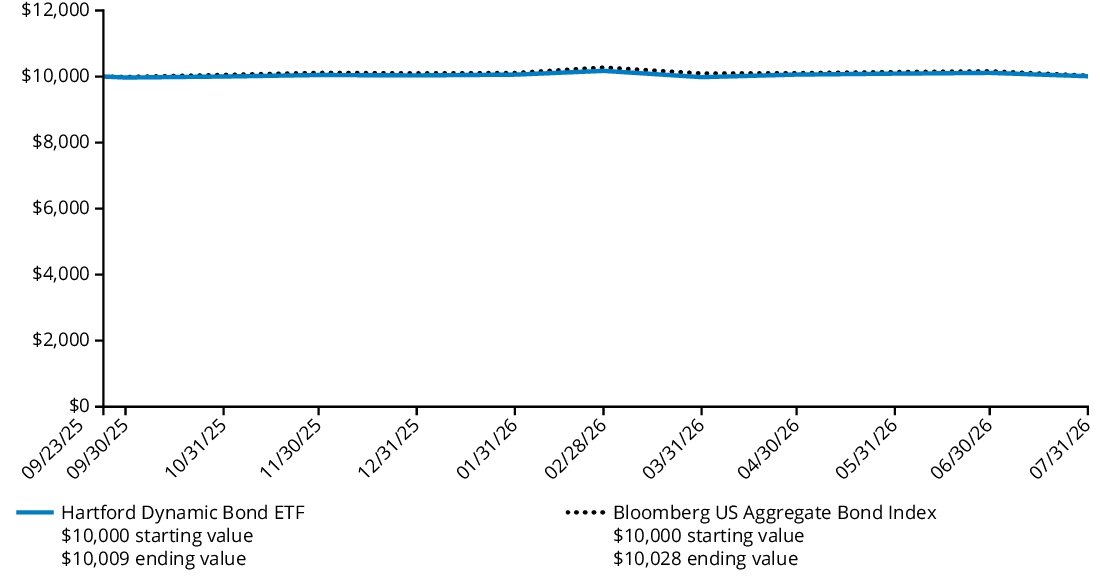
| Cumulative Total Returns For the Period Ended July 31, 2026 |
Since Inception (September 23, 2025) |
| Fund | 0.09% |
| Bloomberg US Aggregate Bond Index | 0.28% |
Key Fund Statistics
as of July 31, 2026
| Fund's net assets | $61,972,942 |
| Total number of portfolio holdings (excluding derivatives, if any) | 168 |
| Total investment management fees paid | $229,035 |
| Portfolio turnover rate (excludes in-kind creation or redemption transactions, if any)* | 808% |
| * |
Reflects rate for the period of September 23, 2025 through July 31, 2026. |
Graphical Representation of Holdings
as of July 31, 2026
The table below shows the investment makeup of the Fund, representing the percentage of net assets of the Fund.
Composition by Security Type
| Corporate Bonds | 43.9 | % |
| U.S. Government Securities | 36.7 | % |
| Foreign Government Obligations | 0.6 | % |
| Short-Term Investments | 19.2 | % |
| Other Assets & Liabilities | -0.4 | % |
| Total | 100.0 | % |
| [1] | Cost of a $10,000 investment for a full twelve-month period would have been higher. |
| [2] | Annualized. |
| [3] | Reflects rate for the period of September 23, 2025 through July 31, 2026. |