Pay vs Performance Disclosure - USD ($)
|
12 Months Ended |
Dec. 31, 2025 |
Dec. 31, 2024 |
Dec. 31, 2023 |
| Pay vs Performance Disclosure [Table] |
|
|
|
| Disclosure - Pay vs Performance Disclosure |
| | |
| | | |
| | | |
| | | |
| | | |
| | | |
| | |
| Year | |
Summary Compensation Table Total for PEO (1) | | |
Compensation Actually Paid to PEO (1) (2) | | |
Average Summary Compensation Table Total for Non-PEO NEOs (1) | | |
Average Compensation Actually Paid to Non-PEO NEOs (1)(2) | | |
Value of Initial Fixed $100 Investment Based On: | | |
Net Income | |
| | |
| | |
| | |
| | |
| | |
Total Shareholder Return (3) | | |
| |
| (a) | |
(b) | | |
(c) | | |
(d) | | |
(e) | | |
(f) | | |
(g) | |
| 2025 | |
$ | 5,439,647 | | |
$ | 3,860,394 | | |
$ | 1,320,719 | | |
$ | 1,040,259 | | |
$ | 105.42 | | |
$ | 19,325,000 | |
| 2024 | |
| 4,165,611 | | |
| 3,258,651 | | |
| 839,162 | | |
| 758,397 | | |
| 122.71 | | |
| 19,203,000 | |
| 2023 | |
| 4,000,342 | | |
| 4,586,692 | | |
| 836,241 | | |
| 998,575 | | |
| 105.88 | | |
| 45,343,000 | |
|
|
|
| Named Executive Officers, Footnote [Text Block] |
| |
(1) |
In each year identified, our PEO was Mr. Bradley. For the fiscal year ended December 31, 2025, our non-PEO NEOs were Mr. Lavin and Mr. Bharwani. For the fiscal year ended December 31, 2024, our non-PEO NEOs were Mr. Lavin, Mr. Bharwani, Ms. Robinson, and Mr. Terry. For the fiscal year ended December 31, 2023, our non-PEO NEOs were Mr. Lavin, Mr. Bharwani, Ms. Robinson, and Ms. Laurie Straten. |
| |
|
|
|
|
|
| Peer Group Issuers, Footnote [Text Block] |
| |
(3) |
Total Shareholder Return assumes $100 was invested in our common stock on December 30, 2022 and assumes the reinvestment of dividends and is cumulative for the measurement periods beginning on that date and ending on the last fiscal day in 2025, 2024 and 2023, respectively. |
|
|
|
| Summary Compensation Total for PEO |
$ 5,439,647
|
$ 4,165,611
|
$ 4,000,342
|
| Compensation Actually Paid to PEO |
$ 3,860,394
|
3,258,651
|
4,586,692
|
| Adjustment To PEO Compensation, Footnote [Text Block] |
| |
(2) |
The table below describes adjustments made to the calculation of CAP in accordance with Item 402(v) of Regulation S-K, to the amounts previously reported in the SCT. The adjustments are as follows: |
| | |
PEO | | |
PEO | | |
PEO | | |
Average for Non-PEO NEOs | | |
Average for Non-PEO NEOs | | |
Average for Non-PEO NEOs | |
| Fiscal Year | |
2025 | | |
2024 | | |
2023 | | |
2025 | | |
2024 | | |
2023 | |
| Summary Compensation Table Total | |
$ | 5,439,647 | | |
$ | 4,165,611 | | |
$ | 4,000,342 | | |
$ | 1,320,719 | | |
$ | 839,162 | | |
$ | 836,241 | |
| Deduct Amounts Reported under the “Option Awards” in the SCT | |
| (1,139,790 | ) | |
| – | | |
| – | | |
| (398,927 | ) | |
| – | | |
| – | |
| Add the fair value as of the end of the covered fiscal year of all awards granted during the covered fiscal year that are outstanding and unvested as of the end of the covered fiscal year | |
| 569,100 | | |
| – | | |
| – | | |
| 199,185 | | |
| – | | |
| – | |
| Add the amount equal to the change as of the end of the covered fiscal year (from the end of the prior fiscal year) in fair value (whether positive or negative) of any awards granted in any prior fiscal year that are outstanding and unvested as of the end of the covered fiscal year | |
| (444,300 | ) | |
| (235,800 | ) | |
| (187,830 | ) | |
| (28,388 | ) | |
| (7,695 | ) | |
| 10,655 | |
| Add, for awards that are granted and vest in the same year, the fair value as of the vesting date | |
| – | | |
| – | | |
| – | | |
| – | | |
| – | | |
| – | |
| Add the amount equal to the change as of the vesting date (from the end of the prior fiscal year) in fair value (whether positive or negative) of any awards granted in any prior fiscal year for which all applicable vesting conditions were satisfied at the end of or during the covered fiscal year | |
| (564,263 | ) | |
| (671,160 | ) | |
| 774,180 | | |
| (52,331 | ) | |
| (73,069 | ) | |
| 151,679 | |
| Subtract, for any awards granted in any prior fiscal year that fail to meet the applicable vesting conditions during the covered fiscal year, the amount equal to the fair value at the end of the prior fiscal year | |
| – | | |
| – | | |
| – | | |
| – | | |
| – | | |
| – | |
| Compensation Actually Paid | |
$ | 3,860,394 | | |
$ | 3,258,651 | | |
$ | 4,586,692 | | |
$ | 1,040,259 | | |
$ | 758,397 | | |
$ | 998,575 | |
|
|
|
| Average Total Compensation Amount for Non-PEO NEO |
$ 1,320,719
|
839,162
|
836,241
|
| Average Compensation Actually Paid to Non-PEO NEOs |
$ 1,040,259
|
758,397
|
998,575
|
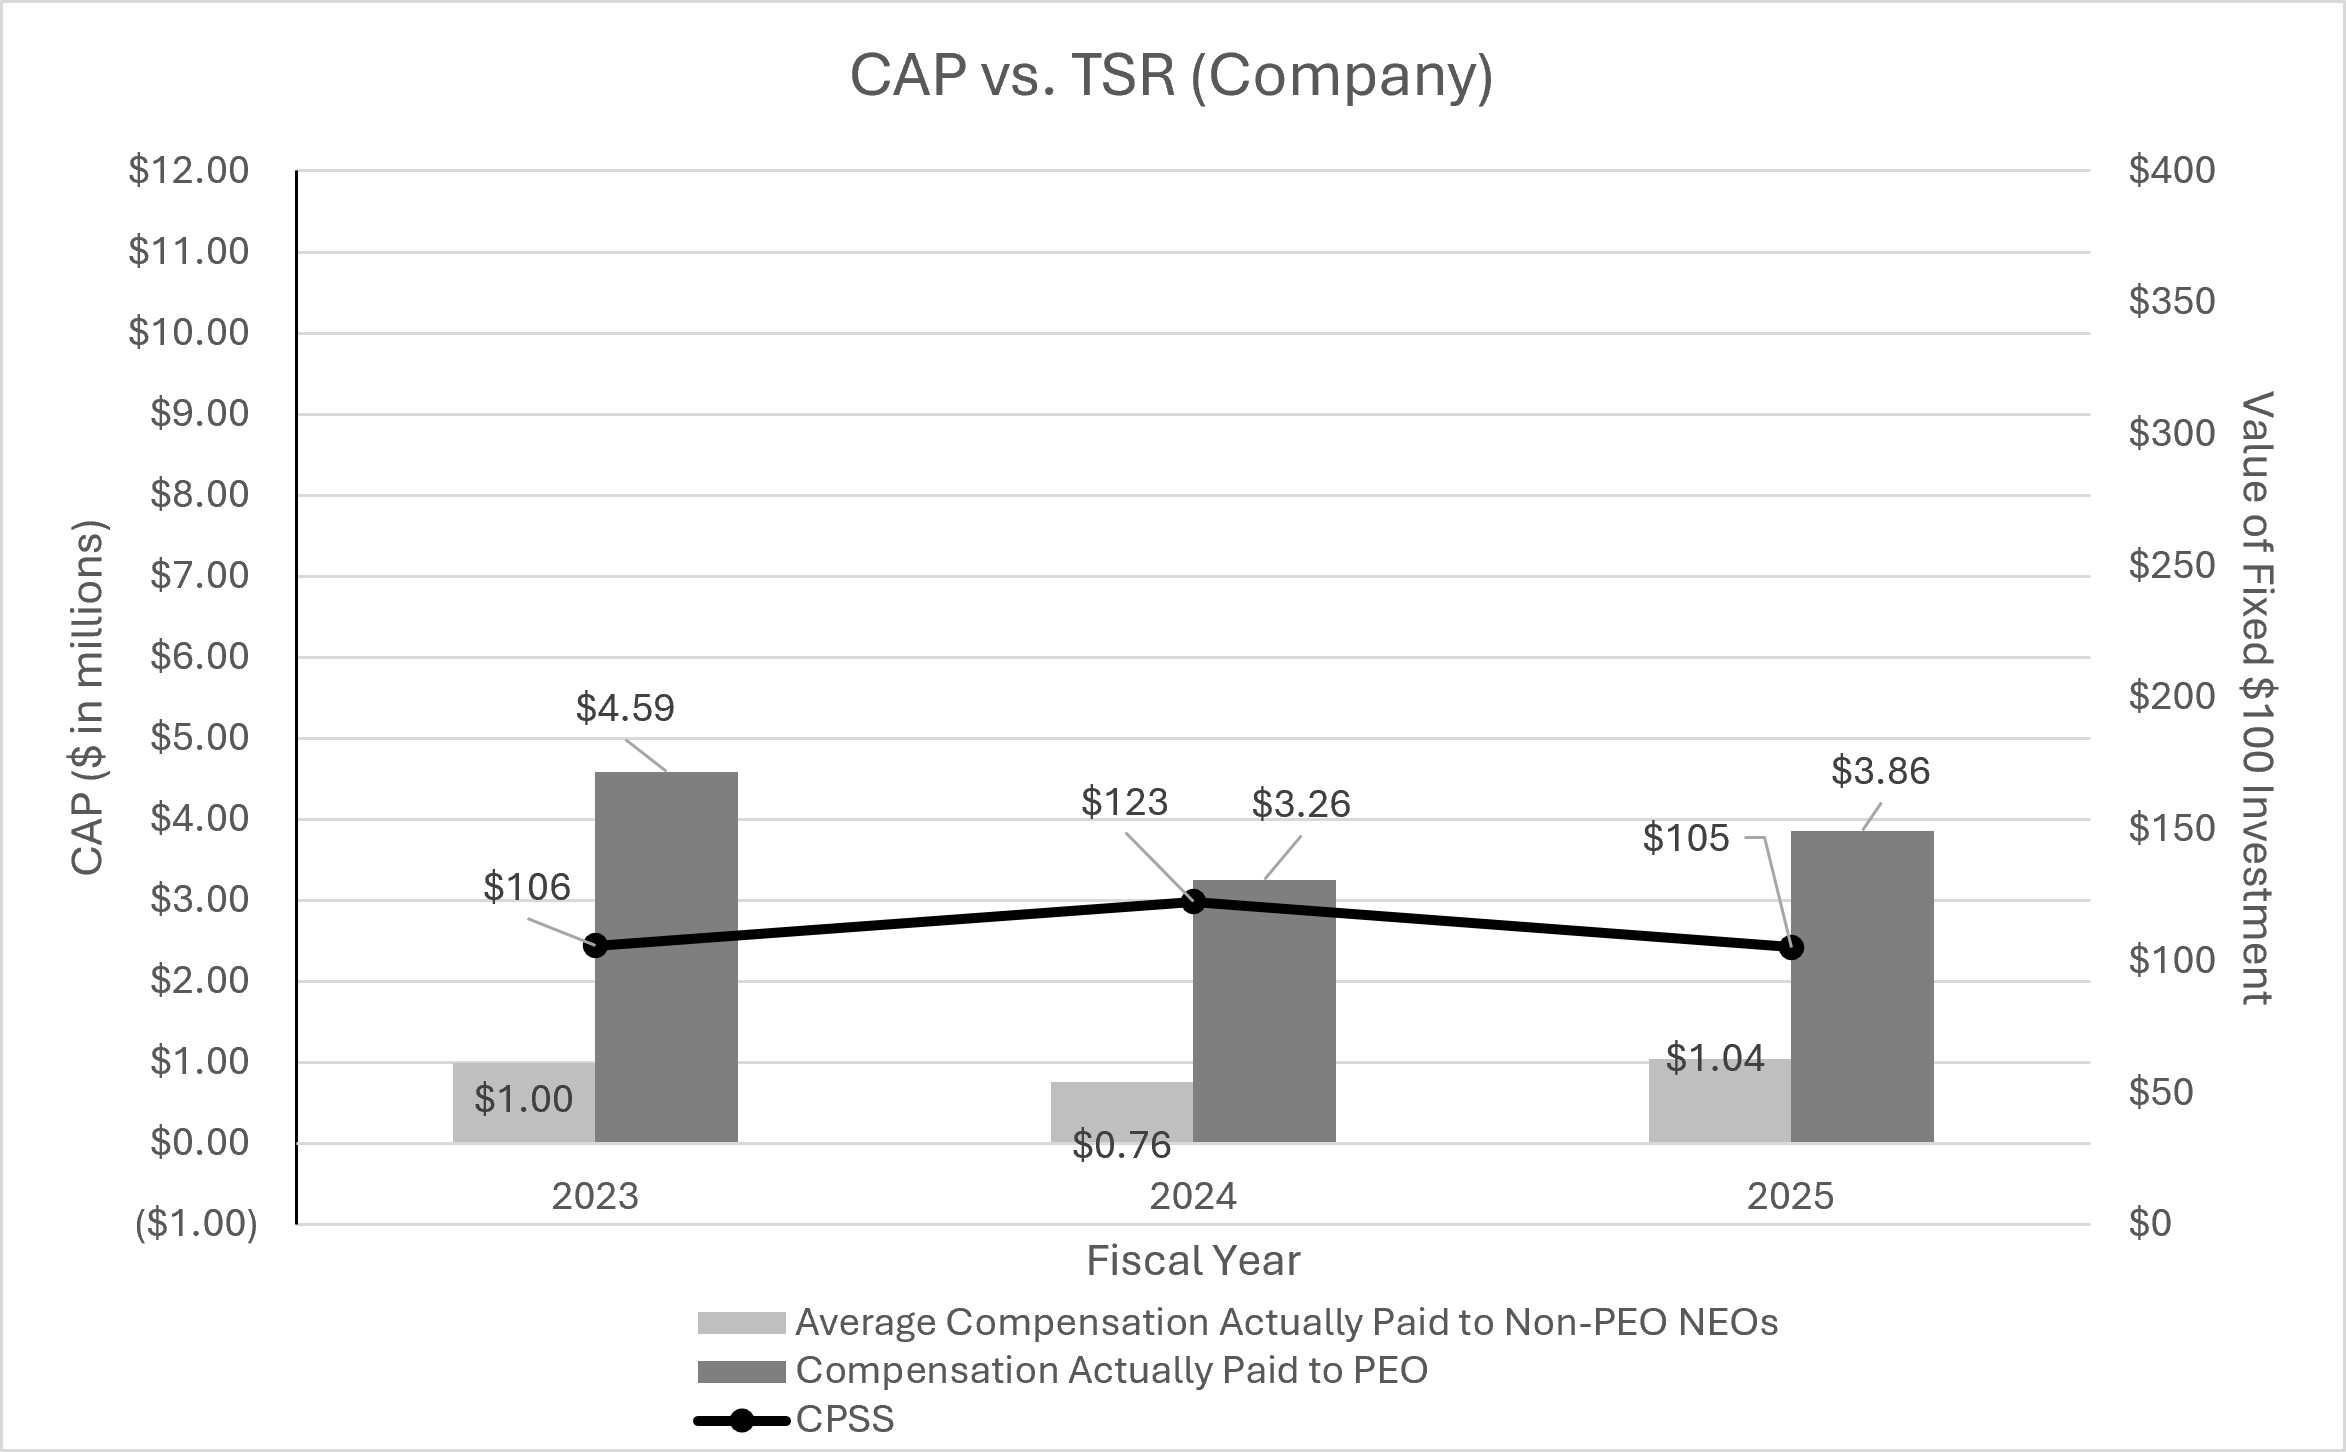
| Relationship Between Compensation Actually Paid and Cumulative Total Shareholder Return |
Relationship Between Compensation Actually Paid and Cumulative
Total Shareholder Return
The graph below shows the relationship between (i) the CAP to our PEO and
the average CAP to the non-PEO NEOs, and (ii) the Company’s total shareholder returns across the last three completed fiscal years.
|
|
|
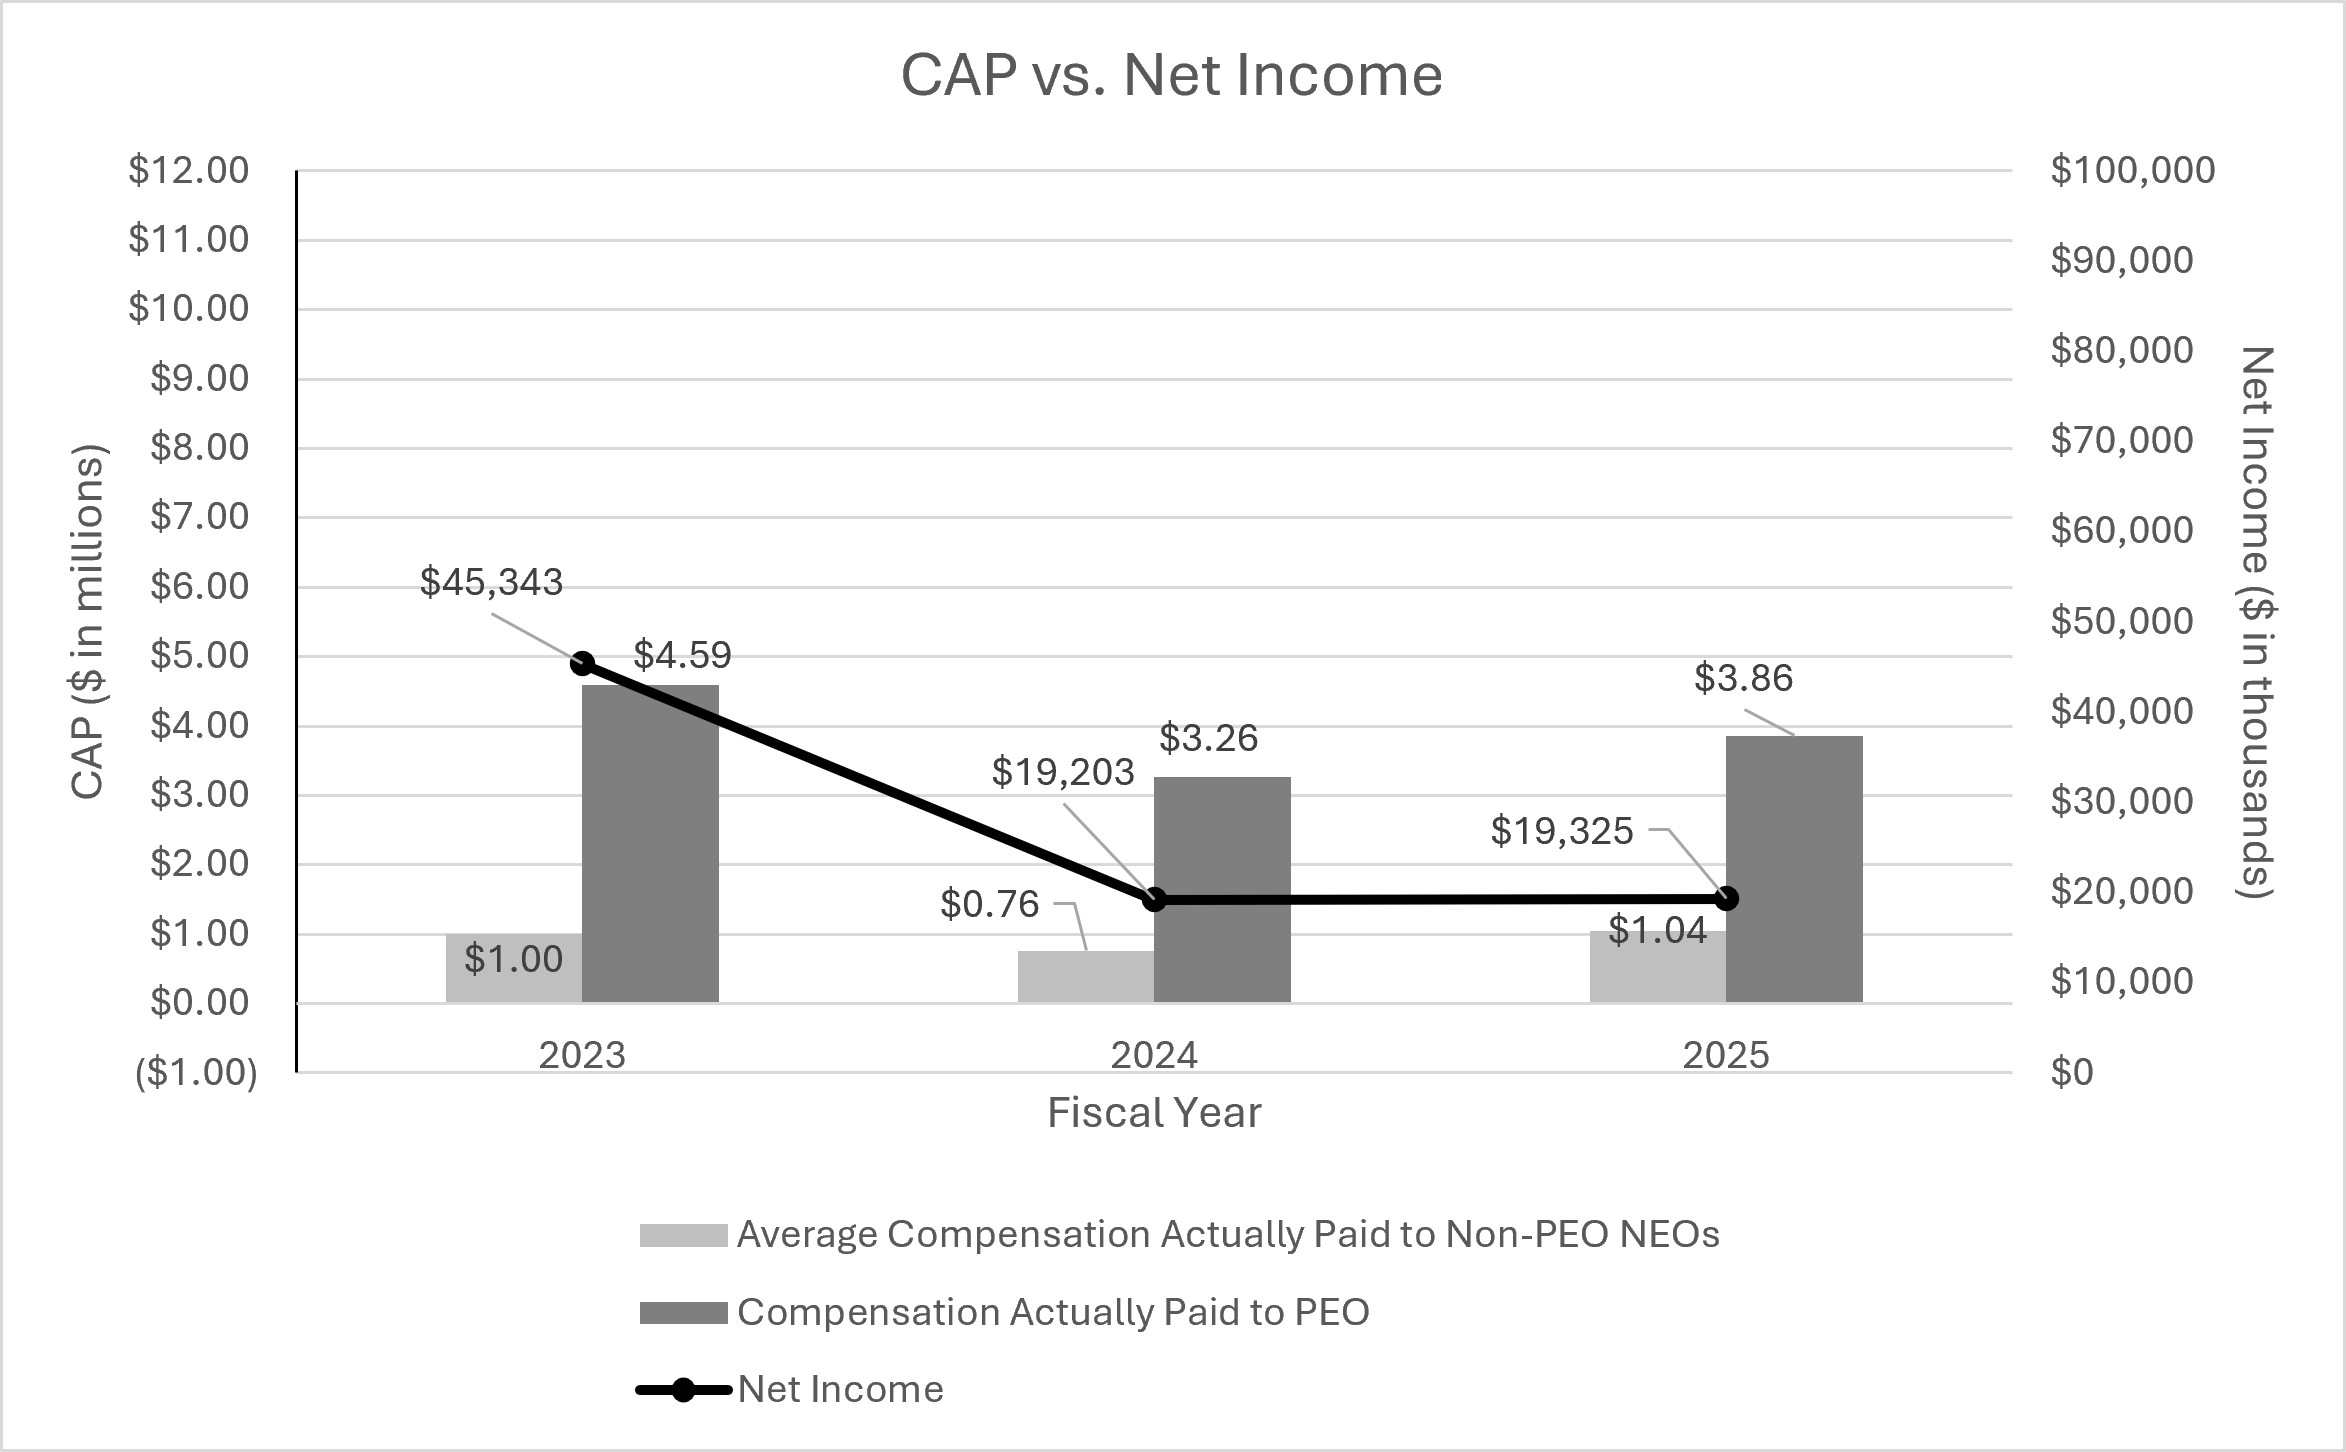
| Relationship Between Compensation Actually Paid and Net Income |
Relationship Between Compensation Actually Paid and Net Income
The graph below shows the relationship between (i) the CAP to our PEO and
the average CAP to the non-PEO NEOs, and (ii) the Company’s net income during the last three completed fiscal years.
|
|
|
| Total Shareholder Return Amount |
$ 105.42
|
122.71
|
105.88
|
| Net Income |
$ 19,325,000
|
$ 19,203,000
|
$ 45,343,000
|
| PEO Name |
Mr. Bradley
|
Mr. Bradley
|
Mr. Bradley
|
| PEO [Member] | Deduct Amounts Reported under the “Option Awards” in the SCT [Member] |
|
|
|
| Pay vs Performance Disclosure [Table] |
|
|
|
| Adjustment to Compensation Amount |
$ (1,139,790)
|
$ 0
|
$ 0
|
| PEO [Member] | Add the fair value as of the end of the covered fiscal year of all awards granted during the covered fiscal year that are outstanding and unvested as of the end of the covered fiscal year [Member] |
|
|
|
| Pay vs Performance Disclosure [Table] |
|
|
|
| Adjustment to Compensation Amount |
569,100
|
0
|
0
|
| PEO [Member] | Add the amount equal to the change as of the end of the covered fiscal year (from the end of the prior fiscal year) in fair value (whether positive or negative) of any awards granted in any prior fiscal year that are outstanding and unvested as of the end of the covered fiscal year [Member] |
|
|
|
| Pay vs Performance Disclosure [Table] |
|
|
|
| Adjustment to Compensation Amount |
(444,300)
|
(235,800)
|
(187,830)
|
| PEO [Member] | Add, for awards that are granted and vest in the same year, the fair value as of the vesting date [Member] |
|
|
|
| Pay vs Performance Disclosure [Table] |
|
|
|
| Adjustment to Compensation Amount |
0
|
0
|
0
|
| PEO [Member] | Add the amount equal to the change as of the vesting date (from the end of the prior fiscal year) in fair value (whether positive or negative) of any awards granted in any prior fiscal year for which all applicable vesting conditions were satisfied at the end of or during the covered fiscal year [Member] |
|
|
|
| Pay vs Performance Disclosure [Table] |
|
|
|
| Adjustment to Compensation Amount |
(564,263)
|
(671,160)
|
774,180
|
| PEO [Member] | Subtract, for any awards granted in any prior fiscal year that fail to meet the applicable vesting conditions during the covered fiscal year, the amount equal to the fair value at the end of the prior fiscal year [Member] |
|
|
|
| Pay vs Performance Disclosure [Table] |
|
|
|
| Adjustment to Compensation Amount |
0
|
0
|
0
|
| Non-PEO NEO [Member] | Deduct Amounts Reported under the “Option Awards” in the SCT [Member] |
|
|
|
| Pay vs Performance Disclosure [Table] |
|
|
|
| Adjustment to Compensation Amount |
(398,927)
|
0
|
0
|
| Non-PEO NEO [Member] | Add the fair value as of the end of the covered fiscal year of all awards granted during the covered fiscal year that are outstanding and unvested as of the end of the covered fiscal year [Member] |
|
|
|
| Pay vs Performance Disclosure [Table] |
|
|
|
| Adjustment to Compensation Amount |
199,185
|
0
|
0
|
| Non-PEO NEO [Member] | Add the amount equal to the change as of the end of the covered fiscal year (from the end of the prior fiscal year) in fair value (whether positive or negative) of any awards granted in any prior fiscal year that are outstanding and unvested as of the end of the covered fiscal year [Member] |
|
|
|
| Pay vs Performance Disclosure [Table] |
|
|
|
| Adjustment to Compensation Amount |
(28,388)
|
(7,695)
|
10,655
|
| Non-PEO NEO [Member] | Add, for awards that are granted and vest in the same year, the fair value as of the vesting date [Member] |
|
|
|
| Pay vs Performance Disclosure [Table] |
|
|
|
| Adjustment to Compensation Amount |
0
|
0
|
0
|
| Non-PEO NEO [Member] | Add the amount equal to the change as of the vesting date (from the end of the prior fiscal year) in fair value (whether positive or negative) of any awards granted in any prior fiscal year for which all applicable vesting conditions were satisfied at the end of or during the covered fiscal year [Member] |
|
|
|
| Pay vs Performance Disclosure [Table] |
|
|
|
| Adjustment to Compensation Amount |
(52,331)
|
(73,069)
|
151,679
|
| Non-PEO NEO [Member] | Subtract, for any awards granted in any prior fiscal year that fail to meet the applicable vesting conditions during the covered fiscal year, the amount equal to the fair value at the end of the prior fiscal year [Member] |
|
|
|
| Pay vs Performance Disclosure [Table] |
|
|
|
| Adjustment to Compensation Amount |
$ 0
|
$ 0
|
$ 0
|