Shareholder Report
Jul. 31, 2026
USD ($)
Holding
What were the fund costs for the last year? (based on a hypothetical $10,000 investment)
Share class | Costs of a $10,000 investment | Costs paid as a percentage of a $10,000 investment |
| Class A | $ 56 | 0.55 % |
Management's discussion of fund performance
The fund’s Class A shares gained 5.30% for the year ended July 31, 2026. That result compares with a 5.27% gain for the Bloomberg Municipal Bond Index. For information on returns for additional periods, including the fund lifetime, please refer to capitalgroup.com/mutual-fund-returns-A.
What factors influenced results
During the fund's fiscal year, municipal bonds posted positive returns. The U.S. economy remained resilient, though signs of labor market softening led the U.S. Federal Reserve to implement three 25-basis-point rate cuts. Interest rate volatility drove returns while credit spreads remained range bound. The municipal yield curve remained steep, as demand for shorter maturities was consistently strong.
The yield curve positioning was additive to results in comparison to the benchmark (the Bloomberg Municipal Bond Index). The portfolio was overweight the long end of the yield curve and took advantage of the steep curve. Security selection in general obligation and the special tax sectors were both positive contributors to relative return.
In contrast, duration was a small detractor from relative returns. Security selection in the transportation sector also detracted.
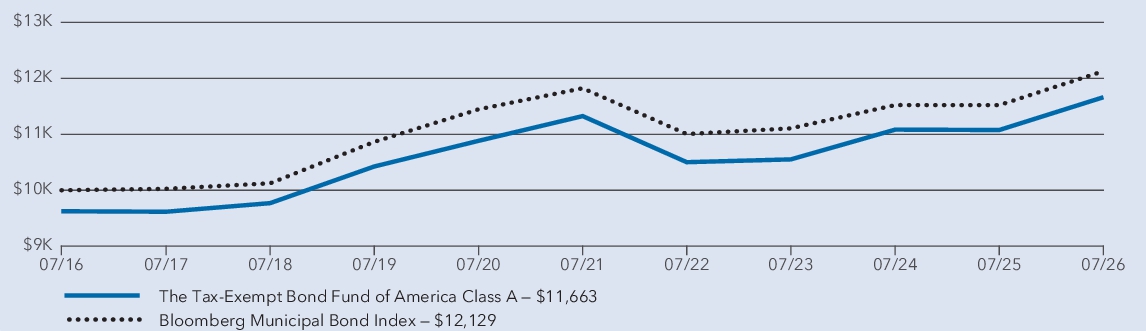
Average annual total returns
1 year | 5 years | 10 years | |
| The Tax-Exempt Bond Fund of America — Class A (with sales charge) * | 1.35 % | (0.18 ) % | 1.55 % |
| The Tax-Exempt Bond Fund of America — Class A (without sales charge) * | 5.30 % | 0.59 % | 1.94 % |
| Bloomberg Municipal Bond Index † | 5.27 % | 0.51 % | 1.95 % |
*
Investment results assume all distributions are reinvested and reflect applicable fees and expenses. When applicable, results reflect fee waivers and/or expense reimbursements, without which they would have been lower.†
Results assume all distributions are reinvested. Any market index shown is unmanaged, and therefore, has no expenses. Investors cannot invest directly in an index. Source(s): Bloomberg Index Services Ltd.Key fund statistics
| Fund net assets (in millions) | $ 24,497 |
| Total number of portfolio holdings | 5,425 |
| Total advisory fees paid (in millions) | $ 53 |
| Portfolio turnover rate | 24 % |
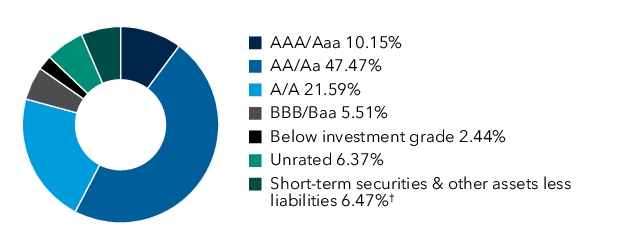
Portfolio quality summary * (percent of net assets)
*
Bond ratings, which typically range from AAA/Aaa (highest) to D (lowest), are assigned by credit rating agencies such as Standard & Poor’s, Moody’s and/or Fitch as an indication of an issuer’s creditworthiness. In assigning a credit rating to a security, the fund looks specifically to the ratings assigned to the issuer of the security by Standard & Poor’s, Moody’s and/or Fitch. If agency ratings differ, the security will be considered to have received the highest of those ratings, consistent with the fund’s investment policies. Securities in the “unrated“ category (above) have not been rated by a rating agency; however, the investment adviser performs its own credit analysis and assigns comparable ratings that are used for compliance with the fund’s investment policies.†
Includes derivatives.Material fund changes
This is a summary of certain changes to the fund since August 1, 2025. For more complete information, you may review the fund’s next prospectus, which we expect to be available by October 1, 2026 at capitalgroup.com/mutual-fund-literature-A or upon request at (800) 421-4225.
On November 25, 2025, shareholders of the fund approved an amendment to the investment advisory and service agreement to remove the income component and revise the advisory fee schedule, effective March 1, 2026.
What were the fund costs for the last year? (based on a hypothetical $10,000 investment)
Share class | Costs of a $10,000 investment | Costs paid as a percentage of a $10,000 investment |
| Class C | $ 133 | 1.30 % |
Management's discussion of fund performance
The fund’s Class C shares gained 4.51% for the year ended July 31, 2026. That result compares with a 5.27% gain for the Bloomberg Municipal Bond Index. For information on returns for additional periods, including the fund lifetime, please refer to capitalgroup.com/mutual-fund-returns-C.
What factors influenced results
During the fund's fiscal year, municipal bonds posted positive returns. The U.S. economy remained resilient, though signs of labor market softening led the U.S. Federal Reserve to implement three 25-basis-point rate cuts. Interest rate volatility drove returns while credit spreads remained range bound. The municipal yield curve remained steep, as demand for shorter maturities was consistently strong.
The yield curve
positioning
was additive to results in comparison to the benchmark (the Bloomberg Municipal Bond Index). The portfolio was overweight the long end of the yield curve and took advantage of the steep curve. Security selection in general obligation and the special tax sectors were both positive contributors to relative return.In contrast, duration was a small
detractor
from relative returns. Security selection in the transportation sector also detracted.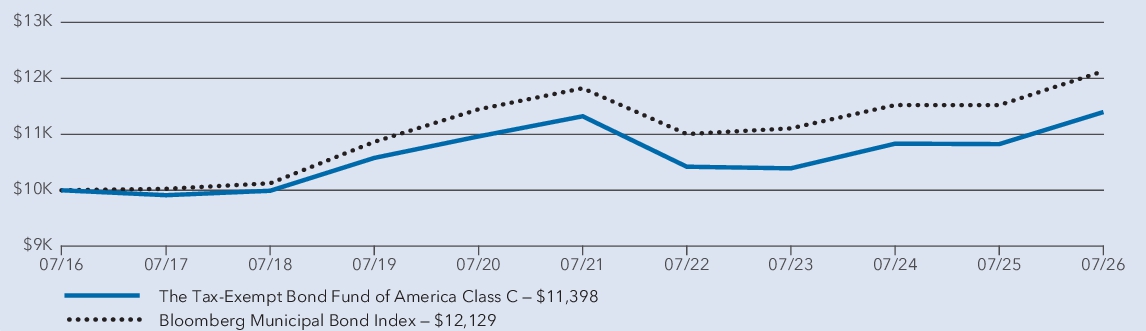
Average annual total returns
1 year | 5 years | 10 years | |
| The Tax-Exempt Bond Fund of America — Class C (with sales charge) * | 3.51 % | (0.17 ) % | 1.32 % |
| The Tax-Exempt Bond Fund of America — Class C (without sales charge) * | 4.51 % | (0.17 ) % | 1.32 % |
| Bloomberg Municipal Bond Index † | 5.27 % | 0.51 % | 1.95 % |
*
Investment results assume
all distributions are reinvested and reflect applicable fees and expenses. When applicable, results reflect fee waivers and/or expense reimbursements, without which they would have been lower.†
Results assume all distributions are reinvested. Any market index shown is unmanaged, and therefore, has no expenses. Investors cannot invest
directly in an index. Source(s): Bloomberg Index Services Ltd.Key fund statistics
| Fund net assets (in millions) | $ 24,497 |
| Total number of portfolio holdings | 5,425 |
| Total advisory fees paid (in millions) | $ 53 |
| Portfolio turnover rate | 24 % |
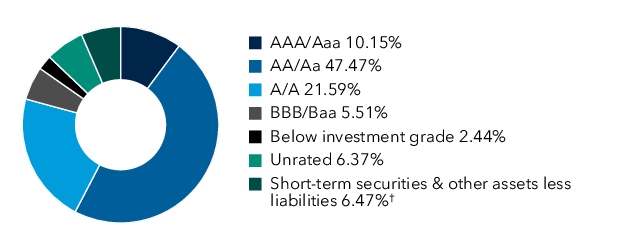
Portfolio quality summary * (percent of net assets)
*
Bond ratings, which typically range from AAA/Aaa (highest) to D (lowest), are assigned by
credit rating agencies such as Standard & Poor’s, Moody’s and/or Fitch as an indication of an issuer’s
creditworthiness. In assigning a credit rating to a security, the fund looks specifically to the ratings assigned to the issuer of the security by Standard & Poor’s, Moody’s and/or Fitch. If agency ratings differ, the security will be considered to have received the highest of those ratings, consistent with the fund’s investment policies. Securities in the “unrated“ category (above) have not been rated by a rating agency; however, the investment adviser performs its own credit analysis and assigns comparable ratings that are used for compliance with the fund’s investment policies.†
Includes derivatives.Material fund changes
This is a summary of certain changes to the fund since August 1, 2025. For more complete information, you may review the fund’s next prospectus, which we expect to be available by October 1, 2026 at capitalgroup.com/mutual-fund-literature-C or upon request at (800) 421-4225.
What were the fund costs for the last year? (based on a hypothetical $10,000 investment)
| Share class | Costs of a $10,000 investment | Costs paid as a percentage of a $10,000 investment |
| Class F-1 | $65 | 0.63% |
Management's discussion of fund performance
The fund’s Class F-1 shares gained 5.21% for the year ended July 31, 2026. That result compares with a 5.27% gain for the Bloomberg Municipal Bond Index. For information on returns for additional periods, including the fund lifetime, please refer to capitalgroup.com/mutual-fund-returns-F1.
What factors influenced results
During the fund's fiscal year, municipal bonds posted positive returns. The U.S. economy remained resilient, though signs of labor market softening led the U.S. Federal Reserve to implement three 25-basis-point rate cuts. Interest rate volatility drove returns while credit spreads remained range bound. The municipal yield curve remained steep, as demand for shorter maturities was consistently strong.
The yield curve positioning was additive to results in comparison to the benchmark (the Bloomberg Municipal Bond Index). The portfolio was overweight the long end of the yield curve and took advantage of the steep curve. Security selection in general obligation and the special tax sectors were both positive contributors to relative return.
In contrast, duration was a small detractor from relative returns. Security selection in the transportation sector also detracted.
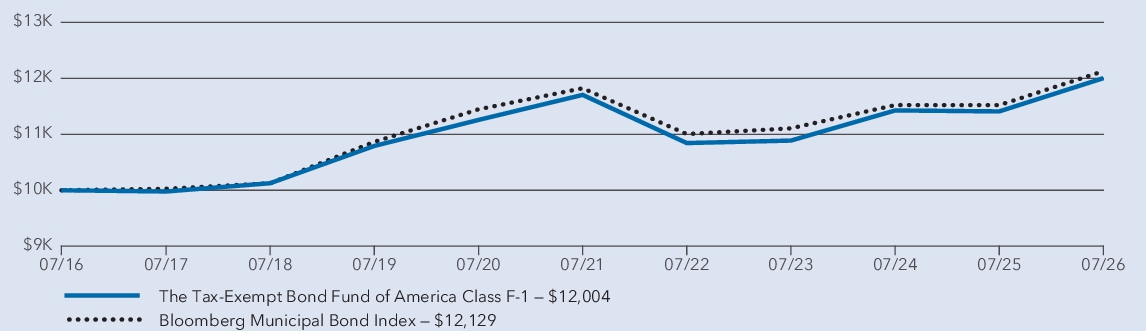
Average annual total returns
1 year | 5 years | 10 years | |
| The Tax-Exempt Bond Fund of America — Class F-1 * | 5.21 % | 0.51 % | 1.84 % |
| Bloomberg Municipal Bond Index † | 5.27 % | 0.51 % | 1.95 % |
*
Investment results assume all distributions are reinvested and reflect applicable fees and expenses. When applicable, results reflect fee waivers and/or expense reimbursements, without which they would have been lower.†
Results assume all distributions are reinvested. Any market index shown is unmanaged, and therefore, has no expenses. Investors cannot invest directly in an index. Source(s): Bloomberg Index Services Ltd.Key fund statistics
| Fund net assets (in millions) | $ 24,497 |
| Total number of portfolio holdings | 5,425 |
| Total advisory fees paid (in millions) | $ 53 |
| Portfolio turnover rate | 24 % |
Portfolio quality summary * (percent of net assets)
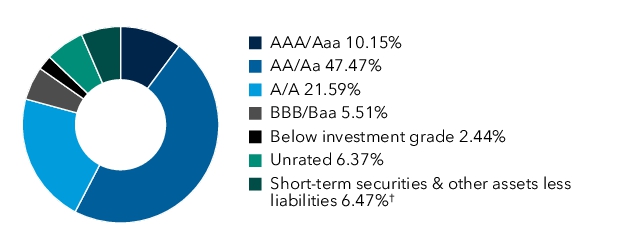
* Bond ratings, which typically range from AAA/Aaa (highest) to D (lowest), are assigned by credit rating agencies such as Standard & Poor’s, Moody’s and/or Fitch as an indication of an issuer’s creditworthiness. In assigning a credit rating to a security, the fund looks specifically to the ratings assigned to the issuer of the security by Standard & Poor’s, Moody’s and/or Fitch. If agency ratings differ, the security will be considered to have received the highest of those ratings, consistent with the fund’s investment policies. Securities in the “unrated“ category (above) have not been rated by a rating agency; however, the investment adviser performs its own credit analysis and assigns comparable ratings that are used for compliance with the fund’s investment policies.
† Includes derivatives.
Material fund changes
This is a summary of certain changes to the fund since August 1, 2025. For more complete information, you may review the fund’s next prospectus, which we expect to be available by October 1, 2026 at capitalgroup.com/mutual-fund-literature-F1 or upon request at (800) 421-4225.
On November 25, 2025, shareholders of the fund approved an amendment to the investment advisory and service agreement to remove the income component and revise the advisory fee schedule, effective March 1, 2026.
What were the fund costs for the last year? (based on a hypothetical $10,000 investment)
Share class | Costs of a $10,000 investment | Costs paid as a percentage of a $10,000 investment |
| Class F-2 | $ 39 | 0.38 % |
Management's discussion of fund performance
The fund’s Class F-2 shares gained 5.48% for the year ended July 31, 2026. That result compares with a 5.27% gain for the Bloomberg Municipal Bond Index. For information on returns for additional periods, including the fund lifetime, please refer to capitalgroup.com/mutual-fund-returns-F2.
What factors influenced results
During the fund's fiscal year, municipal bonds posted positive returns. The U.S. economy remained resilient, though signs of labor market softening led the U.S. Federal Reserve to implement three 25-basis-point rate cuts. Interest rate volatility drove returns while credit spreads remained range bound. The municipal yield curve remained steep, as demand for shorter maturities was consistently strong.
The yield curve positioning was additive to results in comparison to the benchmark (the Bloomberg Municipal Bond Index). The portfolio was overweight the long end of the yield curve and took advantage of the steep curve. Security selection in general obligation and the special tax sectors were both positive contributors to relative return.
In contrast, duration was a small detractor from relative returns. Security selection in the transportation sector also detracted.
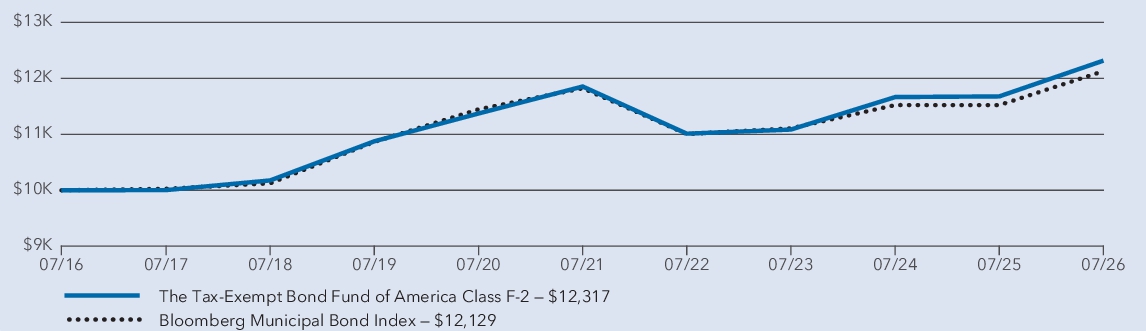
Average annual total returns
1 year | 5 years | 10 years | |
| The Tax-Exempt Bond Fund of America — Class F-2 * | 5.48 % | 0.77 % | 2.11 % |
| Bloomberg Municipal Bond Index † | 5.27 % | 0.51 % | 1.95 % |
*
Investment results assume
all distributions are reinvested and reflect applicable fees and expenses. When applicable, results reflect fee waivers and/or expense reimbursements, without which they would have been lower.†
Results assume all distributions are reinvested. Any market index shown is unmanaged, and therefore, has no expenses. Investors cannot invest directly in an index. Source(s): Bloomberg Index Services Ltd.Key fund statistics
| Fund net assets (in millions) | $ 24,497 |
| Total number of portfolio holdings | 5,425 |
| Total advisory fees paid (in millions) | $ 53 |
| Portfolio turnover rate | 24 % |
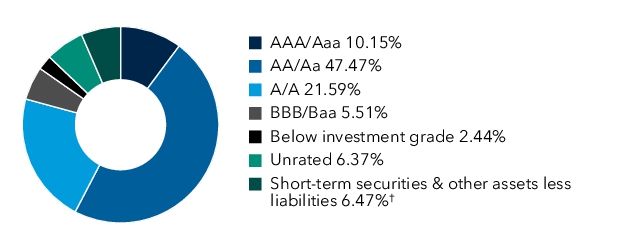
Portfolio quality summary * (percent of net assets)
*
Bond ratings, which typically range from AAA/Aaa (highest) to D (lowest), are assigned by credit rating agencies such as Standard & Poor’s, Moody’s and/or Fitch as an indication of an issuer’s creditworthiness. In assigning a credit rating to a security, the fund looks specifically to the ratings assigned to the issuer of the security by Standard & Poor’s, Moody’s and/or Fitch. If agency ratings differ, the security will be considered to have received the highest of those ratings, consistent with the fund’s investment policies. Securities in the “unrated“ category (above) have not been rated by a rating agency; however, the investment adviser performs its own credit analysis and assigns comparable ratings that are used for compliance with the fund’s investment policies.†
Includes derivatives.Material fund changes
This is a summary of certain changes to the fund since August 1, 2025. For more complete information, you may review the fund’s next prospectus, which we expect to be available by October 1, 2026 at capitalgroup.com/mutual-fund-literature-F2 or upon request at (800) 421-4225.
On November 25, 2025, shareholders of the fund approved an amendment to the investment advisory and service agreement to remove the income component and revise the advisory fee schedule, effective March 1, 2026.
What were the fund costs for the last year? (based on a hypothetical $10,000 investment)
| Share class | Costs of a $10,000 investment | Costs paid as a percentage of a $10,000 investment |
| Class F-3 | $28 | 0.27% |
Management's discussion of fund performance
The fund’s Class F-3 shares gained 5.59% for the year ended July 31, 2026. That result compares with a 5.27% gain for the Bloomberg Municipal Bond Index. For information on returns for additional periods, including the fund lifetime, please refer to capitalgroup.com/mutual-fund-returns-F3.
What factors influenced results
During the fund's fiscal year, municipal bonds posted positive returns. The U.S. economy remained resilient, though signs of labor market softening led the U.S. Federal Reserve to implement three 25-basis-point rate cuts. Interest rate volatility drove returns while credit spreads remained range bound. The municipal yield curve remained steep, as demand for shorter maturities was consistently strong.
The yield curve positioning was additive to results in comparison to the benchmark (the Bloomberg Municipal Bond Index). The portfolio was overweight the long end of the yield curve and took advantage of the steep curve. Security selection in general obligation and the special tax sectors were both positive contributors to relative return.
In contrast, duration was a small detractor from relative returns. Security selection in the transportation sector also detracted.
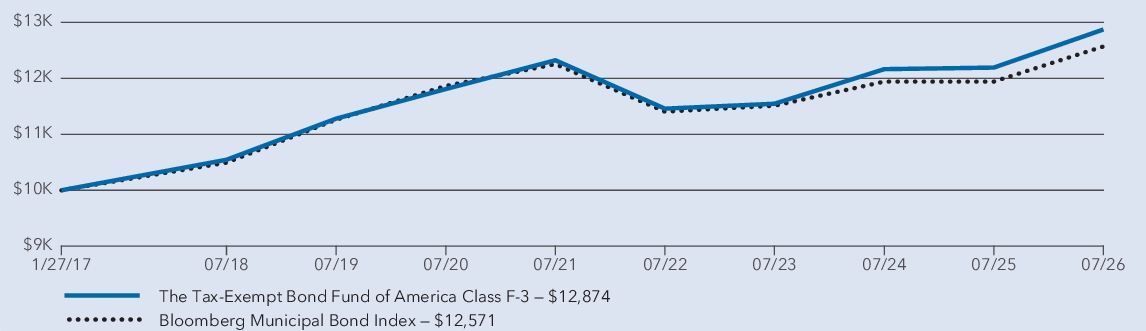
Average annual total returns
1 year | 5 years | Since inception 1 | |
| The Tax-Exempt Bond Fund of America — Class F-3 2 | 5.59 % | 0.88 % | 2.69 % |
| Bloomberg Municipal Bond Index 3 | 5.27 % | 0.51 % | 2.43 % |
1
Class F-3 shares were first offered on January 27, 2017.2
Investment results assume all distributions are reinvested and reflect applicable fees and expenses. When applicable, results reflect fee waivers and/or expense reimbursements, without which they would have been lower.3
Results assume all distributions are reinvested. Any market index shown is unmanaged, and therefore, has no expenses. Investors cannot invest directly in an index. Source(s): Bloomberg Index Services Ltd.Key fund statistics
| Fund net assets (in millions) | $ 24,497 |
| Total number of portfolio holdings | 5,425 |
| Total advisory fees paid (in millions) | $ 53 |
| Portfolio turnover rate | 24 % |
Portfolio quality summary * (percent of net assets)
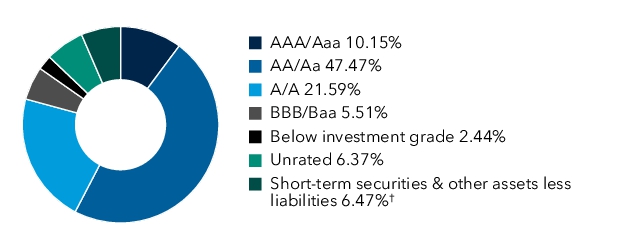
* Bond ratings, which typically range from AAA/Aaa (highest) to D (lowest), are assigned by credit rating agencies such as Standard & Poor’s, Moody’s and/or Fitch as an indication of an issuer’s creditworthiness. In assigning a credit rating to a security, the fund looks specifically to the ratings assigned to the issuer of the security by Standard & Poor’s, Moody’s and/or Fitch. If agency ratings differ, the security will be considered to have received the highest of those ratings, consistent with the fund’s investment policies. Securities in the “unrated“ category (above) have not been rated by a rating agency; however, the investment adviser performs its own credit analysis and assigns comparable ratings that are used for compliance with the fund’s investment policies.
† Includes derivatives.
Material fund changes
This is a summary of certain changes to the fund since August 1, 2025. For more complete information, you may review the fund’s next prospectus, which we expect to be available by October 1, 2026 at capitalgroup.com/mutual-fund-literature-F3 or upon request at (800) 421-4225.
On November 25, 2025, shareholders of the fund approved an amendment to the investment advisory and service agreement to remove the income component and revise the advisory fee schedule, effective March 1, 2026.
What were the fund costs for the last year? (based on a hypothetical $10,000 investment)
Share class | Costs of a $10,000 investment | Costs paid as a percentage of a $10,000 investment |
| Class R-6 | $ 28 | 0.27 % |
Management's discussion of fund performance
The fund’s Class R-6 shares gained 5.59% for the year ended July 31, 2026. That result compares with a 5.27% gain for the Bloomberg Municipal Bond Index.
What factors influenced results
During the fund's fiscal year, municipal bonds posted positive returns. The U.S. economy remained resilient, though signs of labor market softening led the U.S. Federal Reserve to implement three 25-basis-point rate cuts. Interest rate volatility drove returns while credit spreads remained range bound. The municipal yield curve remained steep, as demand for shorter maturities was consistently strong.
The yield curve positioning was additive to results in comparison to the benchmark (the Bloomberg Municipal Bond Index). The portfolio was overweight the long end of the yield curve and took advantage of the steep curve. Security selection in general obligation and the special tax sectors were both positive contributors to relative return.
In contrast, duration was a small detractor from relative returns. Security selection in the transportation sector also detracted.
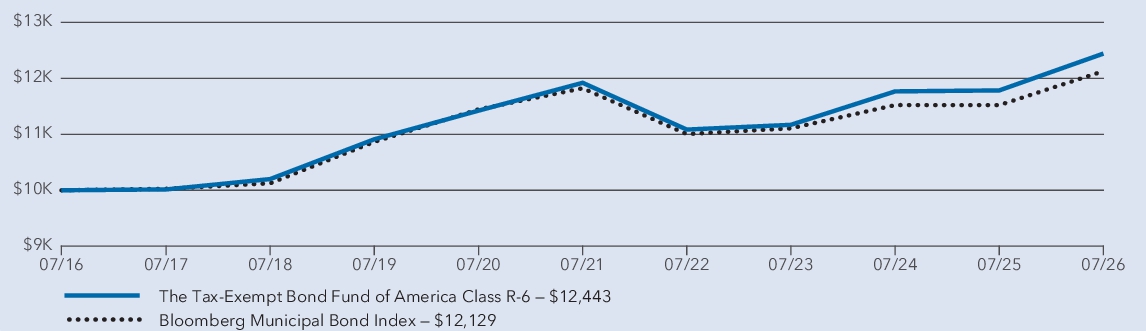
Average annual total returns
1 year | 5 years | 10 years | |
| The Tax-Exempt Bond Fund of America — Class R-6 * | 5.59 % | 0.86 % | 2.21 % |
| Bloomberg Municipal Bond Index † | 5.27 % | 0.51 % | 1.95 % |
*
Investment results assume all distributions are reinvested and reflect applicable fees and expenses. When applicable, results reflect fee waivers and/or expense reimbursements, without which they would have been lower.†
Results assume all distributions are reinvested. Any market index shown is unmanaged, and therefore, has no expenses. Investors cannot invest directly in an index. Source(s): Bloomberg Index Services Ltd.Key fund statistics
| Fund net assets (in millions) | $ 24,497 |
| Total number of portfolio holdings | 5,425 |
| Total advisory fees paid (in millions) | $ 53 |
| Portfolio turnover rate | 24 % |
Portfolio quality summary * (percent of net assets)
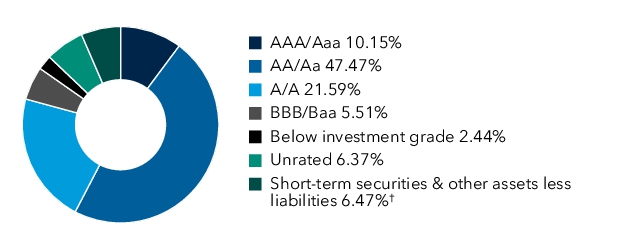
*
Bond ratings, which typically range from AAA/Aaa (highest) to D (lowest), are assigned by credit rating agencies such as Standard & Poor’s, Moody’s and/or Fitch as an indication of an issuer’s creditworthiness. In assigning a credit rating to a security, the fund looks specifically to the ratings assigned to the issuer of the security by Standard & Poor’s, Moody’s and/or Fitch. If agency ratings differ, the security will be considered to have received the highest of those ratings, consistent with the fund’s investment policies. Securities in the “unrated“ category (above) have not been rated by a rating agency; however, the investment adviser performs its own credit analysis and assigns comparable ratings that are used for compliance with the fund’s investment policies.†
Includes derivatives.Material fund changes
This is a summary of certain changes to the fund since August 1, 2025. For more complete information, you may review the fund’s next prospectus, which we expect to be available by October 1, 2026 at capitalgroup.com/mutual-fund-literature-R6 or upon request at (800) 421-4225.
On November 25, 2025, shareholders of the fund approved an amendment to the investment advisory and service agreement to remove the income component and revise the advisory fee schedule, effective March 1, 2026.