Shareholder Report
Jul. 31, 2026
USD ($)
Holding
What were the fund costs for the last year? (based on a hypothetical $10,000 investment)
| Share class | Costs of a $10,000 investment | Costs paid as a percentage of a $10,000 investment |
| Class A | $59 | 0.55% |
Management's discussion of fund performance
The fund’s Class A shares gained 15.78% for the year ended July 31, 2026. That result compares with a 13.57% gain for the 65%/35% S&P 500 Index/Bloomberg U.S. Aggregate Index. For information on returns for additional periods, including the fund lifetime, please refer to capitalgroup.com/mutual-fund-returns-A.
What factors influenced results
U.S. equities surged during the fund’s fiscal year, driven by strong corporate earnings, continued momentum around artificial intelligence and favorable monetary policy. The economy remained resilient, underpinned by healthy consumer spending. While the Federal Reserve cut interest rates in late 2025, it held steady through July 2026 as economic activity remained strong. Fixed income markets also delivered solid returns, aided by tight credit spreads. However, long-term Treasury yields moved higher as oil prices rose amid Middle East tensions, renewing inflation concerns.
Within the fund, most sectors were positive contributors with financials, healthcare and information technology being particularly additive. Energy and materials were also among the strongest contributors. Geographically, companies based in the U.S., Canada and Taiwan were strong drivers of returns. The fund’s bond allocation also added value, while supporting its income objective and maintaining a measure of stability when equity markets were volatile.
In terms of detractors, communication services lagged during the period. Also, investments in companies based in Denmark, India and Finland, detracted from the broader portfolio.
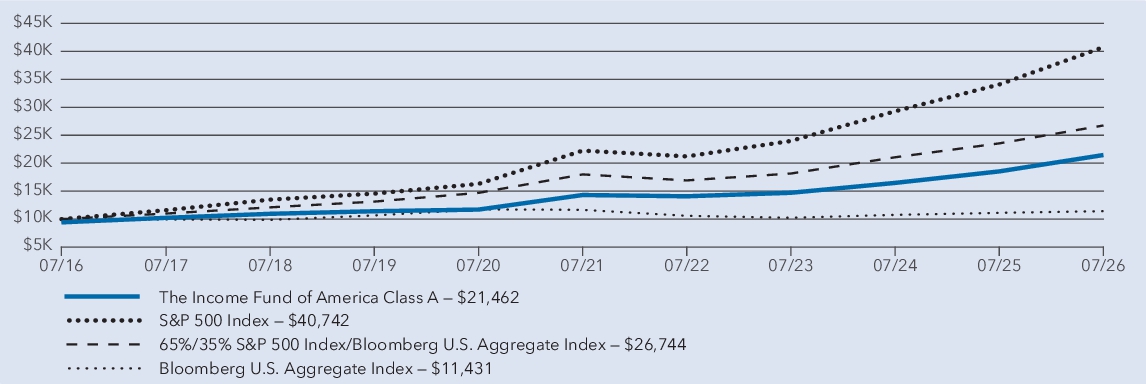
Average annual total returns
1 year | 5 years | 10 years | |
| The Income Fund of America — Class A (with sales charge) * | 9.12 % | 7.16 % | 7.94 % |
| The Income Fund of America — Class A (without sales charge) * | 15.78 % | 8.43 % | 8.58 % |
| S&P 500 Index † | 19.56 % | 12.86 % | 15.08 % |
| 65%/35% S&P 500 Index/Bloomberg U.S. Aggregate Index † | 13.57 % | 8.24 % | 10.34 % |
| Bloomberg U.S. Aggregate Index † | 2.71 % | (0.40 ) % | 1.35 % |
*
Investment results assume all distributions are reinvested and reflect applicable fees and expenses. When applicable, results reflect fee waivers and/or expense reimbursements, without which they would have been lower.†
Results assume all distributions are reinvested. Any market index shown is unmanaged, and therefore, has no expenses. Investors cannot invest directly in an index. Source(s): S&P Dow Jones Indices LLC and Bloomberg Index Services Ltd.Key fund statistics
| Fund net assets (in millions) | $ 148,232 |
| Total number of portfolio holdings | 3,341 |
| Total advisory fees paid (in millions) | $ 306 |
| Portfolio turnover rate including mortgage dollar roll transactions | 77 % |
| Portfolio turnover rate excluding mortgage dollar roll transactions | 59 % |
Portfolio holdings by asset type (percent of net assets)
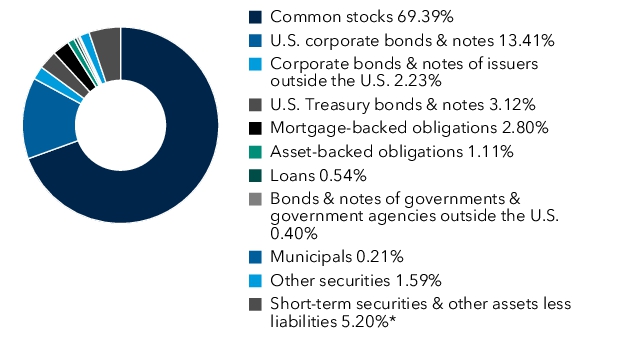
*Includes derivatives.
What were the fund costs for the last year? (based on a hypothetical $10,000 investment)
| Share class | Costs of a $10,000 investment | Costs paid as a percentage of a $10,000 investment |
| Class C | $140 | 1.30% |
Management's discussion of fund performance
The fund’s Class C shares gained 14.96% for the year ended July 31, 2026. That result compares with a 13.57% gain for the 65%/35% S&P 500 Index/Bloomberg U.S. Aggregate Index. For information on returns for additional periods, including the fund lifetime, please refer to capitalgroup.com/mutual-fund-returns-C.
What factors influenced results
U.S. equities surged during the fund’s fiscal year, driven by strong corporate earnings, continued momentum around artificial intelligence and favorable monetary policy. The economy remained resilient, underpinned by healthy consumer spending. While the Federal Reserve cut interest rates in late 2025, it held steady through July 2026 as economic activity remained strong. Fixed income markets also delivered solid returns, aided by tight credit spreads. However, long-term Treasury yields moved higher as oil prices rose amid Middle East tensions, renewing inflation concerns.
Within the fund, most sectors were positive contributors with financials, healthcare and information technology being particularly additive. Energy and materials were also among the strongest contributors. Geographically, companies based in the U.S., Canada and Taiwan were strong drivers of returns. The fund’s bond allocation also added value, while supporting its income objective and maintaining a measure of stability when equity markets were volatile.
In terms of detractors, communication services lagged during the period. Also, investments in companies based in Denmark, India and Finland, detracted from the broader portfolio.
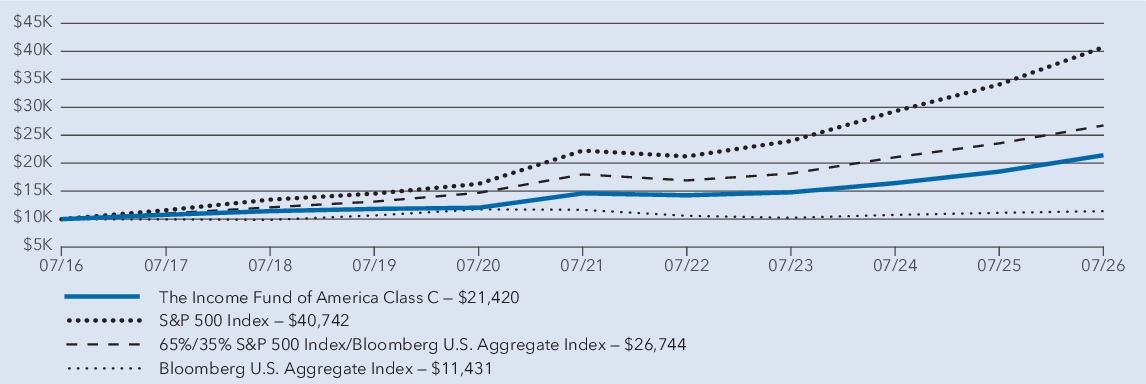
Average annual total returns
1 year | 5 years | 10 years | |
| The Income Fund of America — Class C (with sales charge) * | 13.96 % | 7.63 % | 7.92 % |
| The Income Fund of America — Class C (without sales charge) * | 14.96 % | 7.63 % | 7.92 % |
| S&P 500 Index † | 19.56 % | 12.86 % | 15.08 % |
| 65%/35% S&P 500 Index/Bloomberg U.S. Aggregate Index † | 13.57 % | 8.24 % | 10.34 % |
| Bloomberg U.S. Aggregate Index † | 2.71 % | (0.40 ) % | 1.35 % |
*
Investment results assume all distributions are reinvested and reflect applicable fees and expenses. When applicable, results reflect fee waivers and/or expense reimbursements, without which they would have been lower.†
Results assume all distributions are reinvested. Any market index shown is unmanaged, and therefore, has no expenses. Investors cannot invest directly in an index. Source(s): S&P Dow Jones Indices LLC and Bloomberg Index Services Ltd.Key fund statistics
| Fund net assets (in millions) | $ 148,232 |
| Total number of portfolio holdings | 3,341 |
| Total advisory fees paid (in millions) | $ 306 |
| Portfolio turnover rate including mortgage dollar roll transactions | 77 % |
| Portfolio turnover rate excluding mortgage dollar roll transactions | 59 % |
Portfolio holdings by asset type
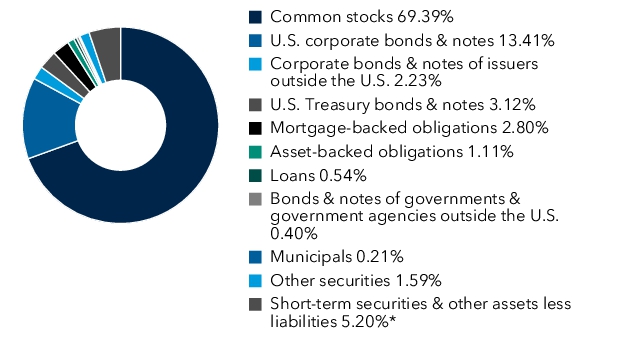
*Includes derivatives.
What were the fund costs for the last year? (based on a hypothetical $10,000 investment)
| Share class | Costs of a $10,000 investment | Costs paid as a percentage of a $10,000 investment |
| Class F-1 | $67 | 0.62% |
Management's discussion of fund performance
The fund’s Class F-1 shares gained 15.72% for the year ended July 31, 2026. That result compares with a 13.57% gain for the 65%/35% S&P 500 Index/Bloomberg U.S. Aggregate Index. For information on returns for additional periods, including the fund lifetime, please refer to capitalgroup.com/mutual-fund-returns-F1.
What factors influenced results
U.S. equities surged during the fund’s fiscal year, driven by strong corporate earnings, continued momentum around artificial intelligence and favorable monetary policy. The economy remained resilient, underpinned by healthy consumer spending. While the Federal Reserve cut interest rates in late 2025, it held steady through July 2026 as economic activity remained strong. Fixed income markets also delivered solid returns, aided by tight credit spreads. However, long-term Treasury yields moved higher as oil prices rose amid Middle East tensions, renewing inflation concerns.
Within the fund, most sectors were positive contributors with financials, healthcare and information technology being particularly additive. Energy and materials were also among the strongest contributors. Geographically, companies based in the U.S., Canada and Taiwan were strong drivers of returns. The fund’s bond allocation also added value, while supporting its income objective and maintaining a measure of stability when equity markets were volatile.
In terms of detractors, communication services lagged during the period. Also, investments in companies based in Denmark, India and Finland, detracted from the broader portfolio.
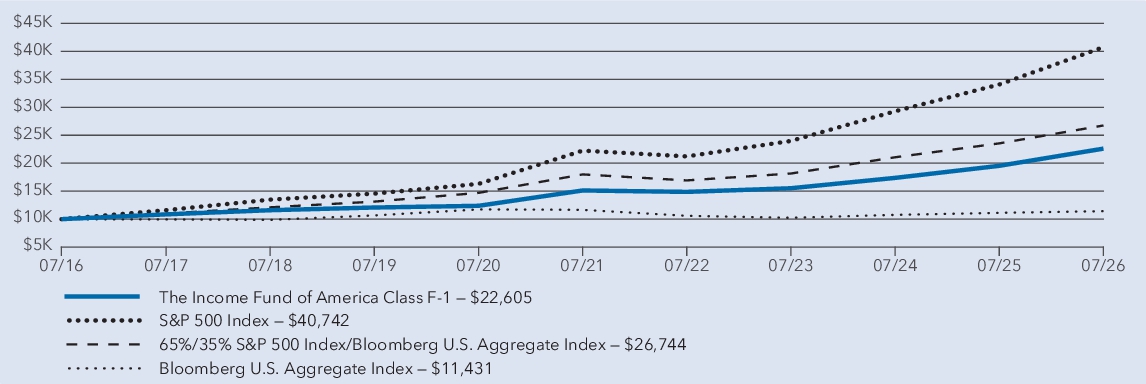
Average annual total returns
1 year | 5 years | 10 years | |
| The Income Fund of America — Class F-1 * | 15.72 % | 8.37 % | 8.50 % |
| S&P 500 Index † | 19.56 % | 12.86 % | 15.08 % |
| 65%/35% S&P 500 Index/Bloomberg U.S. Aggregate Index † | 13.57 % | 8.24 % | 10.34 % |
| Bloomberg U.S. Aggregate Index † | 2.71 % | (0.40 ) % | 1.35 % |
*
Investment results assume all distributions are reinvested and reflect applicable fees and expenses. When applicable, results reflect fee waivers and/or expense reimbursements, without which they would have been lower.†
Results assume all distributions are reinvested. Any market index shown is unmanaged, and therefore, has no expenses. Investors cannot invest directly in an index. Source(s): S&P Dow Jones Indices LLC and Bloomberg Index Services Ltd.Key fund statistics
| Fund net assets (in millions) | $ 148,232 |
| Total number of portfolio holdings | 3,341 |
| Total advisory fees paid (in millions) | $ 306 |
| Portfolio turnover rate including mortgage dollar roll transactions | 77 % |
| Portfolio turnover rate excluding mortgage dollar roll transactions | 59 % |
Portfolio holdings by asset type
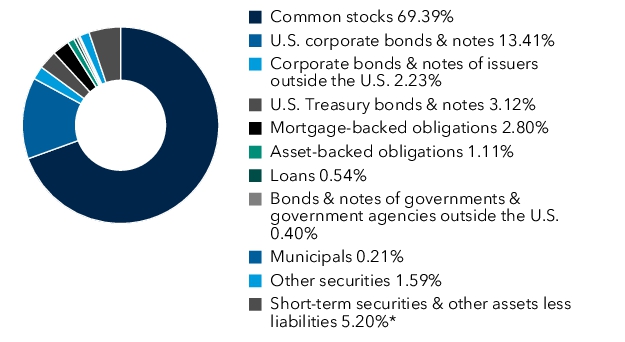
*Includes derivatives.
What were the fund costs for the last year? (based on a hypothetical $10,000 investment)
| Share class | Costs of a $10,000 investment | Costs paid as a percentage of a $10,000 investment |
| Class F-2 | $39 | 0.36% |
Management's discussion of fund performance
The fund’s Class F-2 shares gained 16.03% for the year ended July 31, 2026. That result compares with a 13.57% gain for the 65%/35% S&P 500 Index/Bloomberg U.S. Aggregate Index. For information on returns for additional periods, including the fund lifetime, please refer to capitalgroup.com/mutual-fund-returns-F2.
What factors influenced results
U.S. equities surged during the fund’s fiscal year, driven by strong corporate earnings, continued momentum around artificial intelligence and favorable monetary policy. The economy remained resilient, underpinned by healthy consumer spending. While the Federal Reserve cut interest rates in late 2025, it held steady through July 2026 as economic activity remained strong. Fixed income markets also delivered solid returns, aided by tight credit spreads. However, long-term Treasury yields moved higher as oil prices rose amid Middle East tensions, renewing inflation concerns.
Within the fund, most sectors were positive contributors with financials, healthcare and information technology being particularly additive. Energy and materials were also among the strongest contributors. Geographically, companies based in the U.S., Canada and Taiwan were strong drivers of returns. The fund’s bond allocation also added value, while supporting its income objective and maintaining a measure of stability when equity markets were volatile.
In terms of detractors, communication services lagged during the period. Also, investments in companies based in Denmark, India and Finland, detracted from the broader portfolio.
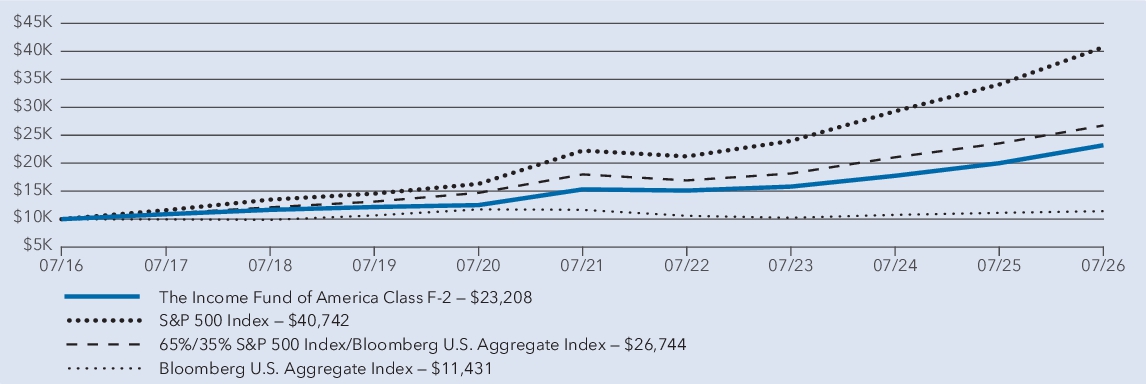
Average annual total returns
1 year | 5 years | 10 years | |
| The Income Fund of America — Class F-2 * | 16.03 % | 8.66 % | 8.78 % |
| S&P 500 Index † | 19.56 % | 12.86 % | 15.08 % |
| 65%/35% S&P 500 Index/Bloomberg U.S. Aggregate Index † | 13.57 % | 8.24 % | 10.34 % |
| Bloomberg U.S. Aggregate Index † | 2.71 % | (0.40 ) % | 1.35 % |
*
Investment results assume all distributions are reinvested and reflect applicable fees and expenses. When applicable, results reflect fee waivers and/or
expense reimbursements, without which they would have been lower.†
Results assume all distributions are reinvested. Any market index shown is unmanaged, and therefore, has no expenses. Investors cannot invest directly in an index. Source(s): S&P Dow Jones Indices LLC and Bloomberg Index Services Ltd.Key fund statistics
| Fund net assets (in millions) | $ 148,232 |
| Total number of portfolio holdings | 3,341 |
| Total advisory fees paid (in millions) | $ 306 |
| Portfolio turnover rate including mortgage dollar roll transactions | 77 % |
| Portfolio turnover rate excluding mortgage dollar roll transactions | 59 % |
Portfolio holdings by asset type
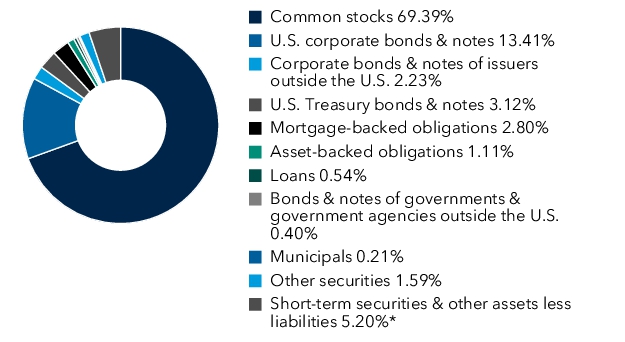
*Includes derivatives.
What were the fund costs for the last year? (based on a hypothetical $10,000 investment)
| Share class | Costs of a $10,000 investment | Costs paid as a percentage of a $10,000 investment |
| Class F-3 | $27 | 0.25% |
Management's discussion of fund performance
The fund’s Class F-3 shares gained 16.14% for the year ended July 31, 2026. That result compares with a 13.57% gain for the 65%/35% S&P 500 Index/Bloomberg U.S. Aggregate Index. For information on returns for additional periods, including the fund lifetime, please refer to capitalgroup.com/mutual-fund-returns-F3.
What factors influenced results
U.S. equities surged during the fund’s fiscal year, driven by strong corporate earnings, continued momentum around artificial intelligence and favorable monetary policy. The economy remained resilient, underpinned by healthy consumer spending. While the Federal Reserve cut interest rates in late 2025, it held steady through July 2026 as economic activity remained strong. Fixed income markets also delivered solid returns, aided by tight credit spreads. However, long-term Treasury yields moved higher as oil prices rose amid Middle East tensions, renewing inflation concerns.
Within the fund, most sectors were positive contributors with financials, healthcare and information technology being particularly additive. Energy and materials were also among the strongest contributors. Geographically, companies based in the U.S., Canada and Taiwan were strong drivers of returns. The fund’s bond allocation also added value, while supporting its income objective and maintaining a measure of stability when equity markets were volatile.
In terms of detractors, communication services lagged during the period. Also, investments in companies based in Denmark, India and Finland, detracted from the broader portfolio.
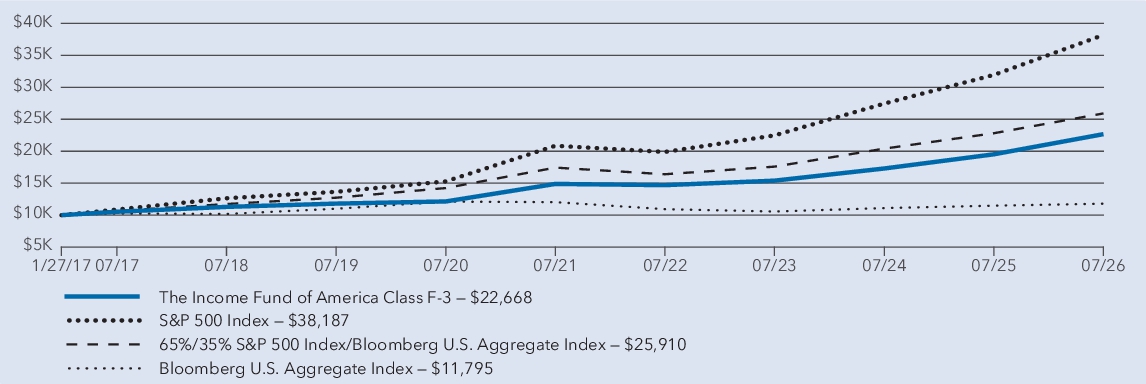
Average annual total returns
1 year | 5 years | Since inception 1 | |
| The Income Fund of America — Class F-3 2 | 16.14 % | 8.77 % | 8.98 % |
| S&P 500 Index 3 | 19.56 % | 12.86 % | 15.13 % |
| 65%/35% S&P 500 Index/Bloomberg U.S. Aggregate Index 3 | 13.57 % | 8.24 % | 10.53 % |
| Bloomberg U.S. Aggregate Index 3 | 2.71 % | (0.40 ) % | 1.75 % |
1
Class F-3 shares were first offered on January 27, 2017.2
Investment results assume all distributions are reinvested and reflect applicable fees and expenses. When applicable, results reflect fee waivers and/or expense reimbursements, without which they would have been lower.3
Results assume all distributions are reinvested. Any market index shown is unmanaged, and therefore, has no expenses. Investors cannot invest directly in an index. Source(s): S&P Dow Jones Indices LLC and Bloomberg Index Services Ltd.Key fund statistics
| Fund net assets (in millions) | $ 148,232 |
| Total number of portfolio holdings | 3,341 |
| Total advisory fees paid (in millions) | $ 306 |
| Portfolio turnover rate including mortgage dollar roll transactions | 77 % |
| Portfolio turnover rate excluding mortgage dollar roll transactions | 59 % |
Portfolio holdings by asset type (percent of net assets)
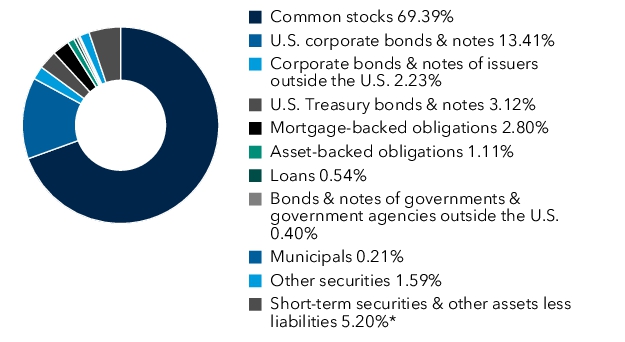
*Includes derivatives.
What were the fund costs for the last year? (based on a hypothetical $10,000 investment)
| Share class | Costs of a $10,000 investment | Costs paid as a percentage of a $10,000 investment |
| Class 529-A | $63 | 0.58% |
Management's discussion of fund performance
The fund’s Class 529-A shares gained 15.80% for the year ended July 31, 2026. That result compares with a 13.57% gain for the 65%/35% S&P 500 Index/Bloomberg U.S. Aggregate Index. For information on returns for additional periods, including the fund lifetime, please refer to capitalgroup.com/mutual-fund-returns-529A.
What factors influenced results
U.S. equities surged during the fund’s fiscal year, driven by strong corporate earnings, continued momentum around artificial intelligence and favorable monetary policy. The economy remained resilient, underpinned by healthy consumer spending. While the Federal Reserve cut interest rates in late 2025, it held steady through July 2026 as economic activity remained strong. Fixed income markets also delivered solid returns, aided by tight credit spreads. However, long-term Treasury yields moved higher as oil prices rose amid Middle East tensions, renewing inflation concerns.
Within the fund, most sectors were positive contributors with financials, healthcare and information technology being particularly additive. Energy and materials were also among the strongest contributors. Geographically, companies based in the U.S., Canada and Taiwan were strong drivers of returns. The fund’s bond allocation also added value, while supporting its income objective and maintaining a measure of stability when equity markets were volatile.
In terms of detractors, communication services lagged during the period. Also, investments in companies based in Denmark, India and Finland, detracted from the broader portfolio.
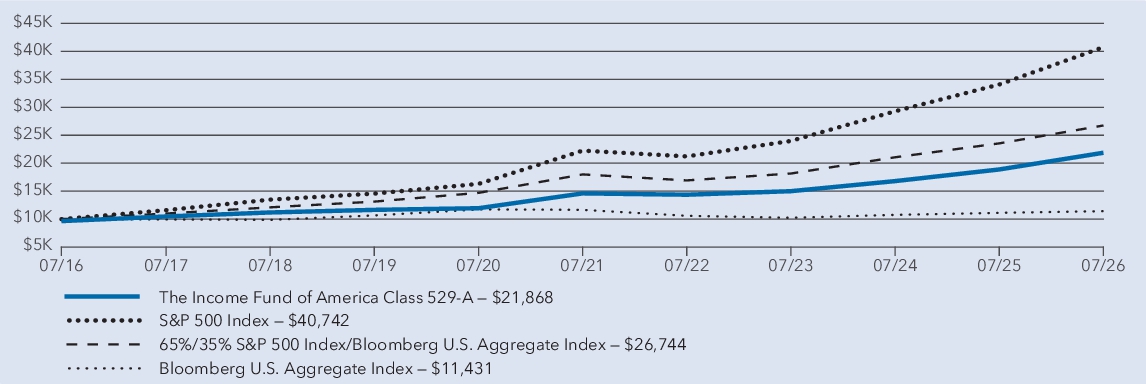
Average annual total returns
1 year | 5 years | 10 years | |
| The Income Fund of America — Class 529-A (with sales charge) * | 11.75 % | 7.64 % | 8.14 % |
| The Income Fund of America — Class 529-A (without sales charge) * | 15.80 % | 8.41 % | 8.52 % |
| S&P 500 Index † | 19.56 % | 12.86 % | 15.08 % |
| 65%/35% S&P 500 Index/Bloomberg U.S. Aggregate Index † | 13.57 % | 8.24 % | 10.34 % |
| Bloomberg U.S. Aggregate Index † | 2.71 % | (0.40 ) % | 1.35 % |
*
Investment results assume all distributions are reinvested and reflect applicable fees and expenses. When applicable, results reflect fee waivers and/or expense reimbursements, without which they would have been lower.†
Results assume all distributions are reinvested. Any market index shown is unmanaged, and therefore, has no expenses. Investors cannot invest
directly in an index. Source(s): S&P Dow Jones Indices LLC and Bloomberg Index Services Ltd.Key fund statistics
| Fund net assets (in millions) | $ 148,232 |
| Total number of portfolio holdings | 3,341 |
| Total advisory fees paid (in millions) | $ 306 |
| Portfolio turnover rate including mortgage dollar roll transactions | 77 % |
| Portfolio turnover rate excluding mortgage dollar roll transactions | 59 % |
Portfolio holdings by asset type (percent of net assets)
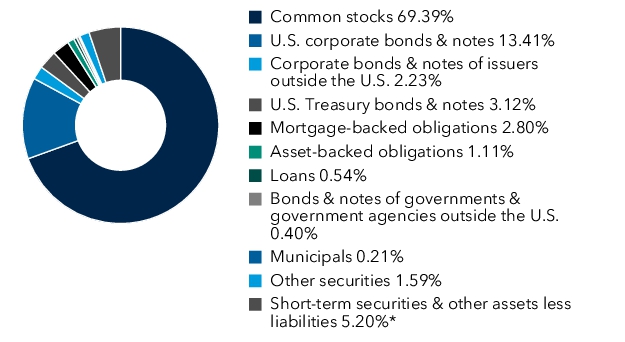
*Includes derivatives.
What were the fund costs for the last year? (based on a hypothetical $10,000 investment)
| Share class | Costs of a $10,000 investment | Costs paid as a percentage of a $10,000 investment |
| Class 529-C | $145 | 1.35% |
Management's discussion of fund performance
The fund’s Class 529-C shares gained 14.84% for the year ended July 31, 2026. That result compares with a 13.57% gain for the 65%/35% S&P 500 Index/Bloomberg U.S. Aggregate Index. For information on returns for additional periods, including the fund lifetime, please refer to capitalgroup.com/mutual-fund-returns-529C.
What factors influenced results
U.S. equities surged during the fund’s fiscal year, driven by strong corporate earnings, continued momentum around artificial intelligence and favorable monetary policy. The economy remained resilient, underpinned by healthy consumer spending. While the Federal Reserve cut interest rates in late 2025, it held steady through July 2026 as economic activity remained strong. Fixed income markets also delivered solid returns, aided by tight credit spreads. However, long-term Treasury yields moved higher as oil prices rose amid Middle East tensions, renewing inflation concerns.
Within the fund, most sectors were positive contributors with financials, healthcare and information technology being particularly additive. Energy and materials were also among the strongest contributors. Geographically, companies based in the U.S., Canada and Taiwan were strong drivers of returns. The fund’s bond allocation also added value, while supporting its income objective and maintaining a measure of stability when equity markets were volatile.
In terms of detractors, communication services lagged during the period. Also, investments in companies based in Denmark, India and Finland, detracted from the broader portfolio.
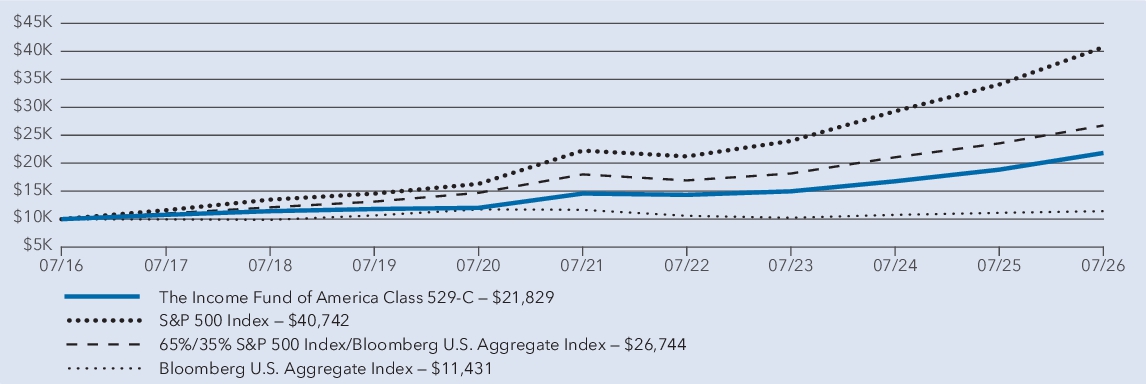
Average annual total returns
1 year | 5 years | 10 years | |
| The Income Fund of America — Class 529-C (with sales charge) * | 13.84 % | 7.58 % | 8.12 % |
| The Income Fund of America — Class 529-C (without sales charge) * | 14.84 % | 7.58 % | 8.12 % |
| S&P 500 Index † | 19.56 % | 12.86 % | 15.08 % |
| 65%/35% S&P 500 Index/Bloomberg U.S. Aggregate Index † | 13.57 % | 8.24 % | 10.34 % |
| Bloomberg U.S. Aggregate Index † | 2.71 % | (0.40 ) % | 1.35 % |
*
Investment results assume all distributions are reinvested and reflect applicable fees and expenses. When applicable, results reflect fee waivers and/or expense reimbursements, without which they would have been lower.†
Results assume all distributions are reinvested. Any market index shown is unmanaged, and therefore, has no expenses. Investors cannot invest directly in an index. Source(s): S&P Dow Jones Indices LLC and Bloomberg Index Services Ltd.Key fund statistics
| Fund net assets (in millions) | $ 148,232 |
| Total number of portfolio holdings | 3,341 |
| Total advisory fees paid (in millions) | $ 306 |
| Portfolio turnover rate including mortgage dollar roll transactions | 77 % |
| Portfolio turnover rate excluding mortgage dollar roll transactions | 59 % |
Portfolio holdings by asset type
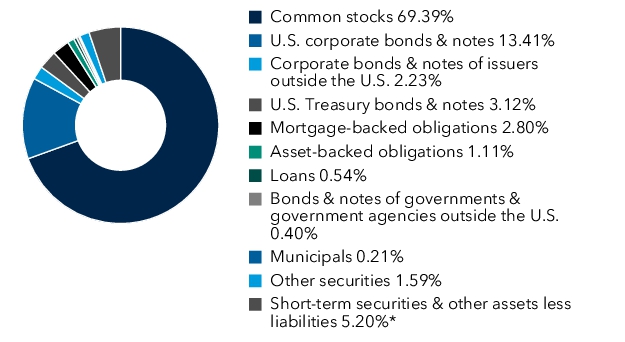
*Includes derivatives.
What were the fund costs for the last year? (based on a hypothetical $10,000 investment)
| Share class | Costs of a $10,000 investment | Costs paid as a percentage of a $10,000 investment |
| Class 529-E | $89 | 0.83% |
Management's discussion of fund performance
The fund’s Class 529-E shares gained 15.47% for the year ended July 31, 2026. That result compares with a 13.57% gain for the 65%/35% S&P 500 Index/Bloomberg U.S. Aggregate Index. For information on returns for additional periods, including the fund lifetime, please refer to capitalgroup.com/mutual-fund-returns-529E.
What factors influenced results
U.S. equities surged during the fund’s fiscal year, driven by strong corporate earnings, continued momentum around artificial intelligence and favorable monetary policy. The economy remained resilient, underpinned by healthy consumer spending. While the Federal Reserve cut interest rates in late 2025, it held steady through July 2026 as economic activity remained strong. Fixed income markets also delivered solid returns, aided by tight credit spreads. However, long-term Treasury yields moved higher as oil prices rose amid Middle East tensions, renewing inflation concerns.
Within the fund, most sectors were positive contributors with financials, healthcare and information technology being particularly additive. Energy and materials were also among the strongest contributors. Geographically, companies based in the U.S., Canada and Taiwan were strong drivers of returns. The fund’s bond allocation also added value, while supporting its income objective and maintaining a measure of stability when equity markets were volatile.
In terms of detractors, communication services lagged during the period. Also, investments in companies based in Denmark, India and Finland, detracted from the broader portfolio.
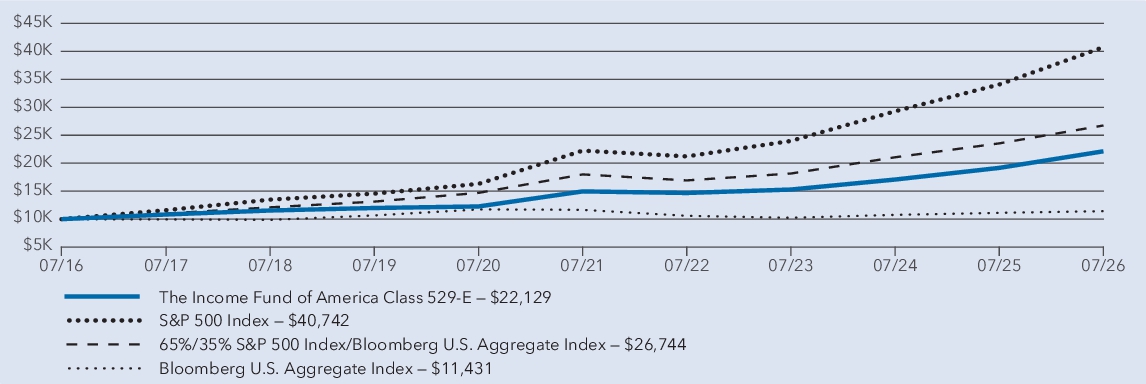
Average annual total returns
1 year | 5 years | 10 years | |
| The Income Fund of America — Class 529-E * | 15.47 % | 8.14 % | 8.27 % |
| S&P 500 Index † | 19.56 % | 12.86 % | 15.08 % |
| 65%/35% S&P 500 Index/Bloomberg U.S. Aggregate Index † | 13.57 % | 8.24 % | 10.34 % |
| Bloomberg U.S. Aggregate Index † | 2.71 % | (0.40 ) % | 1.35 % |
*
Investment results assume all distributions are reinvested and reflect applicable fees and expenses. When applicable, results reflect fee waivers and/or expense reimbursements, without which they would have been lower.†
Results assume all distributions are reinvested. Any market index shown is unmanaged, and therefore, has no expenses. Investors cannot invest directly in an index. Source(s): S&P Dow Jones Indices LLC and Bloomberg Index Services Ltd.Key fund statistics
| Fund net assets (in millions) | $ 148,232 |
| Total number of portfolio holdings | 3,341 |
| Total advisory fees paid (in millions) | $ 306 |
| Portfolio turnover rate including mortgage dollar roll transactions | 77 % |
| Portfolio turnover rate excluding mortgage dollar roll transactions | 59 % |
Portfolio holdings by asset type
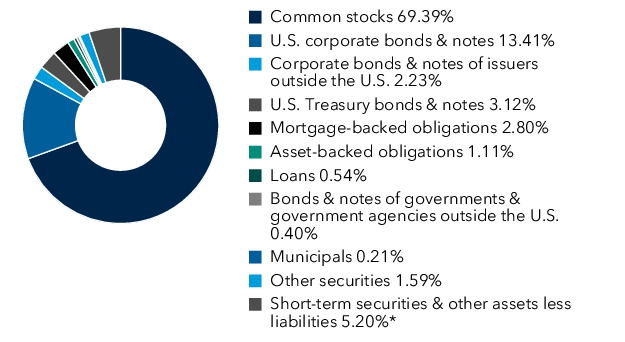
*Includes derivatives.
What were the fund costs for the last year? (based on a hypothetical $10,000 investment)
| Share class | Costs of a $10,000 investment | Costs paid as a percentage of a $10,000 investment |
| Class 529-F-2 | $37 | 0.34% |
Management's discussion of fund performance
The fund’s Class 529-F-2 shares gained 16.07% for the year ended July 31, 2026. That result compares with a 13.57% gain for the 65%/35% S&P 500 Index/Bloomberg U.S. Aggregate Index. For information on returns for additional periods, including the fund lifetime, please refer to capitalgroup.com/mutual-fund-returns-529F2.
What factors influenced results
U.S. equities surged during the fund’s fiscal year, driven by strong corporate earnings, continued momentum around artificial intelligence and favorable monetary policy. The economy remained resilient, underpinned by healthy consumer spending. While the Federal Reserve cut interest rates in late 2025, it held steady through July 2026 as economic activity remained strong. Fixed income markets also delivered solid returns, aided by tight credit spreads. However, long-term Treasury yields moved higher as oil prices rose amid Middle East tensions, renewing inflation concerns.
Within the fund, most sectors were positive contributors with financials, healthcare and information technology being particularly additive. Energy and materials were also among the strongest contributors. Geographically, companies based in the U.S., Canada and Taiwan were strong drivers of returns. The fund’s bond allocation also added value, while supporting its income objective and maintaining a measure of stability when equity markets were volatile.
In terms of detractors, communication services lagged during the period. Also, investments in companies based in Denmark, India and Finland, detracted from the broader portfolio.
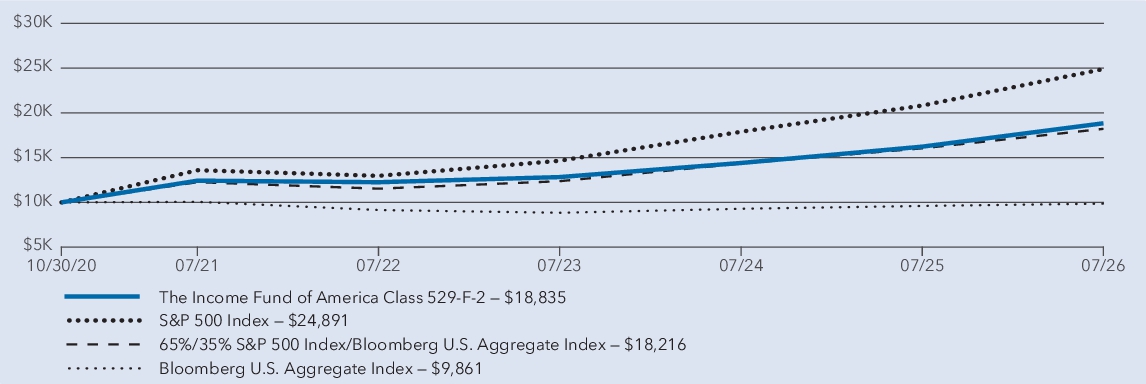
Average annual total returns
1 year | 5 years | Since inception 1 | |
| The Income Fund of America — Class 529-F-2 2 | 16.07 % | 8.68 % | 11.63 % |
| S&P 500 Index 3 | 19.56 % | 12.86 % | 17.17 % |
| 65%/35% S&P 500 Index/Bloomberg U.S. Aggregate Index 3 | 13.57 % | 8.24 % | 10.99 % |
| Bloomberg U.S. Aggregate Index 3 | 2.71 % | (0.40 ) % | (0.24 ) % |
1
Class 529-F-2 shares were first offered on October 30, 2020.2
Investment results assume all distributions are reinvested and reflect applicable fees and expenses. When applicable, results reflect fee waivers and/or expense reimbursements, without which they would have been lower.3
Results assume all distributions are reinvested. Any market index shown is unmanaged, and therefore, has no expenses. Investors cannot invest directly in an index. Source(s): S&P Dow Jones Indices LLC and Bloomberg Index Services Ltd.Key fund statistics
| Fund net assets (in millions) | $ 148,232 |
| Total number of portfolio holdings | 3,341 |
| Total advisory fees paid (in millions) | $ 306 |
| Portfolio turnover rate including mortgage dollar roll transactions | 77 % |
| Portfolio turnover rate excluding mortgage dollar roll transactions | 59 % |
Portfolio holdings by asset type (percent of net assets)
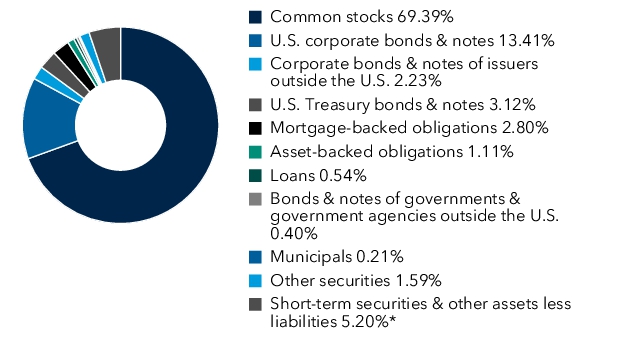
*Includes derivatives.
What were the fund costs for the last year? (based on a hypothetical $10,000 investment)
Share class | Costs of a $10,000 investment | Costs paid as a percentage of a $10,000 investment |
| Class 529-F-3 | $ 33 | 0.31 % |
Management's discussion of fund performance
The fund’s Class 529-F-3 shares gained 16.07% for the year ended July 31, 2026. That result compares with a 13.57% gain for the 65%/35% S&P 500 Index/Bloomberg U.S. Aggregate Index. For information on returns for additional periods, including the fund lifetime, please refer to capitalgroup.com/mutual-fund-returns-529F3.
What factors influenced results
U.S. equities surged during the fund’s fiscal year, driven by strong corporate earnings, continued momentum around artificial intelligence and favorable monetary policy. The economy remained resilient, underpinned by healthy consumer spending. While the Federal Reserve cut interest rates in late 2025, it held steady through July 2026 as economic activity remained strong. Fixed income markets also delivered solid returns, aided by tight credit spreads. However, long-term Treasury yields moved higher as oil prices rose amid Middle East tensions, renewing inflation concerns.
Within the fund, most sectors were positive contributors with financials, healthcare and information technology being particularly additive. Energy and materials were also among the strongest contributors. Geographically, companies based in the U.S., Canada and Taiwan were strong drivers of returns. The fund’s bond allocation also added value, while supporting its income objective and maintaining a measure of stability when equity markets were volatile.
In terms of detractors, communication services lagged during the period. Also, investments in companies based in Denmark, India and Finland, detracted from the broader portfolio.
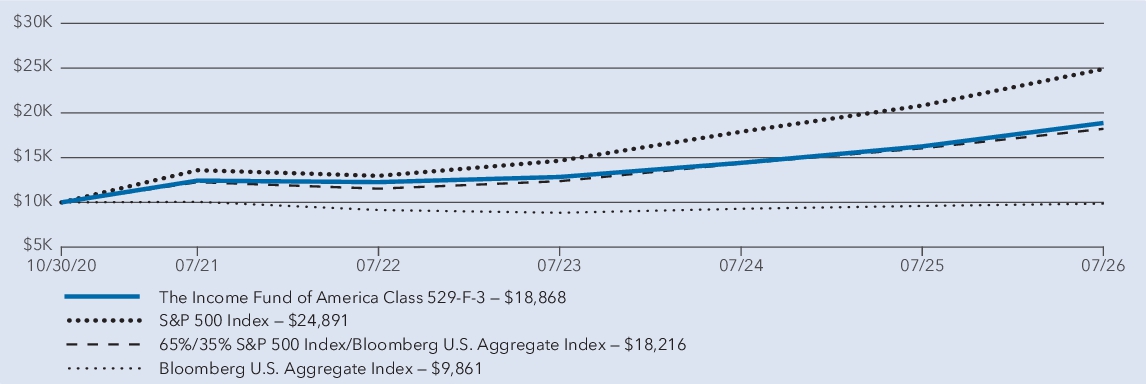
Average annual total returns
1 year | 5 years | Since inception 1 | |
| The Income Fund of America — Class 529-F-3 2 | 16.07 % | 8.71 % | 11.67 % |
| S&P 500 Index 3 | 19.56 % | 12.86 % | 17.17 % |
| 65%/35% S&P 500 Index/Bloomberg U.S. Aggregate Index 3 | 13.57 % | 8.24 % | 10.99 % |
| Bloomberg U.S. Aggregate Index 3 | 2.71 % | (0.40 ) % | (0.24 ) % |
1
Class 529-F-3 shares were first offered on October 30, 2020.2
Investment results assume all distributions are reinvested and reflect applicable fees and expenses. When applicable, results reflect fee waivers and/or
expense reimbursements, without which they would have been lower.3
Results assume all distributions are reinvested. Any market index shown is unmanaged, and therefore, has no expenses. Investors cannot invest directly in an index. Source(s): S&P Dow Jones Indices LLC and Bloomberg Index Services Ltd.Key fund statistics
| Fund net assets (in millions) | $ 148,232 |
| Total number of portfolio holdings | 3,341 |
| Total advisory fees paid (in millions) | $ 306 |
| Portfolio turnover rate including mortgage dollar roll transactions | 77 % |
| Portfolio turnover rate excluding mortgage dollar roll transactions | 59 % |
Portfolio holdings by asset type (percent of net assets)
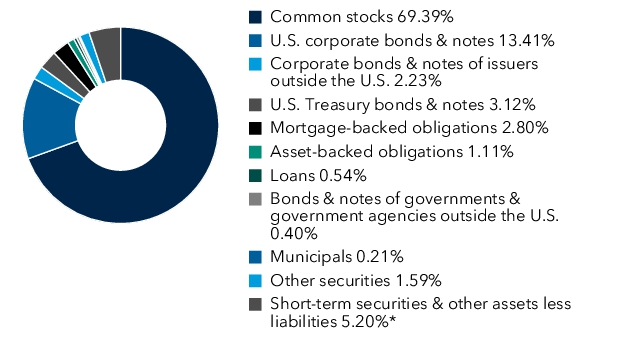
*Includes derivatives.
What were the fund costs for the last year? (based on a hypothetical $10,000 investment)
| Share class | Costs of a $10,000 investment | Costs paid as a percentage of a $10,000 investment |
| Class R-1 | $144 | 1.34% |
Management's discussion of fund performance
The fund’s Class R-1 shares gained 14.88% for the year ended July 31, 2026. That result compares with a 13.57% gain for the 65%/35% S&P 500 Index/Bloomberg U.S. Aggregate Index. For information on returns for additional periods, including the fund lifetime, please refer to capitalgroup.com/mutual-fund-returns-R1.
What factors influenced results
U.S. equities surged during the fund’s fiscal year, driven by strong corporate earnings, continued momentum around artificial intelligence and favorable monetary policy. The economy remained resilient, underpinned by healthy consumer spending. While the Federal Reserve cut interest rates in late 2025, it held steady through July 2026 as economic activity remained strong. Fixed income markets also delivered solid returns, aided by tight credit spreads. However, long-term Treasury yields moved higher as oil prices rose amid Middle East tensions, renewing inflation concerns.
Within the fund, most sectors were positive contributors with financials, healthcare and information technology being particularly additive. Energy and materials were also among the strongest contributors. Geographically, companies based in the U.S., Canada and Taiwan were strong drivers of returns. The fund’s bond allocation also added value, while supporting its income objective and maintaining a measure of stability when equity markets were volatile.
In terms of detractors, communication services lagged during the period. Also, investments in companies based in Denmark, India and Finland, detracted from the broader portfolio.
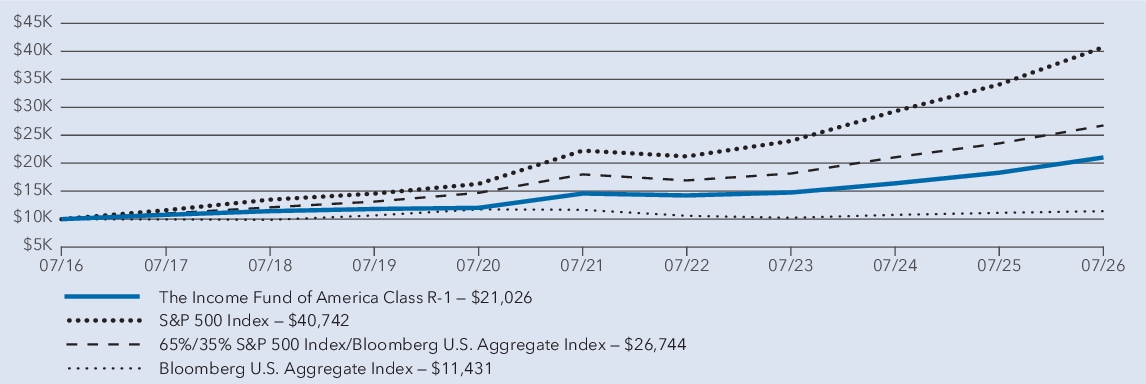
Average annual total returns
1 year | 5 years | 10 years | |
| The Income Fund of America — Class R-1 * | 14.88 % | 7.60 % | 7.72 % |
| S&P 500 Index † | 19.56 % | 12.86 % | 15.08 % |
| 65%/35% S&P 500 Index/Bloomberg U.S. Aggregate Index † | 13.57 % | 8.24 % | 10.34 % |
| Bloomberg U.S. Aggregate Index † | 2.71 % | (0.40 ) % | 1.35 % |
*
Investment results assume all distributions are reinvested and reflect applicable fees and expenses. When applicable, results reflect fee waivers and/or expense reimbursements, without which they would have been lower.†
Results assume all distributions are reinvested. Any market index shown is unmanaged, and therefore, has no expenses. Investors cannot invest directly in an index. Source(s): S&P Dow Jones Indices LLC and Bloomberg Index Services Ltd.Key fund statistics
| Fund net assets (in millions) | $ 148,232 |
| Total number of portfolio holdings | 3,341 |
| Total advisory fees paid (in millions) | $ 306 |
| Portfolio turnover rate including mortgage dollar roll transactions | 77 % |
| Portfolio turnover rate excluding mortgage dollar roll transactions | 59 % |
Portfolio holdings by asset type
(percent of net assets)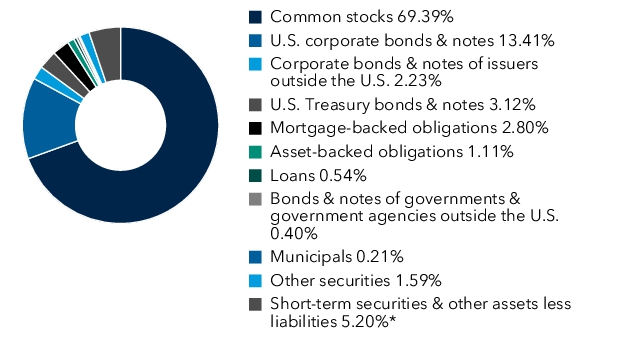
*Includes derivatives.
What were the fund costs for the last year? (based on a hypothetical $10,000 investment)
| Share class | Costs of a $10,000 investment | Costs paid as a percentage of a $10,000 investment |
| Class R-2 | $145 | 1.35% |
Management's discussion of fund performance
The fund’s Class R-2 shares gained 14.87% for the year ended July 31, 2026. That result compares with a 13.57% gain for the 65%/35% S&P 500 Index/Bloomberg U.S. Aggregate Index. For information on returns for additional periods, including the fund lifetime, please refer to capitalgroup.com/mutual-fund-returns-R2.
What factors influenced results
U.S. equities surged during the fund’s fiscal year, driven by strong corporate earnings, continued momentum around artificial intelligence and favorable monetary policy. The economy remained resilient, underpinned by healthy consumer spending. While the Federal Reserve cut interest rates in late 2025, it held steady through July 2026 as economic activity remained strong. Fixed income markets also delivered solid returns, aided by tight credit spreads. However, long-term Treasury yields moved higher as oil prices rose amid Middle East tensions, renewing inflation concerns.
Within the fund, most sectors were positive contributors with financials, healthcare and information technology being particularly additive. Energy and materials were also among the strongest contributors. Geographically, companies based in the U.S., Canada and Taiwan were strong drivers of returns. The fund’s bond allocation also added value, while supporting its income objective and maintaining a measure of stability when equity markets were volatile.
In terms of detractors, communication services lagged during the period. Also, investments in companies based in Denmark, India and Finland, detracted from the broader portfolio.
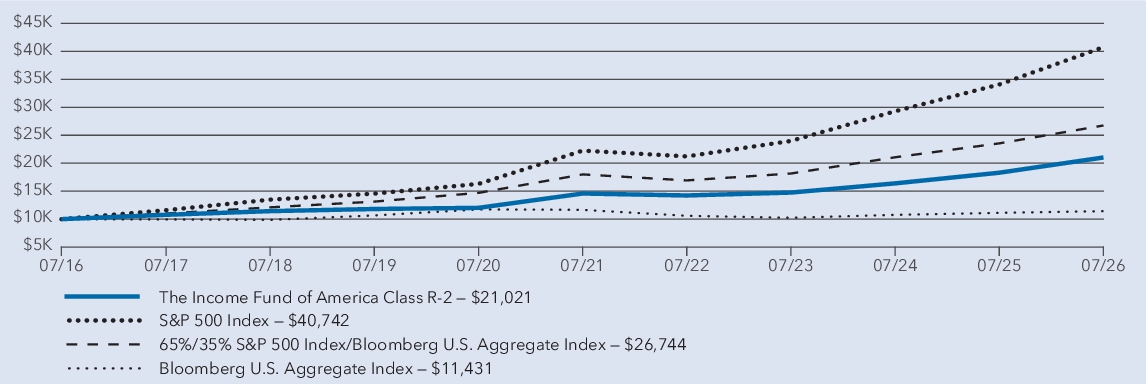
Average annual total returns
1 year | 5 years | 10 years | |
| The Income Fund of America — Class R-2 * | 14.87 % | 7.59 % | 7.71 % |
| S&P 500 Index † | 19.56 % | 12.86 % | 15.08 % |
| 65%/35% S&P 500 Index/Bloomberg U.S. Aggregate Index † | 13.57 % | 8.24 % | 10.34 % |
| Bloomberg U.S. Aggregate Index † | 2.71 % | (0.40 ) % | 1.35 % |
*
Investment results assume all distributions are reinvested and reflect applicable fees and expenses. When applicable, results reflect fee waivers and/or expense reimbursements, without which they would have been lower.†
Results assume all distributions are reinvested. Any market index shown is unmanaged, and therefore, has no expenses. Investors cannot invest directly in an index. Source(s): S&P Dow Jones Indices LLC and Bloomberg Index Services Ltd.Key fund statistics
| Fund net assets (in millions) | $ 148,232 |
| Total number of portfolio holdings | 3,341 |
| Total advisory fees paid (in millions) | $ 306 |
| Portfolio turnover rate including mortgage dollar roll transactions | 77 % |
| Portfolio turnover rate excluding mortgage dollar roll transactions | 59 % |
Portfolio holdings by asset type (percent of net assets)
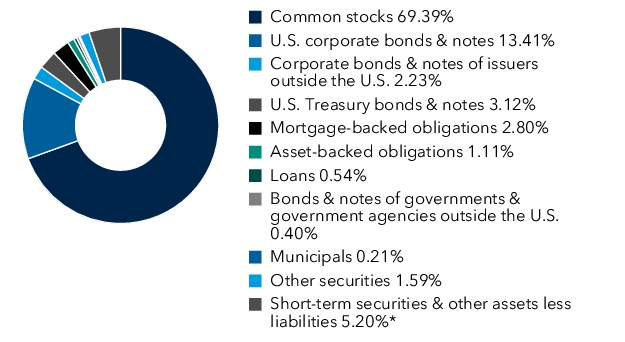
*Includes derivatives.
What were the fund costs for the last year? (based on a hypothetical $10,000 investment)
| Share class | Costs of a $10,000 investment | Costs paid as a percentage of a $10,000 investment |
| Class R-2E | $114 | 1.06% |
Management's discussion of fund performance
The fund’s Class R-2E shares gained 15.22% for the year ended July 31, 2026. That result compares with a 13.57% gain for the 65%/35% S&P 500 Index/Bloomberg U.S. Aggregate Index. For information on returns for additional periods, including the fund lifetime, please refer to capitalgroup.com/mutual-fund-returns-R2E.
What factors influenced results
U.S. equities surged during the fund’s fiscal year, driven by strong corporate earnings, continued momentum around artificial intelligence and favorable monetary policy. The economy remained resilient, underpinned by healthy consumer spending. While the Federal Reserve cut interest rates in late 2025, it held steady through July 2026 as economic activity remained strong. Fixed income markets also delivered solid returns, aided by tight credit spreads. However, long-term Treasury yields moved higher as oil prices rose amid Middle East tensions, renewing inflation concerns.
Within the fund, most sectors were positive contributors with financials, healthcare and information technology being particularly additive. Energy and materials were also among the strongest contributors. Geographically, companies based in the U.S., Canada and Taiwan were strong drivers of returns. The fund’s bond allocation also added value, while supporting its income objective and maintaining a measure of stability when equity markets were volatile.
In terms of detractors, communication services lagged during the period. Also, investments in companies based in Denmark, India and Finland, detracted from the broader portfolio.
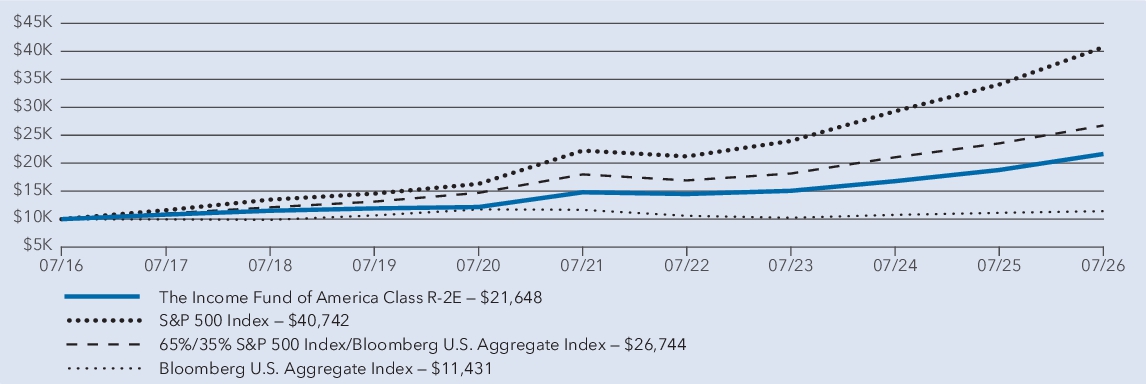
Average annual total returns
1 year | 5 years | 10 years | |
| The Income Fund of America — Class R-2E * | 15.22 % | 7.90 % | 8.03 % |
| S&P 500 Index † | 19.56 % | 12.86 % | 15.08 % |
| 65%/35% S&P 500 Index/Bloomberg U.S. Aggregate Index † | 13.57 % | 8.24 % | 10.34 % |
| Bloomberg U.S. Aggregate Index † | 2.71 % | (0.40 ) % | 1.35 % |
*
Investment results assume all distributions are reinvested and reflect applicable fees and expenses. When applicable, results reflect fee waivers and/or expense reimbursements, without which they would have been lower.†
Results assume all distributions are reinvested. Any market index shown is unmanaged, and therefore, has no expenses. Investors cannot invest directly in an index. Source(s): S&P Dow Jones Indices LLC and Bloomberg Index Services Ltd.Key fund statistics
| Fund net assets (in millions) | $ 148,232 |
| Total number of portfolio holdings | 3,341 |
| Total advisory fees paid (in millions) | $ 306 |
| Portfolio turnover rate including mortgage dollar roll transactions | 77 % |
| Portfolio turnover rate excluding mortgage dollar roll transactions | 59 % |
Portfolio holdings by asset type
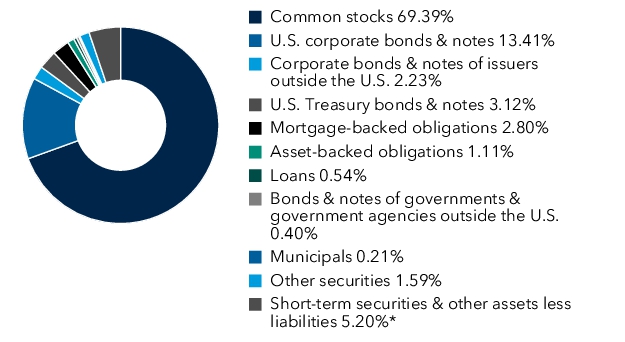
*Includes derivatives.
What were the fund costs for the last year? (based on a hypothetical $10,000 investment)
Share class | Costs of a $10,000 investment | Costs paid as a percentage of a $10,000 investment |
| Class R-3 | $ 97 | 0.90 % |
Management's discussion of fund performance
The fund’s Class R-3 shares gained 15.43% for the year ended July 31, 2026. That result compares with a 13.57% gain for the 65%/35% S&P 500 Index/Bloomberg U.S. Aggregate Index. For information on returns for additional periods, including the fund lifetime, please refer to capitalgroup.com/mutual-fund-returns-R3.
What factors influenced results
U.S. equities surged during the fund’s fiscal year, driven by strong corporate earnings, continued momentum around artificial intelligence and favorable monetary policy. The economy remained resilient, underpinned by healthy consumer spending. While the Federal Reserve cut interest rates in late 2025, it held steady through July 2026 as economic activity remained strong. Fixed income markets also delivered solid returns, aided by tight credit spreads. However, long-term Treasury yields moved higher as oil prices rose amid Middle East tensions, renewing inflation concerns.
Within the fund, most sectors were positive contributors with financials, healthcare and information technology being particularly additive. Energy and materials were also among the strongest contributors. Geographically, companies based in the U.S., Canada and Taiwan were strong drivers of returns. The fund’s bond allocation also added value, while supporting its income objective and maintaining a measure of stability when equity markets were volatile.
In terms of detractors, communication services lagged during the period. Also, investments in companies based in Denmark, India and Finland, detracted from the broader portfolio.
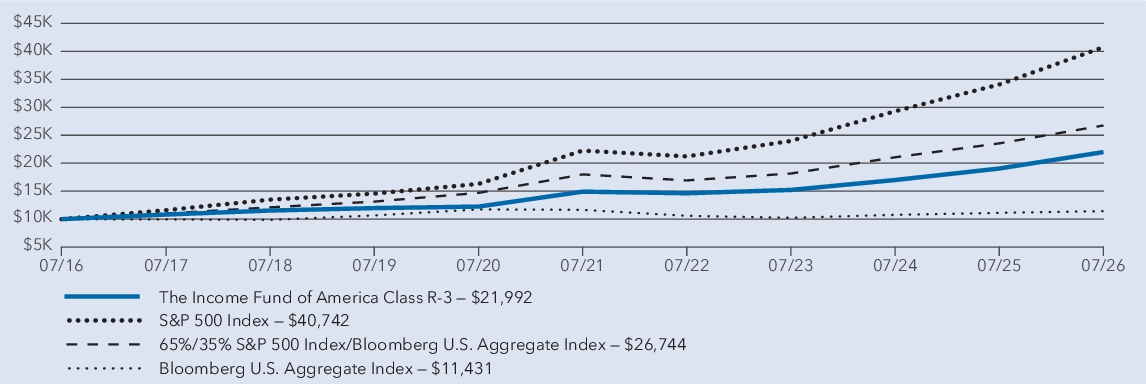
Average annual total returns
1 year | 5 years | 10 years | |
| The Income Fund of America — Class R-3 * | 15.43 % | 8.08 % | 8.20 % |
| S&P 500 Index † | 19.56 % | 12.86 % | 15.08 % |
| 65%/35% S&P 500 Index/Bloomberg U.S. Aggregate Index † | 13.57 % | 8.24 % | 10.34 % |
| Bloomberg U.S. Aggregate Index † | 2.71 % | (0.40 ) % | 1.35 % |
*
Investment results assume all distributions are reinvested and reflect applicable fees and expenses. When applicable, results reflect fee waivers and/or expense reimbursements, without which they would have been lower.†
Results assume all distributions are reinvested. Any market index shown is unmanaged, and therefore, has no expenses. Investors cannot invest directly in an index. Source(s): S&P Dow Jones Indices LLC and Bloomberg Index Services Ltd.Key fund statistics
| Fund net assets (in millions) | $ 148,232 |
| Total number of portfolio holdings | 3,341 |
| Total advisory fees paid (in millions) | $ 306 |
| Portfolio turnover rate including mortgage dollar roll transactions | 77 % |
| Portfolio turnover rate excluding mortgage dollar roll transactions | 59 % |
Portfolio holdings by asset type (percent of net assets)
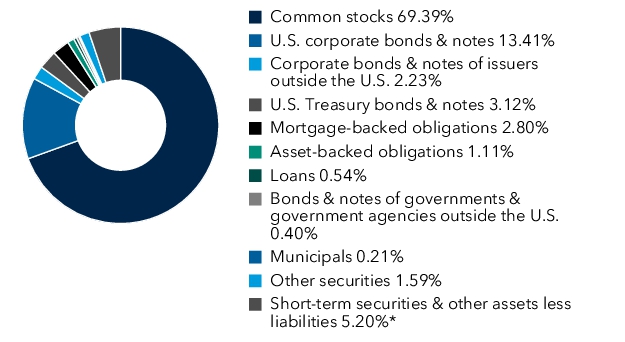
*Includes derivatives.
What were the fund costs for the last year? (based on a hypothetical $10,000 investment)
Share class | Costs of a $10,000 investment | Costs paid as a percentage of a $10,000 investment |
| Class R-4 | $ 66 | 0.61 % |
Management's discussion of fund performance
The fund’s Class R-4 shares gained 15.74% for the year ended July 31, 2026. That result compares with a 13.57% gain for the 65%/35% S&P 500 Index/Bloomberg U.S. Aggregate Index. For information on returns for additional periods, including the fund lifetime, please refer to capitalgroup.com/mutual-fund-returns-R4.
What factors influenced results
U.S. equities surged during the fund’s fiscal year, driven by strong corporate earnings, continued momentum around artificial intelligence and favorable monetary policy. The economy remained resilient, underpinned by healthy consumer spending. While the Federal Reserve cut interest rates in late 2025, it held steady through July 2026 as economic activity remained strong. Fixed income markets also delivered solid returns, aided by tight credit spreads. However, long-term Treasury yields moved higher as oil prices rose amid Middle East tensions, renewing inflation concerns.
Within the fund, most sectors were positive contributors with financials, healthcare and information technology being particularly additive. Energy and materials were also among the strongest contributors. Geographically, companies based in the U.S., Canada and Taiwan were strong drivers of returns. The fund’s bond allocation also added value, while supporting its income objective and maintaining a measure of stability when equity markets were volatile.
In terms of detractors, communication services lagged during the period. Also, investments in companies based in Denmark, India and Finland, detracted from the broader portfolio.
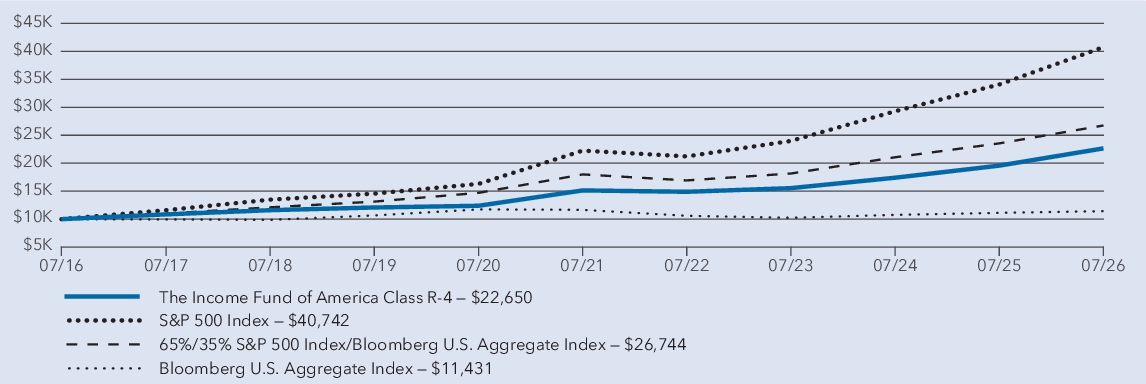
Average annual total returns
1 year | 5 years | 10 years | |
| The Income Fund of America — Class R-4 * | 15.74 % | 8.40 % | 8.52 % |
| S&P 500 Index † | 19.56 % | 12.86 % | 15.08 % |
| 65%/35% S&P 500 Index/Bloomberg U.S. Aggregate Index † | 13.57 % | 8.24 % | 10.34 % |
| Bloomberg U.S. Aggregate Index † | 2.71 % | (0.40 ) % | 1.35 % |
*
Investment results assume all distributions are reinvested and reflect applicable fees and expenses. When applicable, results reflect fee waivers and/or expense reimbursements, without which they would have been lower.†
Results assume all distributions are reinvested. Any market index shown is unmanaged, and therefore, has no expenses. Investors cannot invest directly in an index. Source(s): S&P Dow Jones Indices LLC and Bloomberg Index Services Ltd.Key fund statistics
| Fund net assets (in millions) | $ 148,232 |
| Total number of portfolio holdings | 3,341 |
| Total advisory fees paid (in millions) | $ 306 |
| Portfolio turnover rate including mortgage dollar roll transactions | 77 % |
| Portfolio turnover rate excluding mortgage dollar roll transactions | 59 % |
Portfolio holdings by asset type (percent of net assets)
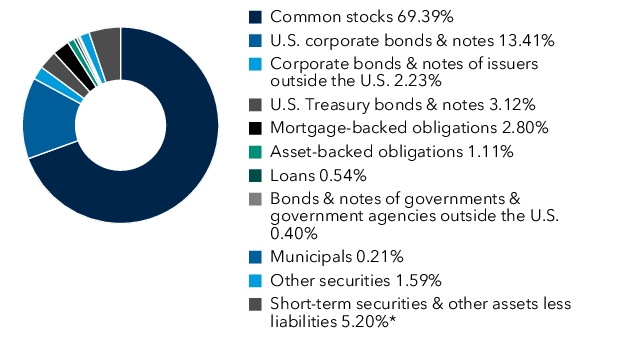
*Includes derivatives.
What were the fund costs for the last year? (based on a hypothetical $10,000 investment)
Share class | Costs of a $10,000 investment | Costs paid as a percentage of a $10,000 investment |
| Class R-5E | $ 44 | 0.41 % |
Management's discussion of fund performance
The fund’s Class R-5E shares gained 15.98% for the year ended July 31, 2026. That result compares with a 13.57% gain for the 65%/35% S&P 500 Index/Bloomberg U.S. Aggregate Index. For information on returns for additional periods, including the fund lifetime, please refer to capitalgroup.com/mutual-fund-returns-R5E.
What factors influenced results
U.S. equities surged during the fund’s fiscal year, driven by strong corporate earnings, continued momentum around artificial intelligence and favorable monetary policy. The economy remained resilient, underpinned by healthy consumer spending. While the Federal Reserve cut interest rates in late 2025, it held steady through July 2026 as economic activity remained strong. Fixed income markets also delivered solid returns, aided by tight credit spreads. However, long-term Treasury yields moved higher as oil prices rose amid Middle East tensions, renewing inflation concerns.
Within the fund, most sectors were positive contributors with financials, healthcare and information technology being particularly additive. Energy and materials were also among the strongest contributors. Geographically, companies based in the U.S., Canada and Taiwan were strong drivers of returns. The fund’s bond allocation also added value, while supporting its income objective and maintaining a measure of stability when equity markets were volatile.
In terms of detractors, communication services lagged during the period. Also, investments in companies based in Denmark, India and Finland, detracted from the broader portfolio.
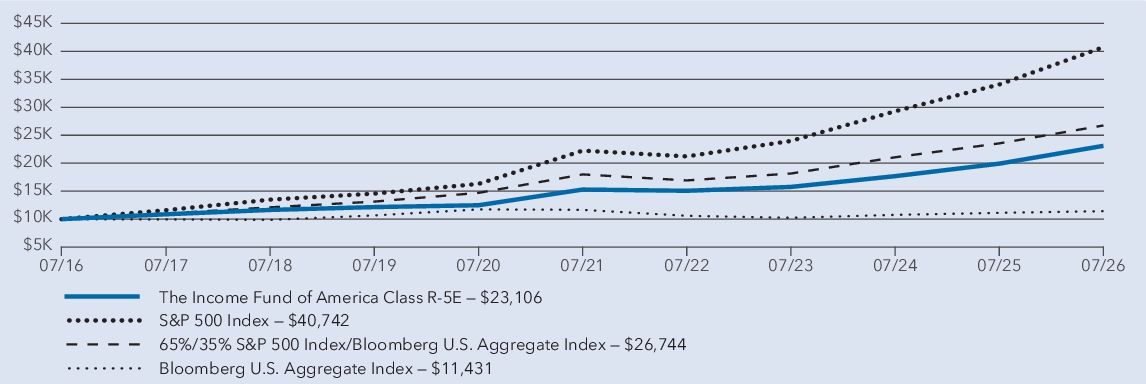
Average annual total returns
1 year | 5 years | 10 years | |
| The Income Fund of America — Class R-5E * | 15.98 % | 8.60 % | 8.74 % |
| S&P 500 Index † | 19.56 % | 12.86 % | 15.08 % |
| 65%/35% S&P 500 Index/Bloomberg U.S. Aggregate Index † | 13.57 % | 8.24 % | 10.34 % |
| Bloomberg U.S. Aggregate Index † | 2.71 % | (0.40 ) % | 1.35 % |
*
Investment results assume all distributions are reinvested and reflect applicable fees and expenses. When applicable, results reflect fee waivers and/or expense reimbursements, without which they would have been lower.†
Results assume all distributions are reinvested. Any market index shown is unmanaged, and therefore, has no expenses. Investors cannot invest directly in an index. Source(s): S&P Dow Jones Indices LLC and Bloomberg Index Services Ltd.Key fund statistics
| Fund net assets (in millions) | $ 148,232 |
| Total number of portfolio holdings | 3,341 |
| Total advisory fees paid (in millions) | $ 306 |
| Portfolio turnover rate including mortgage dollar roll transactions | 77 % |
| Portfolio turnover rate excluding mortgage dollar roll transactions | 59 % |
Portfolio holdings by asset type (percent of net assets)
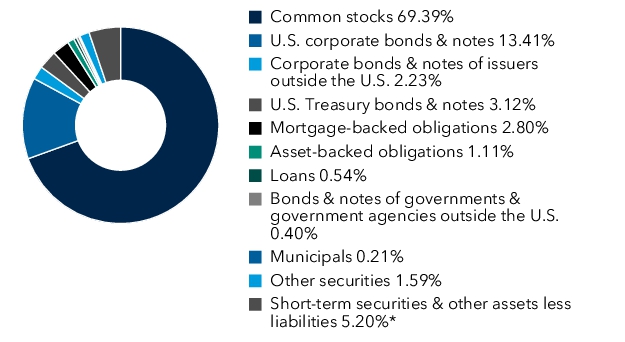
*Includes derivatives.
What were the fund costs for the last year? (based on a hypothetical $10,000 investment)
Share class | Costs of a $10,000 investment | Costs paid as a percentage of a $10,000 investment |
| Class R-5 | $ 32 | 0.30 % |
Management's discussion of fund performance
The fund’s Class R-5 shares gained 16.08% for the year ended July 31, 2026. That result compares with a 13.57% gain for the 65%/35% S&P 500 Index/Bloomberg U.S. Aggregate Index. For information on returns for additional periods, including the fund lifetime, please refer to capitalgroup.com/mutual-fund-returns-R5.
What factors influenced results
U.S. equities surged during the fund’s fiscal year, driven by strong corporate earnings, continued momentum around artificial intelligence and favorable monetary policy. The economy remained resilient, underpinned by healthy consumer spending. While the Federal Reserve cut interest rates in late 2025, it held steady through July 2026 as economic activity remained strong. Fixed income markets also delivered solid returns, aided by tight credit spreads. However, long-term Treasury yields moved higher as oil prices rose amid Middle East tensions, renewing inflation concerns.
Within the fund, most sectors were positive contributors with financials, healthcare and information technology being particularly additive. Energy and materials were also among the strongest contributors. Geographically, companies based in the U.S., Canada and Taiwan were strong drivers of returns. The fund’s bond allocation also added value, while supporting its income objective and maintaining a measure of stability when equity markets were volatile.
In terms of detractors, communication services lagged during the period. Also, investments in companies based in Denmark, India and Finland, detracted from the broader portfolio.
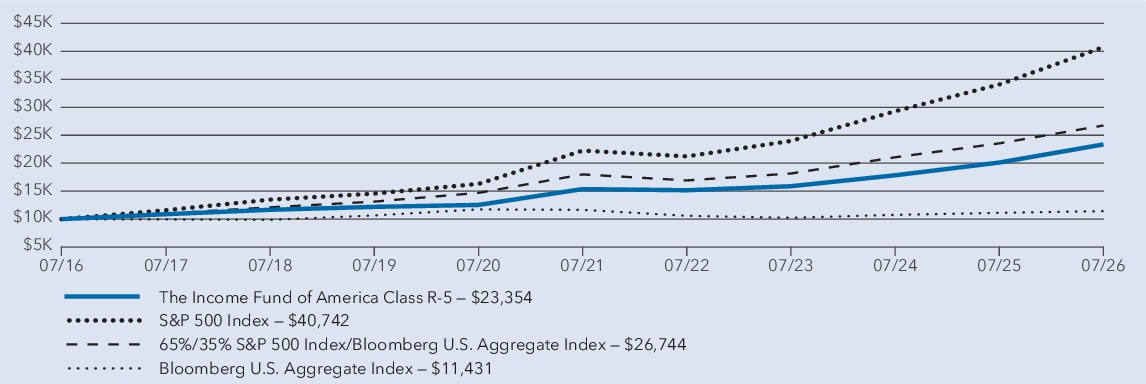
Average annual total returns
1 year | 5 years | 10 years | |
| The Income Fund of America — Class R-5 * | 16.08 % | 8.72 % | 8.85 % |
| S&P 500 Index † | 19.56 % | 12.86 % | 15.08 % |
| 65%/35% S&P 500 Index/Bloomberg U.S. Aggregate Index † | 13.57 % | 8.24 % | 10.34 % |
| Bloomberg U.S. Aggregate Index † | 2.71 % | (0.40 ) % | 1.35 % |
*
Investment results assume all distributions are reinvested and reflect applicable fees and expenses. When applicable, results reflect fee waivers and/or expense reimbursements, without which they would have been lower.†
Results assume all distributions are reinvested. Any market index shown is unmanaged, and therefore, has no expenses. Investors cannot invest directly in an index. Source(s): S&P Dow Jones Indices LLC and Bloomberg Index Services Ltd.Key fund statistics
| Fund net assets (in millions) | $ 148,232 |
| Total number of portfolio holdings | 3,341 |
| Total advisory fees paid (in millions) | $ 306 |
| Portfolio turnover rate including mortgage dollar roll transactions | 77 % |
| Portfolio turnover rate excluding mortgage dollar roll transactions | 59 % |
Portfolio holdings by asset type (percent of net assets)
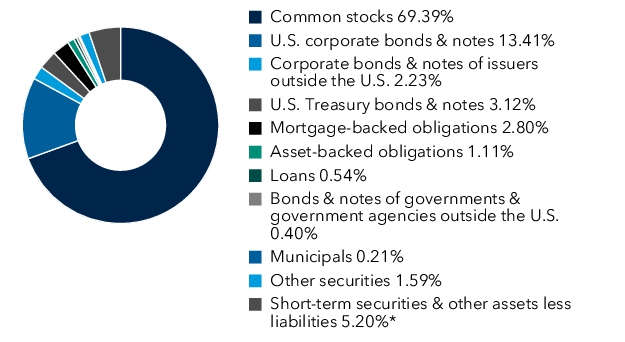
*Includes derivatives.
What were the fund costs for the last year? (based on a hypothetical $10,000 investment)
Share class | Costs of a $10,000 investment | Costs paid as a percentage of a $10,000 investment |
| Class R-6 | $ 27 | 0.25 % |
Management's discussion of fund performance
The fund’s Class R-6 shares gained 16.16% for the year ended July 31, 2026. That result compares with a 13.57% gain for the 65%/35% S&P 500 Index/Bloomberg U.S. Aggregate Index. For information on returns for additional periods, including the fund lifetime, please refer to capitalgroup.com/mutual-fund-returns-R6.
What factors influenced results
U.S. equities surged during the fund’s fiscal year, driven by strong corporate earnings, continued momentum around artificial intelligence and favorable monetary policy. The economy remained resilient, underpinned by healthy consumer spending. While the Federal Reserve cut interest rates in late 2025, it held steady through July 2026 as economic activity remained strong. Fixed income markets also delivered solid returns, aided by tight credit spreads. However, long-term Treasury yields moved higher as oil prices rose amid Middle East tensions, renewing inflation concerns.
Within the fund, most sectors were positive contributors with financials, healthcare and information technology being particularly additive. Energy and materials were also among the strongest contributors. Geographically, companies based in the U.S., Canada and Taiwan were strong drivers of returns. The fund’s bond allocation also added value, while supporting its income objective and maintaining a measure of stability when equity markets were volatile.
In terms of detractors, communication services lagged during the period. Also, investments in companies based in Denmark, India and Finland, detracted from the broader portfolio.
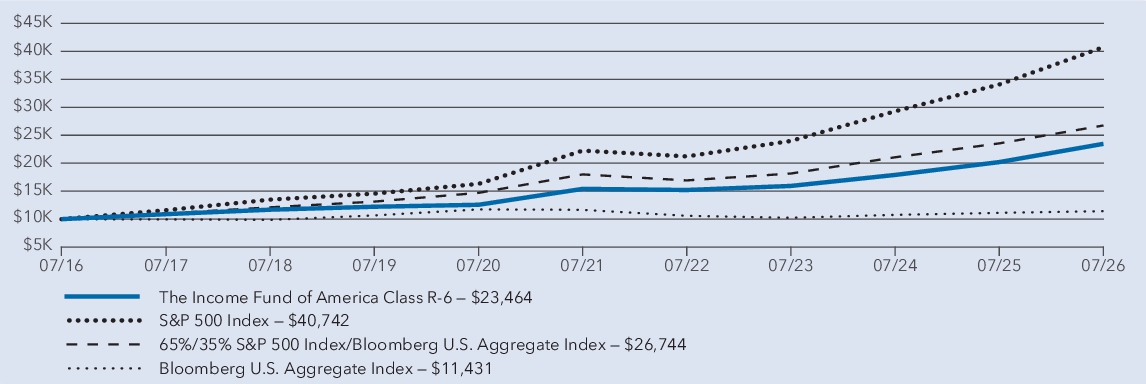
Average annual total returns
1 year | 5 years | 10 years | |
| The Income Fund of America — Class R-6 * | 16.16 % | 8.77 % | 8.90 % |
| S&P 500 Index † | 19.56 % | 12.86 % | 15.08 % |
| 65%/35% S&P 500 Index/Bloomberg U.S. Aggregate Index † | 13.57 % | 8.24 % | 10.34 % |
| Bloomberg U.S. Aggregate Index † | 2.71 % | (0.40 ) % | 1.35 % |
*
Investment results assume all distributions are reinvested and reflect applicable fees and expenses. When applicable, results reflect fee waivers and/or expense reimbursements, without which they would have been lower.†
Results assume all distributions are reinvested. Any market index shown is unmanaged, and therefore, has no expenses. Investors cannot invest directly in an index. Source(s): S&P Dow Jones Indices LLC and Bloomberg Index Services Ltd.Key fund statistics
| Fund net assets (in millions) | $ 148,232 |
| Total number of portfolio holdings | 3,341 |
| Total advisory fees paid (in millions) | $ 306 |
| Portfolio turnover rate including mortgage dollar roll transactions | 77 % |
| Portfolio turnover rate excluding mortgage dollar roll transactions | 59 % |
Portfolio holdings by asset type (percent of net assets)
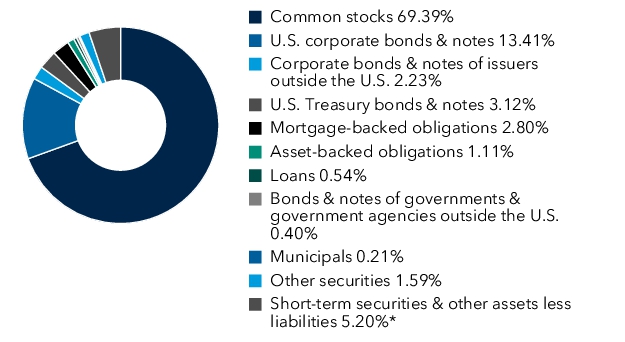
*Includes derivatives.