Exhibit 99.3

FIRST QUARTER
FINANCIAL REPORT
Exhibit 99.3
FIRST QUARTER
FINANCIAL REPORT
|
2026-27 First Quarter Financial Report Government of Saskatchewan August 27, 2026 |
2026-27 FIRST QUARTER HIGHLIGHTS
Overview
At the end of the first quarter (Q1), total revenue for 2026-27 is forecast at $21.7 billion and total expense is forecast at $22.6 billion, resulting in a projected deficit of $825 million. This is largely unchanged from the 2026-27 Budget, with the forecast deficit $6 million higher than originally projected.
For a more detailed overview, see Table 1.
Revenue
Total revenue at Q1 is forecast to increase by $331 million, or 1.5 per cent, compared to budget.
The increase is primarily attributable to higher Non-Renewable Resources Revenue, which is forecast to increase by $320 million from budget. The improvement is driven by higher-than-budgeted oil prices, as WTI is now forecast to average US$75.00 per barrel in 2026-27, up $15.25 compared to budget.
Other Own-Source Revenue is forecast to increase by $144 million, primarily due to higher revenues from the electricity sector being accrued under the Output-Based Performance Standards Program (OBPS) due to federal industrial carbon pricing requirements.
Partially offsetting these increases, Government Business Enterprise net income is forecast to decrease by $133 million compared to budget, primarily due to lower net income at SGI and the Saskatchewan Auto Fund related to hailstorms claims. SaskPower’s net income is also reported lower-than-budget due to expenses being accrued for federal industrial carbon pricing requirements pending the outcome of ongoing federal-provincial negotiations regarding the future of Saskatchewan’s electricity sector.
For a more detailed review of revenue and resource assumptions, see Tables 3 and 5.
Expense
Total expense at Q1 is forecast to increase $337 million, or 1.5 per cent, compared to budget.
The increase reflects ongoing expenditure pressures across the health system, driven primarily by growing service demand, inflationary costs, and compensation expenses associated with delivering healthcare services to Saskatchewan residents.
Additional expense pressures are forecast in Protection of persons and property, primarily as a result of flood-related response and recovery efforts, as well as in Agriculture, mainly due to higher unseeded acreage Crop Insurance claims resulting from excess moisture in the spring.
For a more detailed overview, see Table 1.
Debt
Total gross debt at Q1 is forecast to be $43.6 billion, an increase of $65 million, or 0.2 per cent, from budget.
The increase is primarily attributable to higher self-supported debt (i.e., Government Business Enterprise debt), largely reflecting additional borrowing requirements at SaskPower due to lower net income.
For a more detailed review of gross debt, see Table 4.
Saskatchewan’s net debt-to-GDP ratio is projected to be 14.9 per cent at March 31, 2027, an improvement from the budget projection of 16.1 per cent. The lower ratio primarily reflects a stronger GDP outlook than anticipated at budget. Saskatchewan’s net debt-to-GDP ratio remains the second-best among all provinces.
For a review of provincial net debt-to-GDP ratios, see Graph 1.
Economy
Saskatchewan’s economic outlook has been supported by strong construction and an improved commodity outlook since the release of the 2026-27 Budget.
Saskatchewan is expected to remain one of the fastest-growing provincial economies over the next two years, with real GDP growth projected to rank third-best among provinces in 2026 and second-best in 2027.
While global economic conditions and trade developments remain sources of uncertainty, exports have increased by 11.6 per cent year-to-date through June. Economic activity continues to be supported by new major private sector projects, strong construction activity, and global demand for Saskatchewan’s key commodities.
For more figures on the economy, see Table 2.
| 2026-27 First Quarter Financial Report | 1 | |
TABLE 1: 2026-27 FORECAST UPDATE - FIRST QUARTER
For the year ended March 31
(millions of dollars)
| Budget | First Quarter | Change | ||||||||||
| Revenue |
||||||||||||
| Taxation |
10,693.2 | 10,693.2 | — | |||||||||
| Non-renewable resources |
2,567.5 | 2,887.3 | 319.8 | |||||||||
| Net income from government business enterprises |
642.9 | 510.2 | (132.7 | ) | ||||||||
| Other own-source |
3,345.7 | 3,489.9 | 144.2 | |||||||||
| Transfers from the federal government |
4,167.6 | 4,167.6 | — | |||||||||
|
|
|
|
|
|
|
|||||||
| Total Revenue |
21,416.9 | 21,748.2 | 331.3 | |||||||||
|
|
|
|
|
|
|
|||||||
| Expense |
||||||||||||
| Agriculture |
1,687.1 | 1,710.6 | 23.5 | |||||||||
| Community development |
902.0 | 902.0 | — | |||||||||
| Economic development |
548.8 | 548.8 | — | |||||||||
| Education |
4,649.3 | 4,649.3 | — | |||||||||
| Environment and natural resources |
247.7 | 261.3 | 13.6 | |||||||||
| Financing charges |
1,219.1 | 1,219.1 | — | |||||||||
| General government |
716.1 | 716.1 | — | |||||||||
| Health |
8,420.6 | 8,620.6 | 200.0 | |||||||||
| Protection of persons and property |
1,168.0 | 1,268.0 | 100.0 | |||||||||
| Social services and assistance |
1,929.3 | 1,929.3 | — | |||||||||
| Transportation |
748.3 | 748.3 | — | |||||||||
|
|
|
|
|
|
|
|||||||
| Total Expense |
22,236.3 | 22,573.4 | 337.1 | |||||||||
|
|
|
|
|
|
|
|||||||
| Operating (Deficit) Surplus |
(819.4 | ) | (825.2 | ) | (5.8 | ) | ||||||
|
|
|
|
|
|
|
|||||||
TABLE 2: PRIVATE-SECTOR FORECAST AT A GLANCE
(Per cent change unless otherwise noted)
| 2025 Actual | 2026 Forecast | 2027 Forecast | ||||||||||
| Real GDP |
2.2 | 1.5 | 2.1 | |||||||||
| Nominal GDP* |
4.6 | 7.0 | 2.8 | |||||||||
| Consumer Price Index (CPI) |
2.1 | 3.1 | 2.2 | |||||||||
| Employment growth (000s) |
15.2 | 4.4 | 5.3 | |||||||||
| Unemployment rate (% level) |
5.2 | 5.5 | 5.3 | |||||||||
* Estimate for 2025
Sources: Statistics Canada (2025); Average private-sector forecast as of July 29, 2026 (2026-2027).
| 2026-27 First Quarter Financial Report | 2 | |
TABLE 3: 2026-27 SCHEDULE OF REVENUE
For the year ended March 31
(millions of dollars)
| Budget | First Quarter | Change | ||||||||||
| Taxation |
||||||||||||
| Corporation income |
1,649.4 | 1,649.4 | — | |||||||||
| Fuel |
512.4 | 512.4 | — | |||||||||
| Personal income |
3,432.1 | 3,432.1 | — | |||||||||
| Property |
826.7 | 826.7 | — | |||||||||
| Provincial sales |
3,548.7 | 3,548.7 | — | |||||||||
| Other taxation |
723.9 | 723.9 | — | |||||||||
|
|
|
|
|
|
|
|||||||
| Total Taxation |
10,693.2 | 10,693.2 | — | |||||||||
|
|
|
|
|
|
|
|||||||
| Non-Renewable Resources |
||||||||||||
| Oil and natural gas |
721.0 | 968.6 | 247.6 | |||||||||
| Potash |
940.9 | 940.9 | — | |||||||||
| Resource surcharge |
524.0 | 590.5 | 66.5 | |||||||||
| Uranium |
275.8 | 275.8 | — | |||||||||
| Other non-renewable resources |
105.8 | 111.5 | 5.7 | |||||||||
|
|
|
|
|
|
|
|||||||
| Total Non-Renewable Resources |
2,567.5 | 2,887.3 | 319.8 | |||||||||
|
|
|
|
|
|
|
|||||||
| Net Income from Government Business Enterprises |
||||||||||||
| Liquor and Gaming Authority |
235.7 | 227.7 | (8.0 | ) | ||||||||
| Lotteries and Gaming Saskatchewan |
220.7 | 214.4 | (6.3 | ) | ||||||||
| Municipal Financing Corporation of Saskatchewan |
0.8 | 0.3 | (0.5 | ) | ||||||||
| Saskatchewan Auto Fund |
(242.5 | ) | (267.5 | ) | (25.0 | ) | ||||||
| Saskatchewan Government Insurance |
102.7 | 57.7 | (45.0 | ) | ||||||||
| Saskatchewan Power Corporation |
138.4 | 59.5 | (78.9 | ) | ||||||||
| Saskatchewan Telecommunications Holding Corporation |
78.8 | 78.8 | — | |||||||||
| Saskatchewan Water Corporation |
7.4 | 7.5 | 0.1 | |||||||||
| Saskatchewan Workers’ Compensation Board |
(52.5 | ) | (40.0 | ) | 12.5 | |||||||
| SaskEnergy Incorporated |
181.9 | 196.5 | 14.6 | |||||||||
| Consolidation Adjustments |
(28.5 | ) | (24.7 | ) | 3.8 | |||||||
|
|
|
|
|
|
|
|||||||
| Total Net Income from Government Business Enterprises |
642.9 | 510.2 | (132.7 | ) | ||||||||
|
|
|
|
|
|
|
|||||||
| Other Own-Source |
||||||||||||
| Fees |
1,458.2 | 1,458.2 | — | |||||||||
| Insurance |
513.0 | 513.0 | — | |||||||||
| Investment income |
516.7 | 560.3 | 43.6 | |||||||||
| Output-based performance standards |
110.1 | 210.7 | 100.6 | |||||||||
| Transfers from other governments |
73.5 | 73.5 | — | |||||||||
| Miscellaneous |
674.2 | 674.2 | — | |||||||||
|
|
|
|
|
|
|
|||||||
| Total Other Own-Source |
3,345.7 | 3,489.9 | 144.2 | |||||||||
|
|
|
|
|
|
|
|||||||
| Transfers from the Federal Government |
||||||||||||
| Canada Health Transfer |
1,756.7 | 1,756.7 | — | |||||||||
| Canada Social Transfer |
548.8 | 548.8 | — | |||||||||
| Other transfers |
1,862.1 | 1,862.1 | — | |||||||||
|
|
|
|
|
|
|
|||||||
| Total Transfers from the Federal Government |
4,167.6 | 4,167.6 | — | |||||||||
|
|
|
|
|
|
|
|||||||
| Total Revenue |
21,416.9 | 21,748.2 | 331.3 | |||||||||
|
|
|
|
|
|
|
|||||||
| 2026-27 First Quarter Financial Report | 3 | |
TABLE 4: 2026-27 SCHEDULE OF GROSS DEBT - FIRST QUARTER
As at March 31
(millions of dollars)
| Budget | First Quarter | Change | ||||||||||
| Government Service Organization debt |
||||||||||||
| General Revenue Fund |
||||||||||||
| - operating |
9,613.9 | 9,613.9 | — | |||||||||
| - Saskatchewan Capital Plan1 |
17,026.3 | 17,026.3 | — | |||||||||
| Boards of Education |
81.9 | 81.9 | — | |||||||||
| Global Transportation Hub Authority |
15.0 | 16.0 | 1.0 | |||||||||
| Health Sector Affiliates |
1.1 | — | (1.1 | ) | ||||||||
| Innovation Saskatchewan |
49.7 | 49.6 | (0.1 | ) | ||||||||
| Saskatchewan Health Authority |
31.8 | 31.3 | (0.5 | ) | ||||||||
| Other |
2.5 | 2.4 | (0.1 | ) | ||||||||
|
|
|
|
|
|
|
|||||||
| Government Service Organization Debt |
26,822.2 | 26,821.4 | (0.8 | ) | ||||||||
|
|
|
|
|
|
|
|||||||
| Government Business Enterprise Debt |
||||||||||||
| Municipal Financing Corporation of Saskatchewan |
359.2 | 354.2 | (5.0 | ) | ||||||||
| Saskatchewan Power Corporation |
11,789.1 | 11,845.4 | 56.3 | |||||||||
| Saskatchewan Telecommunications Holding Corporation |
2,119.8 | 2,119.8 | — | |||||||||
| Saskatchewan Water Corporation |
111.4 | 120.4 | 9.0 | |||||||||
| SaskEnergy Incorporated |
2,316.9 | 2,322.8 | 5.9 | |||||||||
|
|
|
|
|
|
|
|||||||
| Government Business Enterprise Debt2 |
16,696.4 | 16,762.6 | 66.2 | |||||||||
|
|
|
|
|
|
|
|||||||
| Total |
43,518.6 | 43,584.0 | 65.4 | |||||||||
|
|
|
|
|
|
|
|||||||
| Guaranteed debt |
75.0 | 75.0 | — | |||||||||
|
|
|
|
|
|
|
|||||||
| 1 | General Revenue Fund - Saskatchewan Capital Plan consists of amounts borrowed by the General Revenue Fund to finance investment in infrastructure assets. |
| 2 | GBE debt includes both general debt and GBE-specific debt. General debt of GBEs is the amount transferred from the General Revenue Fund to a GBE and recorded as a loan receivable in the Summary Financial Statements. GBE-specific debt is debt issued by, or specifically on behalf of, GBEs. GBE-specific debt is included in “Investment in government business enterprises” in the Summary Financial Statements. |
| 2026-27 First Quarter Financial Report | 4 | |
TABLE 5: 2026-27 NON-RENEWABLE RESOURCE FORECAST ASSUMPTIONS
| 2026-27 | ||||||||||||||||
| 2025-26 Actual |
Budget | First Quarter | Change | |||||||||||||
| Oil |
||||||||||||||||
| WTI oil price (US$/barrel) |
64.87 | 59.75 | 75.00 | 15.25 | ||||||||||||
| Light-heavy differential (% of WTI) |
13.5 | 14.7 | 15.0 | 0.3 | ||||||||||||
| Well-head oil price (C$/barrel)1 |
70.10 | 62.92 | 79.35 | 16.43 | ||||||||||||
| Oil production (million barrels) |
158.5 | 165.7 | 164.5 | (1.2 | ) | |||||||||||
| Potash |
||||||||||||||||
| Potash price (netback, US$/KCl tonne) |
271 | 289 | 289 | 0 | ||||||||||||
| Potash sales (million KCl tonnes) |
25.0 | 25.5 | 25.5 | 0.0 | ||||||||||||
| Uranium |
||||||||||||||||
| Uranium price (realized, US$/U3O8 pound) |
59.44 | 60.73 | 60.73 | 0.00 | ||||||||||||
| Uranium sales (kt U3O8)2 |
17.2 | 16.2 | 16.2 | 0.0 | ||||||||||||
| Currency |
||||||||||||||||
| Canadian dollar (US cents) |
72.4 | 72.7 | 73.7 | 0.9 | ||||||||||||
| 1 | The average price per barrel of Saskatchewan light, medium and heavy oil. |
| 2 | Uranium sales are estimated in kilotonnes (kt), the conversion rate is 1 kt : 2,204,600 pounds. |
GRAPH 1: NET DEBT AS A PER CENT OF GDP
(As at March 31, 2027)
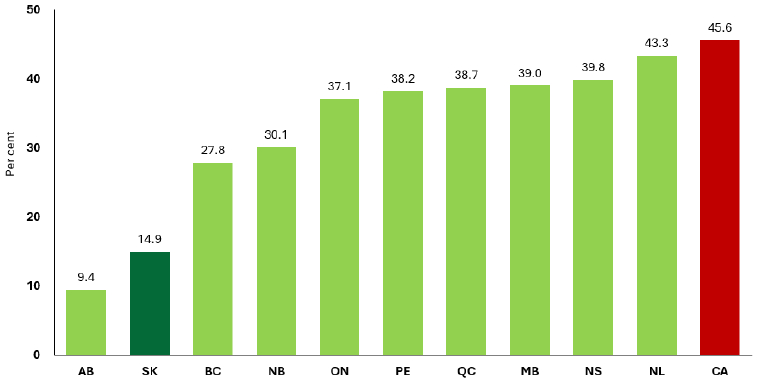
Source: Net Debt: Jurisdictions most recent data as of July 28, 2026.
GDP: SK-Average private-sector forecast; Canada and other provinces - Signal49 Research fiscalized data released on May 7, 2026.
| 2026-27 First Quarter Financial Report | 5 | |