Exhibit 99.2
Exhibit 99.2
|
2025-26 Public Accounts of Saskatchewan
Volume 1
|
Contents
| 3 | Letters of Transmittal | |
| 4 | Introduction to the Public Accounts | |
| Financial Statement Discussion and Analysis | ||
| 7 | Highlights | |
| 12 | Assessment of Fiscal Health | |
| 17 | Details | |
| 36 | Risks and Uncertainties | |
| Summary Financial Statements | ||
| 39 | Responsibility for the Summary Financial Statements | |
| 41 | Independent Auditor’s Report | |
| 45 | Statement of Financial Position | |
| 46 | Statement of Operations | |
| 47 | Statement of Accumulated Operating Deficit | |
| 47 | Statement of Accumulated Remeasurement Gains and Losses | |
| 48 | Statement of Change in Net Debt | |
| 49 | Statement of Cash Flow | |
| 50 | Notes to the Financial Statements | |
| Schedules to the Financial Statements | ||
| 64 | Accounts Receivable | |
| 65 | Loans Receivable | |
| 66 | Investment in Government Business Enterprises | |
| 68 | Sinking Fund Investments | |
| 70 | Portfolio Investments | |
| 71 | Accounts Payable and Accrued Liabilities | |
| 72 | Unearned Revenue | |
| 73 | Pension Liabilities | |
| 74 | Public Debt | |
| 76 | Obligations Under Long-Term Financing Arrangements | |
| 77 | Other Liabilities | |
| 78 | Tangible Capital Assets | |
| 79 | Inventories Held for Consumption | |
| 80 | Revenue | |
| 81 | Expense by Object | |
| 81 | Financing Charges | |
| 82 | Segmented Reporting | |
| 84 | Supplemental Cash Flow Information | |
| 85 | Government Reporting Entity | |
| 88 | Glossary of Terms | |
Letters of Transmittal
Regina, Saskatchewan
June 2026
To Her Honour
The Honourable Bernadette McIntyre
Lieutenant Governor of Saskatchewan
Your Honour:
I have the honour to submit Volume 1 of the Public Accounts of the Government of Saskatchewan for the fiscal year ended March 31, 2026.
Respectfully submitted,
JIM REITER
Deputy Premier and
Minister of Finance
Regina, Saskatchewan
June 2026
The Honourable Jim Reiter
Deputy Premier and
Minister of Finance
We have the honour to present Volume 1 of the Public Accounts of the Government of Saskatchewan for the fiscal year ended March 31, 2026.
Respectfully submitted,
|
| |
| TRACEY L. SMITH | BRENT HEBERT | |
| Deputy Minister of Finance | Provincial Comptroller |
| Government of Saskatchewan Public Accounts 2025-26 | 3 | |
Introduction to the Public Accounts
Introduction to the Public Accounts
The 2025-26 Public Accounts of the Government of Saskatchewan (the government) are prepared in accordance with the Financial Administration Act, 1993 and consist of two volumes. The government is responsible for the integrity and objectivity of the information presented in these two volumes.
Volume 1
Financial Statement Discussion and Analysis provides users of the government’s Summary Financial Statements with an overview of the government’s performance by presenting comparative financial highlights and variance analysis. The information in the financial statement discussion and analysis should be read in conjunction with the Summary Financial Statements.
Summary Financial Statements provide an accounting of the full nature and extent of the financial affairs and resources of the government. This includes the financial results of the General Revenue Fund, Crown corporations, boards and other entities controlled by the government. A listing of all entities controlled by the government, collectively referred to as the government reporting entity, is provided in schedule 19 of the Summary Financial Statements.
Volume 2
Volume 2 contains the following unaudited financial information:
| • | General Revenue Fund schedules and details; |
| • | General Revenue Fund capital asset acquisitions schedule and details; |
| • | revolving fund expenditure details; |
| • | summary listing of payees who provided goods and services and capital assets of $50,000 or more to the General Revenue Fund and revolving funds during the fiscal year; |
| • | assets, liabilities and residual balances of pension plans and trust funds administered by the government; |
| • | remissions of taxes and fees; and |
| • | road-use fuel tax accountability revenues and expenditures. |
The Public Accounts, including the Compendiums, are available on the Government of Saskatchewan’s website.
The Compendium of Financial Statements contains the financial statements of various government agencies, boards, commissions, pension plans, special purpose funds and institutions, as well as Crown corporations which are accountable to Treasury Board.
The Compendium of Payee Details contains the payee details of all Summary Financial Statement entities, except Crown Investments Corporation of Saskatchewan and its subsidiaries.
In addition, the financial statements and payee details of Crown corporations and wholly-owned subsidiaries that are accountable to the Crown Investments Corporation of Saskatchewan (CIC) Board can be found on CIC’s website.
| 4 | Government of Saskatchewan Public Accounts 2025-26 | |
|
Financial Statement Discussion and Analysis
|
Financial Statement Discussion and Analysis
Financial Statement Discussion and Analysis
Highlights
Introduction
The Financial Statement Discussion and Analysis (FSD&A) provides an overview of the government’s financial performance and information to report on the government’s accountability for the resources entrusted to it. The FSD&A is intended to assist users of the Summary Financial Statements (SFS) in their assessment of the government’s fiscal health. The government is responsible for the integrity and objectivity of this discussion and analysis.
This information should be read in conjunction with the SFS which include the financial activities of all government-controlled entities, collectively referred to as the government reporting entity. A complete listing of the public sector entities included in the government reporting entity is provided in schedule 19 of the SFS.
Financial Results
In 2025-26, the government reports an operating deficit of $947 million, an increase of $699 million from the prior year operating deficit and a $960 million reduction from the budgeted surplus. The decline in results from both prior year and budget are largely due to significant expense increases that are offset by a lower increase in revenue.
Total expense is higher than both the prior year and budget by $976 million and $1.04 billion respectively. Most expense themes increased from both prior year and budget. Notable increases are in the health, protection of persons and property, economic development and education themes driven by higher demand for healthcare services and increased wildfire response and evacuation activities. These increases are offset by a significant reduction in agriculture expense due to improved crop yields resulting in lower crop insurance payouts.
Overall revenue is greater than both the prior year and budget by $278 million and $77 million respectively. The year-over-year increase is the result of increases in all revenue streams apart from other own-source revenue and net income from government business enterprises (GBEs). The most significant increase from budget was in other own-source revenue, which was offset by notable decreases in net income from GBEs and taxation revenue.
The government continues to invest in infrastructure with a $4.12 billion capital investment during 2026. This includes significant investments in schools, hospitals and roads, and investments in electricity generation, transmission and distribution assets and communication networks in the Crown sector.
The government’s overall financial position as at March 31, 2026 is an accumulated deficit of $2.39 billion.
| Government of Saskatchewan Public Accounts 2025-26 | 7 | |
Financial Statement Discussion and Analysis
Highlights
At a Glance
| Financial Results |
(millions of dollars)
| Increase (Decrease) | ||||||||||||||||||||
| 2026 | 2025 | from | ||||||||||||||||||
| Budget | Actual | Actual | Budget | 2025 Actual |
||||||||||||||||
| Revenue |
21,056 | 21,134 | 20,856 | 77 | 278 | |||||||||||||||
| Expense |
21,044 | 22,081 | 21,105 | 1,037 | 976 | |||||||||||||||
|
|
|
|
|
|
|
|
|
|
|
|||||||||||
| Operating (Deficit) Surplus |
12 | (947 | ) | (249 | ) | (960 | ) | 699 | ||||||||||||
|
|
|
|
|
|
|
|
|
|
|
|||||||||||
| Net Debt |
(16,815 | ) | (17,165 | ) | (15,627 | ) | 350 | 1,538 | ||||||||||||
|
|
|
|
|
|
|
|
|
|
|
|||||||||||
| Accumulated Deficit1 2 |
(1,760 | ) | (2,389 | ) | (1,629 | ) | 629 | 760 | ||||||||||||
|
|
|
|
|
|
|
|
|
|
|
|||||||||||
| 1 Comprised of: |
||||||||||||||||||||
| Accumulated operating deficit |
(1,744 | ) | (2,703 | ) | (1,756 | ) | 960 | 947 | ||||||||||||
| Accumulated remeasurement gains (losses) |
(17 | ) | 315 | 127 | 331 | 187 | ||||||||||||||
|
|
|
|
|
|
|
|
|
|
|
|||||||||||
| Accumulated Deficit |
(1,760 | ) | (2,389 | ) | (1,629 | ) | 629 | 760 | ||||||||||||
|
|
|
|
|
|
|
|
|
|
|
|||||||||||
| 2 | Restated for change in amortization accounting policy. See note 9 of the SFS. |
Totals may not add due to rounding.
| 8 | Government of Saskatchewan Public Accounts 2025-26 | |
Financial Statement Discussion and Analysis
Highlights
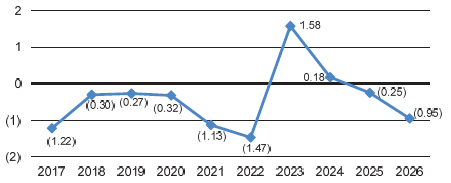
Operating (Deficit) Surplus
The operating (deficit) surplus represents the amount by which (expense exceeds revenue) revenue exceeds expense for the fiscal period.
| Operating Surplus (Deficit) | The 2026 SFS report an operating deficit of $947 million, an increase of $699 million from the $249 million deficit reported in the previous year and a $960 million reduction from the budgeted surplus of $12 million. The decline in results from both prior year and budget are largely due to significant expense increases that are offset by a lower increase in revenue.
The most significant expense increases from the prior year and budget are in the health, protection of persons and property, economic development and education themes, partially offset by a notable reduction in agriculture expense. Revenue increases from the prior year are significant in taxation, non-renewable resources and transfers from the federal government. These increases are offset by significant reductions in other own-source revenue and net income from GBEs. The increase from budget is the result of a significant increase in other own-source revenue offset by decreased net income from GBEs and taxation revenue. | |
|
(billions of dollars)
|
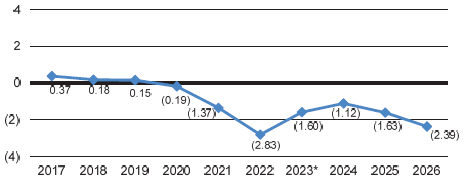
Accumulated (Deficit) Surplus
An accumulated (deficit) surplus represents a government’s reported net economic (shortfall) resources. An accumulated (deficit) surplus indicates that a government (requires) has additional resources to provide future services.
| Accumulated (Deficit) Surplus | At March 31, 2026, the government reports an accumulated deficit of $2.39 billion, higher than the prior year and budget by $760 million and $629 million respectively. The increases are primarily due to the current year operating deficit, partially offset by remeasurement gains. | |
|
(billions of dollars)
| ||
| * Beginning in 2023, accumulated (deficit) surplus includes accumulated remeasurement gains (losses). |
| Government of Saskatchewan Public Accounts 2025-26 | 9 | |
Financial Statement Discussion and Analysis
Highlights
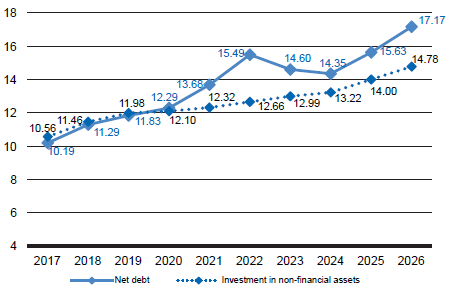
Net Debt
Net debt provides a measure of the future revenue that is required to pay for past transactions and events.
| Net Debt | The net debt at March 31, 2026 is $17.17 billion, an increase of $1.54 billion over the prior year. The year-over-year increase is primarily due to the operating deficit and net acquisition of tangible capital assets (TCAs) reported in the current year partially offset by remeasurement gains.
Net debt is a $350 million increase over budget, primarily due to the higher-than-budgeted current year operating deficit partially offset by lower-than-budgeted net acquisition of TCAs and higher-than-budgeted remeasurement gains. | |
|
(billions of dollars)
| ||
|
|
The net debt of the SFS is:
| • | the accumulated (deficit) surplus, representing the sum of all current and prior years’ operating results and accumulated remeasurements; and |
| • | the investment in non-financial assets, primarily representing the government’s investment in highways and facilities to deliver health and educational services. |
| Net Debt Components |
(millions of dollars)
| 2017 | 2018 | 2019 | 2020 | 2021 | 2022 | 2023 | 2024 | 2025 | 2026 | |||||||||||||||||||||||||||||||
| Accumulated (deficit) surplus |
372 | 176 | 155 | (191 | ) | (1,368 | ) | (2,832 | ) | (1,604 | ) | (1,124 | ) | (1,629 | ) | (2,389 | ) | |||||||||||||||||||||||
| Investment in non-financial assets |
(10,564 | ) | (11,464 | ) | (11,984 | ) | (12,098 | ) | (12,315 | ) | (12,656 | ) | (12,994 | ) | (13,223 | ) | (13,999 | ) | (14,777 | ) | ||||||||||||||||||||
|
|
|
|
|
|
|
|
|
|
|
|
|
|
|
|
|
|
|
|
|
|||||||||||||||||||||
| Net Debt |
(10,192 | ) | (11,288 | ) | (11,829 | ) | (12,289 | ) | (13,683 | ) | (15,488 | ) | (14,598 | ) | (14,347 | ) | (15,627 | ) | (17,165 | ) | ||||||||||||||||||||
|
|
|
|
|
|
|
|
|
|
|
|
|
|
|
|
|
|
|
|
|
|||||||||||||||||||||
Totals may not add due to rounding.
| 10 | Government of Saskatchewan Public Accounts 2025-26 | |
Financial Statement Discussion and Analysis
Highlights
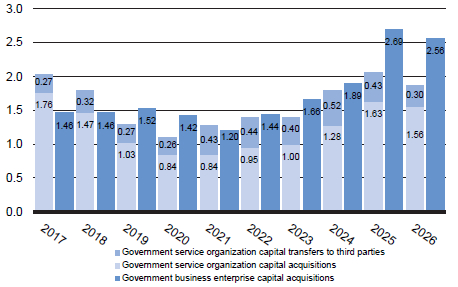
Investment in Infrastructure
The government invests in infrastructure by:
| • | investing in government-owned capital; and |
| • | providing transfers to third parties, including municipalities and universities, for capital purposes. |
| Investment in Infrastructure | During 2025-26, the government invested $4.12 billion in government- owned infrastructure: $2.56 billion for GBEs to build new and maintain existing infrastructure and $1.56 billion for new schools, hospitals, roads and other important infrastructure of government service organizations (GSOs). In addition, $299 million was provided to third parties to fund their capital needs.
Investment in government-owned infrastructure is up from the average of the previous nine years of $2.84 billion and is $558 million less than budget. | |
|
(billions of dollars)
| ||
|
|
Credit Rating
| Credit Ratings – March 2026 | The government obtains a credit rating from the three major credit rating agencies: Moody’s Ratings; S&P Global Ratings; and Morningstar DBRS. Saskatchewan currently has the highest credit rating among the Canadian provinces when the ratings from the three major agencies are considered. | |||||||||
| Rating Agency1 |
||||||||||
| Jurisdiction |
Moody’s Ratings |
S&P Global Ratings |
Morningstar DBRS | |||||||
| British Columbia |
Aa2 (neg) | A+ (neg) | AA (high) (neg) | |||||||
| Alberta |
Aa2 | AA- | AA | |||||||
| Saskatchewan |
Aa1 | AA | AA (low) | |||||||
| Manitoba |
Aa2 | A+ | A (high) | |||||||
| Ontario |
Aa3 | AA- | AA | |||||||
| Quebec |
Aa2 | A+ | AA (low) | |||||||
| New Brunswick |
Aa1 | A+ | A (high) | |||||||
| Nova Scotia |
Aa2 | A+ (neg) | A (high) | |||||||
| Prince Edward Island |
Aa2 | A | A | |||||||
| Newfoundland & Labrador |
A1 | A | A | |||||||
| Ratings reflect the latest credit ratings available at March 31, 2026.
1 The rating agencies assign letter ratings to borrowers. The major A bracket categories, in descending order of credit quality, are: AAA/Aaa; AA/Aa; A. The ‘1’, ‘2’, ‘3’, ‘high’, ‘low’, ‘-’, and ‘+’ modifiers show relative standing within the major categories with (pos)/(neg) representing a positive/negative outlook or trend. For example, AAA exceeds AA, Aa1 exceeds Aa2 and AA exceeds AA-. |
||||||||||
| Government of Saskatchewan Public Accounts 2025-26 | 11 | |
Financial Statement Discussion and Analysis
Assessment of Fiscal Health
A government’s fiscal management can be gauged through an assessment of its fiscal health in the context of the overall economic and financial environment. Fiscal health describes a government’s ability to meet its existing financial obligations with respect to its service commitments to the public and its financial commitments to creditors, employees and others. The assessment of the government’s fiscal health considers sustainability, flexibility and vulnerability on the basis of the following indicators:
Sustainability
| • | Accumulated (deficit) surplus to the province’s gross domestic product (GDP) |
| • | Net debt to the province’s GDP |
| • | Net debt to total revenue |
| • | Net debt per capita |
Flexibility
| • | Financing charges to total revenue |
| • | Own-source revenue to the province’s GDP |
Vulnerability
| • | Non-renewable resources revenue to total expense |
| • | Transfers from the federal government to total revenue |
| • | Foreign currency debt to net debt |
Sustainability
Sustainability is the degree to which a government can maintain its existing level of spending and meet its existing debt obligations.
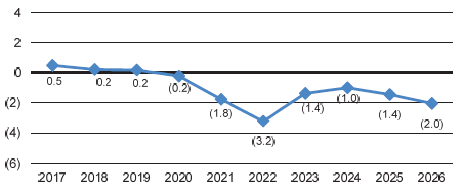
| Accumulated (Deficit) Surplus to the Province’s GDP | The overall decrease in this ratio over the previous 10 years is the result of a significant increase in the GDP and the return to an accumulated deficit position. The decline in 2021 and 2022 was primarily due to the adverse effects of the COVID-19 pandemic on government operations and the provincial economy. In 2022, record drought-related crop insurance claim payouts further adversely impacted the accumulated deficit. The improvement in the ratio in 2023 was the combination of growth in the GDP and a significant decrease in the accumulated deficit. The ratio remained reasonably constant through 2024 and 2025, reflecting economic stability and a relatively constant GDP. The current year decrease in the ratio is mainly due to the operating deficit, slightly offset by growth in the GDP. | |
|
(per cent)
The accumulated (deficit) surplus measures the sum of all current and prior years’ operating results and accumulated remeasurements. GDP is a measure of the value of the goods and services produced during a year, indicating the size of the provincial economy. GDP reflects the latest figures available for the current and prior years based on data produced by Statistics Canada. The indicator takes a long-term view of government finances and provides insight into the government’s fiscal strategy in the context of the economy. An increase in the ratio indicates that the government’s overall fiscal position has improved relative to the size of its economy. |
| 12 | Government of Saskatchewan Public Accounts 2025-26 | |
Financial Statement Discussion and Analysis
Assessment of Fiscal Health
Sustainability (continued)
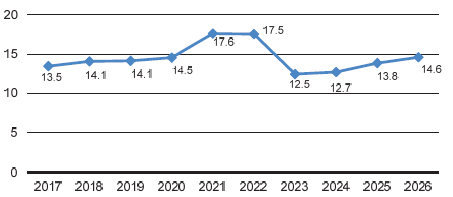
| Net Debt to the Province’s GDP | Over the last 10 years, significant infrastructure investment, combined with a growing GDP, has held this ratio reasonably constant. The rise in 2021 was primarily due to the adverse effects of the COVID-19 pandemic on government operations and the provincial economy. The decline in 2023 was a result of a continued strengthening of the economy, corresponding GDP growth and a reduction in net debt primarily due to the operating surplus. Operating deficits and significant infrastructure investments have contributed to the recent increases. | |
|
(per cent)
Net debt is the difference between a government’s financial assets and liabilities and represents the future revenue that is required to pay for past transactions and events. Net debt as a percentage of the province’s GDP provides a measure of the level of financial demands placed on the economy by the government’s spending and taxation policies. A lower net debt-to-GDP ratio is desired and indicates higher sustainability, as economic growth is outpacing growth in net debt. |
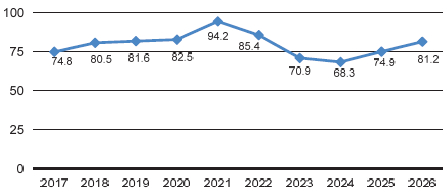
| Net Debt to Total Revenue | Over the last 10 years, the government’s net debt as a percentage of total revenue is relatively constant. The 2021 rise in this ratio was primarily due to the adverse effect of the COVID-19 pandemic on government operations and the provincial economy, negatively impacting both net debt and total revenue. Decreases in this ratio from 2022 to 2024 were primarily due to an overall improvement in the economy resulting in an increase in total revenue and decreases in net debt over the same period. 2025 and 2026 show an increase in the ratio reflecting significant investments in infrastructure and operating deficits. | |
|
(per cent)
Another measure of a government’s sustainability is net debt as a percentage of total revenue. Net debt provides a measure of the future revenue that is required to pay for past transactions and events. A lower net debt-to-revenue ratio indicates higher sustainability, as less time is required to eliminate net debt. |
| Government of Saskatchewan Public Accounts 2025-26 | 13 | |
Financial Statement Discussion and Analysis
Assessment of Fiscal Health
Sustainability (continued)
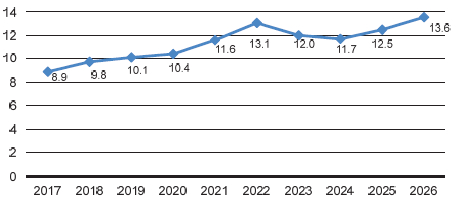
| Net Debt per Capita | The overall increase in this ratio over the last 10 years is the result of an increase in net debt that exceeds the growth in the province’s population over the same period. The rise in 2021 and 2022 was primarily due to the adverse effects of the COVID-19 pandemic with a further increase in 2022 primarily reflecting record drought-related crop insurance claim payouts. The 2023 decrease was due to the significant operating surplus, mainly the result of continued strengthening of the economy. The ratio remained relatively constant in 2024 with increases in 2025 and 2026, primarily reflecting the province’s significant investments in infrastructure and operating deficits. | |
|
(thousands of dollars)
Figures are based on Statistics Canada first quarter estimates representing the population at January 1 of each year.
Net debt per capita represents the net debt attributable to each Saskatchewan resident. A rise in this ratio indicates the debt burden per resident has grown. |
Flexibility
Flexibility is the extent to which a government has room to maneuver in terms of increasing its debt or tax burden on the economy.
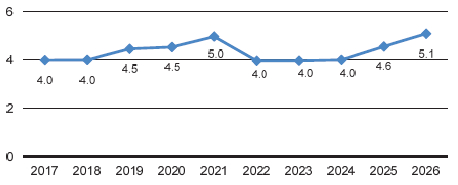
| Financing Charges to Total Revenue | This ratio has risen slightly over the last 10 years. The rise in 2021 was due to the impact of the COVID-19 pandemic that resulted in a decrease in total revenue and a corresponding increase in borrowing. After a return to pre-pandemic levels, the ratio remained consistent until 2024. The increases in 2025 and 2026 are primarily due to increased borrowing requirements to finance significant investment in infrastructure, combined with operating deficits.
In 2026, the government spent approximately 5.1 cents of each dollar of revenue on financing charges. | |
|
(per cent)
The financing charges to total revenue ratio, often referred to as the interest bite, indicates the proportion of provincial revenue that is required to pay financing charges and therefore is not available to pay for essential public services and programs. A lower ratio means that there is more money available to fund government services. |
| 14 | Government of Saskatchewan Public Accounts 2025-26 | |
Financial Statement Discussion and Analysis
Assessment of Fiscal Health
Flexibility (continued)
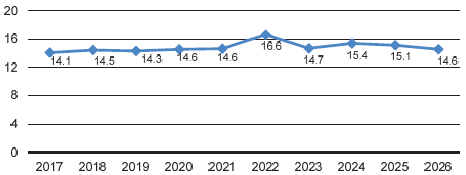
| Own-Source Revenue to the Province’s GDP | Over the last 10 years, own-source revenue as a percentage of GDP remains relatively constant, indicating the government has not significantly changed its demands on the provincial economy over that time. | |
|
(per cent)
This ratio measures the extent to which government is taking income out of the provincial economy, through taxation, non-renewable resources revenue or user fees. An increase in this ratio indicates that the government’s own-source revenue is growing faster than the economy, reducing the flexibility to increase revenue without slowing the growth of the provincial economy. |
Vulnerability
Vulnerability is the extent to which a government is dependent on, or exposed to, risks associated with sources of funding outside its control.
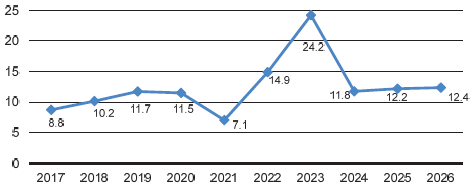
| Non-Renewable Resources Revenue to Total Expense | In Saskatchewan, non-renewable resources revenue is an important but volatile source of revenue.
The decline in this ratio in 2021 was primarily due to the adverse effect of the COVID-19 pandemic on the economy and government operations. In 2022 and 2023, this ratio increased significantly due to an overall improvement in the economy and a corresponding increase in non-renewable resources revenue and reduced expenses. In 2024 there was a significant decline in non-renewable resources revenue, mainly from potash sales and oil and gas surcharges, which indicated that the government was less reliant on non-renewable resources to fund expenses. The ratio remains relatively constant through 2026. | |
|
(per cent)
Non-renewable resources revenue is affected by price and sales factors which are beyond a government’s direct control. Non-renewable resources revenue as a percentage of total expense is therefore an indicator of the degree of vulnerability the government has as a result of reliance on the resource sector for revenue. Generally, a decreasing ratio indicates that a government is less reliant on non-renewable resources revenue to fund its expenses. |
| Government of Saskatchewan Public Accounts 2025-26 | 15 | |
Financial Statement Discussion and Analysis
Assessment of Fiscal Health
Vulnerability (continued)
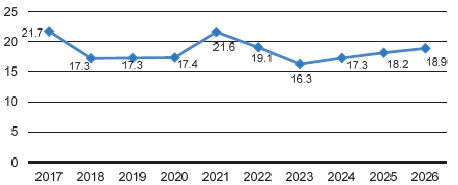
| Transfers from the Federal Government to Total Revenue | In 2026, 18.9 per cent of the government’s revenue came from the federal government with the remainder coming from Saskatchewan sources.
After the one-time infrastructure transfers from the federal government in 2017, the government’s ability to fund essential programs and services from own-source revenue remained fairly stable until 2020. The ratio increased in 2021 primarily due to the adverse impacts of the COVID-19 pandemic on the economy and the resulting support received from the federal government. The decreases in 2022 and 2023 were primarily due to increases in own-source revenue, mainly from non-renewable resources and taxation outpacing increases in transfers from the federal government. Increases since 2024 largely reflect higher federal health and social transfers. | |
|
(per cent)
The government does not control the amount of federal transfers that it receives each year. Transfers from the federal government as a percentage of total revenue is therefore an indicator of the degree of vulnerability the government has as a result of reliance on the federal government for revenue. Generally, a decreasing ratio indicates that a government is less reliant on federal transfers to fund its expenses. |
| Foreign Currency Debt to Net Debt | ||
|
The ratio of foreign currency debt to net debt is an indicator of the degree of vulnerability a government has to currency rate fluctuations. Where the government holds debt that is issued in foreign currencies it uses cross-currency swaps, a hedging strategy, to effectively convert this debt to Canadian dollar debt. At March 31, 2026, this ratio is nil due to the government’s hedging strategies. Over the last 10 years, exposure to currency rate fluctuations on foreign currency debt has been minimal. Decreasing this exposure through the use of hedging activities mitigates the risk of debt and financing charges changing due to changes in foreign currency rates. |
| 16 | Government of Saskatchewan Public Accounts 2025-26 | |
Financial Statement Discussion and Analysis
Details
Revenue
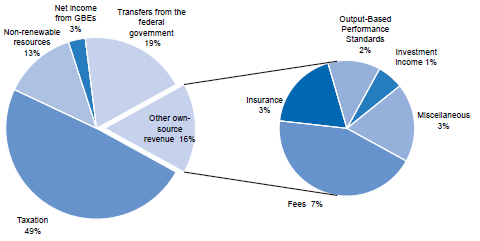
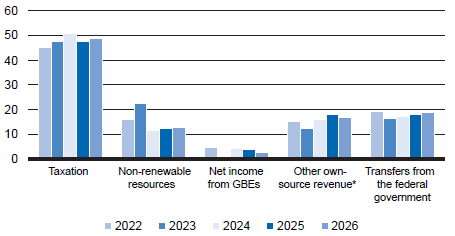
Total revenue is $21.13 billion in 2026, 81.1 per cent of which represents own-source revenue, with the remaining 18.9 per cent being transfers from the federal government.
| Revenue by Source – 2026 ($21.13 billion) | ||
|
(per cent)
|
| Revenue by Source – Percentage of Total Revenue | ||
|
(per cent)
* In 2026, key components of other own-source revenue include fees (7%), insurance (3%), Output-Based Performance Standards (2%) and investment income (1%). |
| Government of Saskatchewan Public Accounts 2025-26 | 17 | |
Financial Statement Discussion and Analysis
Details
Revenue (continued)
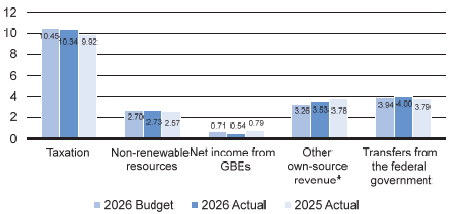
| Revenue by Source – Comparison to Budget and Prior Year | Total revenue of $21.13 billion in 2026 represents a year-over-year increase of $278 million, or 1.3 per cent, and an actual-to-budget increase of $77 million, or 0.4 per cent.
The year-over-year increase is the result of increases in all revenue streams except for other own-source revenue and net income from GBEs.
The most significant increase from budget was in other own-source revenue, which was offset by notable decreases in net income from GBEs and taxation revenue. | |
|
(billions of dollars)
* In 2026 Actual, key components of other own-source revenue include fees ($1.50 billion), insurance ($545 million), Output-Based Performance Standards ($489 million) and investment income ($325 million). |
| 18 | Government of Saskatchewan Public Accounts 2025-26 | |
Financial Statement Discussion and Analysis
Details
Revenue (continued)
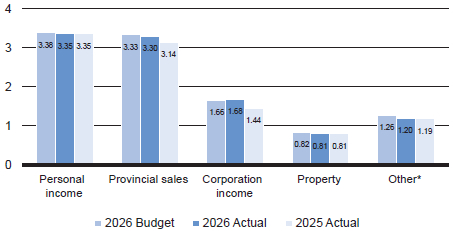
| Taxation Revenue – Comparison to Budget and Prior Year | Taxation revenue is $10.34 billion in 2026, an increase of $413 million, or 4.2 per cent, from 2025 and a decrease of $114 million, or 1.1 per cent, compared to budget. The increase from prior year is primarily due to significant increases in corporation income and provincial sales taxes. The decrease from budget is largely due to lower-than-expected revenue in all taxation categories except for corporation income tax. | |
|
(billions of dollars)
* In 2026 Actual, key components of other include fuel ($498 million), insurance premiums ($235 million), corporation capital ($188 million), tobacco ($113 million) and liquor consumption ($102 million). |
Personal income tax

The actual-to-budget decrease is primarily due to:
| • | lower-than-expected compensation growth. |
This decrease is partially offset by:
| • | an unbudgeted prior-year adjustment payment. |
The increase from the prior year is nominal.
Provincial sales tax

The year-over-year increase is primarily due to:
| • | continued growth in the Saskatchewan economy, particularly in the retail, service and construction sectors; and |
| • | population growth. |
The actual-to-budget decrease is primarily due to:
| • | lower-than-anticipated growth in personal spending, business activity and capital investments. |
Corporation income tax

The year-over-year and actual-to-budget increases are primarily due to:
| • | lower-than-expected use of corporate tax credits; and |
| • | greater-than-expected 2023 taxpayer assessments resulting in a positive prior year adjustment. |
The actual-to-budget increase is partially offset by:
| • | an unexpected decline in the province’s share of the national tax base. |
Property tax

The actual-to-budget decrease is primarily due to:
| • | lower-than-expected tax base growth. |
The increase from the prior year is nominal.
| Government of Saskatchewan Public Accounts 2025-26 | 19 | |
Financial Statement Discussion and Analysis
Details
Revenue (continued)
Other tax (including fuel, insurance premiums, corporation capital, tobacco and other miscellaneous tax)

The year-over-year increase is primarily due to:
| • | increased corporation capital tax, reflecting higher capital spending by Crown corporations. |
The actual-to-budget decrease is primarily due to:
| • | lower-than-expected fuel tax due to lower-than-anticipated gasoline and diesel consumption; and |
| • | lower tobacco tax primarily due to lower-than-expected consumption of legal tobacco products. |
| 20 | Government of Saskatchewan Public Accounts 2025-26 | |
Financial Statement Discussion and Analysis
Details
Revenue (continued)
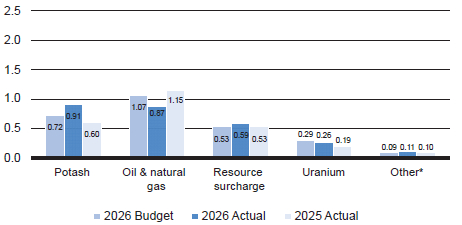
| Non-Renewable Resources Revenue – Comparison to Budget and Prior Year | In 2026, non-renewable resources revenue is $2.73 billion, an increase of $159 million, or 6.2 per cent, over 2025 and $33 million, or 1.2 per cent, over budget. The increases from both the prior year and budget are largely attributable to potash revenue, partially offset by a decrease in oil and natural gas revenue. | |
|
(billions of dollars)
* In 2026 Actual, a key component of other is mineral disposition public offerings ($68 million).
|
Potash

The year-over-year and actual-to-budget increases are primarily due to:
| • | higher realized prices across all major markets. |
These increases are partially offset by:
| • | an increase in the average exchange rate. |
The year-over-year increase is also due to:
| • | an increase in sales volume. |
Oil & natural gas

The year-over-year and actual-to-budget decreases are primarily due to:
| • | decreases in oil production and the average West Texas Intermediate (WTI) oil price; |
| • | a higher average exchange rate; and |
| • | a decrease in the average royalty rate. |
These decreases are partially offset by:
| • | a favourable decrease in the light-heavy oil blend differential. |
Resource surcharge

The year-over-year and actual-to-budget increases are primarily due to:
| • | increases in the potash and uranium sectors, primarily due to higher prices and sales volumes. |
These increases are partially offset by:
| • | a decrease in the oil and gas sector, reflecting lower average WTI oil prices. |
Uranium

The year-over-year increase is primarily due to:
| • | higher uranium prices and record sales volumes. |
The actual-to-budget decrease is primarily due to:
| • | higher-than-anticipated operating and capital costs at mine sites. |
Other non-renewable resources

The year-over-year and actual-to-budget increases are primarily due to:
| • | an increase in mineral disposition public offerings due to higher competition for oil and gas rights. |
| Government of Saskatchewan Public Accounts 2025-26 | 21 | |
Financial Statement Discussion and Analysis
Details
Revenue (continued)
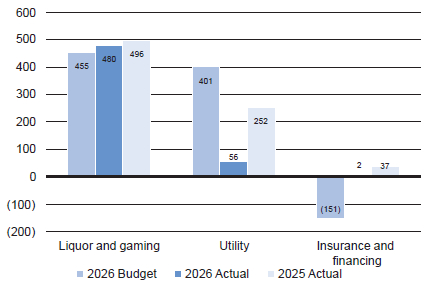
| Net Income from GBEs – Comparison to Budget and Prior Year | Net income from GBEs is $537 million in 2026, a decrease of $247 million, or 31.5 per cent, from 2025 due to decreases in all sectors. The decrease of $168 million, or 23.8 per cent, from budget is primarily due to a decrease in the utility sector, partially offset by increases in the insurance and financing and liquor and gaming sectors. | |
|
(millions of dollars)
|
Liquor and gaming

The year-over-year and actual-to-budget changes are primarily due to:
| • | increased gaming profits mainly from VLT and casino operations due to favourable economic conditions. |
These increases are partially offset by:
| • | a decrease in wholesale liquor sales. |
The year-over-year decrease is also due to:
| • | a decrease in auctioned permits for private liquor stores due to completion of auctions in the prior year. |
Utility

The year-over-year and actual-to-budget decreases are primarily due to:
| • | the discontinuation of carbon charge rate rider collections; |
| • | increased Output-Based Performance Standards expense resulting from higher rates and increased gas and coal generation volumes; |
| • | greater operating and maintenance expenses primarily related to power generation facility overhauls, inflationary pressures and continued implementation of enterprise software systems; and |
| • | increased financing charges due to higher interest rates on long term borrowing and lower debt retirement fund earnings. |
These decreases are partially offset by:
| • | new provincial rate affordability grant funding; |
| • | increased customer contributions; |
| • | higher export electricity sales due to opportunities to sell south of the border; and |
| • | growth in sales of telecommunication wireless network services and equipment and fixed broadband and data services. |
| 22 | Government of Saskatchewan Public Accounts 2025-26 | |
Financial Statement Discussion and Analysis
Details
Revenue (continued)
Utility (continued)
The year-over-year decreases are also due to:
| • | an increase in amortization expense associated with ongoing capital additions including spending on 5G implementation and expansion of the province’s fibre network; and |
| • | increased fuel and purchased power costs due to higher prices and generation volumes. |
These decreases are partially offset by:
| • | higher provincial electricity sales due to an increase in volumes and rate increases; and |
| • | an increase in Clean Electricity Transition Grant funding for eligible clean power initiatives. |
The actual-to-budget decreases are also due to:
| • | lower-than-expected sales of telecommunication wireless network services and equipment and fixed broadband and data services; and |
| • | lower-than-budgeted provincial electricity sales due to lower-than-budgeted volumes. |
These decreases are partially offset by:
| • | lower-than-anticipated spending related to business-grade communication system sales. |
Insurance and financing

The year-over-year decrease is primarily due to:
| • | a decline in market returns on fixed income and equity investments; partially offset by |
| • | insurance premium growth in farm and personal lines. |
The actual-to-budget increase is primarily due to:
| • | higher-than-budgeted market returns on fixed income and equity investments; partially offset by |
| • | lower-than-anticipated premium growth in farm and personal lines. |
The year-over-year and actual-to-budget results also increased due to:
| • | a decrease in insurance service costs due to favourable discounting impacts from rising interest rates; |
| • | increased auto premiums due to an increase in the number of insured vehicles and higher premium rates; and |
| • | increased employer payrolls. |
These increases are partially offset by:
| • | increased workers’ compensation claims costs, mainly due to changes in actuarial assumptions; and |
| • | an increase in catastrophic claims expense mainly driven by wildfires during the summer. |
| Government of Saskatchewan Public Accounts 2025-26 | 23 | |
Financial Statement Discussion and Analysis
Details
Revenue (continued)
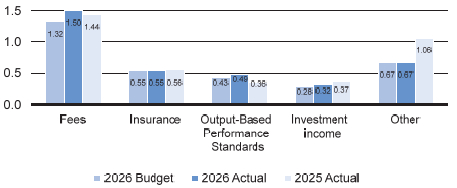
| Other Own-Source Revenue – Comparison to Budget and Prior Year | Other own-source revenue is $3.53 billion in 2026, a decrease of $250 million, or 6.6 per cent, from 2025 and an increase of $268 million, or 8.2 per cent, when compared to budget. The year-over-year decrease is primarily due to the impact of tobacco litigation proceeds recorded in the prior year. The increase over budget is primarily due to greater-than-expected fees revenue in the health and education sectors. | |
|
(billions of dollars)
|
Fees

The year-over-year and actual-to-budget increases are primarily due to:
| • | increased healthcare fees due to higher service volumes and rate increases, mainly in supportive and long-term care and out-of-province services; |
| • | growth in tuition revenue in various Boards of Education primarily due to increased First Nations student enrollment; |
| • | increased recoveries related to wildfire response; and |
| • | increased housing rental revenue due to higher occupancy rates. |
These increases are partially offset by:
| • | a decline in forestry revenue, largely attributable to tariff-related uncertainty. |
Insurance

The year-over-year and actual-to-budget decreases are primarily due to:
| • | a decrease in crop insurance premiums paid by producers due to fewer insured acres. |
Output-Based Performance Standards

The year-over-year and actual-to-budget increases are due to:
| • | an increase in assessed compliance obligations from both the electricity and industrial sectors resulting from higher rates. |
Investment Income

The year-over-year decrease is primarily due to:
| • | a decrease in returns on investments primarily due to lower interest rates, partially offset by an increase in sinking fund earnings. |
The actual-to-budget increase is primarily due to:
| • | higher-than-budgeted interest earned on investments, partially offset by lower-than-expected sinking fund earnings. |
| 24 | Government of Saskatchewan Public Accounts 2025-26 | |
Financial Statement Discussion and Analysis
Details
Revenue (continued)
Other (including transfers from other governments and miscellaneous)

The year-over-year decrease is primarily due to:
| • | the impact of tobacco litigation proceeds recorded in the prior year. |
This decrease is partially offset by:
| • | increased gaming profits. |
The increase from budget is nominal.
| Government of Saskatchewan Public Accounts 2025-26 | 25 | |
Financial Statement Discussion and Analysis
Details
Revenue (continued)
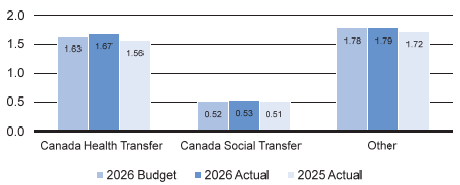
| Transfers from the Federal Government – Comparison to Budget and Prior Year | Federal transfers were $4.00 billion in 2026, an increase of $203 million, or 5.4 per cent, compared to 2025 and $58 million, or 1.5 per cent, when compared to budget. The increases from both the prior year and budget are mainly due to an increase in healthcare and agricultural income stability funding. | |
|
(billions of dollars)
|
Canada Health Transfer

The year-over-year and actual-to-budget increases are primarily due to:
| • | an adjustment for changes in Saskatchewan’s share of the national population. |
The year-over-year increase is also due to:
| • | a legislated annual increase in the national allocation. |
Canada Social Transfer

The year-over-year and actual-to-budget increases are primarily due to:
| • | an adjustment for changes in Saskatchewan’s share of the national population. |
The year-over-year increase is also due to:
| • | a legislated annual increase in the national allocation. |
Other transfers from the federal government

The year-over-year and actual-to-budget increases are primarily due to:
| • | an increase in AgriStability funding, primarily due to lower commodity prices and production margins; |
| • | an increase in disaster assistance funding; and |
| • | an increase for French minority education and French second language instruction reflecting a change in revenue recognition. |
These increases are partially offset by:
| • | a decrease in federal reimbursements through the Investing in Canada Infrastructure program; and |
| • | a decrease in federal funding for crop insurance due to decreased premiums paid by producers resulting from fewer insured acres. |
The year-over-year increases are also partially offset by:
| • | a decrease in funding related to the National Housing Strategy and Social Housing agreements; and |
| • | a decrease in funding for the National Trade Corridors Fund. |
The actual-to-budget increases are also due to:
| • | funding for development of a rare earth processing facility; partially offset by |
| • | a mine site remediation lawsuit remaining unresolved. |
| 26 | Government of Saskatchewan Public Accounts 2025-26 | |
Financial Statement Discussion and Analysis
Details
Expense
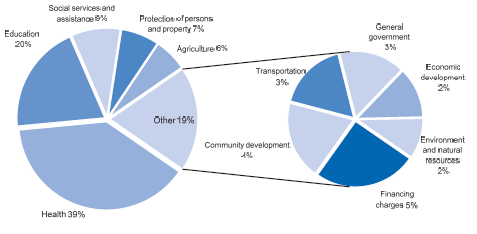
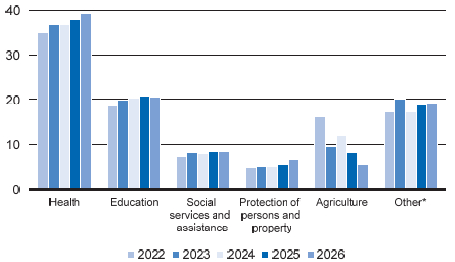
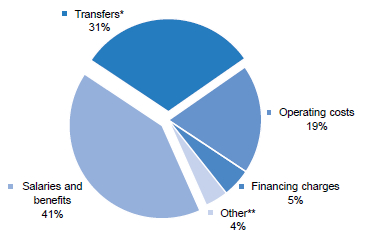
Total expense was $22.08 billion in 2026, 59.8 per cent of which represents spending in the health and education themes. The SFS report expense by theme and by object, or major type of expense such as salaries and benefits, transfers and operating costs.
| Expense by Theme – 2026 ($22.08 billion) | ||
|
(per cent)
|
| Expense by Theme – Percentage of Total Expense | ||
|
(per cent)
| ||
| * In 2026, key components of other include financing charges (5%), community development (4%), transportation (3%), general government (3%), economic development (2%) and environment and natural resources (2%). |
| Government of Saskatchewan Public Accounts 2025-26 | 27 | |
Financial Statement Discussion and Analysis
Details
Expense (continued)
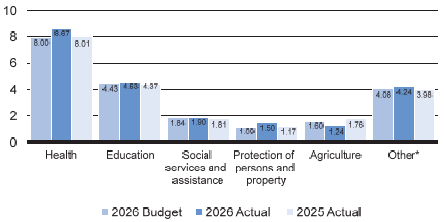
| Expense by Theme – Comparison to Budget and Prior Year | Total expenses are $22.08 billion in 2026. This represents an increase of $976 million, or 4.6 per cent, over the prior year and $1.04 billion, or 4.9 per cent, over budget. Most expense themes increased from both prior year and budget. Notable increases are in the health, protection of persons and property, economic development and education themes which are offset by a significant reduction in agriculture expense. The most significant increases are driven by higher demand for healthcare services and increased wildfire response and evacuation activities. The decrease in agriculture is due to improved crop yields resulting in lower crop insurance payouts. | |
|
(billions of dollars)
| ||
| * In 2026 Actual, key components of other include financing charges ($1.07 billion), community development ($815 million), transportation ($723 million), general government ($685 million), economic development ($527 million) and environment and natural resources ($422 million). |
Health

The year-over-year and actual-to-budget increases are primarily due to:
| • | expanded services and increased demand for services resulting in higher compensation costs across the health system, as well as volume and inflationary increases for other operating costs, including drugs, medical supplies and information technology services; |
| • | estimated retroactive pay increases resulting from collective bargaining with the health provider unions; |
| • | the write-down of system development costs; |
| • | higher physician compensation due to utilization increases and negotiated salary increases; |
| • | expanded physician training capacity at the College of Medicine and the settlement of the Resident Doctors of Saskatchewan agreement; and |
| • | higher spending in the Saskatchewan Prescription Drug Plan, which was lower than budgeted, as well as increases in other extended benefit plans relative to budget and the prior year. |
The year-over-year increases are partially offset by:
| • | legal costs incurred in the prior year associated with the resolution of tobacco litigation; and |
| • | a one-time grant paid to Ronald McDonald House Charities in the prior year. |
Education

The year-over-year and actual-to-budget increases are primarily due to:
| • | increased costs in Boards of Education related to collective bargaining agreement costs, investments in a specialized classroom pilot project and increased spending on school maintenance; and |
| • | settlement of a residential school claim. |
These increases are partially offset by:
| • | a decrease in Teachers’ Superannuation Plan pension and benefits costs, which are higher-than-budgeted, primarily due to changes in actuarial assumptions; |
| • | decreased post-secondary costs primarily due to: |
| • | decreased capital funding; |
| • | a reduction in international enrollment, and in Skills Training and Adult Education programs; partially offset by |
| • | the expansion of programming to accelerate growth of the healthcare workforce. |
The year-over-year increase is also due to:
| • | increased costs related to online delivery of K-12 education and the new National School Food Program; and |
| • | increased spending related to the Canada-Wide Early Learning and Child Care Agreement. |
| 28 | Government of Saskatchewan Public Accounts 2025-26 | |
Financial Statement Discussion and Analysis
Details
Expense (continued)
Social services and assistance

The year-over-year and actual-to-budget increases are primarily due to:
| • | increased spending in Saskatchewan Income Assistance programs, primarily due to higher utilization, expanded eligibility and rate increases for benefit payments; |
| • | increased spending for disability and child and family programs, primarily due to higher utilization and increased funding to community-based organizations. |
The actual-to-budget increases are partially offset by:
| • | lower-than-budgeted social housing costs related to the Canada Community Housing Initiative. |
Protection of persons and property

The year-over-year and actual-to-budget increases are primarily due to:
| • | a significant increase in costs associated with wildfire response and evacuation activities; |
| • | increased costs in correctional facilities primarily driven by higher inmate counts; and |
| • | increased costs for protective services, mainly for the RCMP Provincial Police Services agreement. |
Agriculture

The year-over-year and actual-to-budget decreases are primarily due to:
| • | lower crop insurance indemnities paid to producers due to higher crop yields across the province. |
This decrease is partially offset by:
| • | higher AgriStability benefits primarily due to lower commodity prices resulting in lower program year margins compared to the historical average. |
The actual-to-budget decrease is also partially offset by:
| • | increased payments under the Farm and Ranch Water Infrastructure Program. |
Other expense themes (including financing charges, community development, transportation, general government, economic development and environment and natural resources)

The year-over-year and actual-to-budget increases are primarily due to:
| • | a new rate affordability grant to SaskPower; |
| • | increased pension costs for the Public Service Superannuation Plan primarily due to changes in mortality assumption and higher cash payments for the Public Employees’ Pension Plan; |
| • | increased First Nations and Métis gaming agreement transfers; |
| • | an increase to the provision for disability insurance benefits primarily due to changes in actuarial assumptions for discount and mortality rates; |
| • | an increase in allowance for doubtful accounts; |
| • | an increase in tax credits for research and development; and |
| • | increased utilization of the secondary suite incentive program. |
These increases are partially offset by:
| • | decreased infrastructure funding to municipalities through the Investing in Canada Infrastructure Program due to large capital projects not progressing as anticipated. |
The year-over-year increase is also due to:
| • | an increase in financing charges primarily due to increased borrowing requirements and higher refinancing rates; |
| • | an increase in the Clean Electricity Transition Grant; and |
| • | increased urban and rural revenue sharing grants. |
These increases are partially offset by:
| • | the recognition of certain environmental levy obligations in the prior year; |
| • | prior year spending for rail infrastructure upgrades; |
| • | costs for the election in the prior year; and |
| • | prior year targeted funding for economic diversification. |
The actual-to-budget increase is also offset by:
| • | lower-than-budgeted grants for the support of initiatives to reduce greenhouse gas emissions. |
| Government of Saskatchewan Public Accounts 2025-26 | 29 | |
Financial Statement Discussion and Analysis
Details
Expense (continued)
| Expense by Object – 2026 ($22.08 billion) | ||
|
(per cent)
| ||
| * Transfers are provided to third parties for salaries, capital and other costs. ** The key component of other is amortization of capital assets. |
| Expense by Object – Percentage of Total Expense | ||
|
(per cent)
| ||
| * Transfers are provided to third parties for salaries, capital and other costs. ** The key component of other is amortization of capital assets. |
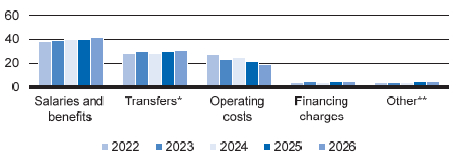
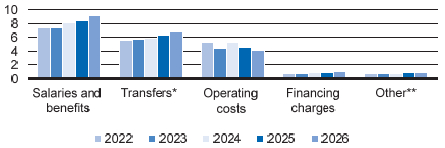
| Expense by Object | Most categories had year-over-year increases. The most significant increases are in salaries and benefits of $701 million and transfers of $585 million. These increases are partially offset by a decrease in operating costs of $429 million. | |
|
(billions of dollars)
| ||
| * Transfers are provided to third parties for salaries, capital and other costs. ** The key component of other is amortization of capital assets. |
| 30 | Government of Saskatchewan Public Accounts 2025-26 | |
Financial Statement Discussion and Analysis
Details
Expense (continued)
| Financing Charges | Financing charges have increased in recent years mainly due to an increase in debt financing for the replacement of aging infrastructure, the building of new capacity to meet the demands of the province’s growing population and recent operating deficits.
The average effective interest rate on gross debt during 2026 was 3.5 per cent (2025 - 3.5 per cent). Pension interest expense is a function of the unfunded pension liability and the interest costs that are based on the government’s borrowing rates. The average effective interest rate on the unfunded pension liability during 2026 was 3.2 per cent (2025 - 3.0 per cent). Interest on P3 obligations, ranging from 4.7 to 5.7 per cent, reflects the weighted average cost of capital specific to each P3 arrangement. | |
|
(millions of dollars)
| ||
| The Statement of Operations reports financing charges the government incurs related to its general debt, unfunded pension liability and obligations under long-term financing arrangements (P3 obligations) but does not include GBE financing charges on GBE specific debt. GBE financing charges, on both GBE general debt and GBE specific debt, are included in the net income from GBEs reported on the Statement of Operations and disclosed in schedule 3 of the SFS. For general debt, financing charges are determined by the amount of general debt and the interest rate attached to that debt. |
| Government of Saskatchewan Public Accounts 2025-26 | 31 | |
Financial Statement Discussion and Analysis
Details
Financial Assets
Financial assets represent the amount of resources available to the government that can be converted to cash to meet obligations or fund operations.
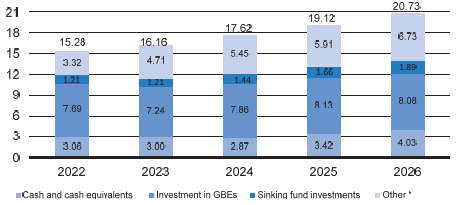
| Financial Assets | From 2022 to 2026, financial assets increased by $5.45 billion. This is primarily the result of a $2.00 billion increase in investments, a $1.01 billion increase in accounts receivable and a $978 million increase in cash and cash equivalents. | |
|
(billions of dollars)
| ||
| * At March 31, 2026, primarily accounts receivable ($3.30 billion), portfolio investments ($1.79 billion) and loans receivable ($1.37 billion). |
Liabilities
Liabilities represent the obligations the government has to others arising from past transactions or events.
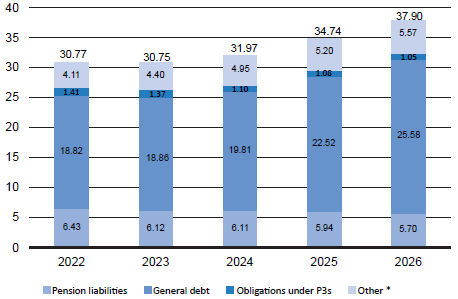
| Liabilities | From 2022 to 2026, liabilities increased by $7.13 billion. This is primarily the result of a $6.76 billion increase in general debt. | |
|
(billions of dollars)
| ||
| * At March 31, 2026, primarily accounts payable and accrued liabilities ($4.78 billion). |
| 32 | Government of Saskatchewan Public Accounts 2025-26 | |
Financial Statement Discussion and Analysis
Details
Liabilities (continued)
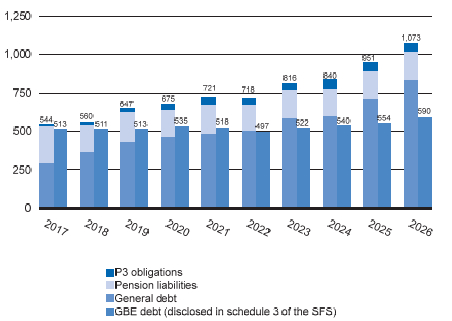
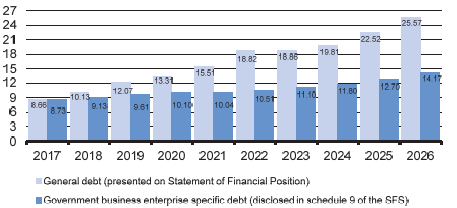
| Public Debt | At March 31, 2026, the SFS report general debt of $25.57 billion and GBE specific debt of $14.17 billion. General debt has increased over the past nine years. Until 2021, these increases helped to finance the replacement of aging infrastructure and build new capacity to meet the demands of a growing population. The increases in 2021 and 2022 were primarily a combination of COVID-related economic stimulus spending on infrastructure and borrowing to cover COVID-related revenue shortfalls and incremental expenses. The increases from 2024 to 2026 primarily represent borrowing for the Saskatchewan Capital Plan for investment in infrastructure for the growing needs of the province and increased requirements for the recent operating deficits. | |
|
(billions of dollars)
| ||
| Public debt consists of:
• general debt, which is:
• debt issued by the General Revenue Fund (GRF) and other GSOs; and
• debt issued by the GRF and subsequently loaned to GBEs; and
• GBE specific debt, which is debt issued by GBEs or debt issued by the GRF specifically on behalf of GBEs where the government expects to realize the receivables from the GBEs and settle the external debt simultaneously.
The general debt on the Statement of Financial Position does not include GBE specific debt. GBE specific debt is included in the Investment in GBEs reported on the Statement of Financial Position and disclosed in schedule 9 of the SFS.
|
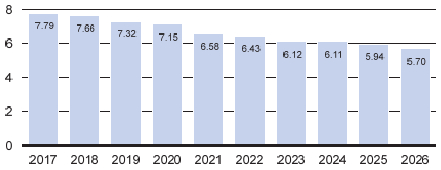
| Pension Liabilities | At March 31, 2026, the SFS report pension liabilities of $5.70 billion, a decrease of $2.09 billion since 2017. The decreases over the past nine years represent the amount by which payments to the pension plans and retirees have exceeded pension expense. | |
|
(billions of dollars)
| ||
|
Pension liabilities represent the future obligations for the government’s defined benefit pension plans. The pension liability fluctuates with changes in actuarial assumptions such as interest and inflation rates and life expectancy. The government limited its pension exposure over 45 years ago when it closed the main defined benefit plans to new members and introduced defined contribution plans. There is no liability exposure for the government under defined contribution plans. |
| Government of Saskatchewan Public Accounts 2025-26 | 33 | |
Financial Statement Discussion and Analysis
Details
Liabilities (continued)
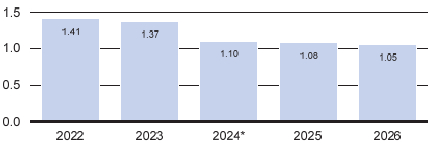
| Obligations under Long-Term Financing Arrangements | The government is party to five P3 arrangements (as disclosed in schedule 10 of the SFS). All five P3 projects are operational. | |
|
(billions of dollars)
| ||
| * In 2023-24, a new accounting standard for P3s was adopted, resulting in a change to discount rates and a corresponding decrease of $262 million in the obligations under long-term financing arrangements.
Obligations under long-term financing arrangements represent the government’s liability for public private partnerships (P3s). P3 obligations increase as the related assets are built (percentage of completion basis), and are reduced as payments are made to the P3 partner. |
Non-Financial Assets
Non-financial assets typically represent resources that the government can use to provide services in the future. Non-financial assets primarily consist of capital assets, but also include inventories held for consumption and prepaid expenses.
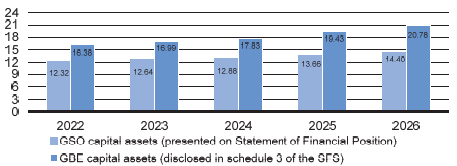
| Net Book Value of Capital Assets | The net book value of capital assets recognized by the government has steadily increased over the last five years, indicating that the government has been acquiring new, or replacing existing, capital assets.
Acquisition of capital assets in 2026 is $4.12 billion, $2.56 billion acquired by GBEs and $1.56 billion by GSOs. The investment in capital assets made by GSOs is primarily in the transportation, health and education sectors mainly for land, buildings and improvements ($791 million) as well as road, bridge and water management assets ($478 million). GBEs continue to replace aging infrastructure and invest in capital projects to meet the demand for growth. | |
|
(billions of dollars)
| ||
| The Statement of Financial Position reports a net book value of capital assets recognized by GSOs and does not include the capital assets recognized by GBEs. Capital assets recognized by GBEs are included in the investment in GBEs reported on the Statement of Financial Position and disclosed in schedule 3 of the SFS. The net book value represents the original cost of capital assets net of accumulated amortization, disposals and write-downs in value. |
| 34 | Government of Saskatchewan Public Accounts 2025-26 | |
Financial Statement Discussion and Analysis
Details
Cash Flow
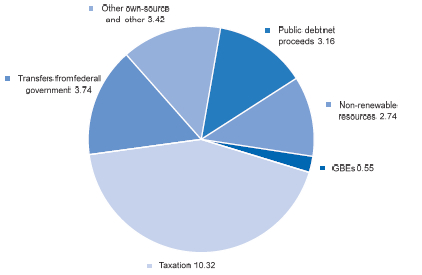
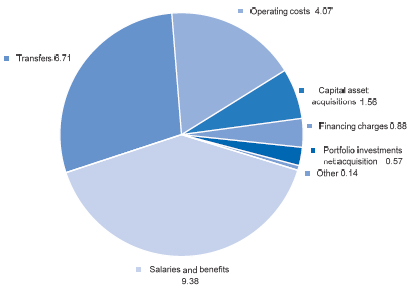
The Statement of Cash Flow reports on the sources and uses of cash and cash equivalents during the year. During the year, the government’s overall cash position increased by $614 million, from $3.42 billion in 2025 to $4.03 billion in 2026.
| Sources of Cash and Cash Equivalents | The primary source of cash is $10.32 billion from taxation. Other significant sources of cash are $3.74 billion from transfers from the federal government, $3.42 billion from other own-source and other and $3.16 billion from public debt. | |
|
(billions of dollars)
|
| Uses of Cash and Cash Equivalents | The most significant use of cash is $9.38 billion for salaries and benefits, largely for frontline service providers in the health and education sectors. Another significant use of cash is $6.71 billion for transfers mainly in the health, social services and assistance, and environment themes. | |
|
(billions of dollars)
|
| Government of Saskatchewan Public Accounts 2025-26 | 35 | |
Financial Statement Discussion and Analysis
Risks and Uncertainties
The government is subject to risks and uncertainties that arise from variables which the government cannot directly control. These risks and uncertainties include:
| • | changes in economic factors such as economic growth or decline, commodity and non-renewable resource prices, inflation, interest rates, marketplace competition, trade barriers, population change, personal income and retail sales; |
| • | exposure to interest rate risk, foreign exchange rate risk, price risk, credit risk and liquidity risk (see note 4 of the SFS); |
| • | changes in transfers from the federal government; |
| • | utilization of government services, such as insurance, health care and social services; |
| • | volatility in the pension liability due to external factors such as interest and inflation rates and actuarially determined assumptions of future events; |
| • | other unforeseen developments including unusual weather patterns and natural and other disasters; |
| • | criminal or malicious attacks, both cyber and physical in nature, potentially resulting in business interruption, privacy breach and loss of, or damage to, information, facilities and equipment; |
| • | identification and quantification of environmental liabilities; |
| • | supply chain disruptions and other factors that could hinder the safe delivery of products and services; |
| • | outcomes from litigation, arbitration and negotiations with third parties; |
| • | changes in reported results where actual experience may differ from initial estimates as discussed in note 3 of the SFS; and |
| • | changes in accounting standards. |
Recognizing that Saskatchewan is reliant on the revenue from non-renewable resources and that the Province’s financial results can be influenced by other external factors, the government takes a prudent approach in developing its budget assumptions for macroeconomic variables and non-renewable resources prices. The government uses a number of forecasts from national forecasting agencies and banks, private industry and private sector analysts when developing the underlying assumptions for fiscal forecasts both on budget day and throughout the fiscal year.
The fiscal impact of changes in the underlying economic assumptions, including non-renewable resources prices, are estimated on a regular basis to quantify the risk associated with each forecast assumption. By understanding the size of the risk inherent in the fiscal projections, the government is better able to make sound financial decisions.
Finally, for the government to meet the challenges of growth and remain competitive, attention is directed towards maintaining and investing in the Province’s infrastructure to support that growth now and in the future.
| 36 | Government of Saskatchewan Public Accounts 2025-26 | |
| Summary Financial Statements |
Summary Financial Statements
Responsibility for the Summary Financial Statements
The government is responsible for the Summary Financial Statements. The government maintains a system of accounting and administrative controls to ensure that accurate and reliable financial statements are prepared and to obtain reasonable assurance that transactions are authorized, assets are safeguarded, and financial records are maintained.
The Provincial Comptroller prepares these statements in accordance with generally accepted accounting principles for the public sector, using the government’s best estimates and judgement when appropriate. He uses information from the accounts of the General Revenue Fund, Crown corporations and other government organizations to prepare these statements.
The Provincial Auditor expresses an independent opinion on these statements. Her report, which appears on the following page, provides the scope of her audit and states her opinion.
Treasury Board approves the Summary Financial Statements. The statements are tabled in the Legislative Assembly as part of the Public Accounts and referred to the Standing Committee on Public Accounts for review.
On behalf of the Government of the Province of Saskatchewan.
|
| JIM REITER |
| Deputy Premier and |
| Minister of Finance |
|
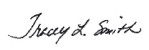
| TRACEY L. SMITH |
| Deputy Minister of Finance |
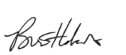
|
| BRENT HEBERT |
| Provincial Comptroller |
| Regina, Saskatchewan |
| June 2026 |
| Government of Saskatchewan Public Accounts 2025-26 | 39 |
Summary Financial Statements
Independent Auditor’s Report
To the Members of the Legislative Assembly of Saskatchewan
Opinion
We have audited the consolidated financial statements of the Government of Saskatchewan, which comprise the consolidated Statement of Financial Position as at March 31, 2026, and the consolidated Statements of Operations, Accumulated Operating Deficit, Accumulated Remeasurement Gains and Losses, Change in Net Debt, and Cash Flow for the year then ended, and notes to the consolidated financial statements, including a summary of significant accounting policies.
In our opinion, the accompanying consolidated financial statements present fairly, in all material respects, the consolidated financial position of the Government of Saskatchewan as at March 31, 2026, and the consolidated results of its operations, accumulated remeasurement gains and losses, changes in net debt, and cash flows for the year then ended in accordance with Canadian public sector accounting standards.
Basis for Opinion
We conducted our audit in accordance with Canadian generally accepted auditing standards. Our responsibilities under those standards are further described in the Auditor’s Responsibilities for the Audit of the Consolidated Financial Statements section of our report. We are independent of the Government of Saskatchewan in accordance with the ethical requirements that are relevant to our audit of the consolidated financial statements in Canada, and we have fulfilled our other ethical responsibilities in accordance with these requirements. We believe that the audit evidence we have obtained is sufficient and appropriate to provide a basis for our opinion.
Key Audit Matters
Key audit matters are those matters that, in our professional judgment, were most significant in our audit of the consolidated financial statements for the current period. These matters were addressed in the context of our audit of the consolidated financial statements as a whole, and in forming our opinion thereon. We do not provide a separate opinion on these matters.
| Key audit matter | How audit addressed key audit matter | |
| Pension Liabilities | ||
|
The Government of Saskatchewan had pension liabilities totalling $5.7 billion at March 31, 2026 (2025: $5.9 billion) related to seven defined benefit pension plans and one joint defined benefit plan as described in Note 5—Retirement Benefits and Schedule 8—Pension Liabilities.
The Government contracts actuaries to estimate the accrued pension benefit obligation and other information required for disclosures in the consolidated financial statements. Note 3—Measurement Uncertainty describes measurement uncertainty exists because actual experience may differ from actuarial or historical estimations.
We identified pension liabilities as a key audit matter because:
• This complex estimate requires significant judgment based on long-term assumptions about future demographic events and economic conditions
• Small changes in long-term assumptions such as discount and inflation rates can have a material impact on the liabilities, assets, and expenses |
Audit work to address this key audit matter included:
• Assessing the appropriateness of the actuarial methodology
• Assessing the qualifications of management’s actuarial experts
• Evaluating the reasonableness of management’s assumptions
• Testing the completeness and accuracy of data provided to the actuary
• Evaluating adjustments for actuarial gains and losses in accordance with Canadian public sector accounting standards
• Completing a retrospective review to determine the accuracy of previous estimates made
• Evaluating disclosures in the consolidated financial statements | |
| Government of Saskatchewan Public Accounts 2025-26 | 41 |
Summary Financial Statements
| Key audit matter | How audit addressed key audit matter | |
| Individual and Corporate Income Taxation Revenues | ||
|
Individual and corporate income taxation revenues are significant, totalling $5.0 billion in 2025—26 (2025: $4.8 billion) as included in Schedule 14-Revenue.
The Government estimates these tax revenues, using cash received and other available assessment data from the Federal Government, because precise figures from final tax assessments are not available until at least fifteen months after the taxation year ends. Note 3—Measurement Uncertainty describes measurement uncertainty exists due to differences that may arise in final assessments from initial economic estimates.
We identified individual and corporate taxation revenues as a key audit matter because:
• They are complex estimates involving management judgment and economic assumptions
• Large adjustments frequently occur in future years |
Audit work to address this key audit matter included:
• Assessing the appropriateness of management’s methods use to make the estimates
• Confirming individual and corporate income taxation transfers from the Federal Government
• Evaluating the reasonableness of management’s economic assumptions
• Validating sufficiency of corporate and individual income taxation revenue calculations and cut-off
• Analyzing variances to determine the accuracy of previous estimates made and review for management bias (e.g., current to prior years actuals, current year budget to actual) | |
Other Information
Management is responsible for the other information. The other information comprises the information included in Public Accounts 2025-26 Volume 1 Summary Financial Statements, but does not include the consolidated financial statements and our auditor’s report thereon.
Our opinion on the consolidated financial statements does not cover the other information and we do not express any form of assurance conclusion thereon.
In connection with our audit of the consolidated financial statements, our responsibility is to read the other information and, in doing so, consider whether the other information is materially inconsistent with the consolidated financial statements or any knowledge obtained in the audit, or otherwise appears to be materially misstated. If, based on the work we have performed on this other information, we conclude that there is a material misstatement of this other information, we are required to report that fact in this auditor’s report. We have nothing to report in this regard.
Responsibilities of Management and Those Charged with Governance for the Consolidated Financial Statements
Management is responsible for the preparation and fair presentation of these consolidated financial statements in accordance with Canadian public sector accounting standards for Treasury Board’s approval, and for such internal control as management determines is necessary to enable the preparation of consolidated financial statements that are free from material misstatement, whether due to fraud or error.
In preparing the consolidated financial statements, management is responsible for assessing the Government of Saskatchewan’s ability to continue as a going concern, disclosing, as applicable, matters related to going concern and using the going concern basis of accounting unless the Government of Saskatchewan either intends to cease operations, or has no realistic alternative but to do so.
Those charged with governance are responsible for overseeing the Government of Saskatchewan’s financial reporting process.
Auditor’s Responsibilities for the Audit of the Consolidated Financial Statements
Our objectives are to obtain reasonable assurance about whether the consolidated financial statements as a whole are free from material misstatement, whether due to fraud or error, and to issue an auditor’s report that includes our opinion. Reasonable assurance is a high level of assurance, but is not a guarantee that an audit conducted in accordance with Canadian generally accepted auditing standards will always detect a material misstatement when it exists. Misstatements can arise from fraud or error and are considered material if,
| 42 | Government of Saskatchewan Public Accounts 2025-26 |
Summary Financial Statements
individually or in the aggregate, they could reasonably be expected to influence the economic decisions of users taken on the basis of these consolidated financial statements.
As part of an audit in accordance with Canadian generally accepted auditing standards, we exercise professional judgment and maintain professional skepticism throughout the audit. We also:
| • | Identify and assess the risks of material misstatement of the consolidated financial statements, whether due to fraud or error, design and perform audit procedures responsive to those risks, and obtain audit evidence that is sufficient and appropriate to provide a basis for our opinion. The risk of not detecting a material misstatement resulting from fraud is higher than for one resulting from error, as fraud may involve collusion, forgery, intentional omissions, misrepresentations, or the override of internal control. |
| • | Obtain an understanding of internal control relevant to the audit in order to design audit procedures that are appropriate in the circumstances, but not for the purpose of expressing an opinion on the effectiveness of the Government of Saskatchewan’s internal control. |
| • | Evaluate the appropriateness of accounting policies used and the reasonableness of accounting estimates and related disclosures made by management. |
| • | Conclude on the appropriateness of management’s use of the going concern basis of accounting and based on the audit evidence obtained, whether a material uncertainty exists related to events or conditions that may cast significant doubt on the Government of Saskatchewan’s ability to continue as a going concern. If we conclude that a material uncertainty exists, we are required to draw attention in our auditor’s report to the related disclosures in the consolidated financial statements or, if such disclosures are inadequate, to modify our opinion. Our conclusions are based on the audit evidence obtained up to the date of our auditor’s report. However, future events or conditions may cause the Government of Saskatchewan to cease to continue as a going concern. |
| • | Evaluate the overall presentation, structure and content of the consolidated financial statements, including the disclosures, and whether the consolidated financial statements represent the underlying transactions and events in a manner that achieves fair presentation. |
| • | Plan and perform the group audit to obtain sufficient appropriate audit evidence regarding the financial information of the entities or business units within the Government of Saskatchewan as a basis for forming an opinion on the group financial statements. We are responsible for the direction, supervision, and review of the audit work performed for purposes of the group audit. We remain solely responsible for the audit opinion. |
We communicate with those charged with governance regarding, among other matters, the planned scope and timing of the audit and significant audit findings, including any significant deficiencies in internal control identified during the audit. We also provide those charged with governance with a statement that we have complied with relevant ethical requirements regarding independence, and to communicate with them all relationships and other matters that may reasonably be thought to bear on our independence, and where applicable, related safeguards. The engagement partner on the audit resulting in this independent auditor’s report is Trevor St. John, CPA, CA, CISA.
From the matters communicated with those charged with governance, we determine those matters that were of most significance in the audit of the consolidated financial statements of the current period and are therefore the key audit matters. We describe these matters in our auditor’s report unless law or regulation precludes public disclosure about the matter or when, in extremely rare circumstances, we determine that a matter should not be communicated in our report because the adverse consequences of doing so would reasonably be expected to outweigh the public interest benefits of such communication.
| ||
| Regina, Saskatchewan | TARA CLEMETT, CPA, CA, CISA | |
| June 18, 2026 | Provincial Auditor | |
| Office of the Provincial Auditor |
| Government of Saskatchewan Public Accounts 2025-26 | 43 |
Summary Financial Statements
Statement of Financial Position
As at March 31, 2026
(thousands of dollars)
| 2026 | 2025 | |||||||
| (Restated) | ||||||||
| Financial Assets |
||||||||
| Cash and cash equivalents |
4,033,358 | 3,419,115 | ||||||
| Accounts receivable (schedule 1) |
3,302,345 | 3,025,791 | ||||||
| Loans receivable (schedule 2) |
1,366,282 | 1,355,616 | ||||||
| Investment in government business enterprises (schedule 3) |
8,080,176 | 8,134,500 | ||||||
| Sinking fund investments (schedule 4) |
1,889,235 | 1,658,058 | ||||||
| Portfolio investments (schedule 5) |
1,788,592 | 1,360,674 | ||||||
| Derivative assets |
271,451 | 159,513 | ||||||
| Other financial assets |
3,311 | 2,841 | ||||||
|
|
|
|
|
|||||
| Total Financial Assets |
20,734,750 | 19,116,108 | ||||||
|
|
|
|
|
|||||
| Liabilities |
||||||||
| Accounts payable and accrued liabilities (schedule 6) |
4,783,889 | 4,409,025 | ||||||
| Unearned revenue (schedule 7) |
384,939 | 377,928 | ||||||
| Pension liabilities (note 5)(schedule 8) |
5,699,615 | 5,943,464 | ||||||
| General debt (schedule 9) |
25,574,604 | 22,524,849 | ||||||
| Obligations under long-term financing arrangements (schedule 10) |
1,053,345 | 1,079,051 | ||||||
| Derivative liabilities |
95,213 | 106,666 | ||||||
| Other liabilities (schedule 11) |
308,578 | 302,596 | ||||||
|
|
|
|
|
|||||
| Total Liabilities |
37,900,183 | 34,743,579 | ||||||
|
|
|
|
|
|||||
| Net Debt |
(17,165,433 | ) | (15,627,471 | ) | ||||
|
|
|
|
|
|||||
| Non-Financial Assets |
||||||||
| Tangible capital assets (schedule 12) |
14,403,929 | 13,662,916 | ||||||
| Inventories held for consumption (schedule 13) |
271,107 | 261,505 | ||||||
| Prepaid expenses |
101,687 | 74,378 | ||||||
|
|
|
|
|
|||||
| Total Non-Financial Assets |
14,776,723 | 13,998,799 | ||||||
|
|
|
|
|
|||||
| Accumulated Deficit1 |
(2,388,710 | ) | (1,628,672 | ) | ||||
|
|
|
|
|
|||||
| 1 Comprised of: |
||||||||
| 2026 | 2025 | |||||||
| Accumulated operating deficit |
(2,703,480 | ) | (1,756,018 | ) | ||||
| Accumulated remeasurement gains |
314,770 | 127,346 | ||||||
|
|
|
|
|
|||||
| Accumulated Deficit |
(2,388,710 | ) | (1,628,672 | ) | ||||
|
|
|
|
|
|||||
Contractual rights and obligations (note 7)
Contingencies (note 8)
Restatement (note 9)
The accompanying notes and schedules are an integral part of these financial statements.
| Government of Saskatchewan Public Accounts 2025-26 | 45 |
Summary Financial Statements
Statement of Operations
For the Year Ended March 31, 2026
(thousands of dollars)
| 2026 | 2025 | |||||||||||
| Budget | Actual | Actual | ||||||||||
| Revenue |
||||||||||||
| Taxation |
10,449,500 | 10,335,800 | 9,922,957 | |||||||||
| Non-renewable resources |
2,699,400 | 2,732,396 | 2,573,657 | |||||||||
| Net income from government business enterprises (schedule 3) |
705,200 | 537,485 | 784,591 | |||||||||
| Other own-source |
3,265,000 | 3,532,518 | 3,782,487 | |||||||||
| Transfers from the federal government |
3,937,000 | 3,995,349 | 3,792,293 | |||||||||
|
|
|
|
|
|
|
|||||||
| Total Revenue (schedule 14) |
21,056,100 | 21,133,548 | 20,855,985 | |||||||||
|
|
|
|
|
|
|
|||||||
| Expense |
||||||||||||
| Health |
8,004,900 | 8,671,557 | 8,009,546 | |||||||||
| Education |
4,428,100 | 4,527,619 | 4,374,753 | |||||||||
| Social services and assistance |
1,842,200 | 1,896,213 | 1,807,088 | |||||||||
| Protection of persons and property |
1,094,800 | 1,499,352 | 1,166,715 | |||||||||
| Agriculture |
1,597,600 | 1,241,322 | 1,762,572 | |||||||||
| Financing charges (schedule 16) |
1,058,500 | 1,073,298 | 950,540 | |||||||||
| Community development |
858,400 | 814,768 | 828,439 | |||||||||
| Transportation |
716,700 | 722,791 | 700,179 | |||||||||
| General government |
642,200 | 684,892 | 589,948 | |||||||||
| Economic development |
351,900 | 527,353 | 361,708 | |||||||||
| Environment and natural resources |
448,600 | 421,845 | 553,361 | |||||||||
|
|
|
|
|
|
|
|||||||
| Total Expense (schedule 15) |
21,043,900 | 22,081,010 | 21,104,849 | |||||||||
|
|
|
|
|
|
|
|||||||
| Operating (Deficit) Surplus |
12,200 | (947,462 | ) | (248,864 | ) | |||||||
|
|
|
|
|
|
|
|||||||
The accompanying notes and schedules are an integral part of these financial statements.
| 46 | Government of Saskatchewan Public Accounts 2025-26 |
Summary Financial Statements
Statement of Accumulated Operating Deficit
For the Year Ended March 31, 2026
(thousands of dollars)
| 2026 | 2025 | |||||||||||
| Budget1 | Actual | Actual | ||||||||||
| (Restated) | ||||||||||||
| Accumulated operating deficit, beginning of year |
(1,756,018 | ) | (1,756,018 | ) | (1,507,154 | ) | ||||||
| Operating (deficit) surplus |
12,200 | (947,462 | ) | (248,864 | ) | |||||||
|
|
|
|
|
|
|
|||||||
| Accumulated Operating Deficit, End of Year |
(1,743,818 | ) | (2,703,480 | ) | (1,756,018 | ) | ||||||
|
|
|
|
|
|
|
|||||||
| 1 | Budget figures, as presented in the 2025-26 Saskatchewan Provincial Budget, are revised as a result of the restatement for change in accounting policy (note 9). |
Statement of Accumulated Remeasurement Gains and Losses
For the Year Ended March 31, 2026
(thousands of dollars)
| 2026 | 2025 | |||||||
| Actual | Actual | |||||||
| Unrealized Gains (Losses) Attributable to: |
||||||||
| Foreign exchange |
(25,515 | ) | (227,040 | ) | ||||
| Derivatives |
123,391 | 39,353 | ||||||
| Portfolio investments |
145,337 | 2,362 | ||||||
|
|
|
|
|
|||||
| Total Unrealized Gains (Losses) |
243,213 | (185,325 | ) | |||||
| Realized net gains on portfolio investments, reclassified to statement of operations |
(18,478 | ) | (14,810 | ) | ||||
| Other comprehensive (loss) income (schedule 3) |
(37,311 | ) | 35,778 | |||||
|
|
|
|
|
|||||
| Net Remeasurement Gain (Loss) |
187,424 | (164,357 | ) | |||||
| Accumulated remeasurement gains, beginning of year |
127,346 | 291,703 | ||||||
|
|
|
|
|
|||||
| Accumulated Remeasurement Gains, End of Year |
314,770 | 127,346 | ||||||
|
|
|
|
|
|||||
The accompanying notes and schedules are an integral part of these financial statements.
| Government of Saskatchewan Public Accounts 2025-26 | 47 |
Summary Financial Statements
Statement of Change in Net Debt
For the Year Ended March 31, 2026
(thousands of dollars)
| 2026 | 2025 | |||||||||||
| Budget1 | Actual | Actual | ||||||||||
| Operating (Deficit) Surplus |
12,200 | (947,462 | ) | (248,864 | ) | |||||||
|
|
|
|
|
|
|
|||||||
| Tangible Capital Assets (schedule 12) |
||||||||||||
| Acquisitions |
(1,832,900 | ) | (1,562,726 | ) | (1,630,824 | ) | ||||||
| Amortization |
777,200 | 766,775 | 729,070 | |||||||||
| Disposals |
— | 9,295 | 20,852 | |||||||||
| Write-downs |
— | 45,643 | 4,322 | |||||||||
|
|
|
|
|
|
|
|||||||
| Net Acquisition of Tangible Capital Assets |
(1,055,700 | ) | (741,013 | ) | (876,580 | ) | ||||||
| Net (Acquisition) Use of Other Non-Financial assets |
— | (36,911 | ) | 9,075 | ||||||||
|
|
|
|
|
|
|
|||||||
| Increase in Net Debt from Operations |
(1,043,500 | ) | (1,725,386 | ) | (1,116,369 | ) | ||||||
| Net remeasurement gain (loss) |
(144,000 | ) | 187,424 | (164,357 | ) | |||||||
|
|
|
|
|
|
|
|||||||
| Increase in Net Debt |
(1,187,500 | ) | (1,537,962 | ) | (1,280,726 | ) | ||||||
| Net debt, beginning of year |
(15,627,471 | ) | (15,627,471 | ) | (14,346,745 | ) | ||||||
|
|
|
|
|
|
|
|||||||
| Net Debt, End of Year |
(16,814,971 | ) | (17,165,433 | ) | (15,627,471 | ) | ||||||
|
|
|
|
|
|
|
|||||||
| 1 | Budget figures, as presented in the 2025-26 Saskatchewan Provincial Budget, are revised (note 9). |
The accompanying notes and schedules are an integral part of these financial statements.
| 48 | Government of Saskatchewan Public Accounts 2025-26 |
Summary Financial Statements
Statement of Cash Flow
For the Year Ended March 31, 2026
(thousands of dollars)
| 2026 | 2025 | |||||||
| Operating Activities |
||||||||
| Operating (deficit) surplus |
(947,462 | ) | (248,864 | ) | ||||
| Non-cash items included in the operating (deficit) surplus |
||||||||
| Net income from government business enterprises (schedule 3) |
(537,485 | ) | (784,591 | ) | ||||
| Other non-cash items included in the operating (deficit) surplus (schedule 18) |
766,029 | 667,537 | ||||||
| Net change in non-cash operating activities (schedule 18) |
(237,283 | ) | 184,303 | |||||
| Dividends received from government business enterprises (schedule 3) |
554,498 | 546,997 | ||||||
|
|
|
|
|
|||||
| Cash (Used for) Provided by Operating Activities |
(401,703 | ) | 365,382 | |||||
|
|
|
|
|
|||||
| Capital Activities |
||||||||
| Acquisition of tangible capital assets (schedule 12) |
(1,562,726 | ) | (1,630,824 | ) | ||||
| Proceeds on disposal of tangible capital assets |
8,410 | 24,195 | ||||||
|
|
|
|
|
|||||
| Cash Used for Capital Activities |
(1,554,316 | ) | (1,606,629 | ) | ||||
|
|
|
|
|
|||||
| Investing Activities |
||||||||
| Net increase in loans receivable |
(23,236 | ) | (44,037 | ) | ||||
| Acquisition of portfolio investments |
(2,265,659 | ) | (2,647,255 | ) | ||||
| Disposition of portfolio investments |
1,994,376 | 2,249,513 | ||||||
| Sinking fund contributions for general debt (schedule 4) |
(297,179 | ) | (260,576 | ) | ||||
| Sinking fund redemptions for general debt (schedule 4) |
— | 72,547 | ||||||
|
|
|
|
|
|||||
| Cash Used for Investing Activities |
(591,698 | ) | (629,808 | ) | ||||
|
|
|
|
|
|||||
| Financing Activities |
||||||||
| Proceeds from general debt |
4,442,176 | 3,458,455 | ||||||
| Repayment of general debt |
(1,104,036 | ) | (950,616 | ) | ||||
| Proceeds from repurchase of general debt |
61,391 | — | ||||||
| Repurchase of general debt |
(243,385 | ) | (61,391 | ) | ||||
| Decrease in obligations under long-term financing arrangements |
(25,706 | ) | (20,292 | ) | ||||
| Increase (decrease) in other liabilities1 |
31,520 | (1,564 | ) | |||||
|
|
|
|
|
|||||
| Cash Provided by Financing Activities |
3,161,960 | 2,424,592 | ||||||
|
|
|
|
|
|||||
| Increase in Cash and Cash Equivalents |
614,243 | 553,537 | ||||||
| Cash and cash equivalents, beginning of year |
3,419,115 | 2,865,578 | ||||||
|
|
|
|
|
|||||
| Cash and Cash Equivalents, End of Year |
4,033,358 | 3,419,115 | ||||||
|
|
|
|
|
|||||
| 1 | Excludes the changes in unamortized debt related costs, which are classified as operating activities. |
The accompanying notes and schedules are an integral part of these financial statements.
| Government of Saskatchewan Public Accounts 2025-26 | 49 |
Summary Financial Statements
Notes to the Financial Statements
As at March 31, 2026
1. Significant Accounting Policies
Basis of accounting
These financial statements are prepared in accordance with Canadian public sector accounting standards issued by the Public Sector Accounting Board.
Government reporting entity
The government reporting entity consists of public sector entities (entities), which include government service organizations, government business enterprises and partnerships.
Government service organizations and government business enterprises are entities controlled by the government. Controlled entities that are self-sufficient and have the financial and operating authority to sell goods and services to individuals and other organizations outside the government reporting entity as their principal activity are classified as government business enterprises. All other controlled entities are government service organizations.
A partnership exists when the government enters into a contractual arrangement with one or more partners outside the government reporting entity where these partners share control of governance decisions and, on an equitable basis, share the significant risks and benefits associated with operating the partnership.
A listing of the entities included in the government reporting entity is provided in schedule 19. Unless otherwise noted, the financial activities of all subsidiaries of these entities have also been included.
Trust funds
Trust funds consist of property conveyed or assigned to the government, as trustee, by agreement or statute to administer on behalf of beneficiaries. Because trust funds are administered but not controlled by the government, the funds are excluded from the government reporting entity and disclosed in note 6.
Method of consolidation
Government service organizations are consolidated after adjustment to a basis consistent with the accounting policies described in this note. Inter-entity balances and transactions, other than expensed provincial sales tax, are eliminated. Government service organizations in which a non-controlling interest exists are proportionately consolidated.
Government business enterprises are recorded using the modified equity method based on their results prepared in accordance with IFRS Accounting Standards. Using this method, the government’s investment in government business enterprises, which is initially recorded at cost, is adjusted annually to include the government’s proportionate share of net earnings or losses and certain other net equity changes of government business enterprises without adjustment to the accounting policies described in this note. With the exception of dividends and unrealized inter-entity gains and losses, inter-entity balances and transactions are not eliminated.
Partnerships are proportionately consolidated, at the ownership share disclosed in schedule 19, after adjustment to a basis consistent with the accounting policies described in this note. Inter-entity balances and transactions, other than expensed provincial sales tax, are eliminated.
Financial results of entities with fiscal year ends other than March 31 are adjusted for transactions occurring on or before March 31 that have a significant impact on these financial statements.
Specific accounting policies
Financial assets
Financial assets are assets that could be used to discharge existing liabilities or finance future operations and are not for consumption in the normal course of operations.
Cash and cash equivalents consist of cash, bank deposits and highly liquid investments that are acquired with maturity terms no longer than three months.
Accounts receivable are initially recorded at cost. A valuation allowance is recognized when collection is uncertain.
Loans receivable are initially recorded at cost. Where there is a loss in value other than a temporary decline, the loan is written down to recognize the loss.
| 50 | Government of Saskatchewan Public Accounts 2025-26 |
Summary Financial Statements
Notes to the Financial Statements
1. Significant Accounting Policies (continued)
Sinking fund investments are held for the repayment of debt and consist primarily of bonds and debentures. These investments, recorded at amortized cost, are net of the government’s own securities held as sinking fund investments. Premiums and discounts on long-term investments within these sinking funds are amortized using the effective interest rate method.
Portfolio investments are recorded at market value, with the exception of bonds, debentures and other fixed income securities, which are recorded at cost. These investments are net of the government’s own securities held as portfolio investments. Investments recorded at cost are written down to market value when there is evidence of a permanent decline in value. For investments recorded at market value, unrealized changes in fair value are recorded in the Statement of Accumulated Remeasurement Gains and Losses until realized, at which time the gains or losses are recognized in the Statement of Operations.
Derivative assets include currency and interest rate swaps measured at fair value. Unrealized changes in fair value are recorded in the Statement of Accumulated Remeasurement Gains and Losses. A derivative that has a negative fair market value is presented as a liability on the Statement of Financial Position.
Other financial assets include inventories and other assets held for sale, which are valued at the lower of cost and net realizable value.
Liabilities
Liabilities are present obligations resulting from transactions and events occurring prior to year end, which will be satisfied in the future through the transfer or use of assets or another form of economic settlement. Contingencies, including loss provisions on guaranteed debt, are recorded when it is likely that a liability exists and the amount can be reasonably estimated.
Accounts payable and accrued liabilities primarily include obligations to pay for goods and services acquired prior to year end and to provide authorized transfers where eligibility criteria are met. Obligations for most contaminated sites and asset retirements are recorded on an undiscounted basis as the settlement date is not determinable. These same obligations are recorded using the government’s best estimate of the amount required: to remediate contaminated sites for which the government is either directly responsible or has accepted responsibility; and to retire controlled tangible capital assets. Accrued salaries and benefits include other employee future benefits which are recognized in the period the employees provide service.
Unearned revenue includes: government transfers with stipulations that meet the definition of a liability; amounts received in advance of taxes earned; amounts received for goods or services with performance obligations that meet the definition of a liability; and contributions restricted for a stipulated purpose pursuant to an agreement with an external party. Amounts are recognized as: stipulations are met; taxes are earned; performance obligations are satisfied; and contributions are used for the stipulated purposes.
Pension liabilities are calculated using the projected benefit method prorated on services. Pension plan assets are valued at market-related values. Changes in pension liabilities resulting from estimation adjustments due to experience gains and losses and changes in actuarial assumptions are amortized on a straight-line basis over the expected average remaining service life of the related employee group. Amortization commences in the year following the determination of the adjustment. Gains or losses resulting from plan amendments are recognized in the period of the plan amendment.
General debt is debt issued by government service organizations including issued amounts subsequently transferred to government business enterprises. This debt, recorded at par, is net of the government’s own securities held as investments and adjusted for the accumulated impact of translating debt issued in foreign currencies to Canadian dollars at the exchange rate in effect at March 31.
Government business enterprise specific debt, which is disclosed separately on schedule 9, is debt issued by, or specifically on behalf of, government business enterprises.
Obligations under long-term financing arrangements represent the government’s liability for public private partnership agreements (P3s) through which private sector proponents design, build, finance, operate and maintain certain of the government’s tangible capital assets. The obligations are recorded on the percentage-of-completion basis over the period of construction of the P3 asset and are reduced by progress and capital payments made to the P3 partner. The percentage of completion is applied to the nominal value of progress payments and the present value of future capital payments, discounted to the date the asset is available for use, using the weighted average cost of capital specific to each P3 arrangement.
| Government of Saskatchewan Public Accounts 2025-26 | 51 |
Summary Financial Statements
Notes to the Financial Statements
1. Significant Accounting Policies (continued)
Derivative liabilities include currency and interest rate swaps measured at fair value. Unrealized changes in fair value are recorded in the Statement of Accumulated Remeasurement Gains and Losses. A derivative that has a positive fair market value is presented as a financial asset on the Statement of Financial Position.
Other liabilities include unamortized debt-related costs, which is comprised of premiums, discounts and debt issue costs. These costs are deferred and amortized using the effective interest rate method.
Non-financial assets
Non-financial assets are acquired, constructed or developed assets that do not normally provide resources to discharge existing liabilities, but instead are normally employed to deliver government services, may be consumed and are not for sale in the normal course of operations. Non-financial assets are recorded at cost and expensed as they are consumed.
Inventories held for consumption are recorded at cost and are expensed as they are consumed.
Tangible capital assets include all amounts directly attributable to the acquisition, construction, development, betterment or retirement of the asset. During construction, these assets are recorded based on their percentage of completion and are disclosed as work in progress. Amortization is generally on a straight-line basis over the estimated useful life of the asset and commences when the asset is put in service. Non-purchased intangible assets, items inherited by right of the Crown such as Crown lands, forests, water and mineral resources, works of art and historical treasures are not recognized as assets in these financial statements as an estimate of their future economic benefits cannot be reasonably and verifiably quantified.
Tangible capital assets procured through P3s are valued at the total of the nominal value of progress payments made during or on completion of construction and the present value of the future capital payments, discounted to the date the asset is available for use, using the weighted average cost of capital specific to the P3 arrangement.
Revenue
Revenue, recorded on the accrual basis, represents economic resources earned by the government from taxes and other sources that are used to deliver public services.
Taxation revenue is recognized when the tax is authorized by the legislature and the taxable event occurs. The taxable event differs for each type of tax; for example, taxation revenue is recognized when taxpayers earn income, purchase products and services, or are in possession of real property. Tax concessions are recorded as a reduction in taxation revenue.
For personal and corporation income taxes, cash received from the federal government, adjusted for assessment data from the federal government when it provides a more reliable estimate, is used as the basis for recording the tax revenue.
Non-renewable resources revenue is recognized based on the production, sales or profits generated from the specific non-renewable resource. Oil and natural gas and uranium revenues are based primarily on price and production; potash revenue is based primarily on profits generated; and resource surcharge revenue is based on sales volumes and prices.
Other own-source revenue is recognized when the government has the authority to obtain the related economic benefits and is expected to do so. For transactions for which the government is obligated to provide specific goods or services, such as fees or sales of goods, services, licenses or permits, revenue is recognized as the related performance obligation is satisfied.
Transfers from the federal government are recognized as revenue in the period the transfer is authorized and eligibility criteria are met, except when and to the extent that the transfer stipulations give rise to an obligation that meets the definition of a liability. Transfers meeting the definition of a liability are recorded as unearned revenue and recognized as the stipulations are met.
Expense
Expenses, recorded on the accrual basis, represent the government’s cost to deliver public services and are classified by theme in the Statement of Operations and by object in schedule 15, while schedule 17 discloses expense themes by object. Transfers are recognized as expenses in the period the transfer is authorized and eligibility criteria are met.
Expenses classified by theme, which are based on the major functional groupings of activities, are as follows:
The agriculture theme includes expenses to assist and improve the agriculture and food industry through development activities including research, education, regulation and investment in the sector as well as providing direct support to farmers through income stabilization and insurance programs.
| 52 | Government of Saskatchewan Public Accounts 2025-26 |
Summary Financial Statements
Notes to the Financial Statements
1. Significant Accounting Policies (continued)
The community development theme includes expenses to maintain and develop engaged and vibrant communities, including financial assistance and infrastructure funding to local governments and other authorities, which in turn provide community services. Community development also includes funding directed to specific community services such as sport, culture, arts, and heritage that improve quality of life.
The economic development theme includes expenses to strengthen, expand and diversify Saskatchewan’s economy as well as to promote trade and growth in export markets. The expenses arise from activities such as research, marketing, product development, financing, financial assistance, technology and infrastructure. Economic development also includes the strategic management of Saskatchewan’s non-renewable resources to support future economic activity.
The education theme includes expenses to develop and maintain a quality prekindergarten through post-secondary education system which is designed to impart knowledge and information, including activities that support and encourage ongoing learning and the acquisition of specialized skills as well as providing supports to help students be successful. The education theme also includes funding for early learning and child care.
The environment and natural resources theme includes expenses to protect and improve the quality of the environment through: the management of fish, wildlife, forests and land; recycling; and the prevention and clean-up of environmental hazards.
The financing charges theme includes expenses associated with general debt including interest, foreign exchange gains and losses, discounts and premiums, fees and commissions. It also includes financing costs related to pension and other employee future benefits liabilities, obligations under long-term financing arrangements such as public private partnerships and capital lease obligations.
The general government theme includes expenses for centralized government services including: government contributions to, and management of, employee benefit plans; property, vehicle and information technology management; the collection of government revenues; the formation of budgetary policy; the preparation and audit of the government’s public accounts; and the constitutional, political and law enactment aspect of the government.
The health theme includes expenses to support, maintain and restore the physical and mental health of Saskatchewan residents. Health expense primarily includes: the delivery of health services through acute, emergency, rehabilitative, long-term, community-based, and home-based care; cancer prevention, diagnosis and treatment programs; the prevention and control of infectious diseases; the subsidization of prescription drugs; and the education and promotion of healthy lifestyles.
The protection of persons and property theme includes expenses to promote and ensure the security, safety and protection of residents and property which is mainly achieved through a fair justice system, policing programs and supervision and rehabilitation services for offenders. Protection of persons and property also includes: services that promote, support and enforce safe work practices and employment standards; provincial emergency management through 911 services, public safety, disaster assistance and wildfire management; and victims’ services.
The social services and assistance theme includes expenses to provide financial assistance and services to individuals and families in need because of poverty, abuse, neglect and disability. This includes income support programs, accessible and safe housing, child protection services, adoption services and providing life’s needs to persons with intellectual disabilities.
The transportation theme includes expenses for the development, construction and maintenance of an integrated provincial transportation system using highways, rural roads, bridges, ferry crossings, airstrips and communication networks.
Schedule 19 identifies the entities included in each theme.
New conceptual framework and reporting model not yet in effect
The Public Sector Accounting Board has issued a new conceptual framework and reporting model that will be effective for public sector entities on April 1, 2026. A conceptual framework is a coherent set of interrelated concepts underlying accounting and financial reporting standards. It prescribes the nature, function and limits of financial accounting and reporting. A reporting model establishes guidance on the presentation of general purpose financial statements.
The government plans to adopt both the conceptual framework and reporting model on their effective date and is currently analyzing the impact this will have on these financial statements.
| Government of Saskatchewan Public Accounts 2025-26 | 53 |
Summary Financial Statements
Notes to the Financial Statements
1. Significant Accounting Policies (continued)
New and revised accounting standards
Two additional accounting standards issued by the Public Sector Accounting Board have not been applied in preparing these financial statements. The government is analyzing the timing of implementation and the impact these standards will have on these financial statements.
PS 3251 Employee Benefits will replace two existing standards setting foundational guidance for the recognition, measurement, presentation and disclosure of all employee benefits.
PS 3150 Tangible Capital Assets has been amended to incorporate government not-for-profit standards.
2. Fair Value of Financial Instruments
Financial instruments are contracts that give rise to financial assets of one entity and financial liabilities or equity instruments of another entity and are measured at fair value or cost/amortized cost.
The determination of fair value requires judgment and is based on market information where available and appropriate. Fair value measurements are categorized, based on the nature of the inputs used, into one of three levels within a fair value hierarchy as follows:
| Level 1 | - | determined using unadjusted quoted prices in active markets for identical assets or liabilities. | ||
| Level 2 | - | determined using quoted prices in markets that are not active or inputs that are observable for the asset or liability, either directly (i.e. as prices) or indirectly (i.e. derived from prices). | ||
| Level 3 | - | determined using inputs for the asset or liability that are supported by little or no observable market data. | ||
For financial instruments measured at cost or amortized cost, transaction costs are a component of the cost of the financial instruments and gains and losses are recognized in the Statement of Operations. For financial instruments measured using amortized cost, the effective interest rate method is used to determine interest revenues or expenses.
Foreign currency transactions are translated at the exchange rate in effect at the transaction date. Financial assets and liabilities denominated in a foreign currency are translated into Canadian dollars at the exchange rate in effect at March 31.
The fair value hierarchy for financial instruments is as follows:
| (thousands of dollars) | 2026 | 2025 | ||||||||||||||||||
| Level 1 | Level 2 | Level 3 | Total | Total | ||||||||||||||||
| Portfolio investments |
||||||||||||||||||||
| Equities |
278,613 | — | — | 278,613 | 154,347 | |||||||||||||||
| Pooled investment funds |
18,275 | 230,394 | — | 248,669 | 232,490 | |||||||||||||||
| Derivative assets |
— | 271,451 | — | 271,451 | 159,513 | |||||||||||||||
| Derivative liabilities |
— | (95,213 | ) | — | (95,213 | ) | (106,666 | ) | ||||||||||||
|
|
|
|
|
|
|
|
|
|
|
|||||||||||
| Total |
296,888 | 406,632 | — | 703,520 | 439,684 | |||||||||||||||
|
|
|
|
|
|
|
|
|
|
|
|||||||||||
| 54 | Government of Saskatchewan Public Accounts 2025-26 |
Summary Financial Statements
Notes to the Financial Statements
3. Measurement Uncertainty
The use of estimates and assumptions is integral in determining amounts to be recognized and disclosed in financial statements. Uncertainty that exists when there is another reasonably possible amount is known as measurement uncertainty. While best estimates are used for reporting items subject to measurement uncertainty, it is reasonably possible that changes in future conditions, occurring within one fiscal year, could require a material change in the amounts recognized or disclosed.
Measurement uncertainty, disclosed in aggregate for government service organizations and government business enterprises, that may be material to these financial statements exists in the following recorded amounts:
| (thousands of dollars) | 2026 | 2025 | ||||||
| (Restated) | ||||||||
| Pension liabilities1a |
5,723,764 | 5,987,611 | ||||||
| Insurance claim obligations1a |
5,209,363 | 5,092,821 | ||||||
| Personal and corporation income taxation revenue1b |
5,031,828 | 4,789,012 | ||||||
| Canada Health and Social Transfer revenue1c |
2,207,086 | 2,071,653 | ||||||
| Investments1d |
2,126,705 | 1,902,665 | ||||||
| Environmental obligations1e |
1,470,464 | 1,479,959 | ||||||
| Potash non-renewable resource revenue1f |
914,523 | 604,095 | ||||||
| Oil and natural gas non-renewable resource revenue1g |
869,043 | 1,151,637 | ||||||
| Resource surcharge revenue1h |
586,181 | 529,503 | ||||||
| Output-Based Performance Standards revenue1a |
489,163 | 362,817 | ||||||
| Agricultural income stability program obligations1a |
417,809 | 318,138 | ||||||
| Uranium non-renewable resource revenue1i |
255,550 | 191,531 | ||||||
| Tobacco litigation receivable1j |
213,778 | 400,000 | ||||||
| Unbilled utility receivable1k |
152,228 | 144,012 | ||||||
| Provincial Disaster Assistance program receivable1j |
134,829 | 110,924 | ||||||
| 1 | Uncertainty exists in the valuation of these amounts because: |
| a | Actual experience may differ from actuarial or historical estimations; |
| b | Final assessments may differ from initial economic estimates; |
| c | Changes may occur in economic and demographic conditions in the province and the country; |
| d | Certain investments held by government business enterprises have no active market (level 3 of the fair value hierarchy); |
| e | The existence and extent of contamination and the timing and cost of remediation cannot be reliably estimated in all cases; |
| f | Actual operating profits may differ from initial estimates; |
| g | Price and production sensitivities in the royalty revenue structures may exist; |
| h | Final valuation of resource sales may differ from initial estimates; |
| i | Actual sales volumes may differ from initial estimates; |
| j | Actual receipts may differ from initial estimates; and |
| k | Actual usage may differ from estimated usage. |
4. Risk Management of Financial Instruments
The government, collectively through its government service organizations and government business enterprises, has exposure to the following risks related to its financial instruments: interest rate risk, foreign exchange rate risk, price risk, credit risk and liquidity risk. The government has risk management strategies in place to mitigate these risks.
Interest rate risk is the risk that the fair value or future cash flows of a financial instrument will fluctuate unfavourably with changes in market interest rates.
The government manages this risk on its investments by setting asset mix guidelines that limit the extent to which interest rates impact the market value of the government’s fixed income investments, such as bonds and debentures. It is estimated that a one per cent change in interest rates would impact the government’s operating results by $273 million (2025 - $236 million - restated).
The government manages this risk on its debt by issuing securities at predominantly fixed rates of interest rather than at floating rates of interest. Floating-rate debt primarily refers to floating-rate debentures, short-term promissory notes and fixed-rate debt maturing within one year. The government seeks opportunities to effectively convert floating-rate debt into fixed-rate debt through the use of interest rate swaps. The government has interest rate swaps on a notional value of debt of $31 million (2025 - $34 million). At March 31, 2026, 91.3 per cent (2025 - 92.3 per cent) of the government’s gross debt effectively carries a rate of interest that is fixed for greater than a one-year period.
| Government of Saskatchewan Public Accounts 2025-26 | 55 |
Summary Financial Statements
Notes to the Financial Statements
4. Risk Management of Financial Instruments (continued)
Public debt includes floating-rate debt of $3.54 billion (2025 - $2.76 billion). A one percentage point change to interest rates would impact the operating results by $35 million (2025 - $28 million).
Foreign exchange rate risk is the risk that the fair value or future cash flows of a financial instrument will fluctuate unfavourably with a change in the value of the Canadian dollar relative to other currencies. The government is primarily exposed to foreign exchange risk on its investments and general debt.
The government manages this risk on its investments by defining maximum limits on exchange rate sensitive assets, such as foreign equities, in investment portfolios. It is estimated that a ten per cent change in the Canadian dollar relative to other currencies would impact the government’s operating results by $202 million (2025 - $196 million - restated).
The government manages this risk on its debt by maintaining a preference for issuing debt that is denominated in Canadian dollars. Where debt is issued in foreign currencies, the government seeks opportunities to effectively convert it into Canadian dollar debt through the use of cross-currency swaps. At March 31, 2026, 100.0 per cent (2025 - 100.0 per cent) of the government’s gross debt is effectively denominated in Canadian dollars.
The following foreign denominated items are hedged to Canadian dollars using cross-currency swaps:
| • | Debentures of 2.00 billion (2025 - 2.00 billion) U.S. dollars fully hedged to $2.71 billion (2025 - $2.71 billion) Canadian; |
| • | Debentures of 2.58 billion (2025 - 235 million) Euros fully hedged to $3.96 billion (2025 - $354 million) Canadian; and |
| • | Debentures of 520 million (2025 - 200 million) Swiss francs fully hedged to $823 million (2025 - $288 million) Canadian. |
In total, the government has cross-currency swaps on a notional value of debt of $7.49 billion (2025 - $3.35 billion). The effectiveness of these hedges is assessed on an ongoing basis by monitoring the credit ratings of the counterparties to the hedges.
Price risk is the risk that the fair value or future cash flows of a financial instrument will fluctuate unfavourably with changes in market prices.
The government’s risk, resulting from its investments’ exposure to changes in equity prices, is managed by having geographically and industry diverse investment portfolios. In addition, the government limits its investment concentration in any one investee or related group of investees to ten per cent of the investee’s share capital and ten per cent of the government’s investment portfolio.
Credit risk is the risk that one party to a financial instrument will cause a financial loss for the other party by failing to discharge an obligation. The government is primarily exposed to credit risk on its cash, receivables, investments and derivative financial instruments. The government’s carrying amounts for these financial assets best represent its maximum exposure to credit risk.
For cash and investments, the government manages this risk by dealing solely with reputable financial institutions, and through an investment policy that limits investments to high credit quality (minimum rating is BBB for bonds and debentures and R-1 for short-term investments) as well as limits the maximum exposure with respect to any one issuer.
For receivables, the government reviews balances and aging information to determine if a valuation allowance is necessary. The government is not exposed to significant credit risk on its receivables. A significant portion of accounts receivable are due from the federal government and collection of these amounts is reasonably assured. Other receivables held by the government are associated with a large and diversified cross-section of residents, customers and other entities, which minimizes the concentration of credit risk exposure associated with any particular individual or entity.
For derivative financial instrument contracts, the government manages this risk by dealing solely with counterparties that have good credit ratings and by establishing limits on individual counterparty exposures and monitoring those exposures on a regular basis. At March 31, 2026, 100.0 per cent (2025 - 100.0 per cent) of the notional value of the government’s derivative financial instrument contracts is held by counterparties with an S&P Global Rating’s credit rating of A or better.
Liquidity risk is the risk that the government will encounter difficulty in meeting obligations associated with financial liabilities. The government is exposed to liquidity risk on its accounts payable and accrued liabilities, pension liabilities, general debt, obligations under long-term financing arrangements and other liabilities. The government manages its overall liquidity risk by managing cash resources which is achieved by monitoring actual and forecasted cash flows from operating, investing and financing activities.
The government manages this risk on its debt by distributing debt maturities over many years, maintaining sinking funds in which the investment maturities approximate that of the underlying long-term debt issues and maintaining adequate cash reserves and short-term borrowing programs as contingent sources of liquidity. Schedule 9 provides a summary of contractual maturities for general debt.
Expected contractual maturities related to other financial liabilities are disclosed in schedules 6, 10 and 11.
| 56 | Government of Saskatchewan Public Accounts 2025-26 |
Summary Financial Statements
Notes to the Financial Statements
5. Retirement Benefits
The government sponsors several defined benefit pension plans and a defined contribution pension plan. The government also participates in a joint defined benefit pension plan.
Defined benefit plans provide benefits based on length of service and pensionable earnings. A typical defined benefit plan provides pensions equal to 2.0 per cent of a member’s average five years’ highest salary, multiplied by the years of service to a maximum of 35 years. Employees contribute a percentage of salary, which may vary based on age, to their plan. Pensions and contribution rates are integrated with the Canada Pension Plan.
Actuarial valuations are performed at least triennially. When a valuation is not done in the current fiscal year an actuary extrapolates the most recent valuation. Valuations and extrapolations are based on a number of assumptions about future events, such as inflation rates, interest rates, wage and salary increases and employee turnover and mortality. These assumptions reflect estimates of expected long-term rates and short-term forecasts. Estimates vary based on the individual plan.
The accrued benefit obligation is determined using the projected benefit method prorated on services. Pension plan assets are valued at market-related values based on the actual market values and for certain plan assets averaged over up to a five-year period.
Joint defined benefit plans are governed by formal agreements between the joint sponsors (i.e. participating employers and plan members) establishing that the joint sponsors have shared control over the plan. Funding contributions and significant risks of the plan are shared on an equitable basis between the joint sponsors. Accordingly, the government accounts for only its portion of the plan. Plan assets and surpluses are restricted for member benefits or certain other purposes set out in the agreements. Plan benefits are determined on the same basis as defined benefit plans.
The accrued benefit obligation is determined using the projected benefit method prorated on services. Pension plan assets are valued at market-related values by averaging the difference between the net investment income on a market-value basis and the expected investment income, based on expected rate of return on plan assets, over a five-year period.
Defined contribution plans provide pensions based on accumulated contributions and investment earnings. Employees contribute a percentage of salary. The government provides contributions at specified rates for employee current service.
Pension plan assets of government sponsored defined benefit and defined contribution plans are invested in fixed income securities, equities, real estate, pooled investment funds and short-term monetary items. The investment in Government of Saskatchewan securities is insignificant for all plans.
Government service organizations
Defined benefit plans and joint defined benefit plan
The two main defined benefit plans are the Teachers’ Superannuation Plan (TSP) and the Public Service Superannuation Plan (PSSP). Other plans include the Judges of the Provincial Court Superannuation Plan (Judges), the Saskatchewan Transportation Company Employees Superannuation Plan, the Anti-TB League Employees Superannuation Plan, and the Pension Plan for the Non-Teaching Employees of the Saskatoon School Division No.13 (PPNTE). Defined benefits are also payable to members of the former Members of the Legislative Assembly Superannuation Fund (MLA).
The government is required to match employee current service contributions for all plans except PSSP, Judges and PPNTE. Funding contributions are required for PPNTE. Separate pension plan assets are maintained for TSP, Judges and PPNTE. For the other plans, employee contributions are received and pension obligations are paid directly by the government.
The government also participates in the Saskatchewan Healthcare Employees’ Pension Plan (SHEPP), a joint defined benefit plan for employees of the Saskatchewan Health Authority and certain other government health entities. The government participating employers contribute to the plan at the ratio of 1.12 to 1.0 of employee contributions and any actuarially determined deficiency is the responsibility of participating employers and employees at the same ratio. The government portion of employer contributions represents 98.0 per cent of total participating employer contributions to the plan.
| Government of Saskatchewan Public Accounts 2025-26 | 57 |
Summary Financial Statements
Notes to the Financial Statements
5. Retirement Benefits (continued)
Information on the defined benefit plans and the joint defined benefit plan of government service organizations is as follows:
| 2026 | 2025 | |||||||||||||||||||||||
| TSP | PSSP | Others | SHEPP | Total | Total | |||||||||||||||||||
| Plan status |
Closed | Closed | Closed | 1 | Open | n/a | n/a | |||||||||||||||||
| Employee contribution rate (percentage of salary) |
7.85 | 7.00-9.00 | 2 | 5.00-8.05 | 2 | 7.30-10.40 | n/a | n/a | ||||||||||||||||
| Number of active employees |
16 | 4 | 1,320 | 42,828 | 44,168 | 40,976 | ||||||||||||||||||
| Average age of active employees (years) |
68.5 | 68.4 | 47.4 | 43.1 | 43.2 | 43.4 | ||||||||||||||||||
| Number of former employees entitled to deferred pension benefits |
4,242 | — | 245 | 2,666 | 7,153 | 7,028 | ||||||||||||||||||
| Number of superannuates and surviving spouses |
9,645 | 3,576 | 658 | 23,237 | 37,116 | 37,297 | ||||||||||||||||||
| Actuarial valuation date |
June 30/24 | Dec. 31/23 | Various | Dec. 31/24 | n/a | n/a | ||||||||||||||||||
| Long-term assumptions used |
||||||||||||||||||||||||
| Rate of compensation increase (percentage) |
2.75 | n/a | 3.00-3.25 | 2.75 | n/a | n/a | ||||||||||||||||||
| Expected rate of return on plan assets (percentage) |
5.70 | n/a | 5.30-6.30 | 6.80 | n/a | n/a | ||||||||||||||||||
| Discount rate (percentage) |
3.40 | 3.30 | 3.10-6.30 | 6.80 | n/a | n/a | ||||||||||||||||||
| Inflation rate (percentage) |
2.00 | 2.00 | 2.00-2.25 | 2.00 | n/a | n/a | ||||||||||||||||||
| Expected average remaining service life (years) |
1.00 | n/a | 9.00-12.00 | 13.30 | n/a | n/a | ||||||||||||||||||
| Post-retirement index (percentage of annual increase in Consumer Price Index) |
80.00 | 70.00 | Various | Ad hoc | n/a | n/a | ||||||||||||||||||
| 1 | Judges and PPNTE are open to new membership; all other plans are closed. |
| 2 | Contribution rate varies based on age upon joining the plan. |
Defined contribution plans
The government sponsors the Public Employees Pension Plan (PEPP). The government provides contributions to the plan at specified rates for employee current service. The government also contributes to the Saskatchewan Teachers’ Retirement Plan (STRP) which is sponsored by the Saskatchewan Teachers’ Federation, as well as the Municipal Employees’ Pension Plan (MEPP) and the Regina Civic Employees’ Superannuation and Benefit Plan (RCESP). The government’s share of contributions to the defined contribution plans is fully funded.
Information on the defined contribution plans of government service organizations is as follows:
| 2026 | 2025 | |||||||||||||||||||||||
| PEPP | STRP1 | MEPP2 | RCESP3 | Total | Total | |||||||||||||||||||
| Government Sponsored |
||||||||||||||||||||||||
| Plan status |
Open | Open | Open | Open | n/a | n/a | ||||||||||||||||||
| Employee contribution rate (percentage of salary) |
4.50-9.00 | 4 | 10.00 | 9.00 | 8.25-12.25 | n/a | n/a | |||||||||||||||||
| Government contribution rate (percentage of salary) |
5.00-11.50 | 4 | 7.25-9.25 | 9.00 | 8.25-12.25 | n/a | n/a | |||||||||||||||||
| Government service organization participation |
||||||||||||||||||||||||
| Number of active employees |
21,736 | 15,835 | 11,365 | 2,457 | 51,393 | 50,433 | ||||||||||||||||||
| Employee contributions (thousands of dollars) |
127,202 | 136,046 | 32,216 | 11,627 | 307,091 | 278,552 | ||||||||||||||||||
| Government contributions (thousands of dollars) |
148,912 | 115,333 | 32,215 | 11,801 | 308,261 | 273,944 | ||||||||||||||||||
| 1 | Teachers employed by Boards of Education after July 1, 1980 participate in STRP, a contributory defined benefit pension plan. The government contributes an amount which is set through provincial negotiations. |
| 2 | Certain employees of Boards of Education and Regional Colleges participate in MEPP, a multi-employer defined benefit plan. All costs, including costs of any actuarially determined deficiency, are equally shared by the employers and employees. At December 31, 2025, audited financial statements for MEPP reported an accrued benefit obligation of $2.73 billion (2024 - $2.54 billion) and plan assets at market value of $4.36 billion (2024 - $4.06 billion). The market value of plan assets is $4.40 billion at March 31, 2026. |
| 3 | Certain employees of the Saskatchewan Health Authority and a Board of Education participate in RCESP, a multi-employer defined benefit plan. Beginning in January 2025, the employee and government contribution rates are funded on a 50:50 basis. At December 31, 2025, audited financial statements for RCESP reported an accrued benefit obligation of $1.72 billion (2024 - $1.70 billion) and plan assets at market value of $1.97 billion (2024 - $1.94 billion). The market value of plan assets was $1.96 billion at March 31, 2026. |
| 4 | Contribution rate varies based on employee group. |
| 58 | Government of Saskatchewan Public Accounts 2025-26 |
Summary Financial Statements
Notes to the Financial Statements
5. Retirement Benefits (continued)
Pension expense
The total pension expense of government service organizations includes the following:
| (thousands of dollars) | 2026 | 2025 | ||||||
| Defined benefit plans |
||||||||
| Current period benefit cost |
23,062 | 19,478 | ||||||
| Amortization of estimation adjustments |
(21,865 | ) | 64,054 | |||||
| Employee contributions |
(5,632 | ) | (4,911 | ) | ||||
| Change in valuation allowance |
4,607 | 3,782 | ||||||
| Pension interest cost (schedule 16) |
182,052 | 181,829 | ||||||
|
|
|
|
|
|||||
| Pension expense, defined benefit plans |
182,224 | 264,232 | ||||||
| Other plans |
||||||||
| Pension expense, joint defined benefit plan |
195,079 | 206,357 | ||||||
| Pension expense, defined contribution plans |
308,261 | 273,944 | ||||||
|
|
|
|
|
|||||
| Total Pension Expense (schedule 17) |
685,564 | 744,533 | ||||||
|
|
|
|
|
|||||
Government business enterprises
Defined benefit plans
There are additional pension plans which are accounted for in the investment in government business enterprises. The two main defined benefit plans of government business enterprises are the Power Corporation Superannuation Plan (SaskPower) and the Saskatchewan Telecommunications Pension Plan (SaskTel). Other plans include the Saskatchewan Government Insurance Superannuation Plan (SGI) and the Liquor Board Superannuation Plan. Plan sponsors for the SGI and SaskTel plans are pursuing termination and taking steps to wind up the plans in the next few years.
The government contributes the amount necessary to fund the payment of pension benefits.
Information on the defined benefit plans of government business enterprises is as follows:
| 2026 | 2025 | |||||||||||||||||||
| SaskPower | SaskTel | Others | Total | Total | ||||||||||||||||
| Plan status |
Closed | Closed | Closed | n/a | n/a | |||||||||||||||
| Number of active employees |
1 | 3 | 1 | 5 | 6 | |||||||||||||||
| Number of former employees, superannuates and surviving spouses |
1,333 | 1,617 | 179 | 3,129 | 3,256 | |||||||||||||||
| Government contributions (thousands of dollars) |
— | — | 1,880 | 1,880 | 2,628 | |||||||||||||||
| Benefits paid (thousands of dollars) |
56,618 | 60,138 | 4,945 | 121,701 | 124,101 | |||||||||||||||
| Actuarial valuation date |
Sept. 30/24 | Mar. 31/23 | Various | n/a | n/a | |||||||||||||||
| Long-term assumptions used |
||||||||||||||||||||
| Discount rate (percentage) |
4.85 | 4.80 | 4.90 | n/a | n/a | |||||||||||||||
| Inflation rate (percentage) |
2.00 | 2.25 | 2.00 | n/a | n/a | |||||||||||||||
| Post-retirement index (percentage of annual increase in Consumer Price Index) |
70.00 | 100.00 | Various | n/a | n/a | |||||||||||||||
| Government of Saskatchewan Public Accounts 2025-26 | 59 |
Summary Financial Statements
Notes to the Financial Statements
5. Retirement Benefits (continued)
Based on the latest actuarial valuation with extrapolations to the government business enterprises’ year ends, the present value of the accrued benefit obligation and the fair value of plan assets are shown in the table below:
| (thousands of dollars) | 2026 | 2025 | ||||||||||||||||||
| SaskPower | SaskTel | Others | Total | Total | ||||||||||||||||
| Accrued benefit obligation |
614,067 | 697,275 | 35,973 | 1,347,315 | 1,434,733 | |||||||||||||||
| Fair value of plan assets |
614,942 | 800,698 | 14,322 | 1,429,962 | 1,504,736 | |||||||||||||||
|
|
|
|
|
|
|
|
|
|
|
|||||||||||
| Plan (Surplus) Deficit |
(875 | ) | (103,423 | ) | 21,651 | (82,647 | ) | (70,003 | ) | |||||||||||
| Valuation allowance |
875 | 103,423 | 2,498 | 106,796 | 114,150 | |||||||||||||||
|
|
|
|
|
|
|
|
|
|
|
|||||||||||
| Pension Liabilities |
— | — | 24,149 | 24,149 | 44,147 | |||||||||||||||
|
|
|
|
|
|
|
|
|
|
|
|||||||||||
Defined contribution plan
Information on government business enterprises’ participation in PEPP is as follows:
| 2026 | 2025 | |||||||
| Plan status |
Open | Open | ||||||
| Employee contribution rate (percentage of salary)1 |
4.45-8.60 | 4.45-8.60 | ||||||
| Government contribution rate (percentage of salary)1 |
5.50-11.00 | 5.50-11.00 | ||||||
| Government business enterprise participation |
||||||||
| Number of active employees |
13,192 | 13,275 | ||||||
| Government contributions (thousands of dollars) |
92,302 | 87,971 | ||||||
| 1 | Contribution rate varies based on employee group. |
Pension expense
Pension expense for government business enterprises is included in net income from government business enterprises. The total pension expense of government business enterprises includes the following:
| (thousands of dollars) | 2026 | 2025 | ||||||
| Defined benefit plans |
(2,053 | ) | (2,463 | ) | ||||
| Defined contribution plan |
92,302 | 87,971 | ||||||
|
|
|
|
|
|||||
| Total Pension Expense |
90,249 | 85,508 | ||||||
|
|
|
|
|
|||||
| Net Pension (Gain) Loss Included in Other Comprehensive Income |
(16,065 | ) | 4,150 | |||||
|
|
|
|
|
|||||
| 60 | Government of Saskatchewan Public Accounts 2025-26 |
Summary Financial Statements
Notes to the Financial Statements
6. Trust Funds
Trust fund assets held and administered by the government are as follows:
| (thousands of dollars) | 2026 | 2025 | ||||||
| (Restated) | ||||||||
| Pension plans and annuity funds |
21,998,615 | 20,817,011 | ||||||
| Employee benefit plans |
746,783 | 720,882 | ||||||
| Public Guardian and Trustee of Saskatchewan |
334,916 | 323,885 | ||||||
| Others |
53,299 | 45,214 | ||||||
|
|
|
|
|
|||||
| Total Trust Fund Assets1 |
23,133,613 | 21,906,992 | ||||||
|
|
|
|
|
|||||
| 1 | Amounts are based on the latest available financial statements of the funds closest to March 31, 2026. |
7. Contractual Rights and Obligations
Contractual Rights
The government has the following contractual rights reported by the year the amounts are expected to be recognized:
| (thousands of dollars) | 2026 | 2025 | ||||||||||||||||||||||||||||||
| 2027 | 2028 | 2029 | 2030 | 2031 | Thereafter | Total | Total | |||||||||||||||||||||||||
| (Restated) | ||||||||||||||||||||||||||||||||
| Government Service Organizations |
||||||||||||||||||||||||||||||||
| Transfers from the federal government |
||||||||||||||||||||||||||||||||
| Operating1 |
686,007 | 607,732 | 459,865 | 465,473 | 408,206 | 32,872 | 2,660,155 | 1,713,873 | ||||||||||||||||||||||||
| Capital |
162,835 | 119,431 | 57,122 | 54,424 | 44,930 | 134,937 | 573,679 | 663,319 | ||||||||||||||||||||||||
| Other own-source revenue |
||||||||||||||||||||||||||||||||
| Fees |
||||||||||||||||||||||||||||||||
| Real property sales and leases |
62,637 | 18,706 | 16,139 | 14,292 | 13,544 | 90,885 | 216,203 | 235,482 | ||||||||||||||||||||||||
| Other fees |
61,240 | 61,921 | 65,800 | 11,972 | 10,347 | 60,368 | 271,648 | 230,450 | ||||||||||||||||||||||||
|
|
|
|
|
|
|
|
|
|
|
|
|
|
|
|
|
|||||||||||||||||
| Total Government Service Organizations |
972,719 | 807,790 | 598,926 | 546,161 | 477,027 | 319,062 | 3,721,685 | 2,843,124 | ||||||||||||||||||||||||
|
|
|
|
|
|
|
|
|
|
|
|
|
|
|
|
|
|||||||||||||||||
| Government Business Enterprises |
||||||||||||||||||||||||||||||||
| Utility sector |
367,150 | 111,652 | 48,285 | 2,515 | — | — | 529,602 | 737,286 | ||||||||||||||||||||||||
| Liquor and gaming sector2 |
142,507 | 146,882 | 151,553 | 156,526 | 161,826 | — | 759,294 | 691,151 | ||||||||||||||||||||||||
|
|
|
|
|
|
|
|
|
|
|
|
|
|
|
|
|
|||||||||||||||||
| Total Government Business Enterprises |
509,657 | 258,534 | 199,838 | 159,041 | 161,826 | — | 1,288,896 | 1,428,437 | ||||||||||||||||||||||||
|
|
|
|
|
|
|
|
|
|
|
|
|
|
|
|
|
|||||||||||||||||
| Total Contractual Rights3 |
1,482,376 | 1,066,324 | 798,764 | 705,202 | 638,853 | 319,062 | 5,010,581 | 4,271,561 | ||||||||||||||||||||||||
|
|
|
|
|
|
|
|
|
|
|
|
|
|
|
|
|
|||||||||||||||||
| 1 | The contractual rights for federal operating transfer agreements with no expiration date include estimated revenue for up to 10 contract years. Contractual rights beyond this could be significant. |
| 2 | A gaming agreement has an expiration date that extends to 2037 for which contractual rights beyond 2031 are not included and could be significant. |
| 3 | Contractual rights that cannot be reasonably estimated have not been included in the table above but could be significant. These rights include transfers under the Sustainable Canadian Agricultural Partnership, whereby federal funding is allocated based on annual crop yields and losses due to crop or livestock damage. |
| Government of Saskatchewan Public Accounts 2025-26 | 61 |
Summary Financial Statements
Notes to the Financial Statements
7. Contractual Rights and Obligations (continued)
Contractual Obligations
The government has the following contractual obligations reported by the year the amounts are expected to be recognized:
| (thousands of dollars) | 2026 | 2025 | ||||||||||||||||||||||||||||||
| 2027 | 2028 | 2029 | 2030 | 2031 | Thereafter | Total | Total | |||||||||||||||||||||||||
| (Restated) | ||||||||||||||||||||||||||||||||
| Government Service Organizations |
||||||||||||||||||||||||||||||||
| Transfers |
||||||||||||||||||||||||||||||||
| Post secondary education |
450,267 | 461,684 | 472,251 | 485,817 | — | — | 1,870,019 | 424,552 | ||||||||||||||||||||||||
| Policing |
303,834 | 290,679 | 295,898 | 303,296 | 310,878 | 318,650 | 1,823,235 | 1,810,053 | ||||||||||||||||||||||||
| Social supports and services |
481,588 | 276,569 | 166,470 | — | — | — | 924,627 | 682,897 | ||||||||||||||||||||||||
| Health and medical services and supports |
276,133 | 164,774 | 119,073 | 71,316 | 67,183 | 10,229 | 708,708 | 598,740 | ||||||||||||||||||||||||
| Gaming |
104,379 | 107,216 | 110,214 | 113,377 | 116,717 | — | 551,903 | 534,352 | ||||||||||||||||||||||||
| Capital |
235,621 | 166,170 | 36,452 | 9,397 | 1,958 | 815 | 450,413 | 536,551 | ||||||||||||||||||||||||
| Beverage container collection and recycling |
37,047 | 37,930 | — | — | — | — | 74,977 | 111,602 | ||||||||||||||||||||||||
| Reseach and development |
22,490 | 17,101 | 3,536 | 1,742 | 892 | 162 | 45,923 | 53,728 | ||||||||||||||||||||||||
| Other |
95,350 | 49,823 | 21,977 | 7,948 | 2,253 | — | 177,351 | 189,291 | ||||||||||||||||||||||||
| Construction and acquisition of tangible capital assets |
791,960 | 284,761 | 195,104 | 43,782 | 916 | 760 | 1,317,283 | 1,470,881 | ||||||||||||||||||||||||
| Operation, maintenance and life cycle rehabilitation payments under P3s |
30,620 | 35,000 | 43,396 | 44,536 | 46,231 | 872,112 | 1,071,895 | 1,096,202 | ||||||||||||||||||||||||
| Service agreements |
||||||||||||||||||||||||||||||||
| Computer |
218,438 | 126,563 | 92,477 | 65,862 | 39,903 | 10,489 | 553,732 | 430,148 | ||||||||||||||||||||||||
| Transportation |
42,448 | 39,337 | 21,963 | 7,650 | 4,547 | 1,340 | 117,285 | 130,000 | ||||||||||||||||||||||||
| Emergency communications |
16,514 | 17,043 | 3,032 | — | — | — | 36,589 | 52,913 | ||||||||||||||||||||||||
| Other |
65,648 | 42,886 | 33,055 | 25,149 | 17,981 | 52,401 | 237,120 | 129,004 | ||||||||||||||||||||||||
| Operating lease agreements |
109,137 | 85,618 | 70,126 | 53,243 | 37,015 | 134,494 | 489,633 | 464,438 | ||||||||||||||||||||||||
| Other |
4,507 | 4,507 | 4,507 | — | — | 6,533 | 20,054 | 24,480 | ||||||||||||||||||||||||
|
|
|
|
|
|
|
|
|
|
|
|
|
|
|
|
|
|||||||||||||||||
| Total Government Service Organizations1 |
3,285,981 | 2,207,661 | 1,689,531 | 1,233,115 | 646,474 | 1,407,985 | 10,470,747 | 8,739,832 | ||||||||||||||||||||||||
|
|
|
|
|
|
|
|
|
|
|
|
|
|
|
|
|
|||||||||||||||||
| Government Business Enterprises |
||||||||||||||||||||||||||||||||
| Forward purchase contracts |
||||||||||||||||||||||||||||||||
| Power |
491,947 | 559,634 | 628,449 | 721,001 | 762,806 | 13,659,065 | 16,822,902 | 14,266,939 | ||||||||||||||||||||||||
| Natural gas |
208,799 | 167,467 | 159,920 | 106,946 | 67,029 | 179,920 | 890,081 | 906,520 | ||||||||||||||||||||||||
| Coal |
207,404 | 247,187 | 212,927 | 116,381 | — | — | 783,899 | 1,035,680 | ||||||||||||||||||||||||
| Other |
— | — | — | — | — | — | — | 49,922 | ||||||||||||||||||||||||
| Construction, acquisition and maintenance of capital assets |
3,121,933 | 833,205 | 454,868 | 218,064 | 154,307 | 464,158 | 5,246,535 | 4,977,518 | ||||||||||||||||||||||||
| Service agreements |
210,308 | 28,434 | 12,160 | 3,986 | 2,118 | 1,590 | 258,596 | 256,856 | ||||||||||||||||||||||||
| Other |
7,834 | 5,020 | 3,340 | 3,336 | 3,331 | 16,778 | 39,639 | 12,668 | ||||||||||||||||||||||||
|
|
|
|
|
|
|
|
|
|
|
|
|
|
|
|
|
|||||||||||||||||
| Total Government Business Enterprises |
4,248,225 | 1,840,947 | 1,471,664 | 1,169,714 | 989,591 | 14,321,511 | 24,041,652 | 21,506,103 | ||||||||||||||||||||||||
|
|
|
|
|
|
|
|
|
|
|
|
|
|
|
|
|
|||||||||||||||||
| Total Contractual Obligations |
7,534,206 | 4,048,608 | 3,161,195 | 2,402,829 | 1,636,065 | 15,729,496 | 34,512,399 | 30,245,935 | ||||||||||||||||||||||||
|
|
|
|
|
|
|
|
|
|
|
|
|
|
|
|
|
|||||||||||||||||
| 1 | Contractual obligations for government service organizations by theme are as follows: |
| 2026 | 2025 | |||||||
| Education |
2,331,006 | 932,943 | ||||||
| Protection of persons and property |
2,097,839 | 2,083,432 | ||||||
| Health |
1,463,457 | 1,226,273 | ||||||
| General government |
1,357,004 | 1,376,841 | ||||||
| Community development |
1,007,519 | 1,087,137 | ||||||
| Social services and assistance |
959,248 | 737,519 | ||||||
| Transportation |
901,774 | 950,438 | ||||||
| Environment and natural resources |
180,972 | 172,095 | ||||||
| Economic development |
86,007 | 94,116 | ||||||
| Agriculture |
85,921 | 79,038 | ||||||
|
|
|
|
|
|||||
| Total Government Service Organizations |
10,470,747 | 8,739,832 | ||||||
|
|
|
|
|
|||||
| 62 | Government of Saskatchewan Public Accounts 2025-26 |
Summary Financial Statements
Notes to the Financial Statements
8. Contingencies
Contingent Assets
The government has instituted claims against opioid manufacturers for the recovery of health care benefits paid as a result of opioid consumption and marketing. The amount of the potential recovery cannot be estimated.
Contingent Liabilities
The government is involved in various legal actions, the outcome of which is not determinable. Up to $602 million (2025 - $606 million) may be paid depending on the outcome of lawsuits in progress which include aboriginal land claims, claims for damages to persons and property and disputes over taxes and funding.
The government also has up to $12 million (2025 - $5 million) in other contingent liabilities that are dependent on guaranteed debt repayments and environmental remediation.
9. Restatement for Change in Accounting Policy
During 2025-26, there was a change to the accounting policy for amortization of certain tangible capital assets. The change was accounted for retroactively resulting in a decrease to tangible capital assets as at April 1, 2024 and a corresponding increase to opening accumulated operating deficit of $92 million. Accordingly, the 2025-26 budgeted adjustment to the opening accumulated deficit of $152 million has been removed from the budget column in the Statement of Accumulated Operating Deficit, as the opening accumulated deficit now reflects the restated figures. Additionally, this adjustment has been removed from the budget column in the Statement of Change in Net Debt as the restatement did not impact net debt.
10. Small Modular Reactor Investment Fund
The Small Modular Reactor Investment Fund (SMRIF) is a segregated fund designed to support the future development of a small modular nuclear reactor. The SMRIF, as part of the General Revenue Fund, consists of revenue from the electricity sector net of any Clean Electricity Transition Grants. Investment income earned is retained in the SMRIF.
| (thousands of dollars) | 2026 | 2025 | ||||||||||
| Budget | Actual | Actual | ||||||||||
| Electricity sector revenue |
||||||||||||
| Output-Based Performance Standards |
346,600 | 396,875 | 280,493 | |||||||||
| SaskPower corporation capital tax |
60,800 | 69,151 | 61,992 | |||||||||
| SaskPower usage-based payments |
31,400 | 29,035 | 31,137 | |||||||||
| SMRIF investment income |
21,000 | 18,360 | 9,416 | |||||||||
|
|
|
|
|
|
|
|||||||
| Total electricity sector revenue1 |
459,800 | 513,421 | 383,038 | |||||||||
| Clean Electricity Transition Grant2 |
(174,700 | ) | (174,710 | ) | (140,000 | ) | ||||||
|
|
|
|
|
|
|
|||||||
| Net electricity sector revenue attributable to SMRIF |
285,100 | 338,711 | 243,038 | |||||||||
|
|
|
|
|
|
|
|||||||
| Small Modular Reactor Investment Fund |
| |||||||||||
| SMRIF, beginning of year |
580,891 | 580,891 | 337,853 | |||||||||
| Net electricity sector revenue attributable to SMRIF |
285,100 | 338,711 | 243,038 | |||||||||
|
|
|
|
|
|
|
|||||||
| SMRIF, end of year3 |
865,991 | 919,602 | 580,891 | |||||||||
|
|
|
|
|
|
|
|||||||
| 1 | Included in own-source revenue (schedule 14). |
| 2 | Included in environment and natural resources transfers expense. |
| 3 | Comprised of $319 million (2025 - $43 million) of cash, $470 million (2025 - $448 million) of portfolio investments, and $131 million (2025 - $90 million) of accounts receivable. |
11. Comparative Figures
Certain 2025 comparative figures are reclassified to conform with the current year’s presentation.
| Government of Saskatchewan Public Accounts 2025-26 | 63 |
Summary Financial Statements
| Accounts Receivable | Schedule 1 | |||
| As at March 31, 2026 | ||||
| (thousands of dollars) |
| 2026 | 2025 | |||||||
| Taxation |
719,569 | 703,767 | ||||||
| Non-renewable resources |
285,145 | 296,083 | ||||||
| Other own-source1 |
1,806,799 | 1,735,961 | ||||||
| Transfers from the federal government |
776,042 | 539,354 | ||||||
|
|
|
|
|
|||||
| Total Accounts Receivable |
3,587,555 | 3,275,165 | ||||||
| Provision for loss |
(285,210 | ) | (249,374 | ) | ||||
|
|
|
|
|
|||||
| Accounts Receivable |
3,302,345 | 3,025,791 | ||||||
|
|
|
|
|
|||||
| 1 | Includes $214 million (2025 - $400 million), the province’s estimated remaining proceeds to be received in annual payments expected to continue for at least the next 20 years from the resolution of litigation between three tobacco manufacturers and provincial and territorial governments. There is significant uncertainty over the amount and timing of the future payments as these are dependent on the profitability of the three major tobacco companies from the sale of tobacco products. |
| 64 | Government of Saskatchewan Public Accounts 2025-26 |
Summary Financial Statements
| Loans Receivable | Schedule 2 | |||
| As at March 31, 2026 | ||||
| (thousands of dollars) |
| 2026 | 2025 | |||||||
| Loans to government business enterprises1 |
899,488 | 916,644 | ||||||
| Student loans2 |
601,132 | 559,279 | ||||||
| Other3 |
1,284 | 2,745 | ||||||
|
|
|
|
|
|||||
| Total Loans Receivable |
1,501,904 | 1,478,668 | ||||||
| Provision for loss |
(135,622 | ) | (123,052 | ) | ||||
|
|
|
|
|
|||||
| Loans Receivable |
1,366,282 | 1,355,616 | ||||||
|
|
|
|
|
|||||
| 1 | The government has $975 million (2025 - $975 million) in loans receivable from government business enterprises repayable over 1 to 19 years and bearing interest between 3.4 and 5.2 per cent (2025 - 3.4 and 5.2 per cent). The loans are recorded net of $76 million (2025 - $63 million) for the government business enterprises’ equity in sinking funds administered by the government. In 2024-25, the Government had an additional loan receivable of $5 million from a government business enterprise that was due within one year. |
| 2 | Student loans are interest free until the discontinuance of full-time studies or graduation. Interest rates are prescribed by the government and range between 4.0 and 4.9 per cent (2025 - 4.0 and 4.9 per cent). Student grants and other varieties of loan forgiveness are available to students who meet specific criteria. |
The administration and delivery of the federal and provincial student loans programs is integrated. The government approves applications for both provincial and federal loans. External agencies are contracted to disburse, administer and collect loans, and the federal government is responsible for collection of loans in default.
A loss provision of $135 million (2025 - $122 million) is recorded on these loans.
| 3 | Consists of numerous loans at various interest rates and maturities. Security varies and may include promissory notes or mortgages on real property. A loss provision of $1 million (2025 - $1 million) is recorded on these loans. |
| Government of Saskatchewan Public Accounts 2025-26 | 65 |
Summary Financial Statements
Investment in Government Business Enterprises
As at March 31, 2026
(thousands of dollars)
| Utility | ||||||||||||||||||||
| Sask Gov’t | ||||||||||||||||||||
| SaskEnergy | SaskPower | SaskTel | SaskWater | Insurance | ||||||||||||||||
| Assets |
||||||||||||||||||||
| Cash and cash equivalents |
732 | 72,253 | 15,568 | 3,314 | 45,107 | |||||||||||||||
| Accounts receivable |
167,414 | 578,200 | 296,901 | 8,281 | 149,381 | |||||||||||||||
| Inventories |
27,166 | 433,855 | 35,653 | 1,583 | — | |||||||||||||||
| Sinking fund investments |
172,834 | 963,262 | 185,589 | 21,867 | — | |||||||||||||||
| Other investments3 |
— | — | — | — | 1,786,636 | |||||||||||||||
| Capital assets |
3,684,093 | 13,782,523 | 2,742,083 | 412,800 | 22,436 | |||||||||||||||
| Intangible assets |
42,362 | 89,724 | 398,416 | 57 | 4,612 | |||||||||||||||
| Other assets |
2,789 | 84,998 | 206,713 | 1,550 | 27,704 | |||||||||||||||
|
|
|
|
|
|
|
|
|
|
|
|||||||||||
| Total Assets4 |
4,097,390 | 16,004,815 | 3,880,923 | 449,452 | 2,035,876 | |||||||||||||||
|
|
|
|
|
|
|
|
|
|
|
|||||||||||
| Liabilities |
||||||||||||||||||||
| Accounts payable and accrued liabilities |
151,657 | 869,016 | 206,897 | 4,431 | 45,873 | |||||||||||||||
| Dividends payable to government entities |
15,890 | — | 11,692 | 1,307 | — | |||||||||||||||
| Gross debt |
2,231,456 | 10,512,200 | 2,058,967 | 112,264 | — | |||||||||||||||
| Insurance contract liabilities |
— | — | — | — | 1,228,900 | |||||||||||||||
| Other liabilities6 |
340,521 | 1,703,350 | 197,700 | 240,693 | 15,535 | |||||||||||||||
|
|
|
|
|
|
|
|
|
|
|
|||||||||||
| Total Liabilities4 |
2,739,524 | 13,084,566 | 2,475,256 | 358,695 | 1,290,308 | |||||||||||||||
|
|
|
|
|
|
|
|
|
|
|
|||||||||||
| Net Assets |
1,357,866 | 2,920,249 | 1,405,667 | 90,757 | 745,568 | |||||||||||||||
|
|
|
|
|
|
|
|
|
|
|
|||||||||||
| Revenue |
||||||||||||||||||||
| Operating |
990,982 | 3,350,553 | 1,409,751 | 73,603 | 1,469,931 | |||||||||||||||
| Investment income5 |
— | 4,968 | 6,989 | 221 | 103,383 | |||||||||||||||
|
|
|
|
|
|
|
|
|
|
|
|||||||||||
| Total Revenue4 |
990,982 | 3,355,521 | 1,416,740 | 73,824 | 1,573,314 | |||||||||||||||
|
|
|
|
|
|
|
|
|
|
|
|||||||||||
| Expense |
||||||||||||||||||||
| Operating |
836,237 | 3,024,858 | 1,259,916 | 63,190 | 68,837 | |||||||||||||||
| Insurance claims |
— | — | — | — | 1,428,040 | |||||||||||||||
| Financing charges5 |
70,353 | 444,082 | 52,143 | 2,764 | 713 | |||||||||||||||
|
|
|
|
|
|
|
|
|
|
|
|||||||||||
| Total Expense4 |
906,590 | 3,468,940 | 1,312,059 | 65,954 | 1,497,590 | |||||||||||||||
|
|
|
|
|
|
|
|
|
|
|
|||||||||||
| Income (loss) from operations |
84,392 | (113,419 | ) | 104,681 | 7,870 | 75,724 | ||||||||||||||
| Unusual items |
— | — | — | — | — | |||||||||||||||
|
|
|
|
|
|
|
|
|
|
|
|||||||||||
| Net Income (Loss) from Government Business Enterprises |
84,392 | (113,419 | ) | 104,681 | 7,870 | 75,724 | ||||||||||||||
| Retained earnings (loss), beginning of year |
1,295,726 | 2,312,551 | 1,028,317 | 79,841 | 609,638 | |||||||||||||||
| Adjustment to retained earnings (loss) |
— | — | — | — | — | |||||||||||||||
| Dividends to government entities |
(33,827 | ) | — | (41,872 | ) | (4,722 | ) | (16,000 | ) | |||||||||||
|
|
|
|
|
|
|
|
|
|
|
|||||||||||
| Retained earnings, end of year |
1,346,291 | 2,199,132 | 1,091,126 | 82,989 | 669,362 | |||||||||||||||
|
|
|
|
|
|
|
|
|
|
|
|||||||||||
| Accumulated other comprehensive (loss) income, beginning of year |
(6,797 | ) | 155,210 | 86,473 | (398 | ) | (4,281 | ) | ||||||||||||
| Other comprehensive (loss) income |
(3,159 | ) | (27,093 | ) | (8,932 | ) | (534 | ) | 487 | |||||||||||
|
|
|
|
|
|
|
|
|
|
|
|||||||||||
| Accumulated other comprehensive (loss) income, end of year |
(9,956 | ) | 128,117 | 77,541 | (932 | ) | (3,794 | ) | ||||||||||||
|
|
|
|
|
|
|
|
|
|
|
|||||||||||
| Equity advances from government entities |
21,531 | 593,000 | 237,000 | 8,700 | 80,000 | |||||||||||||||
|
|
|
|
|
|
|
|
|
|
|
|||||||||||
| Investment in Government Business Enterprises |
1,357,866 | 2,920,249 | 1,405,667 | 90,757 | 745,568 | |||||||||||||||
|
|
|
|
|
|
|
|
|
|
|
|||||||||||
| 1 | Net assets are a held on behalf of Saskatchewan’s motoring public and cannot be used for any other purpose; b maintained in an injury fund and cannot be used for any other purpose. |
| 2 | Adjustments primarily include the elimination of unrealized inter-entity gains and losses. |
| 3 | Includes bonds and debentures of $2.97 billion (2025 - $3.03 billion) that bear interest at rates up to 8.5 per cent (2025 - up to 6.5 per cent) and have maturity dates up to 51.5 years (2025 - up to 52.5 years). |
| 4 | Total assets include $1.70 billion (2025 - $1.58 billion) due from or invested in public sector entities (entities); total liabilities include $15.28 billion (2025 - $13.78 billion) in gross debt owing to entities and $642 million (2025 - $575 million) in accounts payable or services due to entities; total revenue includes $810 million (2025 - $608 million) from entities; and total expense includes $1.54 billion (2025 - $1.36 billion) paid and owing to entities. |
| 5 | Financing charges is reported net of sinking fund earnings. Financing charges in the amount of $447 million (2025 - $412 million) was paid and owing to entities. |
| 66 | Government of Saskatchewan Public Accounts 2025-26 |
Summary Financial Statements
Schedule 3
| 2026 | 2025 | |||||||||||||||||||||||||||||||
| Insurance & Financing | Liquor & Gaming | |||||||||||||||||||||||||||||||
| Sask Auto Fund1a |
Workers’ Comp.1b |
Municipal Financing Corp. |
Sask Liquor & Gaming Authority |
Lotteries & Gaming Sask |
Adjustments2 |
Total | Total | |||||||||||||||||||||||||
| 57,738 | 83,137 | 717 | 24,018 | 47,418 | — | 350,002 | 436,608 | |||||||||||||||||||||||||
| 37,220 | 4,132 | 5,842 | 34,929 | 78,660 | — | 1,360,960 | 1,222,573 | |||||||||||||||||||||||||
| 5,182 | — | — | 22,387 | 125 | — | 525,951 | 511,611 | |||||||||||||||||||||||||
| — | — | 24,721 | — | — | — | 1,368,273 | 1,335,626 | |||||||||||||||||||||||||
| 3,052,237 | 2,530,698 | 342,384 | — | 17,954 | — | 7,729,909 | 7,564,043 | |||||||||||||||||||||||||
| 43,742 | 16,069 | — | 34,746 | 173,620 | (131,117 | ) | 20,780,995 | 19,429,150 | ||||||||||||||||||||||||
| 31,374 | 359 | — | 3,813 | — | — | 570,717 | 543,353 | |||||||||||||||||||||||||
| 624 | 2,817 | — | 1,471 | 1,920 | — | 330,586 | 355,287 | |||||||||||||||||||||||||
|
|
|
|
|
|
|
|
|
|
|
|
|
|
|
|
|
|||||||||||||||||
| 3,228,117 | 2,637,212 | 373,664 | 121,364 | 319,697 | (131,117 | ) | 33,017,393 | 31,398,251 | ||||||||||||||||||||||||
|
|
|
|
|
|
|
|
|
|
|
|
|
|
|
|
|
|||||||||||||||||
| 83,109 | 19,627 | 1,646 | 17,675 | 66,963 | — | 1,466,894 | 1,411,921 | |||||||||||||||||||||||||
| — | — | — | 66,398 | 57,272 | — | 152,559 | 157,233 | |||||||||||||||||||||||||
| — | — | 351,701 | — | 18,884 | — | 15,285,472 | 13,788,617 | |||||||||||||||||||||||||
| 2,511,380 | 1,918,635 | — | — | — | — | 5,658,915 | 5,567,448 | |||||||||||||||||||||||||
| — | 15,035 | — | 37,291 | 2,669 | (179,417 | ) | 2,373,377 | 2,338,532 | ||||||||||||||||||||||||
|
|
|
|
|
|
|
|
|
|
|
|
|
|
|
|
|
|||||||||||||||||
| 2,594,489 | 1,953,297 | 353,347 | 121,364 | 145,788 | (179,417 | ) | 24,937,217 | 23,263,751 | ||||||||||||||||||||||||
|
|
|
|
|
|
|
|
|
|
|
|
|
|
|
|
|
|||||||||||||||||
| 633,628 | 683,915 | 20,317 | — | 173,909 | 48,300 | 8,080,176 | 8,134,500 | |||||||||||||||||||||||||
|
|
|
|
|
|
|
|
|
|
|
|
|
|
|
|
|
|||||||||||||||||
| 1,331,689 | 378,620 | — | 627,374 | 799,761 | (25,724 | ) | 10,406,540 | 10,059,848 | ||||||||||||||||||||||||
| 170,287 | 204,988 | 12,913 | — | 2,293 | — | 506,042 | 705,835 | |||||||||||||||||||||||||
|
|
|
|
|
|
|
|
|
|
|
|
|
|
|
|
|
|||||||||||||||||
| 1,501,976 | 583,608 | 12,913 | 627,374 | 802,054 | (25,724 | ) | 10,912,582 | 10,765,683 | ||||||||||||||||||||||||
|
|
|
|
|
|
|
|
|
|
|
|
|
|
|
|
|
|||||||||||||||||
| 225,496 | 90,160 | 53 | 384,050 | 557,132 | 2,671 | 6,512,600 | 6,120,786 | |||||||||||||||||||||||||
| 1,369,736 | 474,408 | — | — | — | — | 3,272,184 | 3,306,431 | |||||||||||||||||||||||||
| — | 318 | 12,289 | 1,716 | 5,843 | — | 590,221 | 554,267 | |||||||||||||||||||||||||
|
|
|
|
|
|
|
|
|
|
|
|
|
|
|
|
|
|||||||||||||||||
| 1,595,232 | 564,886 | 12,342 | 385,766 | 562,975 | 2,671 | 10,375,005 | 9,981,484 | |||||||||||||||||||||||||
|
|
|
|
|
|
|
|
|
|
|
|
|
|
|
|
|
|||||||||||||||||
| (93,256 | ) | 18,722 | 571 | 241,608 | 239,079 | (28,395 | ) | 537,577 | 784,199 | |||||||||||||||||||||||
| — | — | — | (92 | ) | — | — | (92 | ) | 392 | |||||||||||||||||||||||
|
|
|
|
|
|
|
|
|
|
|
|
|
|
|
|
|
|||||||||||||||||
| (93,256 | ) | 18,722 | 571 | 241,516 | 239,079 | (28,395 | ) | 537,485 | 784,591 | |||||||||||||||||||||||
| 726,884 | 665,193 | 20,593 | (3,472 | ) | 150,076 | 75,718 | 6,961,065 | 6,723,471 | ||||||||||||||||||||||||
| — | — | — | (832 | ) | (145 | ) | 977 | — | — | |||||||||||||||||||||||
| — | — | — | (242,976 | ) | (215,101 | ) | — | (554,498 | ) | (546,997 | ) | |||||||||||||||||||||
|
|
|
|
|
|
|
|
|
|
|
|
|
|
|
|
|
|||||||||||||||||
| 633,628 | 683,915 | 21,164 | (5,764 | ) | 173,909 | 48,300 | 6,944,052 | 6,961,065 | ||||||||||||||||||||||||
|
|
|
|
|
|
|
|
|
|
|
|
|
|
|
|
|
|||||||||||||||||
| — | — | (475 | ) | 3,472 | — | — | 233,204 | 197,426 | ||||||||||||||||||||||||
| — | — | (372 | ) | 2,292 | — | — | (37,311 | ) | 35,778 | |||||||||||||||||||||||
|
|
|
|
|
|
|
|
|
|
|
|
|
|
|
|
|
|||||||||||||||||
| — | — | (847 | ) | 5,764 | — | — | 195,893 | 233,204 | ||||||||||||||||||||||||
|
|
|
|
|
|
|
|
|
|
|
|
|
|
|
|
|
|||||||||||||||||
| — | — | — | — | — | — | 940,231 | 940,231 | |||||||||||||||||||||||||
|
|
|
|
|
|
|
|
|
|
|
|
|
|
|
|
|
|||||||||||||||||
| 633,628 | 683,915 | 20,317 | — | 173,909 | 48,300 | 8,080,176 | 8,134,500 | |||||||||||||||||||||||||
|
|
|
|
|
|
|
|
|
|
|
|
|
|
|
|
|
|||||||||||||||||
| 6 | Capital lease obligations, reported in other liabilities above, have the following payment schedule: |
| 2026 | 2025 | |||||||
| 2025-26 |
— | 194,493 | ||||||
| 2026-27 |
202,648 | 194,053 | ||||||
| 2027-28 |
200,416 | 192,422 | ||||||
| 2028-29 |
199,941 | 192,360 | ||||||
| 2029-30 |
199,027 | 192,090 | ||||||
| 2030-31 |
198,167 | — | ||||||
| Thereafter |
871,346 | 1,041,365 | ||||||
|
|
|
|
|
|||||
| 1,871,545 | 2,006,783 | |||||||
| Less interest and executory costs |
(818,483 | ) | (939,564 | ) | ||||
|
|
|
|
|
|||||
| Leasesa |
1,053,062 | 1,067,219 | ||||||
|
|
|
|
|
|||||
| a | Leases bear interest up to 15.8 per cent (2025 - up to 15.8 per cent) and have expiry dates up to 63.3 years (2025 - up to 64.3 years). |
| Government of Saskatchewan Public Accounts 2025-26 | 67 |
Summary Financial Statements
| Sinking Fund Investments | Schedule 4 | |
| As at March 31, 2026 | ||
| (thousands of dollars) |
| 2026 | 2025 | |||||||||||||||||||||||
| Sinking Fund | Sinking Fund | |||||||||||||||||||||||
| Investments Held for | Investments Held for | |||||||||||||||||||||||
| Government | Government | |||||||||||||||||||||||
| Business | Business | |||||||||||||||||||||||
| Enterprise | Sinking | Enterprise | Sinking | |||||||||||||||||||||
| General | Specific | Fund | General | Specific | Fund | |||||||||||||||||||
| Debt | Debt | Investments | Debt | Debt | Investments | |||||||||||||||||||
| Government Service Organization Sinking Fund Investments |
||||||||||||||||||||||||
| General Revenue Fund |
||||||||||||||||||||||||
| Operating |
976,586 | — | 976,586 | 883,379 | — | 883,379 | ||||||||||||||||||
| Saskatchewan Capital Plan |
1,313,717 | — | 1,313,717 | 1,048,118 | — | 1,048,118 | ||||||||||||||||||
| Innovation Saskatchewan |
7,737 | — | 7,737 | 7,125 | — | 7,125 | ||||||||||||||||||
|
|
|
|
|
|
|
|
|
|
|
|
|
|||||||||||||
| Total Government Service Organization Sinking Fund Investments |
2,298,040 | — | 2,298,040 | 1,938,622 | — | 1,938,622 | ||||||||||||||||||
|
|
|
|
|
|
|
|
|
|
|
|
|
|||||||||||||
| Government Business Enterprise Sinking Fund Investments1 |
||||||||||||||||||||||||
| Saskatchewan Power Corporation |
43,117 | 972,868 | 1,015,985 | 34,244 | 926,122 | 960,366 | ||||||||||||||||||
| Saskatchewan Telecommunications Holding Corporation |
1,594 | 191,524 | 193,118 | 1,043 | 167,736 | 168,779 | ||||||||||||||||||
| SaskEnergy Incorporated |
16,797 | 164,549 | 181,346 | 15,513 | 187,052 | 202,565 | ||||||||||||||||||
| Municipal Financing Corporation of Saskatchewan |
14,004 | 11,353 | 25,357 | 12,556 | 9,521 | 22,077 | ||||||||||||||||||
| Saskatchewan Water Corporation |
— | 22,787 | 22,787 | — | 20,972 | 20,972 | ||||||||||||||||||
|
|
|
|
|
|
|
|
|
|
|
|
|
|||||||||||||
| Total Government Business Enterprise Sinking Fund Investments |
75,512 | 1,363,081 | 1,438,593 | 63,356 | 1,311,403 | 1,374,759 | ||||||||||||||||||
|
|
|
|
|
|
|
|
|
|
|
|
|
|||||||||||||
| Total sinking fund investments2 3 |
2,373,552 | 1,363,081 | 3,736,633 | 2,001,978 | 1,311,403 | 3,313,381 | ||||||||||||||||||
| Government of Saskatchewan securities held as sinking fund investments (schedule 9) |
(484,317 | ) | (275,184 | ) | (759,501 | ) | (343,920 | ) | (222,734 | ) | (566,654 | ) | ||||||||||||
|
|
|
|
|
|
|
|
|
|
|
|
|
|||||||||||||
| Sinking Fund Investments |
1,889,235 | 1,087,897 | 2,977,132 | 1,658,058 | 1,088,669 | 2,746,727 | ||||||||||||||||||
|
|
|
|
|
|
|
|
|
|
|
|
|
|||||||||||||
| 1 | Schedule 3 provides information on government business enterprises (GBEs) as presented in their audited financial statements closest to March 31, 2026. The sinking fund investments reported above are $71 million (2025 - $39 million) higher than the sinking fund investments reported on schedule 3 mainly to conform to Canadian public sector accounting standards. |
| 68 | Government of Saskatchewan Public Accounts 2025-26 |
Summary Financial Statements
| Sinking Fund Investments (continued) | Schedule 4 |
| 2 | Sinking fund investment transactions during the year are as follows: |
| 2025 |
|
2026 | ||||||||||||||||||
| Sinking | Sinking | |||||||||||||||||||
| Fund | Fund | |||||||||||||||||||
| Investments | Contributionsa | Earningsb | Redemptionsc | Investments | ||||||||||||||||
| Sinking fund investments held for: |
||||||||||||||||||||
| General debt |
2,001,978 | 297,179 | 74,395 | — | 2,373,552 | |||||||||||||||
| GBE specific debt |
1,311,403 | 126,560 | 38,389 | (113,271 | ) | 1,363,081 | ||||||||||||||
|
|
|
|
|
|
|
|
|
|
|
|||||||||||
| Total Sinking Fund Investments |
3,313,381 | 423,739 | 112,784 | (113,271 | ) | 3,736,633 | ||||||||||||||
|
|
|
|
|
|
|
|
|
|
|
|||||||||||
| a | Annual contributions, established by Order in Council, are typically set at a minimum of either one or two per cent of debentures outstanding. The aggregate amount of contributions estimated to be required in each of the next five years and thereafter to meet sinking fund requirements by debt classification are as follows: |
| 2027 | 2028 | 2029 | 2030 | 2031 | Thereafter | Total | ||||||||||||||||||||||
| Sinking fund investments held for: |
||||||||||||||||||||||||||||
| General debt |
348,068 | 344,409 | 332,459 | 313,859 | 290,259 | 3,482,720 | 5,111,774 | |||||||||||||||||||||
| GBE specific debt |
129,773 | 130,504 | 129,932 | 126,582 | 124,232 | 1,972,045 | 2,613,068 | |||||||||||||||||||||
|
|
|
|
|
|
|
|
|
|
|
|
|
|
|
|||||||||||||||
| Total Sinking Fund Investment Contributions |
477,841 | 474,913 | 462,391 | 440,441 | 414,491 | 5,454,765 | 7,724,842 | |||||||||||||||||||||
|
|
|
|
|
|
|
|
|
|
|
|
|
|
|
|||||||||||||||
| b | Sinking fund investment earnings include losses on investment sales of $11 million (2025 - gains of $2 million). |
| c | Redemptions are based on the market value of the sinking fund units at the date of redemption. |
| 3 | Sinking fund investments are as follows: |
| 2026 | 2025 | |||||||
| Long-term investmentsa in securities of: |
||||||||
| Governments of other provinces (coupon interest range 0.0 to 6.5 per cent; maturing in 0.1 to 30.7 years) |
2,039,064 | 1,640,055 | ||||||
| Government of Canada (coupon interest range 1.3 to 5.0 per cent; maturing in 0.9 to 31.7 years) |
849,138 | 1,019,042 | ||||||
| Government of Saskatchewan (coupon interest range 2.2 to 6.4 per cent; maturing in 0.2 to 30.7 years) |
759,501 | 566,654 | ||||||
| Cash, cash equivalents and accrued interest |
88,930 | 87,630 | ||||||
|
|
|
|
|
|||||
| Total Sinking Fund Investments |
3,736,633 | 3,313,381 | ||||||
|
|
|
|
|
|||||
| a | The average yield to maturity on long-term investments at March 31, 2026 is 3.7 per cent (2025 - 3.5 per cent). |
| Government of Saskatchewan Public Accounts 2025-26 | 69 |
Summary Financial Statements
| Portfolio Investments | Schedule 5 | |
| As at March 31, 2026 | ||
| (thousands of dollars) |
| 2026 | 2025 | |||||||
| Bonds and debentures1 |
1,040,177 | 777,901 | ||||||
| Equities |
278,613 | 154,347 | ||||||
| Pooled investment funds |
248,669 | 232,490 | ||||||
| Other2 |
287,503 | 270,796 | ||||||
|
|
|
|
|
|||||
| Total Portfolio Investments |
1,854,962 | 1,435,534 | ||||||
| Government of Saskatchewan securities held as investments (schedule 9) |
(66,370 | ) | (74,860 | ) | ||||
|
|
|
|
|
|||||
| Portfolio Investments |
1,788,592 | 1,360,674 | ||||||
|
|
|
|
|
|||||
| 1 | Bonds and debentures held by the government have a market value of $1.04 billion (2025 - $779 million) and include securities of: |
| 2026 | 2025 | |||||||
| Government of Canada (coupon interest range 0.5 to 4.0 per cent; maturing in 0.0 to 29.9 years) |
481,273 | 341,127 | ||||||
| Governments of other provinces (coupon interest range 1.6 to 6.6 per cent; maturing in 0.1 to 30.9 years) |
368,631 | 257,780 | ||||||
| Corporations (coupon interest range 1.1 to 7.4 per cent; maturing in 0.1 to 59.4 years) |
86,412 | 64,750 | ||||||
| Government of Saskatchewan (coupon interest range 2.2 to 2.6 per cent; maturing 0.2 to 5.2 years) |
66,370 | 74,860 | ||||||
| Other (coupon interest range 2.2 to 4.6 per cent; maturing in 0.7 to 28.9 years) |
37,491 | 39,384 | ||||||
|
|
|
|
|
|||||
| Total Bonds and Debentures |
1,040,177 | 777,901 | ||||||
|
|
|
|
|
|||||
| 2 | Includes fixed-rate securities of $273 million (2025 - $259 million) with a market value of $274 million (2025 - $260 million). |
| 70 | Government of Saskatchewan Public Accounts 2025-26 |
Summary Financial Statements
| Accounts Payable and Accrued Liabilities | Schedule 6 | |
| As at March 31, 2026 | ||
| (thousands of dollars) |
| 2026 | 2025 | |||||||
| Salaries and benefits1 6a |
1,385,853 | 1,179,683 | ||||||
| Transfers2 6c |
1,019,422 | 948,164 | ||||||
| Supplier payments6b |
553,370 | 575,382 | ||||||
| Asset retirement obligations3 6c |
335,330 | 331,162 | ||||||
| Contaminated sites4 6c |
306,870 | 313,403 | ||||||
| Financing charges6b |
248,357 | 216,665 | ||||||
| Federal government repayments5 6c |
116,184 | 129,473 | ||||||
| Treaty land entitlement claims6c |
91,529 | 89,280 | ||||||
| Other6c |
726,974 | 625,813 | ||||||
|
|
|
|
|
|||||
| Total Accounts Payable and Accrued Liabilities |
4,783,889 | 4,409,025 | ||||||
|
|
|
|
|
|||||
| 1 | Includes accruals for other employee future benefits of $493 million (2025 - $465 million) mainly for accumulated sick leave, long-term disability and life insurance benefits. |
| 2 | Includes transfers to the federal government of $183 million (2025 - $165 million) and capital transfers of $56 million (2025 - $108 million). |
| 3 | The government has legal obligations for the removal of asbestos from certain buildings at an estimated cost of $319 million (2025 - $316 million), the disposal of certain equipment at an estimated cost of $9 million (2025 - $8 million) and the decommissioning of landfills at an estimated cost of $7 million (2025 - $7 million). |
| 4 | Includes remediation for: |
Abandoned mines
The government is responsible for remediation of certain abandoned uranium and precious and base metal mines on Crown land, where the companies that caused the contamination no longer exist. The contaminated sites liabilities include $84 million (2025 - $94 million) for the remediation of uranium mines. These sites have building debris, radioactive tailings, acidic water conditions and elevated radiation in exposed waste rock. The contaminated sites liabilities also include $63 million (2025 - $62 million) related to precious and base metal mines, which have several contaminants in soil, sediment and surface water from waste rock, tailings and concentrates.
Soil contamination
The government is responsible for remediation of soil contamination of $102 million (2025 - $102 million), primarily related to the storage of road salt, asphalt and fuel inventories.
Industrial operations
The government has provided a $58 million (2025 - $55 million) indemnity for environmental liabilities related to the industrial operations of a chemical plant and pulp mill site. These sites have excessive mercury levels in the soil and excessive contaminants in a landfill waste area, respectively.
| 5 | Includes amounts repayable for income taxes and Equalization transfers. |
| 6 | The government’s exposure to liquidity risk related to accounts payable and accrued liabilities is as follows: |
| a | Except for employee future benefit accruals, the liabilities for salaries and benefits are generally payable within one year. The liabilities for employee future benefits are generally long-term in nature and the associated repayment terms are uncertain. |
| b | The liabilities for supplier payments and financing charges are generally payable within one year. |
| c | Estimated payment terms for certain liabilities are as follows: |
| 2027 | 2028 | 2029 | 2030 | 2031 | Thereafteri | Total | ||||||||||||||||||||||
| Transfers |
851,516 | 59,778 | 879 | 13,815 | — | 93,434 | 1,019,422 | |||||||||||||||||||||
| Asset retirement obligations |
442 | 786 | 547 | 1,357 | 2,163 | 330,035 | 335,330 | |||||||||||||||||||||
| Contaminated sites |
66,291 | 14,307 | 9,858 | 6,375 | 2,098 | 207,941 | 306,870 | |||||||||||||||||||||
| Federal government repayments |
— | 116,184 | — | — | — | — | 116,184 | |||||||||||||||||||||
| Treaty land entitlement claims |
6,353 | — | — | — | — | 85,176 | 91,529 | |||||||||||||||||||||
| Other |
427,447 | 4,621 | 178 | 160 | 3,615 | 290,953 | 726,974 | |||||||||||||||||||||
| i | Amounts for which no specific repayment terms exist are classified as thereafter. |
| Government of Saskatchewan Public Accounts 2025-26 | 71 |
Summary Financial Statements
| Unearned Revenue | Schedule 7 | |
| As at March 31, 2026 | ||
| (thousands of dollars) |
| 2026 | 2025 | |||||||
| Own-source1 |
353,793 | 338,583 | ||||||
| Transfers from the federal government |
31,146 | 39,345 | ||||||
|
|
|
|
|
|||||
| Total Unearned Revenue |
384,939 | 377,928 | ||||||
|
|
|
|
|
|||||
| 1 | Includes $180 million (2025 - $160 million) for registry access fees. |
| 72 | Government of Saskatchewan Public Accounts 2025-26 |
Summary Financial Statements
| Pension Liabilities | Schedule 8 | |
| As at March 31, 2026 | ||
| (thousands of dollars) |
| 2026 | 2025 | |||||||||||||||||||
| TSP | PSSP | Others | Total | Total | ||||||||||||||||
| Accrued benefit obligation, beginning of year |
4,426,968 | 1,354,195 | 501,333 | 6,282,496 | 6,526,228 | |||||||||||||||
| Current period benefit cost |
111 | — | 22,951 | 23,062 | 19,478 | |||||||||||||||
| Interest cost |
140,678 | 41,663 | 22,286 | 204,627 | 203,065 | |||||||||||||||
| Actuarial gains |
(36,373 | ) | (25,545 | ) | (7,803 | ) | (69,721 | ) | (6,315 | ) | ||||||||||
| Benefit payments |
(328,085 | ) | (104,464 | ) | (25,772 | ) | (458,321 | ) | (459,960 | ) | ||||||||||
|
|
|
|
|
|
|
|
|
|
|
|||||||||||
| Accrued Benefit Obligation, End of Year |
4,203,299 | 1,265,849 | 512,995 | 5,982,143 | 6,282,496 | |||||||||||||||
|
|
|
|
|
|
|
|
|
|
|
|||||||||||
| Plan assets, beginning of year |
135,172 | — | 233,729 | 368,901 | 371,200 | |||||||||||||||
| Employer contributions |
302,437 | 104,444 | 19,192 | 426,073 | 429,808 | |||||||||||||||
| Employee contributions |
27 | — | 5,605 | 5,632 | 4,911 | |||||||||||||||
| Return on plan assets1 |
7,724 | 20 | 14,831 | 22,575 | 21,236 | |||||||||||||||
| Actuarial gains |
115 | — | 3,700 | 3,815 | 1,706 | |||||||||||||||
| Benefit payments |
(328,085 | ) | (104,464 | ) | (25,772 | ) | (458,321 | ) | (459,960 | ) | ||||||||||
|
|
|
|
|
|
|
|
|
|
|
|||||||||||
| Plan Assets, End of Year2 |
117,390 | — | 251,285 | 368,675 | 368,901 | |||||||||||||||
|
|
|
|
|
|
|
|
|
|
|
|||||||||||
| 4,085,909 | 1,265,849 | 261,710 | 5,613,468 | 5,913,595 | ||||||||||||||||
| Unamortized estimation adjustment gains3 |
36,488 | 25,545 | 9,541 | 71,574 | 19,903 | |||||||||||||||
| Joint defined benefit plan (SHEPP) net asset1 4 |
n/a | n/a | (2,062,864 | ) | (2,062,864 | ) | (2,145,920 | ) | ||||||||||||
| Valuation allowance5 |
— | — | 2,077,437 | 2,077,437 | 2,155,886 | |||||||||||||||
|
|
|
|
|
|
|
|
|
|
|
|||||||||||
| Total Pension Liabilities6 |
4,122,397 | 1,291,394 | 285,824 | 5,699,615 | 5,943,464 | |||||||||||||||
|
|
|
|
|
|
|
|
|
|
|
|||||||||||
| 1 | The actual rate of return on plan assets is 6.3 per cent (2025 - 5.6 per cent) for TSP and 9.8 per cent (2024 - 12.2 per cent) for SHEPP. |
| 2 | The market value of plan investments is $380 million at March 31, 2026 (2025 - $379 million) for the defined benefit plans. |
| 3 | Unamortized estimation adjustments are amortized to pension expense over the expected average remaining service life of the related employee group at the time the estimation adjustments arose and commence in the year following the adjustment as follows: in the year following for TSP and PSSP and up to 13.3 years for SHEPP and the other plans. |
| 4 | SHEPP reported the following, at December 31: |
| 2025 | 2024 | |||||||
| Accrued benefit obligation |
9,491,400 | 8,643,200 | ||||||
| Plan assets at market-related values |
11,554,264 | 10,870,221 | ||||||
| Unamortized estimation adjustment gains |
— | 81,101 | ||||||
| Government portion of employer contributions |
195,079 | 206,357 | ||||||
| Member contributions |
177,286 | 189,552 | ||||||
| Benefit payments |
524,000 | 482,800 | ||||||
| Market value of plan investments |
11,997,579 | 11,059,956 | ||||||
The market value of SHEPP’s investments is $12.21 billion at March 31, 2026.
| 5 | The valuation allowance includes $2.06 billion (2024 - $2.15 billion) for SHEPP which reduces the government portion of SHEPP pension asset to nil as plan assets and surpluses are restricted for member benefits. |
| 6 | The total pension liabilities are based on the latest actuarial valuations extrapolated to March 31, 2026 for the defined benefit plans and December 31, 2025 for the joint defined benefit plan. Changes in assumptions can result in significantly higher or lower estimates of pension liabilities. A decrease or increase in the discount rate would impact as follows: |
| (Decrease) Increase | ||||||||||
| Rate Change | in Pension Liability | |||||||||
| TSP |
Increase in discount rate | 0.1 per cent | (38,060 | ) | ||||||
| Decrease in discount rate | 0.1 per cent | 38,651 | ||||||||
| PSSP |
Increase in discount rate | 0.1 per cent | (11,393 | ) | ||||||
| Decrease in discount rate | 0.1 per cent | 11,393 | ||||||||
| Decrease (Increase) | ||||||||||
| Rate Change | in Pension Asset | |||||||||
| SHEPP |
Increase in discount rate | 1.0 per cent | (996,597 | ) | ||||||
| Decrease in discount rate | 1.0 per cent | 1,227,238 | ||||||||
| Government of Saskatchewan Public Accounts 2025-26 | 73 |
Summary Financial Statements
| Public Debt | Schedule 9 | |
| As at March 31, 2026 | ||
| (thousands of dollars) |
| 2026 | 2025 | |||||||||||||||||||||||
| Government | Government | |||||||||||||||||||||||
| Business | Business | |||||||||||||||||||||||
| Enterprise | Enterprise | |||||||||||||||||||||||
| General | Specific | General | Specific | |||||||||||||||||||||
| Debt1 2 | Debt | Total | Debt1 2 | Debt | Total | |||||||||||||||||||
| Government Service Organization Debt |
||||||||||||||||||||||||
| General Revenue Fund |
||||||||||||||||||||||||
| Operating |
8,922,416 | — | 8,922,416 | 7,463,811 | — | 7,463,811 | ||||||||||||||||||
| Saskatchewan Capital Plan3 |
15,926,275 | — | 15,926,275 | 14,021,817 | — | 14,021,817 | ||||||||||||||||||
| Boards of Education |
94,119 | — | 94,119 | 107,843 | — | 107,843 | ||||||||||||||||||
| Innovation Saskatchewan |
50,514 | — | 50,514 | 51,402 | — | 51,402 | ||||||||||||||||||
| Saskatchewan Health Authority |
36,293 | — | 36,293 | 41,513 | — | 41,513 | ||||||||||||||||||
| Global Transportation Hub Authority |
17,000 | — | 17,000 | 18,000 | — | 18,000 | ||||||||||||||||||
| Other |
3,102 | — | 3,102 | 7,193 | — | 7,193 | ||||||||||||||||||
|
|
|
|
|
|
|
|
|
|
|
|
|
|||||||||||||
| Government Service Organization Debt |
25,049,719 | — | 25,049,719 | 21,711,579 | — | 21,711,579 | ||||||||||||||||||
|
|
|
|
|
|
|
|
|
|
|
|
|
|||||||||||||
| Government Business Enterprise Debt4 |
||||||||||||||||||||||||
| Saskatchewan Power Corporation |
750,000 | 9,895,434 | 10,645,434 | 750,000 | 8,639,104 | 9,389,104 | ||||||||||||||||||
| SaskEnergy Incorporated |
75,000 | 2,156,409 | 2,231,409 | 75,000 | 1,967,855 | 2,042,855 | ||||||||||||||||||
| Saskatchewan Telecommunications Holding Corporation |
50,000 | 2,009,106 | 2,059,106 | 50,000 | 1,893,973 | 1,943,973 | ||||||||||||||||||
| Municipal Financing Corporation of Saskatchewan |
100,000 | 254,209 | 354,209 | 100,000 | 259,209 | 359,209 | ||||||||||||||||||
| Saskatchewan Water Corporation |
— | 112,095 | 112,095 | — | 111,414 | 111,414 | ||||||||||||||||||
| Lotteries and Gaming Saskatchewan Corporation |
— | 18,785 | 18,785 | — | 48,254 | 48,254 | ||||||||||||||||||
|
|
|
|
|
|
|
|
|
|
|
|
|
|||||||||||||
| Government Business Enterprise Debt |
975,000 | 14,446,038 | 15,421,038 | 975,000 | 12,919,809 | 13,894,809 | ||||||||||||||||||
|
|
|
|
|
|
|
|
|
|
|
|
|
|||||||||||||
| Gross debt5 6 |
26,024,719 | 14,446,038 | 40,470,757 | 22,686,579 | 12,919,809 | 35,606,388 | ||||||||||||||||||
| Government of Saskatchewan securities held as investments1 |
(794,072 | ) | (275,184 | ) | (1,069,256 | ) | (480,171 | ) | (222,734 | ) | (702,905 | ) | ||||||||||||
| Accumulated foreign exchange remeasurement7 |
343,957 | — | 343,957 | 318,441 | — | 318,441 | ||||||||||||||||||
|
|
|
|
|
|
|
|
|
|
|
|
|
|||||||||||||
| Public Debt |
25,574,604 | 14,170,854 | 39,745,458 | 22,524,849 | 12,697,075 | 35,221,924 | ||||||||||||||||||
|
|
|
|
|
|
|
|
|
|
|
|
|
|||||||||||||
| 1 | General debt, presented on the Statement of Financial Position, is net of Government of Saskatchewan securities held as investments, consisting of $484 million in sinking fund investments (2025 - $344 million), $66 million in portfolio investments (2025 - $75 million) and $243 million in cash and cash equivalents (2025 - $61 million). Government business enterprise (GBE) specific debt is presented on a gross basis in schedule 3. |
| 2 | General debt includes $5 million (2025 - $9 million) secured primarily by assets with a carrying value of $33 million (2025 - $36 million). |
| 3 | General Revenue Fund - Saskatchewan Capital Plan consists of amounts borrowed by the General Revenue Fund to finance investment in capital assets as presented in the Saskatchewan Provincial Budget. |
| 4 | GBE debt includes both general debt and GBE specific debt. General debt of GBEs represents amounts transferred from the General Revenue Fund and recorded as loans receivable (schedule 2). GBE specific debt represents debt issued by, or specifically on behalf of, GBEs. Schedule 3 provides information on GBEs as presented in their audited financial statements closest to March 31, 2026. The gross debt reported above is $136 million higher (2025 - $106 million higher) than the gross debt reported on schedule 3, mainly to conform to Canadian public sector accounting standards and for transactions occurring from the audited financial statements to March 31, 2026. |
| 5 | The average effective interest rate on gross debt is 3.5 per cent (2025 - 3.5 per cent) and includes the impact of foreign exchange and the amortization of any premiums or discounts associated with the debentures. The average term to maturity of gross debt is 13.5 years (2025 - 13.9 years). |
| 74 | Government of Saskatchewan Public Accounts 2025-26 |
Summary Financial Statements
| Public Debt (continued) | Schedule 9 |
| 6 | The payment schedule for gross debt is as follows: |
| 2026 | 2025 | |||||||
| Short-term promissory notes |
1,894,218 | 1,278,571 | ||||||
| 2025-26 |
— | 1,494,469 | ||||||
| 2026-27 |
1,655,153 | 1,617,249 | ||||||
| 2027-28 |
2,282,323 | 2,284,430 | ||||||
| 2028-29 |
1,723,087 | 1,725,253 | ||||||
| 2029-30 |
1,733,610 | 1,735,863 | ||||||
| 2030-31 |
1,428,982 | — | ||||||
| 6-10 years |
10,865,610 | 8,054,319 | ||||||
| Thereafter |
18,887,774 | 17,416,234 | ||||||
|
|
|
|
|
|||||
| Gross debt a |
40,470,757 | 35,606,388 | ||||||
|
|
|
|
|
|||||
| a | Gross debt includes Canada Pension Plan debentures of $553 million (2025 - $554 million). These debentures are callable in whole or in part before maturity, at the option of the Minister of Finance of Saskatchewan. |
| 7 | Debt denominated in foreign currencies has been remeasured by $344 million (2025 - $318 million) using the exchange rates in effect at March 31, 2026. The current year unrealized loss of $26 million (2025 - loss of $227 million) is presented on the Statement of Accumulated Remeasurement Gains and Losses. |
| Government of Saskatchewan Public Accounts 2025-26 | 75 |
Summary Financial Statements
| Obligations Under Long-Term Financing Arrangements | Schedule 10 | |
| As at March 31, 2026 | ||
| (thousands of dollars) |
| Contract End | Discount | |||||||||||||||
| Date | Rate | 2026 | 2025 | |||||||||||||
| Regina Bypass |
October 2049 | 5.30 | % | 592,843 | 605,187 | |||||||||||
| Elementary Schools |
June 2047 | 4.70 | % | 197,112 | 203,913 | |||||||||||
| Saskatchewan Hospital North Battleford |
May 2048 | 4.75 | % | 169,968 | 174,197 | |||||||||||
| Swift Current Long-Term Care Facility |
April 2046 | 5.44 | % | 80,729 | 82,889 | |||||||||||
| Regina General Hospital Parkade |
November 2054 | 5.65 | % | 12,693 | 12,865 | |||||||||||
|
|
|
|
|
|||||||||||||
| Total Obligations Under Long-Term Financing Arrangements |
1,053,345 | 1,079,051 | ||||||||||||||
|
|
|
|
|
|||||||||||||
The payment schedule for public private partnership (P3) financing is as follows:
| 2026 | 2025 | |||||||||||||||
| Obligation1 | Future Operation, Maintenance & Life Cycle Rehabilitation2 |
Total | Total | |||||||||||||
| 2025-26 |
— | — | — | 106,476 | ||||||||||||
| 2026-27 |
78,734 | 30,620 | 109,354 | 109,041 | ||||||||||||
| 2027-28 |
78,734 | 35,000 | 113,734 | 112,764 | ||||||||||||
| 2028-29 |
78,734 | 43,396 | 122,130 | 119,489 | ||||||||||||
| 2029-30 |
78,734 | 44,536 | 123,270 | 120,420 | ||||||||||||
| 2030-31 |
78,734 | 46,231 | 124,965 | — | ||||||||||||
| Thereafter |
1,403,182 | 872,112 | 2,275,294 | 2,405,088 | ||||||||||||
|
|
|
|
|
|
|
|
|
|||||||||
| 1,796,852 | 1,071,895 | 2,868,747 | 2,973,278 | |||||||||||||
| Less interest costs |
(743,507 | ) | — | (743,507 | ) | (798,025 | ) | |||||||||
|
|
|
|
|
|
|
|
|
|||||||||
| Total |
1,053,345 | 1,071,895 | 2,125,240 | 2,175,253 | ||||||||||||
|
|
|
|
|
|
|
|
|
|||||||||
| 1 | Represents the liability recorded for the capital portion of the project. |
| 2 | Represents the contractual obligation for operation, maintenance and life cycle rehabilitation payments for the duration of the contract (note 7). Total future payments for these contractual obligations, by project, are as follows: |
| 2026 | 2025 | |||||||
| Regina Bypass |
640,633 | 647,889 | ||||||
| Elementary Schools |
216,293 | 222,525 | ||||||
| Saskatchewan Hospital North Battleford |
124,419 | 133,072 | ||||||
| Swift Current Long-Term Care Facility |
63,521 | 65,593 | ||||||
| Regina General Hospital Parkade |
27,029 | 27,123 | ||||||
|
|
|
|
|
|||||
| Total |
1,071,895 | 1,096,202 | ||||||
|
|
|
|
|
|||||
| 76 | Government of Saskatchewan Public Accounts 2025-26 |
Summary Financial Statements
| Other Liabilities | Schedule 11 | |||
| As at March 31, 2026 | ||||
| (thousands of dollars) |
| 2026 | 2025 | |||||||
| Funds held on behalf of others1 |
129,411 | 113,878 | ||||||
| Unamortized debt-related costs2 |
86,841 | 112,379 | ||||||
| Capital leases3 |
38,294 | 31,947 | ||||||
| Other |
54,032 | 44,392 | ||||||
|
|
|
|
|
|||||
| Total Other Liabilities |
308,578 | 302,596 | ||||||
|
|
|
|
|
|||||
| 1 | Includes $24 million (2025 - $29 million) for government business enterprises. |
| 2 | Net change is reported in operating activities on the Statement of Cash Flow in net change in non-cash operating activities (schedule 18). |
| 3 | The payment schedule for capital leases is as follows: |
| 2026 | 2025 | |||||||
| 2025-26 |
— | 10,304 | ||||||
| 2026-27 |
12,531 | 9,087 | ||||||
| 2027-28 |
11,456 | 8,089 | ||||||
| 2028-29 |
10,413 | 7,453 | ||||||
| 2029-30 |
8,941 | 6,853 | ||||||
| 2030-31 |
7,920 | — | ||||||
| Thereafter |
7,799 | 12,993 | ||||||
|
|
|
|
|
|||||
| 59,060 | 54,779 | |||||||
| Less interest and executory costs |
(20,766 | ) | (22,832 | ) | ||||
|
|
|
|
|
|||||
| Capital Leasesa |
38,294 | 31,947 | ||||||
|
|
|
|
|
|||||
| a | Capital leases bear interest at rates up to 15.6 per cent (2025 - up to 12.4 per cent) and have expiry dates up to 6.6 years (2025 - up to 7.6 years). |
| Government of Saskatchewan Public Accounts 2025-26 | 77 |
Summary Financial Statements
| Tangible Capital Assets | Schedule 12 | |
| As at March 31, 2026 | ||
| (thousands of dollars) |
| 2026 | 2025 | |||||||||||||||||||||||
| Land, | Roads, | Office | ||||||||||||||||||||||
| Buildings & | Bridges & | Transportation | Equipment & | |||||||||||||||||||||
| Improve- | Water | & Operating | Information | |||||||||||||||||||||
| ments | Management | Equipment | Technology | Total | Total | |||||||||||||||||||
| Estimated useful life (in years) | 2 - indefinite | 5-100 | 2-40 | 2-25 | (Restated)1 | |||||||||||||||||||
| Opening Net Book Value of Tangible Capital Assets (restated)1 |
6,114,808 | 6,118,898 | 754,165 | 675,045 | 13,662,916 | 12,877,914 | ||||||||||||||||||
| Opening cost |
11,820,598 | 10,120,012 | 2,154,209 | 1,539,090 | 25,633,909 | 24,199,565 | ||||||||||||||||||
| Adjustments2 |
(1,454 | ) | 5 | (83,630 | ) | 85,079 | — | — | ||||||||||||||||
| Acquisitions |
790,776 | 478,092 | 129,129 | 164,729 | 1,562,726 | 1,630,824 | ||||||||||||||||||
| Write-downs |
(1,440 | ) | (94 | ) | (628 | ) | (47,337 | ) | (49,499 | ) | (14,010 | ) | ||||||||||||
| Disposals |
(20,605 | ) | (5,634 | ) | (28,232 | ) | (42,459 | ) | (96,930 | ) | (182,470 | ) | ||||||||||||
|
|
|
|
|
|
|
|
|
|
|
|
|
|||||||||||||
| Closing Cost 3 4 |
12,587,875 | 10,592,381 | 2,170,848 | 1,699,102 | 27,050,206 | 25,633,909 | ||||||||||||||||||
|
|
|
|
|
|
|
|
|
|
|
|
|
|||||||||||||
| Opening accumulated amortization (restated)1 |
5,705,790 | 4,001,114 | 1,400,044 | 864,045 | 11,970,993 | 11,413,229 | ||||||||||||||||||
| Adjustments2 |
— | — | (69,761 | ) | 69,761 | — | — | |||||||||||||||||
| Annual amortization |
264,731 | 310,027 | 97,386 | 94,631 | 766,775 | 729,070 | ||||||||||||||||||
| Write-downs |
(877 | ) | — | (373 | ) | (2,606 | ) | (3,856 | ) | (9,688 | ) | |||||||||||||
| Disposals |
(17,364 | ) | (2,394 | ) | (25,536 | ) | (42,341 | ) | (87,635 | ) | (161,618 | ) | ||||||||||||
|
|
|
|
|
|
|
|
|
|
|
|
|
|||||||||||||
| Closing Accumulated Amortization |
5,952,280 | 4,308,747 | 1,401,760 | 983,490 | 12,646,277 | 11,970,993 | ||||||||||||||||||
|
|
|
|
|
|
|
|
|
|
|
|
|
|||||||||||||
| Closing Net Book Value of Tangible Capital Assets5 |
6,635,595 | 6,283,634 | 769,088 | 715,612 | 14,403,929 | 13,662,916 | ||||||||||||||||||
|
|
|
|
|
|
|
|
|
|
|
|
|
|||||||||||||
Tangible capital assets (TCAs) exclude capital assets recognized by government business enterprises (schedule 3).
| 1 | Restatement relates to a change in amortization policy (note 9), the opening accumulated amortization was adjusted by the following amounts: Land, Buildings & Improvements ($11 million decrease), Roads, Bridges & Water Management ($102 million increase), Transportation and Operating Equipment ($8 million increase), and Office Equipment & Information Technology ($7 million decrease). |
| 2 | Adjustments relate to reclassifications between categories. |
| 3 | Includes work in progress of $2.06 billion (2025 - $1.70 billion). |
| 4 | Includes the government’s $30 million (2025 - $30 million) share in the North Central Shared Facility partnership. |
| 5 | Includes: TCAs acquired under public private partnerships (P3 TCAs); TCAs with asset retirement obligations (ARO TCAs); and leased TCAs. These are as follows: |
| 2026 | 2025 | |||||||||||||||||||||||
| Land, | Roads, | Office | ||||||||||||||||||||||
| Buildings & | Bridges & | Transportation | Equipment & | |||||||||||||||||||||
| Improve- | Water | & Operating | Information | |||||||||||||||||||||
| ments | Management | Equipment | Technology | Total | Total | |||||||||||||||||||
| (Restated) | ||||||||||||||||||||||||
| P3 TCAs |
||||||||||||||||||||||||
| Closing cost |
918,777 | 1,371,509 | — | — | 2,290,286 | 2,281,016 | ||||||||||||||||||
| Closing accumulated amortization |
153,285 | 133,650 | — | — | 286,935 | 249,913 | ||||||||||||||||||
|
|
|
|
|
|
|
|
|
|
|
|
|
|||||||||||||
| Closing Net Book Value (see footnote 1) |
765,492 | 1,237,859 | — | — | 2,003,351 | 2,031,103 | ||||||||||||||||||
|
|
|
|
|
|
|
|
|
|
|
|
|
|||||||||||||
| ARO TCAs |
||||||||||||||||||||||||
| Closing cost |
2,427,083 | 1,216 | 1,636 | — | 2,429,935 | 2,403,590 | ||||||||||||||||||
| Closing accumulated amortization |
2,051,207 | 1,208 | 1,346 | — | 2,053,761 | 2,008,927 | ||||||||||||||||||
|
|
|
|
|
|
|
|
|
|
|
|
|
|||||||||||||
| Closing Net Book Value |
375,876 | 8 | 290 | — | 376,174 | 394,663 | ||||||||||||||||||
|
|
|
|
|
|
|
|
|
|
|
|
|
|||||||||||||
| Leased TCAs |
||||||||||||||||||||||||
| Closing cost |
40,859 | — | 24,171 | 9,263 | 74,293 | 70,657 | ||||||||||||||||||
| Closing accumulated amortization |
28,115 | — | 10,305 | 5,477 | 43,897 | 46,513 | ||||||||||||||||||
|
|
|
|
|
|
|
|
|
|
|
|
|
|||||||||||||
| Closing Net Book Value |
12,744 | — | 13,866 | 3,786 | 30,396 | 24,144 | ||||||||||||||||||
|
|
|
|
|
|
|
|
|
|
|
|
|
|||||||||||||
| 78 | Government of Saskatchewan Public Accounts 2025-26 |
Summary Financial Statements
| Inventories Held for Consumption | Schedule 13 | |
| As at March 31, 2026 | ||
| (thousands of dollars) |
| 2026 | 2025 | |||||||
| Highway and road maintenance |
136,966 | 128,428 | ||||||
| Health supplies and vaccines |
67,364 | 69,790 | ||||||
| Other1 |
66,777 | 63,287 | ||||||
|
|
|
|
|
|||||
| Total Inventories Held for Consumption |
271,107 | 261,505 | ||||||
|
|
|
|
|
|||||
| 1 | Mainly includes parts and supplies related to the maintenance of buildings and equipment. |
| Government of Saskatchewan Public Accounts 2025-26 | 79 |
Summary Financial Statements
| Revenue | Schedule 14 | |
| For the Year Ended March 31, 2026 | ||
| (thousands of dollars) |
| 2026 | 2025 | |||||||||||
| Budget | Actual | Actual | ||||||||||
| Own-Source |
||||||||||||
| Taxation |
||||||||||||
| Personal income |
3,382,100 | 3,351,123 | 3,349,463 | |||||||||
| Provincial sales |
3,331,300 | 3,295,158 | 3,139,561 | |||||||||
| Corporation income |
1,658,500 | 1,680,705 | 1,439,549 | |||||||||
| Property |
816,100 | 808,716 | 807,772 | |||||||||
| Fuel |
519,700 | 497,558 | 497,029 | |||||||||
| Other1 |
741,800 | 702,540 | 689,583 | |||||||||
|
|
|
|
|
|
|
|||||||
| Total Taxation |
10,449,500 | 10,335,800 | 9,922,957 | |||||||||
|
|
|
|
|
|
|
|||||||
| Non-Renewable Resources |
||||||||||||
| Potash |
720,000 | 914,523 | 604,095 | |||||||||
| Oil and natural gas |
1,067,700 | 869,043 | 1,151,637 | |||||||||
| Resource surcharge |
526,900 | 586,181 | 529,503 | |||||||||
| Uranium |
290,200 | 255,550 | 191,531 | |||||||||
| Other2 |
94,600 | 107,099 | 96,891 | |||||||||
|
|
|
|
|
|
|
|||||||
| Total Non-Renewable Resources3 |
2,699,400 | 2,732,396 | 2,573,657 | |||||||||
|
|
|
|
|
|
|
|||||||
| Net Income from Government Business Enterprises |
||||||||||||
| (schedule 3) |
705,200 | 537,485 | 784,591 | |||||||||
|
|
|
|
|
|
|
|||||||
| Other Own-Source |
||||||||||||
| Fees4 |
1,321,700 | 1,498,659 | 1,435,895 | |||||||||
| Insurance |
553,600 | 545,456 | 555,572 | |||||||||
| Output-Based Performance Standards |
431,500 | 489,163 | 362,817 | |||||||||
| Investment |
284,900 | 324,955 | 370,502 | |||||||||
| Transfers from other governments |
69,200 | 83,341 | 81,651 | |||||||||
| Miscellaneous5 |
604,100 | 590,944 | 976,050 | |||||||||
|
|
|
|
|
|
|
|||||||
| Total Other Own-Source |
3,265,000 | 3,532,518 | 3,782,487 | |||||||||
|
|
|
|
|
|
|
|||||||
| Total Own-Source |
17,119,100 | 17,138,199 | 17,063,692 | |||||||||
|
|
|
|
|
|
|
|||||||
| Transfers from the Federal Government |
||||||||||||
| Canada Health Transfer |
1,634,400 | 1,673,722 | 1,563,639 | |||||||||
| Canada Social Transfer |
520,500 | 533,364 | 508,014 | |||||||||
| Other6 |
1,782,100 | 1,788,263 | 1,720,640 | |||||||||
|
|
|
|
|
|
|
|||||||
| Total Transfers from the Federal Government |
3,937,000 | 3,995,349 | 3,792,293 | |||||||||
|
|
|
|
|
|
|
|||||||
| Total Revenue |
21,056,100 | 21,133,548 | 20,855,985 | |||||||||
|
|
|
|
|
|
|
|||||||
| 1 | Includes $235 million (2025 - $231 million) for insurance premiums taxation; $188 million (2025 - $177 million) for corporation capital taxation; $113 million (2025 - $122 million) for tobacco taxation; and $102 million (2025 - $103 million) for liquor consumption taxation. |
| 2 | Includes $68 million (2025 - $60 million) for mineral disposition public offerings. |
| 3 | Includes taxes of $858 million (2025 - $638 million). |
| 4 | Includes $386 million (2025 - $345 million) for health care; $248 million (2025 - $241 million) for education; $223 million (2025 - $218 million) for motor vehicle licensing; $129 million (2025 - $126 million) for subsidized housing rental; and $91 million (2025 - $89 million) for real property sales and leases. |
| 5 | Includes $71 million (2025 - $54 million) for donations; $65 million (2025 - $70 million) for lottery profits; $25 million (2025 - $15 million) for reversals of prior year expenses; and nil (2025 - $400 million) for tobacco litigation proceeds. |
| 6 | Includes $464 million (2025 - $476 million) for crop insurance; $319 million (2025 - $316 million) for early learning and child care; $264 million (2025 - $163 million) for agricultural income stability; $130 million (2025 - $129 million - restated) for improving health care; $126 million (2025 - $196 million) for infrastructure; $68 million (2025 - $66 million) for labour market initiatives; $63 million (2025 - $29 million) for provincial disaster assistance; and $53 million (2025 - $83 million) for housing. |
| 80 | Government of Saskatchewan Public Accounts 2025-26 |
Summary Financial Statements
| Expense by Object | Schedule 15 | |
| For the Year Ended March 31, 2026 | ||
| (thousands of dollars) |
| 2026 | 2025 | |||||||
| Salaries and benefits |
9,161,018 | 8,460,246 | ||||||
| Transfers1 |
6,780,322 | 6,194,889 | ||||||
| Operating costs |
4,109,167 | 4,538,470 | ||||||
| Financing charges (schedule 16) |
1,073,298 | 950,540 | ||||||
| Amortization of tangible capital assets (schedule 12) |
766,775 | 729,070 | ||||||
| Other |
190,430 | 231,634 | ||||||
|
|
|
|
|
|||||
| Total Expense |
22,081,010 | 21,104,849 | ||||||
|
|
|
|
|
|||||
| 1 | Includes capital transfers of $299 million (2025 - $429 million). |
| Financing Charges | Schedule 16 | |
| For the Year Ended March 31, 2026 | ||
| (thousands of dollars) |
| 2026 | 2025 | |||||||
| Interest costs |
||||||||
| General debt1 2 |
817,443 | 699,053 | ||||||
| Pension liabilities (note 5) |
182,052 | 181,829 | ||||||
| Obligations under long-term financing arrangements |
54,517 | 54,971 | ||||||
| Other costs |
19,286 | 14,687 | ||||||
|
|
|
|
|
|||||
| Total Financing Charges |
1,073,298 | 950,540 | ||||||
|
|
|
|
|
|||||
| 1 | Interest on general debt is presented net of $491 million (2025 - $472 million) in interest reimbursed by government business enterprises for debt borrowed by the General Revenue Fund specifically on their behalf. |
| 2 | Interest on general debt includes $18 million (2025 - $15 million) in costs associated with Government of Saskatchewan securities held as investments. |
| Government of Saskatchewan Public Accounts 2025-26 | 81 |
Summary Financial Statements
Segmented Reporting
For the Year Ended March 31, 2026
(thousands of dollars)
| Health | Education | Social Services and Assistance |
Protection of Persons and Property |
|||||||||||||||||||||||||||||
| 2026 | 2025 | 2026 | 2025 | 2026 | 2025 | 2026 | 2025 | |||||||||||||||||||||||||
| Revenue |
||||||||||||||||||||||||||||||||
| Taxation |
— | — | 123,447 | 123,194 | — | — | — | — | ||||||||||||||||||||||||
| Non-renewable resources |
— | — | — | — | — | — | — | — | ||||||||||||||||||||||||
| Net income from government business enterprises (schedule 3) |
— | — | — | — | — | — | — | — | ||||||||||||||||||||||||
| Revenue from government entities |
15,950 | 24,350 | — | — | — | — | 1,365 | 2,249 | ||||||||||||||||||||||||
| Other own-source |
519,948 | 452,463 | 417,637 | 417,684 | 134,681 | 138,798 | 106,743 | 99,520 | ||||||||||||||||||||||||
| Transfers from the federal government |
967 | 1,707 | 40,222 | 37,792 | 52,657 | 83,112 | 5,703 | 5,351 | ||||||||||||||||||||||||
|
|
|
|
|
|
|
|
|
|
|
|
|
|
|
|
|
|||||||||||||||||
| Total Revenue (schedule 14) |
536,865 | 478,520 | 581,306 | 578,670 | 187,338 | 221,910 | 113,811 | 107,120 | ||||||||||||||||||||||||
|
|
|
|
|
|
|
|
|
|
|
|
|
|
|
|
|
|||||||||||||||||
| Expense |
||||||||||||||||||||||||||||||||
| Salaries and benefits3 |
4,822,458 | 4,354,724 | 2,579,157 | 2,528,835 | 223,313 | 207,914 | 525,988 | 481,377 | ||||||||||||||||||||||||
| Transfers |
1,956,955 | 1,890,397 | 1,019,761 | 1,038,966 | 1,445,458 | 1,362,209 | 423,934 | 342,007 | ||||||||||||||||||||||||
| Operating costs |
1,635,352 | 1,576,885 | 727,767 | 676,500 | 211,465 | 215,041 | 509,456 | 305,720 | ||||||||||||||||||||||||
| Financing charges3 (schedule 16) |
— | — | — | — | — | — | — | — | ||||||||||||||||||||||||
| Amortization of tangible capital assets (schedule 12) |
199,944 | 179,740 | 141,028 | 135,492 | 9,775 | 13,181 | 35,288 | 33,872 | ||||||||||||||||||||||||
| Other |
56,848 | 7,800 | 75,856 | 11,523 | 10,406 | 13,165 | 4,686 | 3,739 | ||||||||||||||||||||||||
|
|
|
|
|
|
|
|
|
|
|
|
|
|
|
|
|
|||||||||||||||||
| Total expense by segment |
8,671,557 | 8,009,546 | 4,543,569 | 4,391,316 | 1,900,417 | 1,811,510 | 1,499,352 | 1,166,715 | ||||||||||||||||||||||||
| Eliminations2 |
— | — | (15,950 | ) | (16,563 | ) | (4,204 | ) | (4,422 | ) | — | — | ||||||||||||||||||||
|
|
|
|
|
|
|
|
|
|
|
|
|
|
|
|
|
|||||||||||||||||
| Total Expense3 (schedule 15) |
8,671,557 | 8,009,546 | 4,527,619 | 4,374,753 | 1,896,213 | 1,807,088 | 1,499,352 | 1,166,715 | ||||||||||||||||||||||||
|
|
|
|
|
|
|
|
|
|
|
|
|
|
|
|
|
|||||||||||||||||
The segments are based on the major functional groupings of activities, or themes, used in the Statement of Operations, which reflects the accountability and reporting framework set out by the government in the Saskatchewan Provincial Budget. Schedule 19 identifies the entities included in each theme.
| 1 | Other includes the general government, economic development and environment and natural resources segments. Revenue of the general government segment includes all public monies paid into the General Revenue Fund as well as net income from government business enterprises, which are used to support activities across all segments. |
| 2 | Represents eliminations for inter-entity transactions that occur across segments. |
| 3 | Includes a total of $686 million (2025 - $745 million) for pension expense as follows: |
| Health | Education | Other | Total | |||||||||||||||||||||||||||||
| 2026 | 2025 | 2026 | 2025 | 2026 | 2025 | 2026 | 2025 | |||||||||||||||||||||||||
| Salaries and benefits |
215,393 | 226,476 | 91,765 | 219,982 | 196,354 | 116,246 | 503,512 | 562,704 | ||||||||||||||||||||||||
| Financing charges (schedule 16) |
— | — | — | — | 182,052 | 181,829 | 182,052 | 181,829 | ||||||||||||||||||||||||
|
|
|
|
|
|
|
|
|
|
|
|
|
|
|
|
|
|||||||||||||||||
| Total pension expense (note 5) |
215,393 | 226,476 | 91,765 | 219,982 | 378,406 | 298,075 | 685,564 | 744,533 | ||||||||||||||||||||||||
|
|
|
|
|
|
|
|
|
|
|
|
|
|
|
|
|
|||||||||||||||||
| 82 | Government of Saskatchewan Public Accounts 2025-26 |
Summary Financial Statements
Schedule 17
| Agriculture |
Community Development |
Transportation | Other1 | Eliminations2 | Total | |||||||||||||||||||||||||||||||||||||||
| 2026 | 2025 | 2026 | 2025 | 2026 | 2025 | 2026 | 2025 | 2026 | 2025 | 2026 | 2025 | |||||||||||||||||||||||||||||||||
|
|
||||||||||||||||||||||||||||||||||||||||||||
| — |
— | 5,764 | 5,753 | — | — | 10,206,589 | 9,794,010 | — | — | 10,335,800 | 9,922,957 | |||||||||||||||||||||||||||||||||
| — |
— | — | — | — | — | 2,732,396 | 2,573,657 | — | — | 2,732,396 | 2,573,657 | |||||||||||||||||||||||||||||||||
| — |
— | — | — | — | — | 537,485 | 784,591 | — | — | 537,485 | 784,591 | |||||||||||||||||||||||||||||||||
| 9,495 |
9,746 | — | — | — | — | — | 21,488 | (26,810 | ) | (57,833 | ) | — | — | |||||||||||||||||||||||||||||||
| 523,487 |
517,051 | 104,221 | 109,142 | 4,791 | 4,124 | 1,726,833 | 2,028,373 | (5,823 | ) | 15,332 | 3,532,518 | 3,782,487 | ||||||||||||||||||||||||||||||||
| 679,759 |
600,879 | 899 | 1,289 | — | — | 3,215,142 | 3,062,163 | — | — | 3,995,349 | 3,792,293 | |||||||||||||||||||||||||||||||||
|
|
|
|
|
|
|
|
|
|
|
|
|
|
|
|
|
|
|
|
|
|
|
|
||||||||||||||||||||||
| 1,212,741 | 1,127,676 | 110,884 | 116,184 | 4,791 | 4,124 | 18,418,445 | 18,264,282 | (32,633 | ) | (42,501 | ) | 21,133,548 | 20,855,985 | |||||||||||||||||||||||||||||||
|
|
|
|
|
|
|
|
|
|
|
|
|
|
|
|
|
|
|
|
|
|
|
|
||||||||||||||||||||||
|
|
||||||||||||||||||||||||||||||||||||||||||||
| 78,607 | 77,655 | 40,516 | 38,186 | 93,713 | 88,612 | 797,266 | 682,943 | — | — | 9,161,018 | 8,460,246 | |||||||||||||||||||||||||||||||||
| 570,196 | 402,017 | 721,986 | 740,713 | 133,923 | 130,433 | 526,564 | 315,234 | (18,455 | ) | (27,087 | ) | 6,780,322 | 6,194,889 | |||||||||||||||||||||||||||||||
| 580,123 | 1,277,178 | 39,624 | 39,544 | 207,976 | 201,158 | 200,722 | 249,863 | (3,318 | ) | (3,419 | ) | 4,109,167 | 4,538,470 | |||||||||||||||||||||||||||||||
| — | — | — | — | — | — | 1,084,158 | 962,535 | (10,860 | ) | (11,995 | ) | 1,073,298 | 950,540 | |||||||||||||||||||||||||||||||
| 4,096 | 4,079 | 11,909 | 9,380 | 287,815 | 280,774 | 76,920 | 72,552 | — | — | 766,775 | 729,070 | |||||||||||||||||||||||||||||||||
| 8,300 | 1,643 | 733 | 616 | 983 | 936 | 32,618 | 192,212 | — | — | 190,430 | 231,634 | |||||||||||||||||||||||||||||||||
|
|
|
|
|
|
|
|
|
|
|
|
|
|
|
|
|
|
|
|
|
|
|
|
||||||||||||||||||||||
| 1,241,322 | 1,762,572 | 814,768 | 828,439 | 724,410 | 701,913 | 2,718,248 | 2,475,339 | (32,633 | ) | (42,501 | ) | 22,081,010 | 21,104,849 | |||||||||||||||||||||||||||||||
| — | — | — | — | (1,619 | ) | (1,734 | ) | (10,860 | ) | (19,782 | ) | 32,633 | 42,501 | — | — | |||||||||||||||||||||||||||||
|
|
|
|
|
|
|
|
|
|
|
|
|
|
|
|
|
|
|
|
|
|
|
|
||||||||||||||||||||||
| 1,241,322 | 1,762,572 | 814,768 | 828,439 | 722,791 | 700,179 | 2,707,388 | 2,455,557 | — | — | 22,081,010 | 21,104,849 | |||||||||||||||||||||||||||||||||
|
|
|
|
|
|
|
|
|
|
|
|
|
|
|
|
|
|
|
|
|
|
|
|
||||||||||||||||||||||
| Government of Saskatchewan Public Accounts 2025-26 | 83 |
Summary Financial Statements
| Supplemental Cash Flow Information | Schedule 18 | |||
| For the Year Ended March 31, 2026 | ||||
| (thousands of dollars) |
| 2026 | 2025 | |||||||
| Other Non-Cash Items Included in the Operating (Deficit) Surplus |
||||||||
| Amortization of tangible capital assets (schedule 12) |
766,775 | 729,070 | ||||||
| Write-downs of tangible capital assets (schedule 12) |
45,643 | 4,322 | ||||||
| Net loss (gain) on disposal of tangible capital assets |
885 | (3,343 | ) | |||||
| Net increase to provision for loss on accounts receivable and loans receivable |
48,406 | 18,663 | ||||||
| Net gain on portfolio investments1 |
(21,285 | ) | (17,079 | ) | ||||
| Earnings retained in sinking funds (schedule 4) |
(74,395 | ) | (64,096 | ) | ||||
|
|
|
|
|
|||||
| Total Other Non-Cash Items Included in the Operating (Deficit) Surplus |
766,029 | 667,537 | ||||||
|
|
|
|
|
|||||
| Net Change in Non-Cash Operating Activities |
||||||||
| (Increase) decrease in accounts receivable |
(312,390 | ) | 141,639 | |||||
| (Increase) decrease in other financial assets |
(470 | ) | 941 | |||||
| Increase in accounts payable and accrued liabilities |
374,864 | 212,486 | ||||||
| Increase (decrease) in unearned revenue |
7,011 | (4,898 | ) | |||||
| Decrease in pension liabilities |
(243,849 | ) | (165,576 | ) | ||||
| Decrease in unamortized debt-related costs |
(25,538 | ) | (9,364 | ) | ||||
| Increase in inventories held for consumption |
(9,602 | ) | (1,707 | ) | ||||
| (Increase) decrease in prepaid expenses |
(27,309 | ) | 10,782 | |||||
|
|
|
|
|
|||||
| Net Change in Non-Cash Operating Activities |
(237,283 | ) | 184,303 | |||||
|
|
|
|
|
|||||
| 1 | Includes $18 million (2025 - $15 million) net gain on sale of investments that have been reclassified from accumulated remeasurement gains. |
Other Supplemental Information
| 2026 | 2025 | |||||||
| Cash interest paid during the year |
856,430 | 711,117 | ||||||
| Cash interest received during the year |
165,615 | 229,964 | ||||||
| 84 | Government of Saskatchewan Public Accounts 2025-26 |
Summary Financial Statements
| Government Reporting Entity | Schedule 19 | |
| For the Year Ended March 31, 2026 |
The government reporting entity consists of public sector entities (entities) classified as government service organizations, government business enterprises and partnerships. The listing below reports the entities under these classifications segregated by segments which are based on functional groupings of activities, or themes.
Government Service Organizations (Consolidated) and Partnerships (Proportionately Consolidated)
Agriculture
Agricultural Credit Corporation of Saskatchewan
Crop Reinsurance Fund of Saskatchewan
Ministry of Agriculture
Prairie Agricultural Machinery Institute
Prairie Diagnostic Services Inc. (partnership - organization under shared control) 1a
Saskatchewan Agricultural Stabilization Fund
Saskatchewan Crop Insurance Corporation
Community Development
Community Initiatives Fund
Ministry of Education 2b
Ministry of Government Relations 2a
Ministry of Parks, Culture and Sport 2a
Northern Municipal Trust Account 1d
Provincial Archives of Saskatchewan
Provincial Capital Commission
Saskatchewan Arts Board
Saskatchewan Centre of the Arts Fund
Saskatchewan Heritage Foundation
Saskatchewan Lotteries Trust Fund for Sport, Culture and Recreation
Saskatchewan Snowmobile Fund
Western Development Museum Fund
Economic Development 3
Creative Saskatchewan
CIC Asset Management Inc. 2a
Crown Investments Corporation of Saskatchewan (separate) 2b
Global Transportation Hub Authority
Innovation Saskatchewan
Ministry of Energy and Resources
Ministry of Environment 2b
Ministry of Finance 2b
Ministry of Immigration and Career Training 2b
Ministry of SaskBuilds and Procurement 2b
Ministry of Trade and Export Development
Saskatchewan Health Research Foundation Saskatchewan Indigenous Investment Finance Corporation
Saskatchewan Research Council
SaskBuilds Corporation
Tourism Saskatchewan
Education
Battlefords First Nations Joint Board of Education (partnership - organization under shared control) 1c
Boards of Education 1c
Chinook School Division No. 211
Christ the Teacher Roman Catholic Separate School Division No. 212
Conseil des écoles fransaskoises no. 310
Creighton School Division No. 111
Good Spirit School Division No. 204
Holy Family Roman Catholic Separate School Division No. 140
Holy Trinity Roman Catholic Separate School Division No. 22
Horizon School Division No. 205
Ile-a-la Crosse School Division No. 112
Light of Christ Roman Catholic Separate School Division No. 16
Living Sky School Division No. 202
Lloydminster Roman Catholic Separate School Division No. 89
Lloydminster School Division No. 99
North East School Division No. 200
Northern Lights School Division No. 113
Northwest School Division No. 203
Prairie South School Division No. 210
Prairie Spirit School Division No. 206
Prairie Valley School Division No. 208
Prince Albert Roman Catholic Separate School Division No. 6
Regina Roman Catholic Separate School Division No. 81
Regina School Division No. 4
Saskatchewan Rivers School Division No. 119
Saskatoon School Division No. 13
South East Cornerstone School Division No. 209
St. Paul’s Roman Catholic Separate School Division No. 20
Sun West School Division No. 207
Ministry of Advanced Education
Ministry of Education 2a
Ministry of Immigration and Career Training 2a
North Central Shared Facility (partnership - 72.9 per cent interest in assets and 69.7 per cent interest in operations under shared control)1c
Regional Colleges 1b
Carlton Trail College
Great Plains College
North West College
Northlands College
Southeast College
Suncrest College
Saskatchewan Apprenticeship and Trade Certification
Commission 1b
Saskatchewan Distance Learning Corporation 1c
Saskatchewan Polytechnic 1b
| Government of Saskatchewan Public Accounts 2025-26 | 85 |
Summary Financial Statements
| Government Reporting Entity (continued) | Schedule 19 |
Education (continued)
Saskatchewan Professional Teachers Regulatory Board 1c
Saskatchewan Student Aid Fund
Training Completions Fund
Environment and Natural Resources 3
Commercial Revolving Fund
CIC Asset Management Inc. 2b
Fish and Wildlife Development Fund
Forest Management Funds
Carrier Forest Management Trust Fund
Crown Agricultural Land Forest Fund
Dunkley Forest Renewal Trust
Island Forests Management Fund
L&M Forest Management Trust Fund
Meadow Lake OSB Forest Management Trust Fund
Mee-Toos Forest Management Fund Trust
Mistik Forest Management Trust
North Central Trust Fund
Park Land Forests Management Fund
Sakaw Forest Renewal Trust Fund
Weyerhaeuser Forest Renewal Trust Fund
Impacted Sites Fund
Institutional Control Monitoring and Maintenance Fund
Institutional Control Unforeseen Events Fund
Ministry of Environment 2a
Ministry of Parks, Culture and Sport 2b
Oil and Gas Orphan Fund
Operator Certification Board
Saskatchewan Technology Fund
Water Security Agency
General Government 3
Century Plaza Condominium Corporation
Crown Investments Corporation of Saskatchewan (separate) 2a
Extended Health Care Plan for Certain Other Employees 1d
Extended Health Care Plan for Certain Other Retired Employees 1d
King’s Printer Revolving Fund
Legislative Assembly and its Officers 2a
Ministry of Finance 2a
Ministry of Government Relations 2b
Ministry of Highways 2b
Ministry of Justice and Attorney General 2b
Ministry of Parks, Culture and Sport 2b
Ministry of SaskBuilds and Procurement 2a
Office of Executive Council
Public Employees Benefits Agency Revolving Fund
Public Employees Dental Fund 1d
Public Employees Disability Income Fund 1d
Public Employees Group Life Insurance Fund 1d
Public Service Commission
School Division Tax Loss Compensation Fund
Health
eHealth Saskatchewan
Health Quality Council
Health Sector Affiliates
All Nations’ Healing Hospital Inc.
Bethany Pioneer Village Inc.
Circle Drive Special Care Home Inc.
Cupar and District Nursing Home Inc.
Duck Lake and District Nursing Home Inc.
Foyer St. Joseph Nursing Home Inc.
Jubilee Residences Inc.
Lakeview Pioneer Lodge Inc.
Lumsden & District Heritage Home Inc.
Lutheran Sunset Home of Saskatoon
Mennonite Nursing Homes Incorporated
Mont St. Joseph Home Inc.
Oliver Lodge
Providence Place for Holistic Health Inc.
Radville Marian Health Centre Inc.
Raymore Community Health and Social Centre
Salvation Army - William Booth Special Care Home
Santa Maria Senior Citizens Home Inc.
Saskatoon Convalescent Home
Sherbrooke Community Society Inc.
Société Joseph Breton Inc.
Spruce Manor Special Care Home Incorporated
St. Ann’s Senior Citizens Village Corporation
St. Anthony’s Hospital
St. Joseph’s Hospital (Grey Nuns) of Gravelbourg
St. Joseph’s Hospital of Estevan
St. Joseph’s Integrated Health Centre of Macklin Inc.
St. Paul Lutheran Home of Melville
St. Peter’s Hospital, Melville
Strasbourg and District Health Centre Corp.
Sunnyside Adventist Care Centre
The Border-Line Housing Company (1975) Inc.
The Qu’Appelle Diocesan Housing Company
Ukrainian Sisters of St. Joseph of Saskatoon
Warman Mennonite Special Care Home Inc.
Health Shared Services Saskatchewan
Ministry of Health
Saskatchewan Association of Health Organizations Inc.
Saskatchewan Cancer Agency
Saskatchewan Health Authority
Saskatchewan Healthcare Recruitment Agency
Saskatchewan Impaired Driver Treatment Centre Board of Governors
| 86 | Government of Saskatchewan Public Accounts 2025-26 |
Summary Financial Statements
| Government Reporting Entity (continued) | Schedule 19 |
Protection of Persons and Property
Correctional Facilities Industries Revolving Fund
Criminal Property Forfeiture Fund
Financial and Consumer Affairs Authority of Saskatchewan
Firearms Secretariat
Law Reform Commission of Saskatchewan
Legislative Assembly and its Officers 2b
Ministry of Community Safety 4
Ministry of Government Relations 2b
Ministry of Justice and Attorney General 2a
Ministry of Labour Relations and Workplace Safety
Saskatchewan Public Safety Agency
Victims’ Fund
Social Services and Assistance
Ministry of Government Relations 2b
Ministry of Parks, Culture and Sport 2b
Ministry of Social Services
Saskatchewan Housing Corporation 1d
Saskatchewan Legal Aid Commission
Transportation
Ministry of Government Relations 2b
Ministry of Highways 2a
Transportation Partnerships Fund
Government Business Enterprises (Modified Equity)
Utility 3
Saskatchewan Power Corporation
Saskatchewan Telecommunications Holding Corporation
Saskatchewan Water Corporation
SaskEnergy Incorporated
Insurance & Financing 3
Municipal Financing Corporation of Saskatchewan 1d
Saskatchewan Auto Fund
Saskatchewan Government Insurance
Workers’ Compensation Board 1d
Liquor & Gaming 3
Liquor and Gaming Authority
Lotteries and Gaming Saskatchewan Corporation
| 1 | The year-ends of certain entities differ from March 31, 2026: a April 30, 2025; b June 30, 2025; c August 31, 2025; d December 31, 2025. |
| 2 | Activities are allocated across more than one theme: a primary activity; b secondary activity. |
| 3 | Included in Other for segment disclosure (schedule 17). |
| 4 | During 2025-26, the Ministry of Corrections, Policing and Public Safety was renamed to the Ministry of Community Safety. |
| Government of Saskatchewan Public Accounts 2025-26 | 87 |
Glossary of Terms
Glossary of Terms
Accumulated (Deficit) Surplus: A measure that represents a government’s net economic resources. It is the difference between total assets and liabilities and is comprised of all the past operating surpluses (deficits) and remeasurement gains (losses).
Accumulated Operating (Deficit) Surplus: The accumulation of all past operating surpluses or deficits plus any adjustments that were charged directly to the accumulated deficit.
Accumulated Remeasurement Gains and Losses: The unrealized gains and losses related to fair value measurement and foreign exchange that have accumulated prior to the settlement of financial instruments.
Amortization: A systematic process of allocating an amount to revenue or expense over a period of time. Capital assets are amortized to expense over their expected remaining economic life. Actuarial gains and losses, such as those experienced by pension plans, are also amortized.
Amortized Cost: The initial cost of a security adjusted for the cumulative amortization of any purchase premium or discount, less any principal repayments.
Asset Retirement Obligation: A legal obligation associated with the retirement of a tangible capital asset.
Canada Health Transfer: A federal transfer provided, on an equal per capita cash basis, to jurisdictions in support of health care.
Canada Social Transfer: A federal transfer provided, on an equal per capita cash basis, to jurisdictions in support of post-secondary education, social services and assistance, early childhood development, early learning and childcare.
Capital Asset: An asset with physical substance held by the government that has an economic life extending beyond one year, will be used on a continuing basis and is not for sale in the ordinary course of operations.
Capital Transfer: A grant provided to a third party, such as a university or municipality, to acquire or develop capital assets.
Consolidation: The method used to account for government service organizations (GSOs) in the Summary Financial Statements (SFS) in which the accounts of GSOs are adjusted to the basis of accounting described in note 1 of the SFS and combined with other GSOs and partnerships. Inter-entity balances and transactions are eliminated.
Contaminated site: A site at which substances occur in concentrations that exceed the maximum acceptable amounts under an environmental standard.
Contingency: A possible right to economic resources, or an obligation that may result in future sacrifice of economic benefits, arising from existing conditions or situations involving uncertainty.
Contractual Obligation: An obligation to others that will become a liability in the future when the terms of contracts or agreements are met.
Contractual Right: A right to economic resources that will result in both an asset and revenue in the future when the terms of contracts or agreements are met.
Debenture: A certificate of indebtedness where the issuer promises to pay interest and repay principal by a maturity date. It is usually unsecured, meaning there are no liens or pledges on any specific assets.
Debt: An obligation incurred through the issuance of debt instruments. Terms used when describing debt include:
Gross debt is borrowings through the issuance of debt instruments such as promissory notes and debentures.
Public debt is gross debt net of the government’s own securities held as investments and adjusted for the accumulated impact of translating debt issued in foreign currencies to Canadian dollars.
General debt is public debt net of loans to Crown corporations for GBE specific debt.
Government business enterprise (GBE) specific debt is debt issued by GBEs or debt issued by the General Revenue Fund (GRF) specifically on behalf of a GBE where the government expects to realize the receivable from the GBE and settle the external debt simultaneously.
| 88 | Government of Saskatchewan Public Accounts 2025-26 |
Glossary of Terms
Guaranteed debt is a specific type of contingent liability, representing the debt of others that the government has agreed to repay if others default.
Derivative: A contract in which the value is based on the performance of an underlying financial asset, index or other investment. It does not require an initial investment and is settled at a future date.
Financial Asset: An asset that can be used to discharge existing liabilities or finance future operations and is not for consumption in the normal course of operations.
Financial Instrument: Any contract that gives rise to a financial asset of one party and a financial liability or equity instrument of another party.
Financing Charges: Costs associated with general debt, pension liabilities, obligations under long-term financing arrangements such as public private partnerships, and capital lease obligations. Financing charges include interest, foreign exchange gains and losses, discounts, fees and commissions.
Fixed Rate: An interest rate that remains fixed either for an entire term or part of a term.
Floating Rate: An interest rate that changes on a periodic basis.
General Revenue Fund (GRF): The primary operational account for the government through which all provincial monies under the direct authority of the Legislative Assembly are collected and disbursed.
Government Business Enterprise (GBE): An entity that is controlled by the government, is self-sufficient and has the financial and operating authority to sell goods and services to individuals and organizations outside the government reporting entity as its principal activity. GBEs are recorded in the SFS using the modified equity method.
Government Reporting Entity: A set of entities that are either controlled by the government (government service organizations and government business enterprises) or subject to shared control (partnerships). Trusts administered by the government are excluded from the government reporting entity.
Government Service Organization (GSO): An entity that is controlled by the government, except those designated as GBEs. GSOs are consolidated in the SFS.
Gross Domestic Product (GDP): The standard measure of the overall size of an economy, the value of all goods and services produced during a given period.
Hedge: A strategy to minimize the risk of loss on an asset (or liability) from market fluctuations such as interest rate or foreign exchange rate changes. This is accomplished by entering into offsetting commitments with the expectation that a future change in the value of the hedging instrument will offset the change in the value of the asset (or liability).
Modified Equity: The method used to account for GBEs in the SFS. The government’s investment, which is originally recorded at cost, is adjusted annually to include the net earnings (losses) and other net equity changes of the GBE.
Net Debt: A measure that represents the future revenue required to fund past transactions or events. It is the difference between liabilities and financial assets.
Net Realizable Value: The selling price of an asset less any costs incurred to make the sale.
Non-Financial Asset: An asset that will be used up when providing future services and is not normally used to discharge existing liabilities.
Operating Surplus (Deficit): A measure that represents the overall change in financial position for the period being reported on, excluding remeasurement gains and losses. It is the amount by which revenue exceeds expense (expense exceeds revenue) for a fiscal period.
Other Comprehensive Income (Loss) (OCI): OCI includes certain unrealized gains and losses of GBEs that are excluded from the deficit or surplus but recognized as a change in net debt and accumulated remeasurement gains and losses during the period.
| Government of Saskatchewan Public Accounts 2025-26 | 89 |
Glossary of Terms
Partnership: A contractual arrangement between the government and one or more partners outside the government reporting entity where the partners share, on an equitable basis, the risks and benefits of the arrangement. Partnerships are proportionately consolidated in the SFS.
Pension Liability: An actuarial estimate of discounted future payments to be made to retirees under the government’s pension plans, net of plan assets.
Performance Obligation: Enforceable promises to provide specific goods or services to a specific payor.
Premium/Discount: The amount by which the selling price of a security is greater or less than its par or face value.
Present Value: The current value of one or more future cash payments, determined by discounting the future cash payments using interest rates.
Proportionate Consolidation: The method used to account for partnerships in the SFS in which the accounts of partnerships are adjusted to the basis of accounting described in note 1 of the SFS and the government’s proportionate share is combined with other GSOs and partnerships. Inter-entity balances and transactions are eliminated.
Public Private Partnership (P3): A long-term contractual arrangement between the government and a private sector contractor to deliver public infrastructure. Under such contractual arrangements, a private contractor: provides some or all of the financing for the project; designs and builds the project, often providing operations and maintenance for the project; and receives payments over an extended period of time. The liabilities arising from P3 arrangements are classified in the SFS as obligations under long-term financing arrangements.
Realized gain (loss): A gain (loss) realized when a financial instrument is settled at a price higher (lower) than its book value plus selling costs.
Related Party: A related party exists when one party has the ability to exercise control or shared control over the other. Two or more parties are related when they are subject to common control or shared control. Related parties also include key management personnel, their close family members and organizations controlled by, or under shared control of, any of these individuals.
Remeasurement gain (loss): A change in the reported value of a financial instrument due to fair value measurement or change in exchange rates. This change is not realized in the operating surplus or deficit until a financial instrument is settled.
Remediation: The improvement of a contaminated site to prevent, minimize or mitigate damage to human health or the environment.
Restructuring Transaction: A transfer of an integrated set of assets and/or liabilities, together with related program or operating responsibilities without consideration based primarily on the fair value of the individual assets and liabilities transferred.
Segment: A distinguishable activity or group of activities of a government for which it is appropriate to separately report financial information to help users of the SFS identify the resources allocated to support the major activities of the government.
Sinking fund investment: An investment held for the repayment of debt.
Subsidiary: An organization that is wholly-owned or controlled by another organization.
Summary Financial Statements (SFS): The statements prepared to account for the full nature and extent of the financial activities of the government.
Transfer: A transfer of money from a government to an individual, an organization or another government for which the government making the transfer does not: receive any goods or services directly in return, as would occur in a purchase/sale transaction; expect to be repaid, as would be expected in a loan; or expect a financial return, as would be expected in an investment.
| 90 | Government of Saskatchewan Public Accounts 2025-26 |