Exhibit 99.1


LOGO

Province of Saskatchewan

(Canada)


  This description of the Province of Saskatchewan is dated as of September 29, 2026 and appears as Exhibit 99.1 to the Province’s Annual Report on Form 18-K to the U.S. Securities and Exchange Commission for the fiscal year ended March 31, 2026.

This document (otherwise than as a prospectus contained in a registration statement filed under the Securities Act of 1933) does not constitute an offer to sell or the solicitation of an offer to buy any Securities of the Province of Saskatchewan. The delivery of this document at any time does not imply that the information herein is correct as of any time subsequent to its date.


TABLE OF CONTENTS


TABLE OF CONTENTS

     2  

FURTHER INFORMATION

     3  

FORWARD-LOOKING STATEMENTS

     3  

SUMMARY

     4  

INTRODUCTION

     6  

Overview

     6  

Provincial Government

     7  

Constitutional Framework

     7  

Legal

     7  

ECONOMY

     8  

Recent Developments

     9  

Principal Economic Indicators

     10  

Gross Domestic Product

     10  

Real Gross Domestic Product
by Industry at basic prices

     10  

Exports

     11  

Capital Expenditures

     14  

Labour Market

     15  

Income and Prices

     16  

Key Sectors of Saskatchewan’s Economy

     17  

Mining, Oil & Natural Gas

     17  

Agriculture

     20  

Service Sector

     22  

GOVERNMENT FINANCES

     23  

Overview

     23  

Specific Accounting Policies

     23  

Restatements

     25  

Summary of Budget Transactions and Funding Requirements

     25  

Revenue

     26  

Program Expenditures / Expenses

     30  

Loans and Investments

     33  

PROVINCIAL DEBT

     34  

Funded Debt of the Province

     34  

Guaranteed Debt

     37  

Derivative Financial Instruments

     37  

Debt Maturities and Sinking Funds

     38  

Other Debt and Liabilities

     39  

Debt Record

     39  

Other Public Sector Debt

     39  

Pension Funds

     39  

Defined Benefit Plans

     39  

Joint Defined Benefit Plans

     40  

Defined Contribution Plans

     41  

Government Business Enterprise – Defined Benefit Pension Plans

     42  

Government Business Enterprise – Defined Contribution Pension Plans

     42  

CERTAIN CROWN CORPORATIONS AND AGENCIES

     42  

Introduction

     42  

Crown Investments Corporation of Saskatchewan (CIC)

     43  

Introduction

     43  

Fiscal Year 2025-26 Highlights - Consolidated Basis

     43  

LGS

     44  

SaskEnergy

     44  

SaskTel

     44  

SaskPower

     45  

SGI CANADA

     45  

Saskatchewan Auto Fund

     45  

Capital Expenditures

     46  

Saskatchewan Rate Review Panel

     46  

FOREIGN EXCHANGE

     46  

OFFICIAL STATEMENTS

     48  

DEBT SUMMARY AND TERM DEBT OUTSTANDING

     49  


2


FURTHER INFORMATION

This document appears as an exhibit to the Province of Saskatchewan’s Annual Report to the U.S. Securities and Exchange Commission (“SEC”) on Form 18-K for the fiscal year ended March 31, 2026. Additional information with respect to the Province of Saskatchewan is available in such Annual Report, the other exhibits to such Annual Report, and in amendments thereto. Such Annual Report, exhibits and amendments are available on the SEC’s website at http://www.sec.gov. Copies of such documents may also be obtained, without charge, from the Province of Saskatchewan, Ministry of Finance, Assistant Deputy Minister of Provincial Treasury Office, 6th Floor, 2350 Albert Street, Regina, Saskatchewan, Canada, S4P 4A6.


In this document, unless otherwise specified or the context otherwise requires, all dollar amounts are expressed in Canadian dollars. On September 29, 2026 (day before filing), the daily average exchange rate for the U.S. dollar, as reported by the Bank of Canada, was US$1.00 = $1.4188. See “Foreign Exchange” for information regarding the rates of conversion of U.S. dollars and other foreign currencies into Canadian dollars. The fiscal year of the Province of Saskatchewan ends March 31. “Fiscal 2026” and “2025-26” refers to the fiscal year ending March 31, 2026, and unless otherwise indicated, “2025” means the calendar year ended December 31, 2025. Other fiscal and calendar years are referred to in a corresponding manner. Any discrepancies between the amounts listed and their totals in the tables set forth in this document are due to rounding.

FORWARD-LOOKING STATEMENTS

This exhibit includes forward-looking statements. The Province of Saskatchewan has based these forward-looking statements on its current expectations and projections about future events. These forward-looking statements are subject to risks, uncertainties, and assumptions about the Province of Saskatchewan, including, among other things:


  •  

the Province of Saskatchewan’s economic and political trends;


  •  

the Province of Saskatchewan’s ability to control expenses and maintain revenues; and

In light of these risks, uncertainties and assumptions, the forward-looking events discussed in this annual report might not occur.


3


SUMMARY

The information below is qualified in its entirety by the detailed information provided elsewhere in this document.

PROVINCE OF SASKATCHEWAN


Economy    Year Ended December 31  
     2021     2022     2023     2024     2025  
     (in millions unless otherwise indicated)  

Gross Domestic Product at Market Prices

   $ 88,352.0     $ 117,286.0     $ 112,895.0     $ 112,839.0       Not available  

Household Income

   $ 62,847.0     $ 68,356.0     $ 70,797.0     $ 75,795.0     $ 79,901.0  

Capital Expenditures

   $ 11,928.5     $ 13,591.3     $ 17,033.5     $ 17,313.3     $ 19,697.6  

Annual Increase in Consumer Price Index

     2.6 %      6.6 %      3.9 %      1.4 %      2.1 % 

Population by July 1 (in thousands)

     1,167.6       1,178.8       1,210.3       1,247.9       1,267.0  

Unemployment Rate

     6.5 %      4.7 %      4.7 %      5.4 %      5.2 % 
Revenues and Expenses – Summary Entity    Fiscal Year Ended March 31  
     2022     2023     2024     2025     2026  
        

Revenues

   $ 18,136.2     $ 20,594.6     $ 20,993.0     $ 20,856.0     $ 21,133.5  

Current Expenses

     19,604.5       19,013.9       20,810.8       21,104.8       22,081.0  


Provincial Surplus/(Deficit)

   ($ 1,468.3 )    $ 1,580.7     $ 182.2     ($ 248.9 )    ($ 947.5 ) 


Public Sector Funded Debt    As at March 31  
     2022     2023     2024     2025     2026  
        

Government Services Organization (GSO) General

   $ 19,013.5     $ 19,175.8     $ 20,178.7     $ 22,686.6     $ 26,024.7  

Government Business Enterprise (GBE) Specific

     10,657.3       11,306.5       12,008.3       12,919.8       14,446.0  


Total Summary Entity Funded Debt

   $ 29,670.7     $ 30,482.3     $ 32,187.0     $ 35,606.3     $ 40,470.8  


Sinking Funds

   $ 2,433.8     $ 2,546.0     $ 2,924.8     $ 3,313.4     $ 3,736.6  

Gross Debt per Capita ($)

   $ 25,284.86     $ 25,367.61     $ 25,986.81     $ 28,157.65     $ 31,965.10  

Gross Debt as a Percentage of:


Household Income

     34.74 %      35.36 %      37.82 %      41.50 %      N/A  

Gross Domestic Product at Current Market Prices

     41.51 %      38.73 %      39.72 %      42.61 %      47.39 % 


4


LOGO

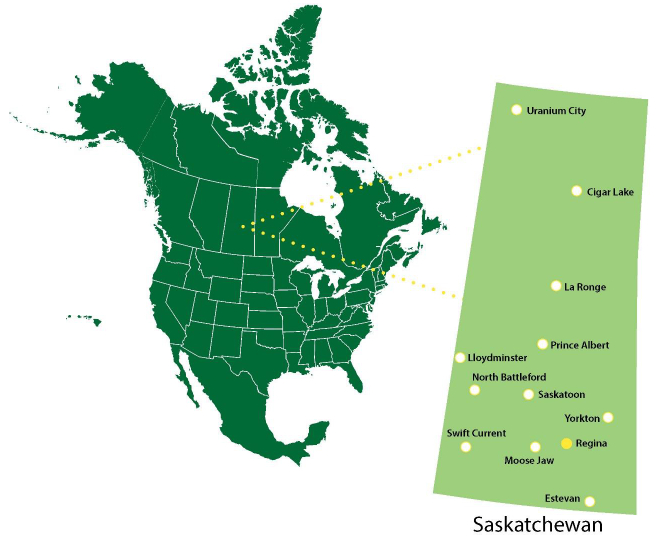
Uranium City Cigar Lake La Ronge Prince Albert Lloydminster North Battleford Saskatoon Yorkton Swift Current Regina Moose Jaw Estevan Saskatchewan


5


INTRODUCTION

Overview

The Province of Saskatchewan (“Saskatchewan” or “the Province”) was established as a province of Canada in 1905. Centrally located in Western Canada, it is bordered by the provinces of Manitoba to the east and Alberta to the west. The Province shares its 650-kilometer southern border with the American states of North Dakota and Montana and its 450-kilometer northern border with the Northwest Territories of Canada. With a 1,250-kilometer distance from north to south, Saskatchewan covers an area of 652,330 square kilometers.

The sparsely populated northern third of the Province is part of Canada’s Precambrian Shield and consists of forests, rivers and thousands of fresh water lakes. A sizeable commercial forest region is located across the entire central part of Saskatchewan. The southern half of the Province is part of the great continental plain of North America, consisting of a mixed agricultural and parkland area merging southward into open plains, a grain-growing region where the majority of the Province’s population resides. About 40% of all of Canada’s cultivated farmland is located in Saskatchewan.

The population of Saskatchewan was approximately 1,278,402 on July 1, 2026, compared with approximately 1,266,959 on July 1, 2025, and 1,122,210 on July 1, 2015. The Province’s two largest urban areas are the cities of Regina, the capital of Saskatchewan, with a population of approximately 263,419 on July 1, 2025, and Saskatoon, with a population of approximately 318,067 as of July 1, 2025.

The climate of Saskatchewan is generally dry, with temperatures varying markedly between very distinct seasons. The following table sets forth statistics on Saskatchewan’s population, area and climate.

Saskatchewan Statistics


Population          Area   
1,278,402 (July 1, 2026)   

Land:


•

570,700

   square kilometers
Major Urban Centres      

220,350

   square miles

Regina


Fresh Water:

•

Capital of Saskatchewan


•

81,630

   square kilometers

•

263,419 (July 1, 2025)*


31,520

   square miles

Saskatoon


Total:

•

Centre of Saskatchewan’s resource-based and advanced technology industries


•

652,330


251,870


square kilometers


square miles

•

318,067 (July 1, 2025)*

        
Population Density      

Farmland:


1 person per 0.53 square kilometer (per 0.20 square mile)


•

268,655

   square kilometers
        

103,730

   square miles
Mean Temperatures Range (Regina)      

Cultivated Farmland:

January

   -11 to -22 degrees Celsius      

•

202,470

   square kilometers

July

   26 to 12 degrees Celsius      

78,170

   square miles
Mean Precipitation (Regina)      

Commercial Forests:

January

   15 millimeters      

•

126,300

   square kilometers

July

   59 millimeters      

48,760

   square miles

Year

   364 millimeters         


*

2026 data for as of July 1 is not yet available.

Sources: Saskatchewan Bureau of Statistics, Statistics Canada


6


Provincial Government

The executive power in the Province of Saskatchewan is vested in the Lieutenant Governor acting upon the advice of the Executive Council, which is responsible to the Legislative Assembly. The Lieutenant Governor is appointed by the Governor General of Canada in Council and the Governor General, in turn, is appointed by a commission under the Great Seal of Canada. The Executive Council, which includes the Premier and Cabinet Ministers of the Provincial Government, is appointed by the Lieutenant Governor on the nomination of the leader of the political party which forms the Government. Members of the Executive Council hold seats in the Legislative Assembly.

Saskatchewan’s Legislative Assembly has 61 seats and is elected for a term of four years, subject to earlier dissolution by the Lieutenant Governor acting in accordance with constitutional principles. The Legislative Assembly is usually dissolved by the Lieutenant Governor on the recommendation of the Premier. The most recent Provincial election was held on October 28, 2024 and resulted in a majority for the Saskatchewan Party as the Government of Saskatchewan. As of September 2026, representation is as follows: Saskatchewan Party, 34 seats, New Democratic Party, 26 seats, and Independent, 1 seat.

Constitutional Framework

Canada consists of a federation of ten provinces with a constitutional division of powers between the federal and provincial governments. Canada was established by the Constitution Act, 1867, an Act of the Parliament of the United Kingdom, and by later enactments, including the Constitution Act, 1982, which transferred jurisdiction over the Constitution of Canada (the Constitution) from the United Kingdom to Canada.

Various constitutional issues have been under discussion in Canada for a number of years. On August 20, 1998, in response to a reference from the Federal government, the Supreme Court of Canada ruled that under the Constitution of Canada and international law, Quebec may not secede unilaterally from Canada, but that if the people of Quebec voted to secede by a clear majority vote on a clear question, the other provinces and the Federal Government would be obliged to enter negotiations with Quebec with respect to secession, such negotiations to be guided by constitutional principles, including federalism, democracy, constitutionalism and the rule of law, and the protection of minorities.

Under the Constitution, each provincial Legislature has exclusive authority to borrow money on the sole credit of that province and the authority to raise revenue for provincial purposes through direct taxation within its territorial limits. Legislatures can also raise revenue through taxation in respect of non-renewable natural resources, forestry resources and sites and facilities for electricity production and generation. Each province owns minerals and other resources on its provincial Crown lands and may own sub-surface resources on its other lands. Each province has the right to levy royalties on all lands and minerals which it owns. Each province has the legislative authority to regulate the exploration for and development, conservation and management of non-renewable natural resources, forestry resources and electricity generation. Each province also has legislative authority in the areas of education, health, social services, property and civil rights, natural resources, municipal institutions and generally all matters of a purely local or private nature.

The Parliament of Canada is empowered to borrow money and to raise revenue by any mode or system of taxation. Parliament has legislative authority over, among other things, the federal public debt and federal property, the regulation of trade and commerce, currency and coinage, banks and banking, bankruptcy and insolvency, navigation and shipping, foreign affairs, defence, postal service and unemployment insurance. It also has authority over matters not assigned to the provincial legislatures.

Legal

The Government is involved in various legal actions, including aboriginal land claims, claims for damages to persons and property and disputes over taxes and funding, the outcome of which is not determinable. Each year, Saskatchewan’s Public Accounts Volume 1 discloses any potential liabilities resulting from these actions that can be reasonably estimated (see additional details on page 63 of Exhibit 99.2, Public Accounts 2025-26, Volume 1).


7


ECONOMY

Saskatchewan has a modern, open and diversified economy. Approximately two-thirds of all goods and services produced in the province are exported. Major exports include grains, oilseeds, crude oil, potash, natural gas, uranium and manufactured goods. While many of the goods and services producing industries are directly or indirectly related to agriculture and natural resources, the provincial economy continues to diversify into other service sectors, such as the growing technology sector in the province with activities around information technology, bio-technology, agriscience, etc. Saskatchewan’s abundance of renewable and non-renewable resources has made it the largest producer of wheat, the second largest producer of crude oil and the third largest producer of natural gas in Canada. Saskatchewan is one of the world’s leading suppliers of potash and uranium. The provincial government also operates crown-owned businesses in electricity generation and transmission, natural gas transmission, auto insurance and telecommunications.


     2021      2022      2023      2024      2025      Compound
Annual rate
of growth(1)

2021-2025
 
     (in millions of $ in current prices unless otherwise indicated)         

Gross Domestic Product (Saskatchewan)


At Market Prices (2)

   $ 88,352      $ 117,286      $ 112,895      $ 112,839        *        9.7%  

Chained 2017 Dollars

     75,722        83,369        85,939      $ 88,500        *        3.3%  

GDP at Basic Prices (Chained 2017)

     71,476        78,696        81,042        83,557        85,399        4.5%  

Gross Domestic Product (Canada)


At Market Prices (2)

     2,535,818        2,864,159        2,965,201        3,108,551        *        8.8%  

Chained 2017 Dollars

     2,255,059        2,360,944        2,407,055        2,456,310        *        3.6%  

Household Income (Saskatchewan)

     62,847        68,356        70,797        75,795        79,901        6.2%  

Household Income ($ per capita)

     53,821        57,988        58,497        60,740        63,065        4.0%  

Capital Expenditures

     11,929        13,591        17,034        17,313        19,698        13.4%  

Retail Trade

     23,312        25,094        25,181        25,706        26,337        3.1%  

Value of Manufacturing Sales

     20,097        24,931        23,355        21,889        21,223        1.4%  

Unemployment Rate


Saskatchewan

     6.5%        4.7%        4.7%        5.4%        5.2%        N/A  

Canada

     7.5%        5.3%        5.4%        6.4%        6.8%        N/A  

Annual Increase in Consumer Price Index:


Saskatchewan

     2.6%        6.6%        3.9%        1.4%        2.1%        N/A  

Canada

     3.4%        6.8%        3.9%        2.4%        2.1%        N/A  

Wholesale Trade (dollars)(3)

     32,197        47,363        42,082        43,661        44,931        8.7%  

Value of Building Permits (dollars)

     1,747        2,146        2,425        2,887        3,343        17.6%  

New Housing Starts (units)

     4,172        4,211        4,619        4,319        6,150        10.2%  

New Motor Vehicle Sales (units)

     42,649        41,840        44,671        50,759        55,346        6.7%  
 
Notes:

(1) Compound annual rate of growth is determined by distributing the aggregate amount of growth during the relevant period assuming a single annual rate of growth compounded annually. These rates are not adjusted for inflation unless otherwise indicated. Where 2025 data is not available, compound annual rate of growth is calculated using data from 2020 to 2024.

(2) Gross Domestic Product (“GDP”) at market prices represents the total value added by all industries plus taxes less subsidies. GDP at Basic Prices represents the total value added by all industries.

(3) Wholesale trade excludes petroleum, petroleum products and other hydrocarbons, oilseed and grain.


8


N/A = not applicable; * Data not yet available.

Sources:

Statistics Canada. Table 36-10-0221-01 Gross domestic product, income-based, provincial and territorial, annual (x 1,000,000); Table 36-10-0222-01 Gross domestic product, expenditure-based, provincial and territorial, annual (x 1,000,000); Table 36-10-0711-01 Gross domestic product (GDP) at basic prices, by industry, provinces and territories (x 1,000,000); Table 36-10-0226-01 Household sector, selected indicators, provincial and territorial; Table 34-10-0035-01 Capital and repair expenditures, non-residential tangible assets, by industry and geography (x 1,000,000); Table 20-10-0056-01 Retail trade sales by province and territory (x 1,000); Table 16-10-0048-01 Manufacturing sales by industry and province, monthly (dollars unless otherwise noted) (x 1,000); Table 14-10-0287-01 Labour force characteristics, monthly, seasonally adjusted and trend-cycle, last 5 months; Table 20-10-0074-01 Wholesale trade, sales (x 1,000); Table 34-10-0292-01 Building permits, by type of structure and type of work (x 1,000); Table 34-10-0135-01 Canada Mortgage and Housing Corporation, housing starts, under construction and completions, all areas, quarterly; and Table 20-10-0085-01 New motor vehicle sales.

Recent Developments

Saskatchewan’s economy expanded by 2.2 per cent in 2025, driven by strong growth in agricultural, especially crop production, and construction, supported by strong labour market performance, moderate population growth and solid investment in construction. In 2026, strong commodity exports, rising manufacturing sales, and continued investment in major projects and housing are supporting growth amid trade uncertainty, geopolitical tensions, and slower population growth.

Saskatchewan’s real GDP is expected to grow by 1.5 per cent in 2026, according to the average of the private sector forecasts as of August 2026.

RECENT ECONOMIC PERFORMANCE


     Saskatchewan       Canada      Covering Period
     (per cent change unless noted otherwise)       

Employment

     0.4%          0.4%      Jan - Jul 2026

Unemployment rate, %

     6.0           6.7      Jan - Jul 2026

Employment rate, %

     63.1           60.6      Jan - Jul 2026

Consumer price index

     3.2%          2.6%      Jan - Jul 2026

Average weekly earnings

     3.2%          3.1%      Jan - Jun 2026

Retail sales

     1.4%          4.1%      Jan - Jun 2026

Wholesale trade (1)

     13.0%          5.3%      Jan - Jun 2026

New motor vehicle sales

     (5.4%)          (2.3%)      Jan - Jun 2026

Sales in food services and drinking places

     4.4%          5.6%      Jan - Jun 2026

Manufacturing sales

     12.7%          6.1%      Jan - Jun 2026

International goods exports

     11.6%          7.2%      Jan - Jun 2026

International goods imports

     21.9%          3.9%      Jan - Jun 2026

Building permits

     16.5%          8.8%      Jan - Jun 2026

Housing starts

     6.0%          (3.3%)       Q1 - Q2 2026

Total investment in building construction, all types

     17.8%          5.7%      Jan - Jun 2026

Residential

     20.9%          6.4%      Jan - Jun 2026

Non-residential

     12.6%          4.2%      Jan - Jun 2026
 

Notes:

(1) Wholesale trade excludes petroleum, petroleum products and other hydrocarbons, oilseed and grain.

Sources: Statistics Canada


9


Principal Economic Indicators

Gross Domestic Product

Saskatchewan’s real GDP at market prices measured in chained 2017 dollars increased by 3.0 per cent in 2024 and at a compound average annual rate of 3.3 per cent in the period from 2020 to 2024. Measured in current market prices, Saskatchewan’s nominal GDP grew at a compound average annual rate of 9.7 per cent in the same period.

The following table sets forth the composition of Saskatchewan’s GDP both at current market prices and in chained 2017 dollars for the five years (2020 to 2024).

GROSS DOMESTIC PRODUCT


Compound

Annual
Growth Rate

 
     2020     2021     2022      2023     2024     2020-2024  
     (in millions of $ in current prices unless otherwise indicated)        

GDP - Current Market Prices


Final Consumption Expenditures

   $ 55,623     $ 60,038     $ 65,547      $ 68,991     $ 73,120       7.1 % 

Gross Fixed Capital Formation

     17,083       18,266       20,554        23,906       27,205       12.3 % 

Investment in Inventories

     (1,689 )      (2,291 )      5,362        219       (563 )      (24.0 %) 

Non-Farm

     (314 )      1,790       1,545        555       381       N/A  

Farm

     (1,355 )      (4,088 )      3,757        (391 )      (981 )      (7.8 %) 

Exports of Goods and Services

     49,986       62,233       80,865        76,250       70,731       9.1 % 

Less: Imports of Goods and Services

     43,237       49,938       55,087        56,501       57,633       7.4 % 


Total

   $ 77,778     $ 88,352     $ 117,286      $ 112,895     $ 112,839       9.7 % 


GDP - Chained 2017 Dollars


Final Consumption Expenditures

     53,347       56,057       58,372        59,716       61,672       3.7 % 

Gross Fixed Capital Formation

     16,374       16,716       17,508        19,453       21,325       6.8 % 

Investment in Inventories

     (1,058 )      (2,992 )      3,872        469       155       N/A  

Non-Farm

     317       1,340       760        (10 )      (240 )      N/A  

Farm

     (1,346 )      (3,743 )      2,709        400       353       N/A  

Exports of Goods and Services

     51,082       49,120       45,950        49,604       49,608       (0.7 %) 

Less: Imports of Goods and Services

     42,223       43,862       42,358        43,267       43,670       0.8 % 


Total

   $ 77,761     $ 75,722     $ 83,369      $ 85,939     $ 88,500       3.3 % 


Notes:

(1) N/A = not applicable

(2) Components may not add up to total due to the use of chained fisher price methodology.

Source:

Statistics Canada. Table 36-10-0222-01 Gross domestic product, expenditure-based, provincial and territorial, annual (x 1,000,000)

Real Gross Domestic Product by Industry at basic prices

The following table sets forth Saskatchewan’s real GDP at basic prices by industry for the five years ending on December 31, 2025.


10


REAL GDP AT BASIC PRICES BY INDUSTRY


                                        Share of
2025
    Annual
Growth Rate
    %
Change
 
     2021      2022      2023      2024      2025      Total     2021-2025     from 2024  


     (millions of dollars)                     

Goods-Producing Industries


Agriculture, forestry, fishing and hunting

   $ 3,009      $ 6,971      $ 6,718      $ 7,235      $ 8,332        9.8 %      29.0 %      15.2 % 

Mining

     12,187        12,641        12,977        13,572        13,283         15.6 %      2.2 %      (2.1 %) 

Utilities

     2,311        2,441        2,508        2,540        2,608        3.1 %      3.1 %      2.7 % 

Construction

     5,046        5,249        5,763        6,328        6,919        8.1 %      8.2 %      9.3 % 

Manufacturing

     4,584        5,005        5,329        5,064        4,749        5.6 %      0.9 %      (6.2 %) 


   $ 26,734      $ 31,651      $ 32,473      $ 33,871      $ 34,839        40.8 %      6.8 %      2.9 % 


Services Industries


Transportation and Warehousing

     3,371        3,541        3,821        3,894        3,960        4.6 %      4.1 %      1.7 % 

Finance, Insurance & Real Estates

     11,717        11,798        12,145        12,422        12,646        14.8 %      1.9 %        1.8 %  

Wholesale & Retail Trade

     8,201        8,246        8,632        8,777        8,801        10.3 %      1.8 %      0.3 % 

Business Services

     7,203        7,730        8,068        8,195        8,282        9.7 %      3.6 %      1.1 % 

Institutions

     9,464        9,773        9,972        10,316        10,649        12.5 %      3.0 %      3.2 % 

Public Administration

     5,005        5,178        5,206        5,228        5,303        6.2 %      1.5 %      1.4 % 


   $ 44,902      $ 46,226      $ 47,812      $ 48,805      $ 49,635        58.1 %      2.5 %      1.7 % 


Real GDP at Basic Prices

   $ 71,476      $ 78,696      $ 81,042      $ 83,557      $ 85,399        100.0 %            4.5 %      2.2 % 


Notes:

(1) Components may not add up to total due to the use of chained fisher price methodology.

(2) Wholesale trade excludes petroleum, petroleum products and other hydrocarbons, oilseed and grain.


Source:

Statistics Canada. Table 36-10-0402-01 Gross domestic product (GDP) at basic prices, by industry, provinces and territories (x1,000,000).

Exports

Saskatchewan’s international exports of goods and services to other countries were $44.9 billion in 2024 and accounted for 63.5 per cent of total exports. The other 36.5 per cent of exports consisted of trade with other Canadian provinces. International exports increased at a compound average annual rate of 7.9 per cent over the period from 2020 to 2024. Total exports of goods and services to other provinces were $25.8 billion in 2024 and increased at a compound average annual rate of 11.2 per cent from 2020 to 2024.

The trade balance was $13.1 billion in 2024, an average annual increase of 33.7 per cent since 2020.

The following table sets forth details of Saskatchewan’s exports and imports at current market prices for the five calendar years ending in 2024.


11


TRADE IN CANADA AND ABROAD


                                        Compound        
                                        Annual        
                                        Growth
Rate
    Share of  
     2020      2021      2022      2023      2024      2020-2024     Total 2024  
     (millions of dollars)               

Exports


To other countries

   $ 33,118      $ 41,264      $ 54,379      $ 49,658      $ 44,923        7.9 %      63.5 % 

Goods

     31,287        39,203        52,331        47,255        42,433        7.9 %      60.0 % 

Services

     1,831        2,061        2,048        2,403        2,490        8.0 %      3.5 % 

To other provinces

     16,868        20,969        26,486        26,592        25,808        11.2 %      36.5 % 

Goods

     10,281        13,694        18,380        17,825        16,614        12.7 %      23.5 % 

Services

     6,587        7,275        8,106        8,767        9,194        8.7 %      13.0 % 


Total exports of goods and services

   $ 49,986      $ 62,233      $ 80,865      $ 76,250      $ 70,731        9.1 %      100.0 % 


Imports


From other countries

   $ 18,705      $ 21,477      $ 25,074      $ 26,204      $ 26,752        9.4 %      37.8 % 

Goods

     15,962        18,602        21,883        22,631        22,874        9.4 %      32.3 % 

Services

     2,743        2,875        3,191        3,573        3,878        9.0 %      5.5 % 

From other provinces

     24,532        28,461        30,013        30,297        30,881        5.9 %      43.7 % 

Goods

     10,472        13,468        13,748        12,875        12,614        4.8 %      17.8 % 

Services

     14,060        14,993        16,265        17,422        18,267        6.8 %      25.8 % 


Total imports of goods and services

   $ 43,237      $ 49,938      $ 55,087      $ 56,501      $ 57,633        7.4 %       100.0 % 


Balance of Trade

   $ 6,749      $ 12,295      $ 25,778      $ 19,749      $ 13,098            33.7 %   


Sources:

Statistics Canada. Table 36-10-0222-01 Gross domestic product, expenditure-based, provincial and territorial, annual (x 1,000,000)

INTERNATIONAL MERCHANDISE TRADE

Amid rising trade protectionism and softer global demand, Saskatchewan’s international merchandise exports were valued at $43.6 billion in 2025, above the prior five-year average level of $42.8 billion, but down 4.0 per cent compared to 2024. The largest declines were in energy products (-$1.9 billion), where low oil prices drove the reduction in exports. Other notable declines in tariff-impacted sectors were in agricultural products (-$612.1 million), forestry products (-$192.2 million), industrial machinery (-$95.9 million) and metal and related products (-$124.3 million). These declines were partially offset by an increase in mining product exports under the category of metal ores and non-metallic minerals (+$1.0 billion).

Farm and intermediate food products, energy products (crude oil) and non-metallic minerals (potash) are Saskatchewan’s principal exports, accounting for 41.1 per cent, 32.7 per cent and 20.6 per cent, respectively, of total international exports in 2025. From 2021 to 2025, total international merchandise exports increased by 4.1 per cent per year on average, while imports increased by an average of 11.4 per cent per year.


                                        Compound        
                                        Annual     Share of  
                                        Growth Rate     Total  
     2021      2022      2023      2024      2025      2021-2025     2025  
     (millions of dollars)                      

Exports


Farm, fishing and intermediate food products

   $ 17,415      $ 18,381      $ 20,176      $ 18,471      $ 17,900        0.7 %      41.1 % 


12


                                        Compound        
                                        Annual     Share of  
                                        Growth Rate     Total  
     2021      2022      2023      2024      2025      2021-2025     2025  
     (millions of dollars)                      

Energy products

     9,419        14,481        14,382        16,105        14,255        10.9 %      32.7 % 

Metal ores and non-metallic minerals

     7,155        16,350        11,702        7,951        8,997        5.9 %      20.6 % 

Other

     3,051        3,323        3,252        2,845        2,428        (5.5 %)      5.6 % 


Total Exports

   $ 37,039      $ 52,534      $ 49,512      $ 45,371      $ 43,580        4.1 %      100.0 % 


Imports


Chemical, plastic and rubber products

   $ 2,008      $ 2,785      $ 2,668      $ 2,780      $ 3,057        11.1 %      7.0 % 

Machinery, equipment and parts

     3,655        5,353        5,964        6,350        6,243        14.3 %      14.3 % 

Motor vehicles and parts

     1,366        1,716        1,862        2,208        1,982        9.7 %      4.5 % 

Others

     4,060        5,236        5,286        5,272        5,777        9.2 %      13.3 % 


Total

   $ 11,089      $ 15,089      $ 15,780      $ 16,610      $ 17,059        11.4 %      100.0 % 


Balance of Trade in Goods

   $ 25,951      $ 37,444      $ 33,733      $ 28,761      $ 26,521        9.9 %   


Source:

Statistics Canada. Table 12-10-0175-01 Int merchandise trade by province, commodity, and Principal Trading Partners (x 1,000)

The United States is Saskatchewan’s largest trading partner, followed by China. In 2025, Saskatchewan sold $23.7 billion of goods to the United States, which accounted for 54.3 per cent of total international exports. Approximately $2.9 billion of goods were sold to China, which accounted for 6.6 per cent of total international exports. 

On the import side, the United States, China and Germany remained Saskatchewan’s largest import partners. In 2025, 85.5 per cent of Saskatchewan’s imports originated from these three countries. Between 2021 and 2025, imports from these three countries increased significantly.

INTERNATIONAL MERCHANDISE EXPORTS AND IMPORTS BY TOP 10 TRADING PARTNERS


                                        Compound        
                                        Annual        
                                        Growth Rate     Share of  
     2021      2022      2023      2024      2025      2021-2025     Total 2025  
     (millions of dollars)                      

International Exports


United States

   $ 19,907      $ 29,332      $ 27,161      $ 26,718      $ 23,683        4.4 %      54.3 % 

China

     4,144        5,076        5,476        4,395        2,869        (8.8 %)      6.6 % 

Brazil

     1,236        2,556        2,567        1,135        1,660        7.7 %      3.8 % 

Japan

     1,329        1,205        1,009        929        1,232        (1.9 %)      2.8 % 

India

     604        1,394        1,305        1,463        827        8.2 %      1.9 % 

Indonesia

     911        1,657        845        869        1,119        5.3 %      2.6 % 

Mexico

     993        1,021        962        639        949        (1.1 %)      2.2 % 

Algeria

     557        575        765        615        673        4.8 %      1.5 % 

Netherlands

     136        364        410        755        988        64.2 %      2.3 % 

Belgium

     446        591        525        506        597        7.6 %      1.4 % 


Sub-total

     30,262        43,771        41,024        38,022        34,597        3.4 %      79.4 % 

Other Countries

     6,777        8,763        8,489        7,349        8,983        7.3 %      20.6 % 


Total All Countries

   $ 37,039      $ 52,534      $ 49,512      $ 45,371      $ 43,580        4.1 %      100.0 % 


13


                                        Compound        
                                        Annual        
                                        Growth Rate     Share of  
     2021      2022      2023      2024      2025      2021-2025     Total 2025  
     (millions of dollars)                      

International Imports


United States

   $ 8,859      $ 12,280      $ 12,677      $ 13,349      $ 13,349        10.8 %      78.2 % 

China

     403        503        563        508        635        12.0 %      3.7 % 

Germany

     335        499        569        557        609        16.1 %      3.6 % 

Mexico

     239        354        416        502        564        23.9 %      3.3 % 

Japan

     287        152        155        182        231        (5.3 %)      1.4 % 

Italy

     86        98        114        117        130        11.0 %      0.8 % 

India

     68        103        99        112        139        19.5 %      0.8 % 

United Kingdom

     86        92        106        95        108        6.0 %      0.6 % 

South Korea

     39        98        92        51        61        11.8 %      0.4 % 

France

     46        97        59        51        64        8.9 %      0.4 % 


Sub-total

     10,447        14,275        14,851        15,523        15,890        11.1 %      93.1 % 

Other Countries

     641        814        929        1,087        1,169        16.2 %      6.9 % 


Total All Countries

   $ 11,089      $ 15,089      $ 15,780      $ 16,610      $ 17,059        11.4 %      100.0 % 


Source:

Statistics Canada. Table 12-10-0175-01 International merchandise trade by province, commodity, and Principal Trading Partners (x 1,000)

Capital Expenditures

Capital expenditures consist of investments in capital by both the private and public sectors. The following table sets forth information on Saskatchewan’s capital expenditures for the 2021 to 2025 calendar years.

CAPITAL EXPENDITURES


North American Industry Classification System    2021      2022      2023      2024      2025  
     (millions of dollars)  

Agriculture, forestry, fishing and hunting2

     x        x      $ 2,394.0      $ 1,798.6      $ 1,681.8  

Mining, quarrying, and oil and gas extraction1

     4,098.1        4,959.1        6,507.8        6,688.0        8,095.2  

Utilities

     1,297.7        1,483.3        1,707.4        2,081.6        2,316.0  

Construction

     227.8        248.5        449.8        395.9        438.4  

Manufacturing

     509.6        761.0        985.9        995.2        1,027.4  

Wholesale trade2,3

     303.3        360.3        298.5        265.4        226.5  

Retail trade2

     218.3        272.7        300.4        257.7        216.6  

Transportation and warehousing2

     x        900.9        932.3        1,000.0        1,200.6  

Information and cultural industries2

     x        406.3        x        468.4        563.6  

Finance and insurance2

     x        52.1        x        x        87.9  

Real estate and rental and leasing

     279.9        390.3        453.1        384.3        396.2  

Professional, scientific and technical services2

     x        62.4        F        126.5        140.8  

Management of companies and enterprises2

     x        141.0        134.2        115.5        130.1  

Administrative and support, waste management and remediation services2

     x        F        77.6        71.4        75.7  

Educational services

     308.4        289.1        338.7        323.8        359.1  

Health care and social assistance

     261.2        255.7        399.1        653.1        822.4  

Arts, entertainment and recreation2

     x        122.2        x        x        96.0  

Accommodation and food services2

     F        x        75.4        x        89.8  

Other services2

     x        42.1        69.1        x        69.2  

Public administration

     1,235.8        1,165.9        1,241.7        1,339.3        1,664.3  


   $ 11,928.5      $ 13,591.3      $ 17,033.5      $ 17,313.3      $ 19,697.7  


Capital, construction

   $ 7,385.8      $ 8,272.1      $ 10,257.1      $ 10,999.8      $ 12,752.9  

Capital, machinery and equipment

     4,542.7        5,319.2        6,776.4        6,313.5        6,944.7  


   $ 11,928.5      $ 13,591.3      $ 17,033.5      $ 17,313.3      $ 19,697.7  


14


North American Industry Classification System    2021      2022      2023      2024      2025  
     (millions of dollars)  

Private Sector

   $ 8,463.9      $ 9,922.6      $ 12,562.4      $ 12,179.8      $ 13,643.7  

Public Sector

     3,464.6        3,668.7        4,471.1        5,133.5        6,053.9  


   $ 11,928.5      $ 13,591.3      $ 17,033.5      $ 17,313.3      $ 19,697.6  


Notes:

(1) Includes oil and natural gas extraction, potash, uranium, and other minerals.

(2) Certain data (indicated by “x”) is not available due to the confidential nature of the information. Other data (indicated by “F”) is too unreliable to be published.

(3) Wholesale trade excludes petroleum, petroleum products and other hydrocarbons, oilseed and grain.


Sources:

Statistics Canada. Table 34-10-0035-01 Capital and repair expenditures, non-residential tangible assets, by industry and geography (x 1,000,000); Table 34-10-0038-01 Capital and repair expenditures, non-residential tangible assets, by type of ownership and geography (x 1,000,000).

Labour Market

Population growth has contributed to labour force growth in Saskatchewan. In 2025, the province’s labour force reached an all-time high of 651,175 people, a growth of 54,050 from 2021. Employment grew by approximately 59,058 in the province from 2021 to 2025. The unemployment rate was the lowest among provinces in 2025.

The following table sets forth selected labour force statistics for Saskatchewan and Canada for the five calendar years ending in 2025.

LABOUR MARKET STATISTICS


                                        Compound  
                                        Annual  
            Growth Rate  
     2021      2022      2023      2024      2025      2021-2025  
     (thousands, except percentages)         

Labour Force


Saskatchewan

     597.1        605.9        616.0        636.8        651.2        2.2%  

Canada

     20,505.6        20,838.3        21,493.0        22,134.8        22,567.6        2.4%  

Employed


Saskatchewan

     558.3        577.8        587.0        602.2        617.4        2.5%  

Canada

     18,964.1        19,739.5        20,334.7        20,730.5        21,028.6        2.6%  

Employment Rate, %


Saskatchewan

     63.1        64.6        64.0        63.7        63.9        N/A  

Canada

     60.5        62.0        62.2        61.3        60.8        N/A  

Unemployed


Saskatchewan

     38.8        28.1        29.1        34.6        33.8        (3.4%)  

Canada

       1,541.5          1,098.8           1,158.3          1,404.2           1,538.9            (0.0%)  

Unemployment Rate, %


Saskatchewan

     6.5        4.7        4.7        5.4        5.2        N/A  

Canada

     7.5        5.3        5.4        6.4        6.8        N/A  

Participation Rate, %


Saskatchewan

     67.5        67.7        67.2        67.4        67.4        N/A  

Canada

     65.4        65.5        65.8        65.5        65.3        N/A  


15


Notes:

(1) Components may not add up to total due to rounding.

Source:

Statistics Canada. Table 14-10-0287-01 Labour force characteristics, monthly, seasonally adjusted and trend-cycle.

Between 2021 and 2025, business & community services, transportation & warehousing, and wholesale & retail trade were the leading sectors in terms of employment creation.

The following table sets forth selected statistics of employment by industry for the province.

EMPLOYMENT BY INDUSTRY


                                        Compound        
                                        Annual    

Share

of 2025

 
                                        Growth Rate  
     2021      2022      2023      2024      2025      2021-2025     Total  
     (thousands unless otherwise indicated)               

Goods-Producing Industries


Agriculture & Forestry

     32.1        29.7        25.8        27.0        28.6        (2.8 %)      4.6 % 

Mining, oil & gas

     20.5        19.1        19.7        20.9        22.3        2.1 %      3.6 % 

Utilities

     6.0        6.6        7.6        6.2        7.0        3.9 %      1.1 % 

Construction

     42.6        46.0        42.7        42.7        47.7        2.9 %      7.7 % 

Manufacturing

     31.2        31.4        32.4        32.4        29.4        (1.5 %)      4.8 % 


     133.3        133.5        128.9        130.3        136.0        0.5 %      22.0 % 


Service Industries


Transportation & Warehousing

     23.7        25.4        28.2        29.0        27.1        3.4 %      4.4 % 

Wholesale & Retail Trade

     94.1        97.5        98.8        100.1        97.5        0.9 %      15.8 % 

Finance, Insurance and Real Estate

     28.2        30.6        28.9        27.8        29.1        0.8 %      4.7 % 

Business & Community Services

     243.2        255.6        266.2        277.9        286.9        4.2 %      46.5 % 

Public administration

     35.9        35.3        36.0        37.2        40.8        3.3 %      6.6 % 


     425.1        444.4        458.1        472.0        481.4        3.2 %      78.0 % 


Total

     558.3        577.8        587.0        602.2        617.4        2.5 %      100.0 % 


Notes:

(1) Components may not add up to total due to rounding.

(2) Wholesale trade excludes petroleum, petroleum products and other hydrocarbons, oilseed and grain.

Source:

Statistics Canada. Table 14-10-0023-01 Labour force characteristics by industry, annual (x 1,000)

Income and Prices

Saskatchewan’s primary household income and household disposable income increased at a compound average annual rate of 6.2 per cent and 5.9 per cent, respectively, from 2021 to 2025. The following table presents household income for Saskatchewan for the five years ending on December 31, 2025.


16


HOUSEHOLD INCOME


                                        Compound  
                                        Annual  
                                        Growth Rate  
     2021      2022      2023      2024      2025      2021-2025  
            (thousands unless otherwise indicated)         

Compensation of Employees

   $ 33,926      $ 36,219      $ 38,039      $ 40,178      $ 41,769        5.3 % 

Net Mixed Income

     7,369        9,695        9,034        9,362        11,133        10.9 % 

Property Income Received

     6,737        7,894        8,878        10,243        10,372        11.4 % 

Current Transfers Received

     14,815        14,549        14,846        16,012        16,627        2.9 % 


Household Income

   $ 62,847      $ 68,357      $ 70,797      $ 75,795      $ 79,901        6.2 % 

Less: Property Income Paid

     1,551        1,815        2,677        2,955        2,855        16.5 % 

Less: Current Transfers Paid

     17,894        18,941        20,136        21,475        22,385        5.8 % 


Household Disposable Income

   $ 43,402      $ 47,601      $ 47,984      $ 51,365      $ 54,662        5.9 % 


Source:

Statistics Canada. Table 36-10-0588-01 Household sector, selected indicators, provincial and territorial

From 2021 to 2023, inflation, as measured by the growth of the Consumer Price Index (CPI), outpaced average wage growth in both Saskatchewan and across Canada. However, since 2024, average wages grew faster than the CPI, resulting in a boost to real incomes for workers.

CPI AND AVERAGE WEEKLY WAGES AND SALARIES, INDUSTRIAL

AGGREGATE (PERCENT INCREASE OVER PREVIOUS YEAR)


     Saskatchewan    Canada


     Average Weekly Wages    CPI    Average Weekly Wages    CPI


2021    1.36%    2.61%    2.97%    3.40%
2022    3.00%    6.61%    3.11%    6.80%
2023    2.33%    3.90%    3.40%    3.88%
2024    4.18%    1.45%    4.58%    2.38%
2025    4.16%    2.11%    3.40%    2.07%
 
Sources:

Statistics Canada. Table 14-10-0204-01 Average weekly earnings by industry, annual; and Table 18-10-0005-01 Consumer Price Index, annual average, not seasonally adjusted

Key Sectors of Saskatchewan’s Economy

Mining, Oil & Natural Gas

Mining, quarrying, oil and gas is the largest GDP-contributing sector in Saskatchewan. The dominant commodities from the sector include crude oil, potash, natural gas and uranium.

In 2025, the total value of mineral sales amounted to $24.4 billion, an increase of 0.3 per cent from the prior year, largely due to potash prices. Crude oil, natural gas and potash accounted for 85.2 per cent of the total value of mineral sales in 2025.

In the first six months of 2026, the value of oil production increased by 20.8 per cent compared to the same period in 2025. The value of natural gas sales decreased by 6.3 per cent in the first six months of 2026, compared to the same period in 2025. The value of potash sales increased by 22.1 per cent, while the value of uranium sales decreased by 20.5 per cent in the first half of 2026, compared to the same period in 2025.


17


The following table sets forth Saskatchewan’s value and volume of mineral sales for the five calendar years ending in 2025.

MINERAL SALES


     2021      2022      2023      2024      2025      Compound
Annual
Growth Rate
2021-2025
    Share of
Total
2025
    % Change
2024
to 2025
 
Value of Sales    (millions of dollars unless otherwise indicated)                     

Oil1

   $ 10,868      $ 16,333      $ 13,068      $ 13,306      $ 11,302        1.0 %      46.3 %      (15.1 %) 

Natural Gas

     453        654        359        193        217        (16.8 %)      0.9 %      12.6 % 

Potash

     7,556        17,978        10,866        7,847        9,276        5.3 %      38.0 %      18.2 % 

Uranium

     611        963        1,622        2,552        3,188        51.1 %      13.1 %      24.9 % 

Other2

     394        498        399        421        435        2.5 %      1.8 %      3.3 % 


Total

     19,886        36,450        26,322        24,319        24,394        5.2 %      100.0 %      0.3 % 


Volume of Production


Oil (millions of barrels)

     162        166        166        164        159        (0.5 %)        (3.3 %) 

Natural Gas (millions of cubic metres)

     4,042        3,867        3,865        3,660        3,473        (3.7 %)        (5.1 %) 

Potash (thousands of tonnes)

     14,242        14,355        14,002        15,120        15,118        1.5 %        (0.0 %) 
 
1 

Includes gold, sodium sulphate, salt, coal, and base metals and bentonite.

Sources: Saskatchewan Bureau of Statistics (historical data); Ministry of Energy and Resources (current year data).

Oil. Saskatchewan is the second largest crude oil producing province in Canada. Subject to change due to price fluctuations and technology improvements, remaining economically recoverable reserves in the province are estimated to be 1.2 billion barrels of crude oil.

In 2025, the value of Saskatchewan’s oil production decreased by 15.1 per cent, and the volume of oil production dipped by 3.3 per cent. However, both are expected to increase in 2026, with the value of oil production projected to rise by about 16.2 per cent due to higher oil prices and the volume by 2.6 per cent compared to 2025.

Saskatchewan’s crude oil production is of light, medium and heavy gravity. The major market for Saskatchewan’s oil is the upper Midwest of the United States (approximately 65 to 75 per cent).

Currently, Saskatchewan has two facilities capable of upgrading heavy oil: The Husky Energy Lloydminster Upgrader in Lloydminster and the Co-op Refinery Complex in Regina. Husky’s upgrader currently has a throughput capacity of 82,000 barrels of heavy crude oil per day, while the Co-op Refinery Complex has the ability to process 135,000 barrels of crude oil per day. The Moose Jaw Refinery, an affiliate of Gibson Energy Ltd., currently processes about 22,000 barrels per day for use as roofing flux and high-quality road asphalt.

Many local and national oil and natural gas companies are actively involved in exploration and development in the province. The oil industry has experienced success with deep drilling discoveries and is adopting technological improvements, for example, new waterflood and enhanced oil recovery (EOR) techniques, including carbon dioxide injection for EOR. The oil industry in the province invested approximately


18


$14.5 billion in the period from 2020 to 2025, exploring for and developing oil reserves. From 2021 to the end of 2025, 6,501 oil wells were drilled in Saskatchewan. In 2025, 1,119 oil wells were drilled in the province.

Natural Gas. The volume of Saskatchewan natural gas produced decreased by 5.1 per cent in 2025 from 2024, while the value of natural gas production available for use or sale increased by 12.6 per cent in the same period. The value and volume of natural gas production are projected to decline in 2026. The natural gas industry in the province invested between $1.8 million and $2.0 million in the period from 2021 to 2025, exploring for and developing natural gas reserves (note this value does not include investment from TransGas or other pipeline companies in Saskatchewan as well as gas plant cost). During this period, three natural gas wells were drilled.

Potash. Saskatchewan has ten potash mines that produce potash from massive reserves located in southern Saskatchewan. By conservative estimates, Saskatchewan could supply world demand at current levels for several hundred years. Potash production in Saskatchewan is highly mechanized and relatively low-cost because of the regularity and thickness of deposits and the predictability of ore grades.

In 2025, the Saskatchewan potash industry accounted for approximately one third of the world’s production and world trade. Saskatchewan’s largest potash market is the United States, followed by Brazil, Indonesia, and China. There are a large number of multinational companies active in the province’s potash industry. The Saskatchewan government implemented changes in 2003 and 2005 to the potash tax system to promote sales and investment by the potash industry. Since then, the government has continued to layer new modern tax incentives and regulatory shifts which target corporate expansions, research and development and infrastructure. As a result, the potash industry continues to be one of the main engines of economic growth in Saskatchewan’s economy for the future.

Since 2005, the Saskatchewan potash industry has committed over $40 billion to expansions and new mines, including the K+S solution mine at Bethune, Saskatchewan, the first new potash mine built in the province since the 1970s. The BHP Jansen Stage 1 potash mine project, which began construction in 2021, is now 84% complete as of mid-2026. First production from Stage 1 is expected in mid-2027, returning to the original estimated timeline, after the company indicated it was on track to produce in 2026 but has been delayed due to slower-than-expected progress. Furthermore, a $6.9 billion investment for the Jansen Stage 2 was approved in 2024. This stage, which is expected to take about six years to construct, is at 16% complete as of mid-2026 and is expected to deliver its first production by the 2031 calendar year. The Stage 2 investment will be used for the development of additional mining districts, expansion of processing facilities and the addition of more rail cars and would double the mine’s capacity to about 8.5 million tonnes per year from 4.15 million tonnes in Stage 1.

Uranium. Saskatchewan’s uranium production in 2023 represented 20 per cent of the global production, securing its position as the second largest producer behind Kazakhstan. Saskatchewan is the sole producer of uranium in Canada and has been producing uranium continuously since 1953. Uranium production is from the Athabasca Basin in northern Saskatchewan, which contains the largest, high-grade uranium deposits in the world and has significant potential for the discovery of additional deposits. Saskatchewan is recognized as a long-term and stable source of uranium.

Cigar Lake began commercial production in 2015. In 2025, the Cigar Lake uranium mine produced a total production of 19.1 million pounds of uranium ore, up 13.0 per cent from 2024. The ore from Cigar Lake is milled at the McClean Lake uranium mill located in northern Saskatchewan. Construction of the McClean Lake operation began in 1994. The mining and milling of uranium ore from five open-pit mines have been completed, and no conventional mining has been carried out at McClean Lake since 2008. Commercial production using the surface-based waterjet technique called the Surface Access Borehole Resource Extraction (SABRE) method started in July 2025 at McClean Lake. Uranium production at Cigar Lake is forecasted to be between 17.5 and 18.0 million pounds for 2026.

Future uranium production is expected to include several other deposits, including an expansion at McArthur River which has received regulatory approval, and potential for underground development at McClean Lake, the Midwest project and the Millennium project. The McArthur River project began production


19


in 1999 with the ore being processed at the Key Lake mill. Operations at the McArthur River and Key Lake facilities were suspended indefinitely in 2018 due to continued weakness in the uranium market. However, McArthur River mine and Key Lake were restarted in 2022 and started operation by transitioning back to production through the first three quarters of 2022, with no packaged pounds until the fourth quarter. Production ramp-up activities continued in 2024. McArthur River/Key Lake production was 15.1 million pounds in 2025, down by 25.6 per cent from 20.3 million pounds in 2024.

The Rabbit Lake mine, opened in 1975, was the longest-operating uranium mine in North America. Rabbit Lake was transitioned into a safe state of care and maintenance in 2016. In October 2023, a 15-year renewal licence was granted to Rabbit Lake, which will allow it to operate until October 2038 if it resumes operations.

Multiple exploration companies are working to develop new uranium mines in Saskatchewan. The most advanced projects are NexGen Energy’s Rook I, Denison Mines’ Wheeler River, and Paladin Energy Ltd.’s Patterson Lake South (PLS) project.

The NexGen Rook I project received the formal site preparation and construction license in March 2026 and broke ground on construction in August 2026. It is projected to take about four years to construct, and it is estimated to be a $2.2 billion investment. Once it is operational, it is anticipated to produce up to 30 million pounds annually.

The Wheeler River Project (Denison Mines) received a site preparation and construction license in February 2026. Commercial production is expected to begin by mid-2028, utilizing non-conventional mining methods resulting in lower environmental impacts.

The PLS project received provincial Environmental Assessment approval in February 2026 and is underway with CNSC licensing processes. On June 11, 2026, the CNSC provided a letter of sufficiency to Paladin for the licensing documents submitted for the project. This started the 24-month timeline in which the CNSC shall render a licensing decision.

Helium. Saskatchewan is Canada’s largest helium producer. Since 2020, Saskatchewan has moved from producing negligible amounts of helium to now providing nearly 3 per cent of global supply. Saskatchewan helium production is unique in that it involves dedicated helium production wells. This contrasts with the majority of global helium, which is a byproduct of natural gas production.

North American Helium is Saskatchewan’s largest helium producer. Additional producers include Canadian Helium and Helium Evolution. Industry has invested over $700 million into Saskatchewan’s helium sector. Saskatchewan now has 30 active producing helium wells and 9 helium purification facilities.

Saskatchewan recently moved to a competitive land tenure process for helium and natural hydrogen dispositions. The first public offering, covering over 265,000 hectares, raised over $15.9M.

Natural Hydrogen.

Natural hydrogen. Natural hydrogen is a nascent sector showing high private sector interest. If successful, natural hydrogen could be economically competitive with traditional hydrogen sources. In 2025, Max Power drilled Canada’s first dedicated natural hydrogen well in Saskatchewan, and since then has drilled an additional three wells in the province. Evaluation of these wells for their potential to produce commercial levels of natural hydrogen is ongoing.

Agriculture

Agriculture is the second largest goods-producing industry in Saskatchewan. Based on the 2021 Census of Agriculture, Saskatchewan has 34,128 farms. With slightly less than half of the total land area of the province utilized for farming, Saskatchewan has over 40% of the cultivated farmland in all of Canada.


20


Saskatchewan is famous for its crop production, with wheat, canola and durum being the province’s largest crops in terms of volume and value. Saskatchewan farmers harvested about 41.9 million tonnes of major crops in 2025, an increase of 13.7 per cent compared to the harvest in 2024.

Livestock production is also important in Saskatchewan. Approximately one-quarter of the total Canadian beef cattle herd is located in the province. Other livestock raised in Saskatchewan include hogs, sheep, lambs, poultry and dairy cattle.

CROP PRODUCTION


                                     Average  
Crop    2021      2022      2023     2024     2025     (2021-2025)  
     (metric tonnes)  

Barley

     2,499,078        3,550,934        3,226,892       3,035,313       3,522,285       3,166,900  

Canola

     6,968,814        9,923,300        10,425,800       10,454,084       12,203,632       9,995,126  

Durum

     2,416,061        4,516,489        3,393,883       4,971,666       5,393,885       4,138,397  

Flaxseed

     245,890        347,727        223,810       196,015       375,604       277,809  

Oats

     1,152,532        2,567,136        1,034,149       1,469,992       1,763,257       1,597,413  

Pulse1

     2,634,205        3,727,709        3,068,281       3,933,742       5,157,412       3,704,270  

Specialty Crops2

     166,053        258,928        231,792       316,504       316,007       257,857  

Wheat

     6,417,821        10,776,900        11,628,022       12,221,238       12,852,682       10,779,333  

Other3

     161,118        194,501        128,066       255,101       334,832       214,724  


Total4

     22,661,572        35,863,624        33,360,695       36,853,655       41,919,596       34,131,828  


Crop                  % of Total     % of Total     % of Total     % of Total  
                   Sask 2025     Sask 2021-2025     Canada 2025     Canada 2021-2025  
                   (percentage)  

Barley

           8.4 %      9.3 %      37.3 %      36.2 % 

Canola

           29.1 %      29.3 %      54.3 %      53.4 % 

Durum

           12.9 %      12.1 %      77.9 %      77.8 % 

Flaxseed

           0.9 %      0.8 %      76.0 %      77.4 % 

Oats

           4.2 %      4.7 %      43.8 %      44.3 % 

Pulse1

           12.3 %      10.9 %      63.2 %      61.3 % 

Specialty Crops2

           0.8 %      0.8 %      83.8 %      83.5 % 

Wheat

           30.7 %      31.6 %      41.3 %      38.5 % 

Other3

           0.8 %      0.6 %      1.0 %      0.9 % 


Total4

           100.0 %      100.0 %      37.3 %      35.9 % 


1 

Includes dry beans, chick peas, faba beans, lentils and peas.

2 

Includes canary seed and mustard seed.

3 

Includes buckwheat, corn for grain, hemp, mixed grains, rye, soybeans and triticale.

4 

Tame hay and silage have not been included. Components may not add due to rounding.


Sources:

Statistics Canada. Table 32-10-0359-01 Estimate areas, yield, production, ave farm price and total farm value of principal field crops

Farm revenue comprises three components: crop receipts, livestock receipts and government program payments. Total farm cash receipts reached $21.1 billion in 2025, down 1.8 per cent from 2024.


21


Saskatchewan’s 2025 realized net farm income was nearly $2.9 billion, compared to about $4.0 billion in 2024. Realized net farm income is the result of deducting farm operating expenses and depreciation cost from farm cash receipts.

The following table sets forth Saskatchewan’s farm cash receipts for the five years ending in 2025.

FARM CASH RECEIPTS


     2021      2022      2023      2024      2025      Compound
Annual
Growth Rate
2021-2025
    Share of
Total 2025
    % Change
from 2024
 
Crop Cash Receipts    (millions)                     

Wheat & Durum

   $ 4,234      $ 5,255      $ 5,752      $ 4,664      $ 5,113        4.8 %      34.5 %      9.6 % 

Canola

     6,329        6,820        7,432        7,117        6,603        1.1 %      44.5 %      (7.2 %) 

Barley

     737        766        773        549        558        (6.7 %)      3.8 %      1.6 % 

Other Crop1

     3,087        2,991        3,300        3,248        2,555        (4.6 %)      17.2 %      (21.3 %) 


Total Crop Receipts

     14,388        15,832        17,257        15,577        14,829        0.8 %      100.0 %      (4.8 %) 


Livestock Cash Receipts


Cattle & Calves

   $ 1,619      $ 1,737      $ 2,365      $ 2,749      $ 3,535        21.6 %      71.3 %      28.6 % 

Hogs

     478        515        477        535        650        8.0 %      13.1 %      21.6 % 

Other2

     603        655        697        716        774        6.4 %      15.6 %      8.1 % 


Total Livestock

     2,701        2,907        3,539        3,999        4,959        16.4 %      100.0 %      24.0 % 


Government program payments

   $ 2,203      $ 2,392      $ 1,911      $ 1,890      $ 1,289        (12.5 %)        (31.8 %) 


Total Farm Cash Receipts

   $ 19,291      $ 21,131      $ 22,708      $ 21,467      $ 21,077        2.2 %        (1.8 %) 


Realized Net Farm Income

   $ 5,094      $ 4,093      $ 5,307      $ 3,976      $ 2,936        (12.9 %)        (26.1 %) 


1 

Includes net deferments.

2 

Includes sheep, lambs, dairy products, poultry, eggs and other livestock products.


Sources:

Statistics Canada. Table 32-10-0045-01 Farm cash receipts, annual (x 1,000); and Table 32-10-0052-01 Net farm income (x 1,000)

Service Sector

The service sector contributes a substantial part of the province’s economic growth and creates the vast majority of jobs. In 2025, services accounted for 58.1 per cent of overall output and 78.0 per cent of total employment in the Province.

Of these, the biggest sector in terms of output share and employment is business, personal and community services. Output from the business, personal and community services sector accounts for more than one-fifth of the economy, while the sector accounts for slightly more than four out of every ten jobs in the Province. This sector consists of education and related services; health care institutions, including hospitals, nursing homes and welfare services; religious organizations; amusement and recreation services; business services such as management and business consultants and computer services; personal services; and accommodation and food.


22


Finance, insurance and real estate, which constitute a large component of the service-producing industries, represented 4.7 per cent of the employment in 2025. This segment includes banks and other institutions delivering financial services, insurance carriers and agencies and real estate companies.

GOVERNMENT FINANCES

Overview

The Government of Saskatchewan has general authority for the administration of provincial activities and functions within the province. Responsibility for a variety of such activities and functions has been ceded to local government bodies and agencies under the authority of numerous provincial statutes. Responsibilities of the Government not ceded to local government bodies are carried out directly by the Government and through a number of organizations and provincial Crown corporations.

The Government’s budgeting and reporting is focused on the Summary Financial Statements (SFS). This combines the General Revenue Fund (GRF), a general fund of the Government to which all public monies received are credited except where the Legislative Assembly has directed otherwise and from which funds are appropriated by the Saskatchewan Legislative Assembly, with all other organizations and provincial Crown corporations over which the Government has control.

Each year the Minister of Finance presents a budget to the Legislative Assembly that provides estimates of the Government’s planned activities during the fiscal year.

On March 18, 2026, the Minister of Finance submitted the budget for the fiscal year 2026-27, which is referred to herein as “Budget 2026-27” filed as Exhibit 99.6 to its Form 18-K/A filed with the Commission on May 15, 2026.

The accounts and financial statements of the Province are examined by the Provincial Auditor, an official appointed by the Lieutenant Governor in Council pursuant to The Provincial Auditor Act, P-30.01, who is responsible to the Legislative Assembly and is required to make a report to the Legislative Assembly with respect to each fiscal year. The financial statements of certain crown corporations and agencies are also subject to audit by the Provincial Auditor.

Specific Accounting Policies

The Province’s financial statements are prepared in accordance with Canadian public sector accounting standards issued by the Public Sector Accounting Board (“PSAB”).

The Government Reporting Entity

The Government’s budgeting and reporting are focused on the SFS, which combines the GRF, all other organizations and provincial Crown corporations over which the Government has control, and partnership arrangements.

The Government’s budgetary and reporting fiscal year begins on April 1 and ends on March 31. Adjustments are made for certain organizations within the reporting entity that have financial year-ends that differ from the Government’s fiscal year. Revenue and expenses are recorded on an accrual basis.

Principles of Consolidation

This section describes the accounting treatment for each type of entity included in the Summary Financial Statements of the Province.

A Government Service Organization is an entity that is controlled by the government but is not a Government Business Enterprise or a partnership. Government Service Organizations include government ministries, certain crown corporations, agencies, boards and commissions. Government Service Organizations


23


are consolidated after adjustment to a basis consistent with the accounting policies of the Summary Financial Statement on a line-by-line basis, and inter-organization balances and transactions are eliminated.

A Government Business Enterprise is a self-sufficient organization and has the financial and operating authority to sell goods and services to individuals and organizations outside the government reporting entity as its principal activity. Government Business Enterprises have been accounted for using the modified equity method based on their results prepared in accordance with International Financial Reporting Standards. Using this method, the Government’s investment in government business enterprises, which is initially recorded at cost, is adjusted annually to include the Government’s proportionate share of net earnings or losses and certain other net equity changes of government business enterprises without adjustment to the accounting policies applied to the General Revenue Fund and other Government Service Organizations. Except for dividends and unrealized inter-entity gains and losses, inter-entity balances and transactions are not eliminated. Net equity of Government Business Enterprises is included in the Summary Financial Statements in the Statement of Financial Position, while any net income or net loss is shown as a separate line item in the Statement of Operations. The largest Government Business Enterprises, in terms of revenues, are Saskatchewan Power Corporation and Saskatchewan Telecommunications (these are discussed further in the “Certain Crown Corporations” section of this document).

A partnership is a contractual arrangement between the government and a party or parties outside the reporting entity. The partners have clearly defined common goals, make financial investments in the partnership, share control of governance decisions, and share, on an equitable basis, the significant risks and benefits associated with the operations of the government partnership. The government’s interest in partnerships is accounted for using proportionate consolidation after adjustment to a basis consistent with the accounting policies of the Summary Financial Statements. Inter-entity balances and transactions are eliminated.

A current listing of the organizations within the summary government reporting entity is published on Schedule 19 of the Public Accounts 2025-26 Volume 1 on pages 85-87 (Exhibit 99.2).

Revenues

Revenues are recorded on an accrual basis. The main components of revenue include income and consumption taxes, non-renewable resource revenues, income from Government Business Enterprises, interest and other own-source income, and federal transfers such as the Canada Health Transfer and Canada Social Transfer.

Taxation revenue is recognized when the tax has been authorized by the legislature and the taxable event occurs (such as when taxpayers earn income, purchase products and services, or own real property). Tax concessions are recorded as a reduction in taxation revenue.

Revenues from non-renewable resources are recognized based on production, sales, or profits generated from the specific resource.

Other own source revenue is recognized when the Government has the authority to obtain the related economic benefits and is expected to do so. For transactions for which the Government is obligated to provide specific goods or services, such as fees or sales of goods, services, licenses or permits, revenue is recognized as the related performance obligation is satisfied.

Transfers from the federal government are recognized as revenue in the period the transfer is authorized and eligibility criteria are met, except when and to the extent that the transfer stipulations give rise to an obligation that meets the definition of a liability.

Expenses

Expenses are recorded on an accrual basis. The main components of expense include salaries and benefits, transfers, operating costs, financing charges, and amortization. Transfers are recognized in the period during which the transfer is authorized and any eligibility criteria are met. Provisions are recorded for losses on certain loans, investments, loan guarantees, accounts receivable and advances where there has been a loss in


24


value other than a temporary decline. Contingent liabilities are recorded when it is likely that a liability exists and the amount can be reasonably determined.

Additional accounting policies are outlined in the Notes to the Summary Financial Statements in the Public Accounts 2025-26, Volume 1 (Exhibit 99.2).

Measurement Uncertainty

Uncertainty in the determination of the amount at which an item is recorded in the Province’s Summary Financial Statements is known as measurement uncertainty. Uncertainty exists whenever estimates are used because it is reasonably possible that there could be a material difference between the recognized amount and another reasonably possible amount. Details regarding amounts recorded in the Summary Financial Statements are provided on page 55 of the Public Accounts 2025-26, Volume 1 (Exhibit 99.2).

The financial information with respect to the Province set forth herein has been derived from several sources, including the Summary Financial Statements of the Province.

Unless otherwise indicated, amounts referred to as “Estimate for the year ended March 31, 2027” have been taken from the Budget 2026-27 tabled on March 18, 2026. The Budget is prepared on the same basis as the Summary Financial Statements (reflecting the Summary entity).

Restatements

New Accounting Standards

During 2025-26, there was a change in accounting policy applied retroactively, resulting in restatement of the prior period. Details regarding prior year changes are provided in the Summary Financial Statements Note 9 of the Public Accounts 2025-26, Volume 1 on page 63 (Exhibit 99.2).

Summary of Budget Transactions and Funding Requirements

SUMMARY OF OPERATIONS AND NET FUNDING REQUIREMENTS

OF THE SUMMARY REPORTING ENTITY


     2022     2023     2024     2025     2026  
     (in millions)  

Revenues

   $ 18,136.2     $ 20,594.6     $ 20,993.0     $ 20,856.0     $ 21,133.5  


Program expenses

     18,886.3       18,197.6       19,971.2       20,154.3       21,007.7  

Debt servicing costs

     718.2       816.3       839.6       950.5       1,073.3  


Total expenses

     19,604.5       19,013.9       20,810.8       21,104.8       22,081.0  


Provincial surplus / (deficit) 1

     (1,468.3 )      1,580.7       182.2       (248.9 )      (947.5 ) 

Net funding requirements


Deficit/(Surplus)

     1,468.3       (1,580.7 )      (182.2 )      248.9       947.5  

Non-cash items 2

     1,147.9       (12.5 )      459.3       (67.2 )      8.7  


Operating requirements

     2,616.2       (1,593.3 )      277.1       181.6       956.2  

Dividends received from government business enterprises

     (665.4 )      (629.5 )      (529.0 )      (547.0 )      (554.5 ) 

Loan advances and investing, net of repayments3

     58.7       1,094.0       (187.2 )      441.8       294.5  

Net acquisitions of tangible capital assets

     940.5       952.2       1,256.5       1,606.6       1,554.3  

Sinking fund installments

     196.7       241.1       240.1       260.6       297.2  

Net refinancing transactions4

     49.9       1,392.9       1,100.2       961.3       1,280.2  


Net funding requirement

     3,196.6       1,457.5       2,157.7       2,904.9       3,827.9  

Financing of net funding requirement


Change in cash and short-term investments

     (192.7 )      (217.6 )      135.1       (553.5 )      (614.2 ) 

Debt issued (General Revenue Fund)

     3,389.3       1,675.1       2,022.7       3,458.5       4,442.2  


25


     2022      2023      2024      2025      2026  
     (in millions)  

Total

     3,196.6        1,457.5        2,157.7        2,904.9        3,827.9  


Debt issued - General Revenue Fund

     3,389.3        1,675.1        2,022.7        3,458.5        4,442.2  

Debt issued - Government Business Enterprises5

     746.4        985.2        1,072.8        1,475.2        1,940.3  


Debt issued - Summary Entity

     4,135.7        2,660.3        3,095.5        4,933.7        6,382.4  


1 

As of March 18, 2026, the Province was forecasting a deficit of $819.4 million for the 2026-27 fiscal year. This forecast was revised to a deficit of $825.2 million in the Province’s First Quarter Report issued August 27, 2026.

2 

Includes amortization of tangible capital assets, net income from government business enterprises, and other non-cash items.

3 

In 2023-24, loan advances include $300 million advanced by the General Revenue Fund to Government Business Enterprises. Any amounts owed by Government Business Enterprises to the General Revenue Fund at year end are included in Loans Receivable on Schedule 2 of Exhibit 99.2.

4 

Net refinancing transactions consist of proceeds from sinking funds and repayment of debentures and other long-term obligations.

5 

Government business enterprises are accounted for using the modified equity method; therefore, funding requirements for these entities are not included in this total.

Current year estimated borrowing is as follows:


     Budget Estimate      First Quarter Forecast  
     2027      2027  

General Revenue Fund - Operating

   $ 2,725.0      $ 2,666.5  

Saskatchewan Capital Plan

     1,300.0        1,300.0  


Government Service Organizations1

     4,025.0        3,966.5  


Government Business Enterprises1

   $ 1,310.5      $ 1,476.5  


Borrowing Requirements2

   $ 5,335.5      $ 5,443.0  


1 

Almost all borrowing is done by the General Revenue Fund. Where the GRF borrows on behalf of a government entity, the entity is responsible for the principal and interest payments on this debt.

2 

The GRF’s 2026-27 borrowing requirements at Budget were estimated to be $5,335.5 million. Of this amount, $1,683.7 million was to refinance existing debt and $3,651.8 million was to assist with operating and financing capital expenditures. At First Quarter, the borrowing requirements were forecast to be $5,443.0 million, which is $107.5 million higher than budget primarily due to the increase in borrowing for SaskPower.

Revenue

Introduction

The Government receives revenue from taxes, non-renewable resources, other provincial sources, transfers from the federal government and net income from Government Business Enterprises. The following table provides a breakdown of revenue by major source, as described in the “Government Finance – Specific Accounting Policies” above, for the five fiscal years ended March 31, 2026, and the Budget Estimate for fiscal year 2026-27. Discussion regarding revenue outlook for the 2026-27 Budget can be found on pages 15-21 of Exhibit 99.5 in the Form 18-K/A filed with the Commission on May 15, 2026.

SUMMARY REVENUE


26


     Fiscal Year Ended March 31  
                                        Budget  
                                 Actual      Estimate1  
     2022      2023      2024      2025      2026      2027  
     (thousands of dollars)  

Taxation


Personal income

   $ 2,880,468      $ 3,151,505      $ 3,303,775      $ 3,349,463      $ 3,351,123      $ 3,432,100  

Provincial sales

     2,383,003        2,721,906        2,894,320        3,139,561        3,295,158        3,548,700  

Corporation income

     1,007,821        1,988,552        2,507,176        1,439,549        1,680,705        1,649,400  

Property

     763,791        775,267        795,477        807,772        808,716        826,700  

Fuel

     494,657        473,594        475,340        497,029        497,558        512,400  

Other

     672,523        700,971        675,426        689,583        702,540        723,900  


Total Taxation

   $  8,202,263      $  9,811,795      $  10,651,514      $  9,922,957      $ 10,335,800      $    10,693,200  


Non-renewable resources


Oil and natural gas

   $ 1,009,656      $ 1,129,378      $ 981,147      $ 1,151,637      $ 869,043      $ 721,000  

Resource surcharge

     539,770        902,145        516,854        529,503        586,181        524,000  

Potash

     1,266,848        2,403,921        754,903        604,095        914,523        940,900  

Uranium

     —         —         —         —         255,550        275,800  

Other

     103,725        167,689        196,247        288,422        107,099        105,800  


Total non-renewable resources

   $ 2,919,999      $ 4,603,133      $ 2,449,151      $ 2,573,657      $ 2,732,396      $ 2,567,500  


Other own-source revenue


Fees


Health care

   $ 267,700      $ 280,000      $ 356,000      $ 345,000      $ 386,000        incl. in below  

Motor vehicle licensing

     206,600        211,100        287,000        218,000        223,000        incl. in below  

Education

     142,300        170,800        203,000        241,000        248,000        incl. in below  

Subsidized housing rental

     108,000        116,600        111,000        126,000        129,000        incl. in below  

Real property sales and leases

     94,700        102,500        92,000        89,000        91,000        incl. in below  

Other

     385,948        430,545        420,429        416,895        421,659      $ 1,458,200  

Insurance

     743,645        486,775        498,138        555,572        545,456        513,000  

Output-Based Performance Standards

     —         —         458,916        362,817        489,163        110,100  

Investment income

     93,168        164,587        268,370        370,502        324,955        516,700  

Transfers from other governments

     88,588        80,708        84,675        81,651        83,341        73,500  

Miscellaneous

     586,475        529,247        577,676        976,050        590,944        674,200  


Total Other own-source revenue

   $ 2,717,124      $ 2,572,862      $ 3,357,204      $ 3,782,487      $ 3,532,518      $ 3,345,700  


Transfers from the federal government


Canada Health Transfer

   $ 1,331,290      $ 1,389,136      $ 1,469,624      $ 1,563,639      $ 1,673,722      $ 1,756,700  

Canada Social Transfer

     477,679        490,023        488,141        508,014        533,364        548,800  

Crop insurance contributions

     267,900        413,200        425,000        476,000        464,000        incl. in below  

Early learning and child care

     68,500        193,800        231,000        316,000        319,000        incl. in below  

Labour market initiatives

     104,000        89,200        80,000        66,000        68,000        incl. in below  

Agricultural income stability

     242,900        70,600        231,000        163,000        264,000        incl. in below  

Infrastructure

     248,800        178,400        228,000        196,000        126,000        incl. in below  

Other

     718,065        532,206        480,988        503,640        547,263        1,862,100  


Total Transfers from the federal government

   $ 3,459,134      $ 3,356,565      $ 3,633,753      $ 3,792,293      $ 3,995,349      $ 4,167,600  


Net income from government business enterprises

     837,651        250,246        901,423        784,591        537,485        642,900  


27


     Fiscal Year Ended March 31  
                                        Budget  
                                 Actual      Estimate1  
     2022      2023      2024      2025      2026      2027  
     (thousands of dollars)  

Total Revenue

   $ 18,136,171      $ 20,594,601      $ 20,993,045      $ 20,855,985      $ 21,133,548      $    21,416,900  


1 

Budget estimates do not provide the same level of detail as is available for actuals.

First Quarter Update

On August 27, 2026, the Province released its First Quarter Financial Report. Revenue update for the first quarter can be found on pages 1-3 of Exhibit 99.3.

Taxation

Revenue from taxation includes personal and corporate income taxes, provincial sales tax, tobacco and vapour products tax, fuel tax and other taxes, including liquor consumption, corporate capital and insurance premiums taxes as well as education property taxes.

Saskatchewan has a tax on income system for personal income tax. The Provincial tax on income is calculated on federally defined taxable income and consists of three income tax brackets. Recent personal income tax rates are displayed in the table below:


 2026 Saskatchewan’s Personal Income Tax Rates 
10.5% on first $54,532
12% on next $101,273
14.5% on any remainder

Saskatchewan also taxes corporate income. The Province’s portion of the general corporate tax rate is 12 per cent, with a reduced tax rate of 10 per cent applied to taxable income related to manufacturing and production (M&P). Corporations involved with M&P activities receive a tax reduction of up to 2.0 per cent, depending on the extent of the company’s presence in the province. A small business rate of 1.0 per cent is applied to the first $600,000 of active business income for Canadian Controlled Private Corporations that have taxable capital of less than $10 million. In December 2024, The Saskatchewan Affordability Act permanently changed the small business tax rate to 1.0 per cent. Recent changes in the corporate income tax rates are displayed in the table below:


Saskatchewan’s Corporation Income Tax Rates

 
     Jan. 1, 2018 to
Sept. 30, 2020
    Oct. 1, 2020 to
June 30, 2023
    July 1, 2023
and onward
 

General

     12 %      12 %      12 % 

M&P Profits

     10 %      10 %      10 % 

Small Business

     2 %      0 %      1 % 

Small Business Threshold

   $ 600,000     $ 600,000     $ 600,000  

Provincial corporate and individual tax is collected by the federal government through the Canada-Saskatchewan Tax Collection Agreement. Because the assessments of these taxes are not finalized until after the end of the taxation year, the federal government estimates the tax and remits this amount to the Province in regular instalment payments throughout the fiscal year. In 2023, Bill 122, The Saskatchewan Revenue Agency Act (the “Act”), was passed to lay the groundwork for the potential establishment of The Saskatchewan Revenue Agency, a new Treasury Board Crown corporation. The intent is that, in the future, this corporation would be responsible for administering taxes and related programs in Saskatchewan, including control of the provincial portion of the corporate income tax system from the federal government. The Act is not currently in force.


28


Saskatchewan Provincial Sales Tax (PST) is a consumption tax that applies at a rate of 6.0 per cent (increased from 5.0 per cent in March of 2017) on the purchase of tangible personal property and certain services consumed or used in Saskatchewan. Certain goods, including basic groceries and agricultural equipment along with certain services such as daycare and healthcare, are exempt from the PST. The Province provides consumer rebates on new home construction as well as a rebate to low-income consumers by way of an individual tax credit.

Non-Renewable Resources

Non-renewable resource revenue is collected by the Government in respect of the production and sale of crude oil, natural gas, potash, uranium, other minerals, as well as the sale of Crown petroleum and natural gas rights (Crown land sales).

The Province levies a Crown royalty on oil and natural gas produced from Crown lands and a production tax on oil and natural gas produced from freehold lands. Crown lands account for approximately two-thirds of oil production in Saskatchewan.

The Province levies a Crown royalty on potash produced from Crown lands and a production tax on potash produced from both Crown and freehold lands which are composed of a base payment and a profit tax component pursuant to The Mineral Taxation Act, 1983 and The Potash Production Tax Regulations.

A resource surcharge is also levied on the value of sales of oil, natural gas, potash, uranium and coal produced in the Province. The surcharge rate is three per cent for potash, uranium and coal, and for oil and natural gas from wells drilled before October 1, 2002. For oil and natural gas from wells drilled after September 30, 2002, the surcharge rate is one point seven per cent.

Other Own-Source

Other Own-Source revenue includes health care fees, crop insurance premiums, education fees, investment income, subsidized housing rental fees, motor vehicle licensing fees and other miscellaneous revenues.

Transfers from the Federal Government

Transfers from the Government of Canada consist of payments made to the Province to support a number of programs. The two major federal transfers to the Province are the Canada Health Transfer (“CHT”) and the Canada Social Transfer (“CST”).

CHT and CST: The CHT and the CST are the Federal Government’s contributions to the Province in respect of its health care, post-secondary education, childcare, and social service programs. These federal transfers are determined via an equal per capital cash allocation and do not bear a direct relationship to actual program costs. Annual changes to Saskatchewan’s allocation depend on the growth of the total federal funding envelope combined with changes to Saskatchewan’s share of the national population as reported by Statistics Canada.

From 2004-05 through 2016-17, the total CHT funding envelope grew by 6% per year. Beginning in 2017-18, the CHT grows at the 3-year average rate of nominal GDP growth, subject to a minimum growth rate of 3% annually. However, from 2023-24 to 2027-28, the minimum CHT growth will be 5% per year, due to a temporary post-pandemic increase in federal health funding. Additionally, as part of the temporary increase in funding, the federal government offered supplemental funding streams that are targeted to specific areas of health (e.g. long-term care). The CST funding envelope grows at a static 3% per year.

In 2026-27, the federal funding allocated to Saskatchewan under the CHT is $1,756.7 million and $548.8 million is allocated to Saskatchewan under the CST. There is also $167.8 million provided to the Province under two health-related bilateral agreements.

Equalization: Equalization is a federal expenditure program that provides unconditional payments to provinces with below-average revenue-raising capacities (fiscal capacities), according to a federal formula. The


29


Constitution states that “Parliament and the Government of Canada are committed to the principle of making Equalization payments to ensure that provincial governments have sufficient revenues to provide reasonably comparable levels of public services at reasonably comparable levels of taxation.”

Prior to 2008, Saskatchewan qualified for an Equalization payment in all but seven years from program inception in 1957-58 through to 2007-08. Due to a strong economy relative to other Canadian jurisdictions combined with reforms to the Equalization program introduced in the 2007 federal budget, Saskatchewan has not qualified for an Equalization payment since 2007-08.

Fiscal Stabilization: The Federal Government provides provinces with the Fiscal Stabilization Program (FSP) under the Federal-Provincial Fiscal Arrangements Act. This legislation provides for federal grants and interest-free loans to provinces that suffer extraordinary declines in their own-source revenues resulting from economic shocks or downturns.

There are two ways in which a province can qualify for a stabilization payment from the Federal Government: (1) a 50 per cent year-over-year decline in resource revenues, net of any offsetting year-over-year increase in non-resource revenues, or (2) a 5 per cent year-over-year decline in non-resource revenues, net of any offsetting year-over-year increase in resource revenues. These eligibility criteria are difficult to achieve and qualification for the program is relatively rare.

Qualifying revenues are calculated in detail according to the provisions of the Federal-Provincial Fiscal Arrangements Regulations, 2007. The payment limit under the FSP was increased to $170 per capita (for 2019-20 and 2020-21 claims) and is now indexed to annual Canadian per capita economic growth.

Saskatchewan has qualified for this program only one time, in 2016-17 when non-resource revenues declined by 5.6 per cent. Prior to that claim, Saskatchewan was the only province that had never received a stabilization payment. High revenue growth during the recovery from the pandemic has prevented Saskatchewan from qualifying for the program in recent years, and it is unlikely that Saskatchewan will qualify for the program in the near future.

Net income from Government Business Enterprises

Government Business Enterprises (GBEs) are self-sufficient government organizations whose principal activity is the sale of goods and services to individuals and organizations outside of the Government Reporting Entity. GBEs include SaskPower, SaskTel, SaskEnergy, and Saskatchewan Government Insurance. Budget amounts for GBEs are incorporated as a single amount using the modified equity method, which includes the Government of Saskatchewan’s proportionate share of net earnings or losses.

For additional information regarding income from GBEs, see “Certain Crown Corporations.”

Program Expenditures / Expenses

Introduction

The following table provides a breakdown of the expenses related to government programs and services for the five fiscal years ended March 31, 2026, and includes the Budget Estimate for fiscal year 2026-27. Discussion regarding expense outlook for the 2026-27 Budget can be found on pages 22-28 of Exhibit 99.5 in the Form 18-K/A filed with the Commission on May 15, 2026.


30


     Fiscal Year Ended March 31  
                                           
                                        Budget  
                                 Actual      Estimate1  
     2022      2023      2024      2025      2026      2027  
     (thousands of dollars)  

Agriculture

   $ 3,194,351      $ 1,835,020      $ 2,503,867      $ 1,762,572      $ 1,241,322      $ 1,687,100  

Community development

     682,889        758,161        875,135        828,439        814,768        902,000  

Economic development

     520,774        733,943        370,284        361,708        527,353        548,800  

Education

     3,685,349        3,792,179        4,243,326        4,374,753        4,527,619        4,649,300  

Environment and natural resources

     403,120        352,956        330,359        553,361        421,845        247,700  

Financing charges

     718,206        816,252        839,596        950,540        1,073,298        1,219,100  

General government

     463,599        512,045        563,077        589,948        684,892        716,100  

Health

     6,882,972        7,010,107        7,676,751        8,009,546        8,671,557        8,420,600  

Protection of persons and property

     961,343        988,625        1,073,692        1,166,715        1,499,352        1,168,000  

Social services and assistance

     1,458,370        1,587,321        1,685,105        1,807,088        1,896,213        1,929,300  

Transportation

     633,494        627,256        649,648        700,179        722,791        748,300  


Total Expense

   $ 19,604,467      $ 19,013,865      $ 20,810,840      $ 21,104,849      $ 22,081,010      $ 22,236,300  


1 

Budget estimates do not provide the same level of detail as is available for actuals and totals may not add due to rounding.

First Quarter Update

On August 27, 2026, the Province released its First Quarter Financial Report. An expense update for the first quarter can be found on pages 1-2 of Exhibit 99.3.

Agriculture

The agriculture theme includes expenses to assist and improve the agriculture and food industry through development activities including research, education, regulation and investment in the sector as well as providing direct support to producers through income stabilization and insurance programs.

The most significant component of Agriculture expense relates to the Saskatchewan Crop Insurance Corporation. Saskatchewan Crop Insurance Corporation (“SCIC”) is jointly funded by producers and the federal and provincial governments to provide production insurance to Saskatchewan producers. The federal government must agree to any changes as a condition of providing its share of funding. Crop Insurance premiums are shared between producers (40 per cent), the federal government (36 per cent), and Saskatchewan (24 per cent). Administration costs are shared between the federal government (60 per cent) and Saskatchewan (40 per cent). Producers may choose coverage levels of 50, 60, 70, or 80 per cent of their average yield.

The Crop Insurance Program is updated annually to ensure that it continues to meet the risk management needs of Saskatchewan producers. Premium rates and long-term average yields are adjusted to ensure the program remains actuarially sound. Insured prices are set annually to reflect the forecast market value for each crop.

Premium costs are set with the goal of collecting the correct amount of premiums to recover losses over the long term and maintain a sustainable program. However, as payouts are driven by the weather, there can be significant year-to-year variability.

If premiums do not cover indemnities in a given year, SCIC is required to draw down on the reserves available to it in the Crop Insurance Fund and Reinsurance Funds, which are funded by the cumulative premium surplus less past indemnity payments. When these Funds are drawn down, higher premiums are charged in future years to maintain a cushion for future liabilities and to repay any Reinsurance Fund debt. In addition to


31


the public reinsurance funds, SCIC purchases private reinsurance to stabilize premiums following years with high losses to protect both the program and producers.

AgriStability is a business risk management program designed to help farm operations facing substantial margin declines caused by production loss, increased costs or market conditions. Coverage is calculated using each participant’s historical tax and supplemental information. Costs of AgriStability are shared by the federal and provincial governments on a 60/40 basis.

Community Development

The community development theme includes expenses to maintain and develop engaged and vibrant communities, including financial assistance and infrastructure funding to local governments and other authorities, which in turn provide community services. Community development also includes funding directed to specific community services such as sport, culture, arts, and heritage that improve quality of life.

Economic Development

The economic development theme includes expenses to strengthen, expand and diversify Saskatchewan’s economy as well as to promote trade and growth in export markets. The expense arises from activities such as research, marketing, product development, financing, financial assistance, technology and infrastructure. Economic development also includes the strategic management of Saskatchewan’s non-renewable resources to support future economic activity.

Education

The education theme includes expenses to develop and maintain a quality pre-kindergarten through post-secondary education system, designed to impart knowledge and information, including activities that encourage ongoing learning and the acquisition of specialized skills, providing supports to help students be successful. The education theme also includes funding for early learning and childcare.

Education is the second largest expense of Province, constituting 21.0 per cent of 2026-27 budgeted expenses. The most significant components of Education expense are portions of the Ministries of Advanced Education (responsible for post-secondary education support) and the Boards of Education (responsible for elementary and secondary education support).

Environment and Natural Resources

The environment and natural resources theme includes expenses to protect and improve the quality of the environment through the management of fish, wildlife, forests and land, recycling, and the prevention and clean-up of environmental hazards.

Financing Charges

The financing charges theme includes expenses associated with general debt including interest, foreign exchange gains and losses, discounts and premiums, fees and commissions. It also includes financing costs related to pension and other employee future benefits liabilities, obligations under long-term financing arrangements such as public-private partnerships and capital lease obligations. Please refer to “Pension Funds” for additional information pertaining to the pension liability and related interest expense.

General Government (formerly Other)

The general government theme includes expenses for centralized government services including: government contributions to and management of employee benefit plans; property, vehicle and information technology management; the collection of government revenues; the formation of budgetary policy; the preparation and audit of the Government’s public accounts; and the constitutional, political and law enactment aspect of the Government.


32


Health

Health is the largest expense of the Province, constituting 38.0 per cent of 2026-27 budgeted expenses. Health expense primarily includes the delivery of health services through acute, emergency, rehabilitative, long-term, community-based, and home-based care; cancer prevention, diagnosis and treatment programs; the prevention and control of infectious diseases; the subsidization of prescription drugs; and the education and promotion of healthy lifestyles.

The provinces administer and deliver most of Canada’s health care services, with all provincial and territorial health insurance plans expected to meet national principles set out under the Canada Health Act. Each provincial and territorial health insurance plan covers medically necessary hospital and doctors’ services that are provided on a pre-paid basis, without direct charges at the point of service. The provincial and territorial governments fund these services with assistance from federal cash and tax transfers.

Protection of Persons and Property

The protection of persons and property theme includes expenses to promote and ensure the security, safety and protection of residents and property, which is mainly achieved through a fair justice system, policing programs and supervision and rehabilitation services for offenders. Protection of persons and property also includes services that promote, support and enforce safe work practices and employment standards; provincial emergency management through 911 services, public safety, and disaster assistance and wildfire management; and victims’ services.

Social Services and Assistance

The social services and assistance theme includes expenses to provide financial assistance and services to individuals and families in need because of poverty, abuse, neglect and disability. This includes income support programs, accessible and safe housing, child protection services, adoption services and providing life’s needs to persons with intellectual disabilities.

Transportation

The transportation theme includes expenses for the development, construction and maintenance of an integrated provincial transportation system using highways, rural roads, bridges, ferry crossings, airstrips and communication networks.

Loans and Investments

The following table sets forth the balances of loans and investments of the Province for the Summary Entity, net of allowances for uncollectible amounts adopting the accounting policies described in “Government Finance – Specific Accounting Policies” above. Government Business Enterprises are discussed further in the “Certain Crown Corporations” section below.

LOANS AND INVESTMENTS FOR SUMMARY ENTITY


     As at March 31, 2026  
     (millions of dollars)  
     Gross      Provisions      Net  

Loans Receivable


Student Loans, direct lending

   $ 601.1      $  134.6      $ 466.5  

Loans to Government Business Enterprises

     899.5        —         899.5  

Other

     1.3        1.0        0.3  


   $   1,501.9      $ 135.6      $   1,366.3  


33


     As at March 31, 2026  
     (millions of dollars)  
     Gross      Provisions      Net  

Investments in Government Business Enterprises


SaskEnergy Incorporated

   $ 1,357.9      $ —       $ 1,357.9  

Saskatchewan Power Corporation

     2,920.2        —         2,920.2  

Saskatchewan Telecommunications Holding Corporation

     1,405.7        —         1,405.7  

Saskatchewan Water Corporation

     90.8        —         90.8  

Saskatchewan Government Insurance

     745.6        —         745.6  

Saskatchewan Auto Fund

     633.6        —         633.6  

Workers Compensation Board

     683.9        —         683.9  

Municipal Financing Corporation of Saskatchewan

     20.3        —         20.3  

Lotteries and Gaming Saskatchewan

     173.9        —         173.9  

Adjustment

     48.3        —         48.3  


   $ 8,080.2      $ —       $ 8,080.2  


Portfolio Investments1

   $ 1,788.6      $ —       $ 1,788.6  


Total Loans and Investments

   $  11,370.7      $  135.6      $  11,235.1  


1 

Details of portfolio investments are provided in Schedule 5 (page 70) of the Summary Financial Statements of the Public Accounts 2025-26, Volume 1 (Exhibit 99.2).

PROVINCIAL DEBT

Funded Debt of the Province

Saskatchewan’s financing activities involve the raising of funds through the issue and sale of Province of Saskatchewan debt securities, loans from financial institutions, and changes in deposits held. Funds raised are used to assist in the financing of the capital budgets of, and to provide a temporary credit facility for, general government purposes, Crown corporations and other entities over which the Government has control. Crown corporations are responsible for reimbursing the General Revenue Fund for the costs of servicing the interest and principal associated with debt borrowed on their behalf. In addition to direct borrowing in the name of the Province, the Government provides loan guarantees for purposes such as agriculture and special investment programs.

The following table sets forth the funded debt of the Province for the Summary Entity as described in “Government Finance – Specific Accounting Policies” above, outstanding at March 31 for five fiscal years ending March 31, 2026, each as audited under the Province’s accounting policies in effect at the time.

FUNDED DEBT FOR THE PROVINCE OF SASKATCHEWAN 1


     2022      2023      2024      2025      2026  
     (millions of dollars unless otherwise indicated)  

Gross Direct Funded Debt


Government Services Organization (GSO) General

   $ 19,013.5      $ 19,175.8      $ 20,178.7      $ 22,686.6      $ 26,024.7  

Government Business Enterprise (GBE) Specific

     10,657.3        11,306.5        12,008.3        12,919.8        14,446.0  


   $ 29,670.8      $ 30,482.3      $ 32,187.0      $ 35,606.4      $ 40,470.8  


Sinking Funds


Government Services Organization (GSO) General

   $ 1,405.3      $ 1,491.1      $ 1,749.9      $ 2,002.0      $ 2,373.6  

Government Business Enterprise (GBE) Specific

     1,028.5        1,054.9        1,175.0        1,311.4        1,363.1  


   $ 2,433.8      $ 2,546.0      $ 2,924.8      $ 3,313.4      $ 3,736.6  


34


     2022     2023     2024     2025     2026  
     (millions of dollars unless otherwise indicated)  

Gross Debt Raised for the purpose of:2


General Revenue Fund Operating

   $ 9,914.8     $ 8,451.9     $ 7,463.8     $ 7,463.8     $ 8,922.4  

General Revenue Fund Capital

     8,504.3       9,771.1       11,491.1       14,021.8       15,926.3  


Total General Revenue Fund

   $ 18,419.1     $ 18,223.0     $ 18,954.9     $ 21,485.6     $ 24,848.7  

Saskatchewan Power Corporation

     7,055.5       7,940.3       8,655.1       9,389.1       10,645.4  

SaskEnergy Incorporated

     1,872.5       1,946.4       2,005.4       2,042.9       2,231.4  

Saskatchewan Telecommunications Holding Corporation

     1,532.5       1,626.7       1,789.8       1,944.0       2,059.1  

Municipal Financing Corporation of Saskatchewan

     293.6       288.1       344.2       359.2       354.2  

Lotteries and Gaming Saskatchewan

     0.0       0.0       77.1       48.3       18.8  

Saskatchewan Liquor and Gaming Authority

     89.8       84.0       0.0       0.0       0.0  

Saskatchewan Water Corporation

     88.4       95.9       111.8       111.4       112.1  

Miscellaneous Summary Entities

     319.4       277.9       248.8       226.0       201.0  


   $ 29,670.8     $ 30,482.3     $ 32,187.0     $ 35,606.4     $ 40,470.8  


Government Services Organization (GSO) General


Per Capita ($)3

   $ 16,202.9     $ 15,958.3     $ 16,291.7     $ 17,940.6     $ 20,555.2  

As a Percentage of:


Household Income4

     22.26 %      22.25 %      23.71 %      26.44 %      N/A  

Gross Domestic Product at Market Prices5

     26.60 %      24.37 %      24.90 %      27.15 %      30.47 % 

Government Business Enterprise (GBE) Specific


Per Capita ($)3

   $ 9,081.9     $ 9,409.3     $ 9,695.1     $ 10,217.0     $ 11,409.9  

As a Percentage of:


Household Income4

     12.48 %      13.12 %      14.11 %      15.06 %      N/A  

Gross Domestic Product at Market Prices5

     14.91 %      14.37 %      14.82 %      15.46 %      16.92 % 

Total Funded Debt


Per Capita ($)3

   $ 25,284.9     $ 25,367.6     $ 25,986.8     $ 28,157.6     $ 31,965.1  

As a Percentage of:


Household Income4

     34.74 %      35.36 %      37.82 %      41.50 %      N/A  

Gross Domestic Product at Market Prices5

     41.51 %      38.73 %      39.72 %      42.61 %      47.39 % 
 
1 

Debt repayable in foreign currency has been restated in Canadian dollar equivalents based on the exchange rate in effect when the loans and swaps were entered into.

2

Internal funded debt consists of the portion of total debt that has been borrowed for and allocated to other Summary entities, primarily Crown corporations.

3

Debt per capita is calculated by dividing debt at March 31st by the Province’s population at that same date each calendar year.

4

Debt as a percentage of Household Income is calculated by dividing the debt at March 31st by the Province’s Household Income for the previous calendar year. Prior year household income data has been revised using 2024 constant dollars as updated by Statistics Canada.

5

Debt as a percentage of Gross Domestic Product at Market Prices is calculated by dividing the debt at March 31st

by the Province’s Gross Domestic Product at Market Prices for the previous calendar year.

Note: N/A = not available

Approximately 36 per cent of the gross debt at March 31, 2026, was incurred for Government Business Enterprises, leaving approximately 64 per cent of the Summary Financial Statement gross debt at


35


March 31, 2026, incurred for general government purposes. The increase in general debt is primarily attributable to the Province’s capital plan spending and to fund the current year deficit.

During fiscal year 2026, the Government issued and sold $5,702.4 million in debentures and $680.9 million of other loans. Of this total ($6,383.3 million), $4,442.2 million was issued for general purposes, and $1,941.1 million was issued for government business enterprises and miscellaneous summary entities.

During the same period, debentures with a value of $1,429.7 million and other loans with a net value of $89.3 million were redeemed. Of the total amount ($1,519.0 million), $1,104.1 million was for general purposes, and $414.9 million pertained to government business enterprises.

The Government’s sinking funds totalled $3,736.6 million at March 31, 2026. Contributions to the Government’s sinking funds amounted to $423.7 million in fiscal year 2026 with redemptions of $113.3 million.

The following table breakdowns the Sinking Fund balances at March 31 for five fiscal years ending March 31, 2026, each as audited under the Province’s accounting policies in effect at the time.

SINKING FUND INVESTMENTS


     2022      2023      2024      2025      2026  
     (millions of dollars)  

Sinking Funds1


Government Services Organization (GSO) General

   $ 1,405.3      $ 1,491.1      $ 1,749.9      $ 2,002.0      $ 2,373.6  

Government Business Enterprise (GBE) Specific

     1,028.5        1,054.9        1,175.0        1,311.4        1,363.1  


   $ 2,433.8      $ 2,546.0      $ 2,924.9      $ 3,313.4      $ 3,736.7  


1 

Totals may not add due to rounding.

The following table sets forth the Summary Financial Statement gross debt characteristics at March 31, 2026.

GROSS DEBT CHARACTERISTICS


     Percentage
of Total
   

Weighted Average

Term to Maturity1
(years)

     Weighted Average
Interest Rate1
 

Debentures2

     94 %      14.2        3.6 % 

Canada Pension Plan Debentures3

     1 %      10.9        3.6 % 

Promissory Notes

     5 %      0.2        2.3 % 

Other Loans

     0 %      — 4       — 4 


Gross Debt

     100 %      13.5        3.5 % 


1 

Weighted by the total principal amount of each loan issue.

2 

Includes all public and private debentures issued by the GRF other than those issued to the Canada Pension Plan.

3

The Canada Pension Plan (CPP) is a compulsory national pension plan in which residents of all provinces, except Quebec, participate. Provincial securities sold to the CPP prior to July 1, 2005, are payable 20 years after


36


  their respective dates of issue. Effective July 1, 2005, no new loan capital is available to provinces. However, provinces are permitted to roll over maturing securities and may choose the term of the new securities within the parameters of not less than five years and not more than 30 years. The securities are not negotiable, not transferable or assignable, but are redeemable in whole or in part before maturity at the option of the Minister of Finance of Canada, on six months’ prior notice when he deems it necessary in order to meet the requirements of the Canada Pension Plan or at the option of the Province with at least one month prior notice to the Minister of Finance of Canada.
4 

Not calculated.

Guaranteed Debt

The following table sets forth guaranteed debt for the five fiscal years ended March 31, 2026.

GUARANTEED DEBT


     2022      2023      2024      2025      2026  
     (millions of dollars)  

Guaranteed Debt

   $ 0.3      $ 0.2      $ 0.2      $ 0.2      $ 7.2  


The majority of guaranteed debt consists of guarantees pertaining to Saskatchewan Indigenous Investment Finance Corporation.

Authority for the Government to guarantee the debt of others must be provided in specific legislation since no general statutory authority exists. The Financial Administration Act, 1993 provides that no department, board, commission or agent of the Government shall provide a guarantee or a program of guarantees of loans or other liabilities by which guarantee or program of guarantees the Government of Saskatchewan would be liable to make any payment with respect to the loans or liabilities, unless the guarantee or program of guarantees, as the case may be, has received the prior approval of the Minister of Finance. Certain Crown corporations are separately authorized to provide guarantees of the debt of others.

The Government of Saskatchewan provided Royal Trust with a guarantee and indemnity in 1983 respecting the liability and obligations of CIC Mineral Interest Corporation pursuant to each of two lease agreements of CIC Mining Corporation (previously the Potash Corporation of Saskatchewan Mining Limited) for the purchase of mining equipment. The Government has been released from all such guarantees but remains contingently liable for indemnity related to damages caused by the equipment and provisions governing the payment of taxes for the period during which its guarantees to Royal Trust were in place.

The Saskatchewan Indigenous Investment Financing Corporation (SIIFC), a Crown Corporation operating under The Saskatchewan Indigenous Investment Finance Corporations Act was established to provide loan guarantees to Indigenous communities or organizations to contribute directly to long-term, sustainable growth of Saskatchewan’s natural resources and value-added agriculture economy and related infrastructure. The SIIFC may guarantee approved loans up to $75 million.

In June of 2024, SIIFC announced that it would provide an aggregate amount of up to $100 million in loan guarantees to six Indigenous partners to support their investment in Enbridge’s new renewable wind energy project southeast of Weyburn, Saskatchewan. The partners would receive an aggregate amount of up to $100 million in loan guarantees from SIIFC to support acquiring at least 30 per cent equity in the project. As of March 31, 2026, $7.0 million in loan guarantees have been issued by SIIFC. The current year budget and first quarter forecast anticipates that SIIFC will have guaranteed an estimated $75 million in loans by March 31, 2027.

Derivative Financial Instruments


37


The Province is party to financial instruments, either to hedge against the risks associated with fluctuations in foreign exchange rates or to manage risks associated with interest rate fluctuations. Foreign currency contracts are used by the Province to convert the liability for foreign currency borrowing and associated costs into Canadian dollars. The Province uses interest rate swap contracts to convert certain interest payments from floating interest rates to fixed interest rates.

The Ministry of Finance’s general policy is to enter into derivative transactions with creditworthy counterparties that meet established risk management criteria.

Details of the Province’s floating rate debt and swap contracts are provided in the Summary Financial Statements Note 4 of the Public Accounts 2025-26, Volume 1 on pages 55-56 (Exhibit 99.2).

Debt Maturities and Sinking Funds

The following table sets forth the debt maturity schedule, by principal amount and currency of payment, of the Government’s gross debt and related sinking fund balances at March 31, 2026.

DEBT MATURITY SCHEDULES


Fiscal Year    Canadian      Sinking Fund  

ending March 31

   Dollar Debt1      Balances  
     (Thousands)      (Thousands)  

2027

   $ 3,549,371      $ 251,385  

2028

     2,282,323        131,893  

2029

     1,723,087        173,164  

2030

     1,733,610        237,848  

2031

     1,428,982        303,576  


1 - 5 years

   $ 10,717,373      $ 1,097,866  

2032-2036

     10,865,610        520,104  

2037-2041

     2,229,490        398,923  

2042-2046

     2,618,505        720,158  

2047-2051

     7,004,780        635,121  

2052-2056

     4,325,000        253,840  

After 2056

     2,710,000        110,623  


   $ 40,470,757      $ 3,736,633  


1 

For amounts issued initially in foreign currency, the table incorporates the Canadian dollar equivalents based on the exchange rate in effect when the loans and swaps were entered into.

2 

Sinking fund balances reflects existing funds only and excludes planned future contributions.

Sinking funds are maintained by the Province and certain Crown Corporations for the orderly retirement of a portion of debt. Current regulation requires that a minimum of 1.0 per cent of the face value of issued debt be contributed annually where the debt carries a term of 10 years or more. Additionally, for any debt carrying a term of 10 years or more that is issued specifically for capital spending under the Saskatchewan Capital Plan, a minimum of 2.0 per cent annual contribution is required.

Funds contributed are managed according to approved investment policies. Currently, the Province’s sinking fund is invested in securities issued by the Government of Canada, Canadian provinces, Canadian municipalities, and public pension asset managers.


38


Other Debt and Liabilities

The following table sets forth the amount of unfunded debt of the Summary Entity (as described in “Government Finance – Specific Accounting Policies” above) for the five fiscal years ending March 31, 2026.

OTHER DEBT & LIABILITIES OF THE SUMMARY ENTITY


     Fiscal years Ended March 31  
     2022      2023      2024      2025      2026  
     (millions of dollars)  

Accounts Payable & Accrued Liabilities

   $ 3,156.4      $ 3,467.9      $ 4,196.5      $ 4,409.0      $ 4,783.9  

Unearned Revenue

     437.4        292.2        382.8        377.9        384.9  

Obligations under long-term financing arrangements

     1,407.4        1,373.1        1,099.3        1,079.1        1,053.3  

Other liabilities

     515.3        552.8        313.5        302.6        308.6  


   $ 5,516.5      $ 5,686.0      $ 5,992.2      $ 6,168.6      $ 6,530.8  


Note: The above listing does not include any amount related to pension liabilities and derivative liabilities.

Debt Record

The Government has always paid the full face amount of the principal of and interest on every direct obligation issued by it and every indirect obligation on which it has been required to meet its guarantee, all promptly when due in the lawful currency of the country where payable at the time of payment thereof, subject during wartime to any applicable laws and regulations forbidding trading with the enemy.

Other Public Sector Debt

The Summary Financial Statements do not disclose the debt of all public entities located within the Province. Responsibility for a variety of provincial functions and powers has been transferred to municipalities and certain other local authorities. Other local bodies raise money for their purposes, in the case of municipalities by way of direct levy on persons or property within their jurisdiction or, in other cases, by requisition on municipalities, and may have the power to borrow money, subject to the approval of the Saskatchewan Municipal Board. The Saskatchewan Municipal Board is an autonomous regulatory body established by Provincial statute with broad powers to regulate local government activity.

Notwithstanding that significant financial assistance for operating and capital expenditures is made available to local government bodies by appropriation of the Legislative Assembly, the activities of local government bodies, including borrowing, are conducted independently of the Government. The Government is not directly or contingently liable for debt incurred by these bodies, and, relative to the gross debt of the Summary Financial Statements and the GDP of the Province, debt incurred by these bodies is not significant.

Pension Funds

The Government sponsors several defined benefit pension plans and a defined contribution pension plan. The Government also participates in a joint defined benefit pension plan.

Defined Benefit Plans

Defined benefit plans provide benefits based on length of service and pensionable earnings. A typical defined benefit plan provides pensions equal to 2.0 per cent of a member’s average five years’ highest salary, multiplied by the years of service to a maximum of 35 years. Employees contribute a percentage of salary,


39


which may vary based on age, to their plan. Pensions and contribution rates are integrated with the Canada Pension Plan.

Actuarial valuations are performed at least triennially. When a valuation is not done in the current fiscal year an actuary extrapolates the most recent valuation. Valuations and extrapolations are based on a number of assumptions about future events, such as inflation rates, interest rates, wage and salary increases and employee turnover and mortality. These assumptions reflect estimates of expected long-term rates and short-term forecasts. Estimates vary based on the individual plan.

The accrued benefit obligation is determined using the projected benefit method prorated on services. Pension plan assets are valued at market-related values based on the actual market values averaged over a four-year period.

The two main defined benefit plans are the Teachers’ Superannuation Plan (TSP) and the Public Service Superannuation Plan (PSSP). The Government mitigated its pension liability exposure when it introduced the Saskatchewan Teachers’ Retirement Plan (STRP) in 1980 and the Public Employees’ Pension Plan (PEPP) in 1997, and closed the TSP and the PSSP to new members. The Government’s contributions to the STRP and PEPP are fixed and there is no pension liability exposure for the Government under these plans (see discussion below).

Other plans include Judges of the Provincial Court Superannuation Plan (Judges), Saskatchewan Transportation Company Employees Superannuation Plan, Anti-TB League Employees Superannuation Plan, and the Pension Plan for the Non-Teaching Employees of the Saskatoon School Division No.13 (PPNTE). Defined benefits are also payable to members of the former Members of the Legislative Assembly Superannuation Fund (MLA).

The Government is required to match employee current service contributions for all plans except the PSSP, Judges and PPNTE. Funding contributions are required for the PPNTE. Separate pension plan assets are maintained for TSP, Judges and PPNTE. For the other plans, employee contributions are received and pension obligations are paid directly by the Government.

Joint Defined Benefit Plans

Joint defined benefit plans are governed by formal agreements between the joint sponsors (i.e., participating employers and plan members) establishing that the joint sponsors have shared control over the plan. Funding contributions and significant risks of the plan are shared on an equitable basis between the joint sponsors. Accordingly, the Government accounts for only its portion of the plan. Plan assets and surpluses are restricted for member benefits or certain other purposes set out in the agreements. Plan benefits are determined on the same basis as defined benefit plans.

The accrued benefit obligation is determined using the projected benefit method prorated on services. Pension plan assets are valued at market-related values by averaging the difference between the net investment income on a market value basis and the expected investment income, based on the expected rate of return on plan assets, over a five-year period.

The Government also participates in the Saskatchewan Healthcare Employees’ Pension Plan (SHEPP), a joint defined benefit plan for employees of the Saskatchewan Health Authority and certain other Government health entities. The Government participating employers contribute to the plan at the ratio of 1.12 to 1 of employee contributions and any actuarially determined deficiency is the responsibility of participating employers and employees at the same ratio. The Government portion of employer contributions represents approximately 98 per cent of total participating employer contributions to the plan.

Information regarding the defined benefit plans and the joint defined benefit plan of government service organizations can be found in Note 5 page 57 of Exhibit 99.2.


40


Defined Contribution Plans

Defined contribution plans provide pensions based on accumulated contributions and investment earnings. Employees contribute a percentage of salary. The Government provides contributions at specified rates for employee current service. Pension plan assets of government-sponsored defined benefit and defined contribution plans are invested in fixed income securities, equities, real estate, pooled investment funds and short-term monetary items. The investment in government of Saskatchewan securities is insignificant for all plans.

The Government sponsors the Public Employees Pension Plan (PEPP). The Government provides contributions to the plan at specified rates for employee current service. The government also contributes to the Saskatchewan Teachers’ Retirement Plan (STRP) which is sponsored by the Saskatchewan Teachers’ Federation, as well as the Municipal Employees’ Pension Plan (MEPP) and the Regina Civic Employees’ Superannuation and Benefit Plan (RCESP). The Government has fully funded its share of contributions to the defined contribution plans.

Information regarding the defined contribution plans of government service organizations can be found in Note 5 page 58 of Exhibit 99.2.

The following reflects pension liability changes for five years ending March 31, 2026:

PENSION LIABILITY


(thousands of dollars)    2022     2023     2024     2025     2026  

Accrued benefit obligation, beginning of year

   $ 7,052,249     $ 6,715,807     $ 6,719,686     $ 6,526,228     $ 6,282,496  

Current period benefit cost

     19,894       20,618       19,858       19,478       23,062  

Interest cost

     204,615       198,905       195,047       203,065       204,627  

Actuarial losses (gains)

     (109,320 )      236,028       48,320       (6,315 )      (69,721 ) 

Benefit payments

     (451,631 )      (451,672 )      (456,683 )      (459,960 )      (458,321 ) 


Accrued Benefit Obligation,

End of Year

   $ 6,715,807     $ 6,719,686     $ 6,526,228     $ 6,282,496     $ 5,982,143  


Plan assets, beginning of year

   $ 402,361     $ 395,229     $ 373,499     $ 371,200     $ 368,901  

Employer contributions

     409,319       412,097       427,810       429,808       426,073  

Employee contributions

     4,966       4,485       4,447       4,911       5,632  

Return on plan assets

     35,236       18,929       19,610       21,236       22,575  

Actuarial gains (losses)

     (5,022 )      (5,569 )      2,517       1,706       3,815  

Benefit payments

     (451,631 )      (451,672 )      (456,683 )      (459,960 )      (458,321 ) 


Plan Assets, End of Year

   $ 395,229     $ 373,499     $ 371,200     $ 368,901     $ 368,675  


   $ 6,320,578     $ 6,346,187     $ 6,155,028     $ 5,913,595     $ 5,613,468  

Unamortized estimation adjustments1

     104,514       (235,370 )      (52,172 )      19,903       71,574  

Joint defined benefit plan (SHEPP) net asset

     (1,494,067 )      (1,573,382 )      (1,831,014 )      (2,145,920 )      (2,062,864 ) 

Valuation allowance2

     1,502,824       1,581,562       1,837,198       2,155,886       2,077,437  


Total Pension Liabilities (schedule 8 Exhibit 99.2)

   $ 6,433,849     $ 6,118,997     $ 6,109,040     $ 5,943,464     $ 5,699,615  


1 

Unamortized estimation adjustments are amortized to pension expense over the expected average remaining service life of the related employee group at the time the estimate adjustments arose and commence the year following the adjustment.

2 

The valuation allowance includes amounts that reduce the Government’s portion of the SHEPP plan assets to nil as plan assets and surpluses are restricted for member benefits.


41


The following reflects the pension expense of government service organizations for five years ending March 31, 2026:

PENSION EXPENSE


(thousands of dollars)    2022     2023     2024     2025     2026  

Defined benefit plans


Current period benefit cost

   $  19,894     $   20,618     $   19,858     $   19,478     $   23,062  

Amortization of estimation adjustments

     78,501       (98,287 )      229,001       64,054       (21,865 ) 

Employee contributions

     (4,966 )      (4,485 )      (4,447 )      (4,911 )      (5,632 ) 

Change in valuation allowance

     4,515       (577 )      (1,996 )      3,782       4,607  

Pension interest cost (schedule 15 Exhibit 99.2)

     169,379       179,976       175,437       181,829       182,052  


Pension (recovery) expense, defined benefit plans

   $ 267,323     $ 97,245     $ 417,853     $ 264,232     $ 182,224  

Other plans


Pension expense, joint defined benefit plan

   $ 190,182     $ 190,832     $ 200,474     $ 206,357     $ 195,079  

Pension expense, defined contribution plans

     242,419       246,770       252,303       273,944       308,261  


Total Pension Expense (schedule 17 Exhibit 99.2 footnote 3)

   $ 699,924     $ 534,847     $ 870,630     $ 744,533     $ 685,564  


Government Business Enterprise – Defined Benefit Pension Plans

There are additional employee pension plans of government business enterprises that are accounted for in the investment in government business enterprises.

The two main defined benefit plans of government business enterprises are the Power Corporation Superannuation Plan (SaskPower) and the Saskatchewan Telecommunications Pension Plan (SaskTel). Other plans include the Saskatchewan Government Insurance Superannuation Plan, the Liquor Board Superannuation Plan, and the Pension Plan for the Employees of the Saskatchewan Workers’ Compensation Board (WCB). The WCB pension plan was wound up during 2020-21. The Government contributes the amount necessary to fund the payment of pension benefits.

Information on the defined benefit plans of government business enterprises can be found in Note 5 on page 59 of Exhibit 99.2.

Based on the latest actuarial valuation with extrapolations to the government business enterprises’ year end, the present value of the accrued benefit obligation and the fair value of plan assets are shown in Note 5, page 60 of Exhibit 99.2.

Government Business Enterprise – Defined Contribution Pension Plans

Information on government business enterprises’ participation in PEPP can be found in Note 5, page 60 of Exhibit 99.2.

CERTAIN CROWN CORPORATIONS AND AGENCIES

Introduction

Saskatchewan’s Crown corporations are involved in a broad range of activities, including the provision of electricity, natural gas, telecommunications, insurance and other goods and services, primarily within the


42


province’s borders. Crown corporations are almost exclusively commercial enterprises intended to be self-sustaining.

Traditionally, the capital requirements of the Government’s enterprises have been financed, with few exceptions, through direct obligations of, or advances by, the General Revenue Fund (GRF). Provincial legislation governing certain Crown corporations provides for the issuance of securities by these enterprises, with or without a guarantee of the Province. Pursuant to The Financial Administration Act, 1993, all borrowings by provincial Crown corporations must be approved by Saskatchewan’s Minister of Finance.

For administrative purposes, Saskatchewan’s Crown corporations are categorized into two separate groups. As discussed below, most Crown corporations with self-sustaining commercial operations are under the purview of, and report to, Crown Investments Corporation of Saskatchewan. All other Crown corporations report directly to the Treasury Board, which is a committee of the Executive Council.

Self-sustaining Crown corporations are accounted for in accordance with International Financial Reporting Standards (IFRS), and they are consolidated in the Government’s financial statements using the modified equity method. Crown corporations that are not self-sustaining are accounted for in accordance with Canadian public sector accounting standards, and are consolidated after eliminating inter-entity balances and transactions.

Crown Investments Corporation of Saskatchewan (CIC)

Introduction

CIC is a provincial Crown corporation without share capital, established and operating under the authority of The Crown Corporations Act, 1993. CIC, as a legal entity, does not carry debt. CIC is wholly owned by the Government of Saskatchewan. CIC is responsible for certain government investments, including Crown corporations and financial and operating investments. Crown corporations are designated as being under the purview of CIC by legislation or Order-in-Council.

As at March 31, 2026, there were six corporations so designated: Lotteries and Gaming Saskatchewan (LGS), Saskatchewan Government Insurance (SGI CANADA), Saskatchewan Power Corporation (SaskPower), Saskatchewan Telecommunications Holding Corporation (SaskTel), Saskatchewan Water Corporation (SaskWater), and SaskEnergy Incorporated (SaskEnergy). Of these corporations, LGS, SaskPower, SaskTel, SaskEnergy and SGI CANADA are the most significant in terms of assets, liabilities, and operating income generated.

The Saskatchewan Auto Fund is not a Crown corporation and is not included in CIC’s consolidated results. However, it is administered by Saskatchewan Government Insurance (SGI) and is, therefore, included in the commentary below. CIC is the sole shareholder of CIC Asset Management Inc. (CIC AMI), a wholly owned share capital subsidiary which is domiciled in Canada.

Fiscal Year 2025-26 Highlights - Consolidated Basis


(millions of dollars)    2021-22     2022-23     2023-24      2024-25      2025-26  

LGS/Saskatchewan Gaming Corporation (SGC)1

     9.5       21.3       195.3        223.5        240.0  

SaskTel

     104.4       104.1       95.4        82.2        104.7  

SaskEnergy

     158.3       59.4       21.1        90.5        84.4  

SGI CANADA

     81.8       34.3       78.1        43.2        75.7  

SaskWater

     8.7       8.6       8.7        8.6        7.9  

CIC AMI

     (7.3 )      (6.2 )      7.1        2.5        (0.1 ) 

Saskatchewan Opportunities Corporation

     1.1       —        —         —         —   

SaskPower

     10.7       (172.1 )      184.6        75.7        (113.4 ) 


43


(millions of dollars)    2021-22     2022-23     2023-24     2024-25     2025-26  

CIC (Separate)

     186.5       103.1       211.8       257.6       105.2  

Consolidation adjustments2

     (192.7 )      (135.3 )      (223.8 )      (273.1 )      (331.1 ) 


CIC Consolidated net earnings

     361.0       17.2       578.3       510.7       173.3  


Saskatchewan Auto Fund

     (38.9 )      (134.1 )      (70.3 )      (198.0 )      (93.3 ) 


1

On June 1, 2023, LGS began operations. SGC was reconfigured as a wholly-owned business subsidiary of LGS. 2020-21 to 2022-23 net earnings (loss) were exclusively derived from SGC’s casino operations.

2

Consolidation adjustments reflect the elimination of all inter-entity transactions, such as grants from CIC to Crown corporations, revenues and expenses between Crown corporations, and dividends paid by Crown corporations to CIC.

CIC administered six subsidiary Crown corporations at March 31, 2026. Following is a brief commentary on CIC’s five major holdings plus the Saskatchewan Auto Fund that is administered by SGI.

LGS

LGS oversees the management of lotteries and gaming activities in Saskatchewan including lotteries, casinos, video lottery terminals (VLTs), and online gaming. A portion of earnings from Saskatchewan lottery and gaming activities are received by LGS and distributed to the GRF and other various organizations in accordance with The Lotteries and Gaming Saskatchewan Corporation Act and Gaming Framework Agreement.


  •  

Net earnings improved by $16.5 million primarily due to increased revenue from land-based casinos, online gaming, and VLTs. This was driven by strong economic conditions which resulted in more disposable income in the province and increased guest spending.


  •  

Dividends declared to CIC were $215.1 million (2024-25 - $190.0 million).

SaskEnergy

SaskEnergy operates a natural gas distribution utility that provides natural gas and related services to residential, farm, commercial, and industrial customers in Saskatchewan. In addition, TransGas Limited (TransGas) is SaskEnergy’s wholly owned natural gas transmission and storage subsidiary.


  •  

Net earnings decreased by $6.1 million primarily due to unfavourable market value adjustments on natural gas contracts. Fair value adjustments are impacted by changes in the volume of natural gas contracts outstanding and the difference between contract and market prices. Excluding market value adjustments, SaskEnergy saw improved earnings due to customer connection capital contributions and effectively using transportation and storage capacity to take advantage of natural gas market pricing differentials to generate earnings. This was partially offset by new technology implementation costs, higher software lease and maintenance costs, and higher third-party transportation costs.


  •  

Dividends to CIC were $33.8 million (2024-25 - $31.8 million).

SaskTel

SaskTel provides competitive wireless, voice, entertainment, internet, data, equipment, marketing, security, software and consulting products and services. The corporation’s major asset is a wholly owned subsidiary, Saskatchewan Telecommunications, which has been the principal supplier of telecommunications in Saskatchewan for over 100 years. SaskTel’s operations are regulated by the Canadian Radio-television and Telecommunications Commission.


44


  •  

Net earnings increased by $22.5 million primarily due to growth in key business segments including wireless network services and equipment, fixed broadband and data services, and maxTV services. Growth in wireless and fixed broadband was driven by SaskTel’s network expansion and improvements to its infiNET and 5G networks throughout Saskatchewan. maxTV content package restructuring provided increased value to customers, driving migrations to higher tier packages. SaskTel also sold its out of province security monitoring accounts, resulting in additional revenue.


  •  

Dividends declared to CIC were $41.9 million (2024-25 - $32.9 million).

SaskPower

SaskPower is Saskatchewan’s energy supplier. It generates, purchases, transmits, distributes, and sells electricity and related products and services. SaskPower supplies electricity from a variety of sources including import, natural gas, coal, hydro, wind, solar, and other.


  •  

SaskPower experienced a net loss of $113.4 million in 2025-26, a decrease in earnings of $189.1 million from 2024-25, primarily due to the discontinuation of the collection of the federal carbon charge rate rider from customers effective April 1, 2025 and increased fuel and purchased power costs. SaskPower saw an increase in fuel and purchased power costs due to higher generation volumes from increased customer demand and an increase in the federal carbon charge to $95/tonne of CO2e effective January 1, 2025 and $110/tonne effective January 1, 2026. Increased maintenance overhaul activities at generation facilities and higher vegetation management costs also contributed to the increase.


  •  

Partially offsetting these negative earnings impacts were higher Saskatchewan electricity sales due to higher demand from residential, farm, commercial, and power customer classes and the implementation of a 3.9 per cent system average rate increase effective February 1, 2026. Export sales increased due to higher sales volumes to the Midwest Independent System Operator and the Southwest Power Pool and other revenue increased due to higher customer contributions. SaskPower also received a $187.0 million grant from CIC to support rate affordability for customers and $175.0 million in Clean Electricity Transition Grant funding from the Province.


  •  

Dividends declared to CIC were $nil (2024-25 - $nil).

SGI CANADA

SGI CANADA is the trade name of the property and casualty insurance division of Saskatchewan Government Insurance (SGI) which offers products in five Canadian provinces. It operates as SGI CANADA in Saskatchewan and SGI CANADA Insurance Services Ltd. (SCISL) in Alberta, Manitoba, British Columbia, and Ontario. SCISL also has a wholly-owned subsidiary, Coachman Insurance Company, which operates in Ontario. Products are sold through a network of independent brokers throughout Saskatchewan, Manitoba, Alberta, British Columbia, and Ontario.


  •  

Net earnings increased by $32.5 million largely due to continued premium growth, primarily in Saskatchewan and Alberta, and a positive claims experience in provinces outside Saskatchewan. The growth in Saskatchewan premiums was driven by increases in the average cost per policy of farm, personal lines, and personal and commercial auto products. Premium growth in Alberta was driven by increases in both the number of policies sold and the average cost per policy sold in personal lines and personal and commercial auto products. Although significant catastrophic claims were incurred in Saskatchewan due to the wildfires, this was offset by lower claims in all jurisdictions except Alberta.


  •  

Dividends declared to CIC were $16.0 million (2024-25 - $18.0 million).

Saskatchewan Auto Fund


45


As the compulsory automobile insurance program for Saskatchewan residents, the Auto Fund provides vehicle registrations, driver’s licences, basic minimum liability insurance required to operate a vehicle and coverage for damage to or loss of an insured vehicle, subject to a deductible. The Auto Fund is administered by SGI. SGI’s role is to oversee the operations of the Auto Fund for the Province of Saskatchewan based on the legislative requirements contained in The Automobile Accident Insurance Act.

The Auto Fund does not receive money from, nor pay dividends to, the Province of Saskatchewan, SGI, or CIC. The Auto Fund is operated on a self-sustaining basis viewed over a long-term time frame. Any annual financial excess or deficiencies of the Auto Fund are recorded in its Rate Stabilization Reserve (RSR). The RSR is held on behalf of Saskatchewan’s motoring public and cannot be used for any other purpose by the government or the administrator.


  •  

Net loss for 2025-26 was $93.3 million, an improvement in earnings of $104.7 million from 2024-25 primarily from higher premiums due to new vehicles being licensed in the province and positive discounting impacts. This was partially offset by lower investment results due to more stable interest rates resulting in lower fixed income gains.

Capital Expenditures

During 2025-26, capital expenditures made by CIC and the Crown corporations under its purview totalled $2.6 billion (2024-25 - $2.2 billion) an increase of $0.4 million from 2024-25. Total consolidated assets administered by CIC were $26.9 billion as of March 31, 2026, an increase of $1.7 billion from 2024-25.

Saskatchewan Rate Review Panel

On July 26, 2000, the Saskatchewan Rate Review Panel (Panel) was established. The Panel advises the Government of Saskatchewan on rate applications proposed by SaskEnergy, SaskPower and the Saskatchewan Auto Fund. The Panel reviews each rate application and provides an independent public report on its opinion about the fairness and reasonableness of the rate change, while balancing the interests of the customer, the Crown corporation, and the public. The provincial Cabinet makes the final decision on rate change requests, which can differ from the Panel’s recommendation. Two rate applications were filed in 2025-26.

FOREIGN EXCHANGE

Canada maintains a floating exchange rate for the Canadian dollar, which permits the rate to be determined by fundamental market forces without intervention except as required to maintain orderly market conditions.

Closing spot exchange rates for the U.S. dollar in Canada, expressed in Canadian dollars per U.S. dollar, are shown in the table below for 2021 through 2025.


     2021      2022      2023      2024      2025  

Annual average exchange rate

     1.2535        1.3013        1.3497        1.3698        1.3978  
 

Source: Bank of Canada

On March 31, 2026, the rate for the U.S. dollar in Canada, as reported by the Bank of Canada, was $1.3939.

Unless otherwise specified or the context otherwise requires, the following table sets forth the conversion rates used in this Annual Report for foreign currency borrowings.


46


     2022      2023      2024      2025      2026  

March 31 average exchange rate

     1.2496        1.3533        1.3550        1.4376        1.3939  
 

Source: Bank of Canada


47


OFFICIAL STATEMENTS

Information included herein which is designated as being taken from a publication of the Province or Canada, or any agency or instrumentality of either, is included herein upon the authority of such publication as a public official document. The financial statements of the Government included herein under the headings “Summary Financial Statement Supplementary Financial Information” have been taken from the Public Accounts of the Province (subject to certain adjustments for purposes of comparability). All financial information contained herein was obtained from the most recent annual Budget, Public Accounts, or Crown Investments Corporation of Saskatchewan Annual Report, or was prepared by representatives of the Ministry of Finance or of CIC in their official capacities. The information set forth under “Province of Saskatchewan,” and other than described in the first sentence of this paragraph, was prepared by representatives of the Ministry of Finance in their official capacities.


48


DEBT SUMMARY AND TERM DEBT OUTSTANDING

Debt Summary as of March 31, 2026


Summary

   Thousands  

Payable in Canadian Funds:


Term Debt Issued to the Public - Medium-Term Notes

     469,449  

Term Debt Issued to the Public - Public Issue Debentures

     29,910,000  


   $ 30,379,449  

Debentures Issued to the Minister of Finance of Canada

     552,554  

Other Term Debt

     7,644,536  


Term Debt Outstanding

   $ 38,576,539  

Promissory Notes Outstanding

     1,894,218  


Gross Debt

   $ 40,470,757  


Medium-Term Promissory Notes

                                         
Series    Date of Original
Issue
     Maturity Date      Amount Outstanding      CAD      Coupon Rate      Canadian Dollars  

803854GZ5

     24-Mar-99        5-Mar-29        60,000,000        CAD        5.60        60,000,000  

803854HF8

     17-Feb-00        25-Jan-30        25,000,000        CAD        6.25        25,000,000  

803854JN91

     25-Jan-00        25-Jan-30        169,995,000        CAD        6.35        169,995,000  

803854HE1

     25-Jan-00        25-Jan-30        30,000,000        CAD        6.35        30,000,000  

803854JR06

     13-Feb-09        13-Feb-32        29,954,000        CAD        6.30        29,954,000  

803854JB5

     10-Jun-03        5-Sep-33        104,500,000        CAD        5.80        104,500,000  

803854HY74

     16-Sep-02        5-Sep-42        50,000,000        CAD        5.70        50,000,000  


         $ 469,449,000            $ 469,449,000  


Public Issue Debentures

                                         
Series   

Date of Original

Issue

     Maturity Date      Amount Outstanding      CAD      Coupon Rate      Canadian Dollars  

803854KB3

     14-Mar-16        2-Jun-26        1,575,000,000        CAD        2.55        1,575,000,000  

803854KE7

     24-Feb-17        2-Jun-27        1,000,000,000        CAD        2.65        1,000,000,000  

803854KF4

     18-May-18        2-Dec-28        1,300,000,000        CAD        3.05        1,300,000,000  

803854GY8

     4-Dec-98        5-Mar-29        350,000,000        CAD        5.75        350,000,000  

803854KJ6

     4-Oct-19        2-Jun-30        1,400,000,000        CAD        2.20        1,400,000,000  

803854KP2

     12-May-21        2-Jun-31        1,600,000,000        CAD        2.15        1,600,000,000  

803854HN

     8-Aug-01        5-Sep-31        550,000,000        CAD        6.40        550,000,000  

803854KU1

     24-May-23        2-Jun-33        1,700,000,000        CAD        3.90        1,700,000,000  

803854JA70

     12-May-03        5-Sep-33        450,000,000        CAD        5.80        450,000,000  

803854KX54

     1-Apr-25        2-Jun-35        1,600,000,000        CAD        3.80        1,600,000,000  

803854JH24

     12-Aug-04        5-Sep-35        400,000,000        CAD        5.60        400,000,000  

803854KZ0

     26-Mar-26        2-Jun-36        400,000,000        CAD        4.10        400,000,000  

803854JJ89

     15-Feb-05        5-Mar-37        425,000,000        CAD        5.00        425,000,000  

803854JL36

     26-May-06           1-Jun-40          1,050,000,000          CAD             4.75        1,050,000,000  

803854JT6

     3-Feb-12        3-Feb-42        800,000,000        CAD        3.40        800,000,000  

803854JU3

     9-Oct-13        2-Jun-45        1,450,000,000        CAD        3.90        1,450,000,000  


49


Public Issue Debentures

                                         
Series   

Date of Original

Issue

     Maturity Date      Amount Outstanding      CAD      Coupon Rate      Canadian Dollars  
                 

803854KA5

     17-Apr-15        2-Dec-46        2,200,000,000        CAD        2.75        2,200,000,000  

803854KC1

     13-Dec-16        2-Jun-48        2,125,000,000        CAD        3.30        2,125,000,000  

803854KH0

     15-Aug-18        2-Jun-50        2,500,000,000        CAD        3.10        2,500,000,000  

803854KN7

     13-Apr-21        2-Dec-52        1,600,000,000        CAD        2.80        1,600,000,000  

803854JX7

     13-Mar-14        2-Mar-54        725,000,000        CAD        3.75        725,000,000  

803854KV9

     27-Jun-23        2-Dec-54        2,000,000,000        CAD        4.20        2,000,000,000  

803854KY3

     3-Jun-25        2-Dec-56        1,350,000,000        CAD        4.40        1,350,000,000  

803854KG2

     26-Jun-18        2-Jun-58        750,000,000        CAD        2.95        750,000,000  

803854KL1

     2-Jun-20        2-Jun-60        310,000,000        CAD        2.35        310,000,000  

803854KT4

     23-Jan-23        2-Jun-62        300,000,000        CAD        3.80        300,000,000  


         $ 29,910,000,000            $ 29,910,000,000  


Canada Pension Plan Debt


Debenture

Number

   Date of Issue      Maturity Date      Amount Outstanding             Coupon Rate      Canadian Dollars  

CPP-37

     4-Jul-11        4-Jul-26        3,000,000        CAD        3.85        3,000,000  

CPP-7

     8-Aug-06        8-Aug-26        7,330,000        CAD        4.86        7,330,000  

CPP-59

     12-Mar-17        12-Mar-27        16,559,000        CAD        2.68        16,559,000  

CPP-13

     10-Apr-07        10-Apr-27        2,200,000        CAD        4.60        2,200,000  

CPP-81

     3-Jun-24        5-Jun-29        12,427,000        CAD        4.00        12,427,000  

CPP-82

     5-Jun-24        5-Jun-29        15,000,000        CAD        4.00        15,000,000  

CPP-83

     5-Jun-24        5-Jun-29        15,000,000        CAD        4.00        15,000,000  

CPP-79

     3-Nov-23        3-Dec-29        5,000,000        CAD        4.59        5,000,000  

CPP-80

     1-Dec-23        3-Dec-29        7,000,000        CAD        4.01        7,000,000  

CPP-78

     4-Jul-23        4-Jul-30        6,000,000        CAD        4.04        6,000,000  

CPP-30

     3-Dec-10        3-Dec-30        9,000,000        CAD        4.32        9,000,000  

CPP-84

     2-Dec-24        1-Dec-31        6,000,000        CAD        3.70        6,000,000  

CPP-86

     2-Mar-26        2-Mar-32        3,000,000        CAD        3.09        3,000,000  

CPP-44

     1-Dec-13        1-Dec-33        9,800,000        CAD        3.94        9,800,000  

CPP-47

     5-Jun-14        5-Jun-34        13,100,000        CAD        3.51        13,100,000  

CPP-1

     10-Jul-05        10-Jul-35        14,147,000        CAD        4.71        14,147,000  

CPP-85

     3-Dec-25        3-Dec-35        50,000,000        CAD        3.67        50,000,000  

CPP-50

     12-Dec-15        12-Dec-35        2,407,000        CAD        3.29        2,407,000  

CPP-51

     10-Jan-16        10-Jan-36        2,400,000        CAD        3.18        2,400,000  

CPP-53

     9-May-16        9-May-36        22,010,000        CAD        3.17        22,010,000  

CPP-54

     2-Jun-16        2-Jun-36        23,557,000        CAD        3.18        23,557,000  

CPP-56

     4-Jul-16        4-Jul-36        15,552,000        CAD        2.93        15,552,000  

CPP-57

     3-Nov-16        3-Nov-36        4,575,000        CAD        2.94        4,575,000  

CPP-73

     3-Nov-21        3-Nov-36        1,525,000        CAD        2.49        1,525,000  

CPP-74

     1-Dec-21        1-Dec-36        3,900,000        CAD        2.70        3,900,000  

CPP-60

     10-Apr-17        10-Apr-37        2,800,000        CAD        3.20        2,800,000  

CPP-61

     11-May-17        11-May-37        2,600,000        CAD        3.02        2,600,000  

CPP-62

     11-Jun-17        11-Jun-37        18,991,000        CAD        2.85        18,991,000  

CPP-75

     13-Jun-22        11-Jun-37        3,900,000        CAD        4.11        3,900,000  

CPP-64

     3-Mar-18        3-Mar-38        5,000,000        CAD        3.15        5,000,000  

CPP-19

     11-Jul-08        11-Jul-38        23,684,000        CAD        4.71        23,684,000  

CPP-70

     1-Sep-19        1-Sep-39        4,500,000        CAD        2.39        4,500,000  

CPP-71

     1-Dec-19        1-Dec-39        33,000,000        CAD        2.46        33,000,000  

CPP-72

     1-Mar-20        1-Mar-40        5,093,000        CAD        2.20        5,093,000  


50


Canada Pension Plan Debt


Debenture

Number

   Date of Issue      Maturity Date      Amount Outstanding             Coupon Rate      Canadian Dollars  

CPP-49

     1-Mar-15        1-Mar-40        10,174,000        CAD        2.77        10,174,000  

CPP-29

     3-May-10        3-May-40        13,000,000        CAD        4.80        13,000,000  

CPP-63

     1-Mar-18        1-Mar-41        4,600,000        CAD        3.16        4,600,000  

CPP-52

     1-Mar-16        1-Mar-41        10,718,000        CAD        3.29        10,718,000  

CPP-55

     3-Jun-16        3-Jun-41        5,000,000        CAD        3.21        5,000,000  

CPP-41

     1-Mar-12        1-Mar-42        76,300,000        CAD        3.44        76,300,000  

CPP-77

     6-Jul-22        6-Jul-42        50,000,000        CAD        4.32        50,000,000  

CPP-76

     6-Jul-22        6-Jul-42        12,705,000        CAD        4.32        12,705,000  


         $ 552,554,000            $ 552,554,000  


Other Term Debt

                                         
Series    Date of Original
Issue
     Maturity Date      Amount Outstanding             Coupon Rate      Canadian Dollars  

N/A

     8-Jun-22        8-Jun-27        1,000,000,000        USD        3.51        1,266,800,000  

N/A

     28-Jan-25        28-Jan-30        1,000,000,000        USD        4.65        1,440,600,000  

N/A

     1-Mar-22        1-Mar-32        100,000,000        CHF        2.73        137,931,034  

N/A

     2-May-24        2-May-34        100,000,000        CHF        1.33        150,262,960  

N/A

     8-May-24        8-May-34        1,250,000,000        EUR        3.30        1,839,875,000  

N/A

     17-Apr-25        17-Apr-35        120,000,000        CHF        1.07        194,615,634  

N/A

     20-Aug-25        20-Aug-35        200,000,000        CHF        0.82        340,347,357  

N/A

     24-Sep-25        24-Sep-35        1,000,000,000        EUR        3.25        1,624,000,000  

N/A

     3-Apr-25        3-Apr-40        91,000,000        EUR        3.70        140,494,900  

N/A

     13-Dec-21        13-Dec-41        120,000,000        EUR        2.66        174,500,000  

N/A

     6-Oct-20        6-Oct-50        115,000,000        EUR        2.08      $ 179,779,500  

N/A

     Various        Various        155,329,519        CAD        Various        155,329,519  


         $ 5,251,329,519            $ 7,644,535,905  


1

The Canada Pension Plan (CPP) is a compulsory national pension plan in which residents of all provinces, except Quebec, participate. Provincial securities sold to the CPP prior to July 1, 2005, are payable 20 years after their respective dates of issue. Effective July 1, 2005, no new loan capital is available to provinces. However, provinces are permitted to roll over maturing securities and may choose the term of the new securities within the parameters of not less than five years and not more than 30 years. The securities are not negotiable, not transferable or assignable, but are redeemable in whole or in part before maturity at the option of the Minister of Finance of Canada, on six months’ prior notice when he deems it necessary in order to meet the requirements of the Canada Pension Plan or at the option of the Province with at least one month prior notice to the Minister of Finance of Canada

2

Sinking funds are required for debt with a term of 10 years or more. Sinking Fund investments consist primarily of debentures of the Province of Saskatchewan, other provincial governments and the Government of Canada.

3

The Province has executed currency swap contracts to convert any foreign-denominated debt into Canadian-denominated debt. This debt is reflected in the above list in Canadian dollars using the foreign exchange rate effective in the swap contract.


51