
Exhibit 99.16
BSR REAL ESTATE INVESTMENT TRUST
Management’s Discussion and Analysis of Financial Condition and Results of Operations
for the three months ended March 31, 2025
May 7, 2025
BSR
REAL ESTATE INVESTMENT TRUST
Management’s Discussion and Analysis of Financial Condition and Results of Operations
for the three months ended March 31, 2025
Amounts in thousands of U.S. dollars (except for unit amounts, per unit amounts and as otherwise noted)
TABLE OF CONTENTS
| PRESENTATION | 2 |
| FORWARD-LOOKING STATEMENTS | 2 |
| ACCOUNTING POLICIES | 4 |
| NON-GAAP MEASURES | 4 |
| BUSINESS OVERVIEW | 7 |
| HIGHLIGHTS | 9 |
| OUTLOOK | 10 |
| ENVIRONMENTAL, SOCIAL AND GOVERNANCE | 12 |
| BUSINESS PERFORMANCE MEASURES | 15 |
| SELECTED QUARTERLY FINANCIAL INFORMATION | 20 |
| REVIEW OF SELECTED OPERATING INFORMATION | 22 |
| RECONCILIATION OF NON-GAAP MEASURES | 27 |
| LIQUIDITY AND CAPITAL RESOURCES | 28 |
| CONTRACTUAL COMMITMENTS | 30 |
| UNITHOLDERS EQUITY AND DISTRIBUTIONS | 31 |
| INVESTMENT PROPERTY PORTFOLIO | 32 |
| INVESTMENT PROPERTY VALUATION | 32 |
| CASH FLOWS | 33 |
| UNITS OUTSTANDING | 34 |
| TRANSACTIONS WITH RELATED PARTIES | 34 |
| CRITICAL ACCOUNTING ESTIMATES AND ASSUMPTIONS | 35 |
| DISCLOSURE CONTROLS AND INTERNAL CONTROLS OVER FINANCIAL REPORTING | 35 |
| FINANCIAL RISK MANAGEMENT | 36 |
| RISK FACTORS | 36 |
1
BSR REAL ESTATE INVESTMENT TRUST
Management’s Discussion and Analysis of Financial Condition and Results of Operations
for the three months ended March 31, 2025
Amounts in thousands of U.S. dollars (except for unit amounts, per unit amounts and as otherwise noted)
PRESENTATION
This Management’s Discussion and Analysis (“MD&A”) of BSR Real Estate Investment Trust (the “REIT”, “BSR”, “we” and “our”) is prepared as of May 7, 2025, and outlines the REIT’s operating strategies, risk profile considerations, business outlook and analysis of its results of operations and financial condition for the three months ended March 31, 2025.
The REIT is an unincorporated, open-ended real estate investment trust established pursuant to a declaration of trust of the REIT dated January 9, 2018, under the laws of the Province of Ontario, which was amended and restated on May 11, 2022 (the “Declaration of Trust”). The principal business of the REIT is to acquire and operate multi-family residential rental properties across the United States. The operations of the REIT commenced on May 18, 2018 when it completed an initial public offering ("IPO") and indirectly acquired an interest in BSR Trust, LLC (“BSR Trust”) and 47 garden-style, multi-family communities. As of March 31, 2025, the REIT owned 29 multifamily garden-style residential properties consisting of 8,008 apartment units.
This MD&A should be read in conjunction with the REIT’s condensed consolidated interim financial statements and accompanying notes for the three months ended March 31, 2025, prepared in accordance with International Accounting Standard (“IAS”) 34, Interim Financial Reporting, as issued by the International Accounting Standards Board (the “IASB”) (“IFRS Accounting Standards” or “GAAP”), and the REIT’s consolidated financial statements and accompanying notes for the year ended December 31, 2024, and the REIT’s MD&A for the year ended December 31, 2024.
All amounts are stated in thousands of U.S. dollars, unless otherwise noted. This MD&A has been prepared based on information available to management as of May 7, 2025. Additional information about the REIT, including the REIT’s current annual information form in respect of the year ended December 31, 2024 (the “AIF”), can be found on SEDAR+ at www.sedarplus.ca or on the REIT’s website at www.bsrreit.com.
The registered office of the REIT is at 333 Bay Street, Suite 3400, Toronto, Ontario. The REIT’s trust units (“Units”) trade on the Toronto Stock Exchange (the “TSX”) in U.S. dollars under the symbol “HOM.U” and in Canadian dollars under the symbol “HOM.UN”.
FORWARD-LOOKING STATEMENTS
This MD&A of the REIT contains “forward-looking information” as defined under Canadian securities laws (collectively, “forward-looking statements”). This document should be read in conjunction with material contained in the REIT’s current consolidated financial statements along with the REIT’s other publicly filed documents. Forward-looking statements appear in this MD&A and include, but are not limited to, statements which reflect management’s expectations regarding objectives, plans, goals, strategies, future growth, results of operations, performance, business prospects, opportunities for the REIT (including exit or sale plans, acquisitions, portfolio expansion, capital recycling, capital redevelopment, property stabilizations and rental rate increases), macroeconomic and industry trends (including those relating to job growth, population growth, vacancy and home ownership rates) as well as any other forward-looking statements made within this MD&A. The words “plans”, “expects”, “does not expect”, “goals”, “seek”, “strategy”, “future”, “estimates”, “intends”, “anticipates”, “does not anticipate”, “projected”, “believes” or variations of such words and phrases or statements to the effect that certain actions, events or results “may”, “will”, “could”, “would”, “should”, “might”, “likely”, “occur”, “be achieved” or “continue” and similar expressions identify forward-looking statements. In addition, any statements that refer to expectations, intentions, projections or other characterizations of future events or circumstances contain forward-looking statements. Statements containing forward-looking information are not historical facts but instead represent management’s expectations, estimates and projections regarding future events or circumstances.
Such forward-looking statements are qualified in their entirety by the inherent risks, uncertainties and changes in circumstances surrounding future expectations which are difficult to predict and many of which are beyond the control of the REIT.
2
BSR REAL ESTATE INVESTMENT TRUST
Management’s Discussion and Analysis of Financial Condition and Results of Operations
for the three months ended March 31, 2025
Amounts in thousands of U.S. dollars (except for unit amounts, per unit amounts and as otherwise noted)
Forward-looking statements are necessarily based on estimates and assumptions that, while considered reasonable by management of the REIT as of the date of this MD&A, are inherently subject to significant business, economic and competitive uncertainties and contingencies. The REIT’s estimates, beliefs and assumptions, which may prove to be incorrect, include the various assumptions set forth herein, including, but not limited to, assumptions relating to the REIT’s future growth potential, results of operations, demographic and industry trends, no changes in legislative or regulatory matters, the tax laws as currently in effect, a gradual recovery and growth of the general economy over 2025 and 2026, lease renewals and rental increases, the ability to re-lease or find new tenants, the timing and ability of the REIT to sell and acquire certain properties, project costs and timing, a continuing trend toward land use intensification at reasonable costs and development yields, including residential development in urban markets, access to equity and debt capital markets to fund, at acceptable costs, future capital requirements and to refinance debts as they mature, the availability of investment opportunities for growth in the REIT’s target markets, the valuations to be realized on property sales relative to current IFRS Accounting Standards values, the market price of the Units, and the anticipated benefits of the Transaction (defined herein), and use of proceeds thereof.
When relying on forward-looking statements to make decisions, the REIT cautions readers not to place undue reliance on these statements, as forward-looking statements involve significant risks and uncertainties. Forward-looking statements should not be read as guarantees of future performance or results and will not necessarily be accurate indications of whether or not the times at or by which such performance or results will be achieved. A number of factors could cause actual results to differ, possibly materially, from the results discussed in the forward-looking statements, including, but not limited to:
| · | unintended consequences of the Contribution Transaction (defined below); | |
| · | unexpected costs and liabilities related to the Contribution Transaction; | |
| · | the REIT’s ability to execute its growth strategies; | |
| · | the impact of changing conditions in the U.S. multifamily housing market; | |
| · | increasing competition in the U.S. multifamily housing market; | |
| · | the effect of fluctuations and cycles in the U.S. real estate market; | |
| · | the marketability and value of the REIT’s portfolio; | |
| · | changes in the attitudes, financial condition and demand of the REIT’s demographic market; | |
| · | fluctuation in interest rates and volatility in financial markets; | |
| · | the impact of U.S. and global tariffs; | |
| · | developments and changes in applicable laws and regulations; | |
| · | the impact of climate change; | |
| · | the impact of inflation; and | |
| · | the impact of the economic environment |
If any risks or uncertainties with respect to the above materialize, or if the opinions, estimates or assumptions underlying the forward-looking information prove incorrect, actual results or future events might vary materially from those anticipated in the forward-looking information. Although management has attempted to identify important risk factors that could cause actual results to differ materially from those contained in forward-looking information, there may be other risk factors not presently known or risk factors that management believes are not material that could also cause actual results or future events to differ materially from those expressed in such forward-looking information.
Certain statements included in this MD&A are considered a “financial outlook” for purposes of applicable Canadian securities laws, and as such, the financial outlook may not be appropriate for purposes other than to understand management’s current expectations relating to the future growth of the REIT, as disclosed herein. These forward-looking statements have been approved by management to be made as at the date of this MD&A. Certain material factors, estimates or assumptions were applied in drawing a conclusion or making a forecast or projection as reflected in this MD&A and actual results could differ materially from such conclusions, forecasts or projections. There can be no assurance that actual results, performance or achievements will be consistent with these forward-looking statements. The forward-looking statements contained in this document are expressly qualified in their entirety by this cautionary statement. Except as expressly required by applicable Canadian securities law, the REIT assumes no obligation to publicly update or revise any forward-looking statement, whether as a result of new information, future events or otherwise.
3
BSR REAL ESTATE INVESTMENT TRUST
Management’s Discussion and Analysis of Financial Condition and Results of Operations
for the three months ended March 31, 2025
Amounts in thousands of U.S. dollars (except for unit amounts, per unit amounts and as otherwise noted)
ACCOUNTING POLICIES
The REIT’s accounting policies are described in the consolidated financial statements for the year ended December 31, 2024. In applying these policies, in certain cases it is necessary to use estimates, which management determines using information available to the REIT at the time. Management reviews key estimates on a quarterly basis to determine their appropriateness and any change to these estimates is applied prospectively in compliance with IFRS Accounting Standards. Significant estimates are made with respect to the fair value of investment properties.
NON-GAAP MEASURES
In this MD&A, the REIT uses certain non-GAAP financial measures, non-GAAP ratios and certain real estate industry supplementary financial measures to measure, compare and explain the operating results and financial performance of the REIT. These measures are commonly used by entities in the real estate industry as useful metrics for measuring performance and we believe that providing these performance measures on a supplemental basis is helpful to investors in assessing the overall financial performance of the REIT’s business. However, they do not have any standardized meaning prescribed by GAAP and are not necessarily comparable to similar measures presented by other publicly traded entities. These measures should be considered as supplemental in nature and not as a substitute for related financial information prepared in accordance with GAAP. Because non-GAAP financial measures, non-GAAP ratios and supplementary financial measures do not have standardized meanings prescribed under GAAP, securities regulators require that such measures be clearly defined, identified, and reconciled to their nearest GAAP measure. The reconciliations of the non-GAAP financial measures and non-GAAP ratios used in this MD&A are provided under “Reconciliation of Non-GAAP Measures”.
Net Operating Income and NOI Margin
Net operating income (“NOI”) is defined as total revenue from properties (i.e. rental revenue and other property income) less direct property operating expenses and realty taxes accounted for in accordance with IFRS Accounting Standards, except for adjustments related to IFRS Interpretations Committee – 21 Levies. NOI should not be construed as an alternative to net gain or loss determined in accordance with IFRS Accounting Standards. The REIT’s method of calculating NOI may differ from other issuers’ methods and, accordingly, may not be comparable to NOI reported by other issuers.
The REIT regards NOI as an important measure of the income generated from the income producing properties and is used by the REIT in evaluating the performance of the REIT’s properties. It is also a key input in determining the value of the REIT’s properties.
“NOI Margin” is defined as NOI divided by total revenue, as a percentage. Management believes that NOI Margin is a meaningful supplementary measure of operating performance of the REIT’s income producing properties. NOI Margin is an important measure of the percentage of income generated from the income producing properties and is used by the REIT in evaluating the performance of the portfolio.
Same Community
“Same Community” results are used by management to evaluate performances of investment properties owned by the REIT during comparative periods. Same Community results are a meaningful measure of operating performance because it allows management to assess rent growth and leasing activity of its portfolio on a same property basis and the impact of capital investments. The REIT calculates Same Community results for revenue, NOI, NOI Margin and certain operating metrics.
4
BSR REAL ESTATE INVESTMENT TRUST
Management’s Discussion and Analysis of Financial Condition and Results of Operations
for the three months ended March 31, 2025
Amounts in thousands of U.S. dollars (except for unit amounts, per unit amounts and as otherwise noted)
Same Community results in this MD&A exclude the financial and operational results of Venue Craig Ranch Apartments, which was acquired in January 2025 (the “Property Acquisition”). Same Community results in this MD&A also exclude the financial and operational results of Bluff Creek Apartments, which was sold on March 24, 2025, as well as, Cielo I, Cielo II and Retreat at Wolf Ranch, which were sold on March 31, 2025 in connection with the closing of the Direct Asset Sale Transaction (defined below) (collectively the “Property Dispositions”). In addition, Same Community results in this MD&A also exclude the results of Aura 35Fifty, which we completed the development of in December 2024 and remains non-stabilized during the current and comparative periods due to lease-up (the “Non-Stabilized Property”).
The results of the properties excluded from Same Community results noted above comprise “Non-Same Community” results.
Funds from Operations and Adjusted Funds from Operations
In January 2022, the Real Property Association of Canada (“REALPAC”) published a white paper titled “White Paper on Funds from Operations & Adjusted Funds from Operations for IFRS”. The purpose of the white paper is to provide reporting issuers and investors with guidance on the definition of funds from operations (“FFO”) and adjusted funds from operations (“AFFO”) and to help promote more consistent disclosure from reporting issuers. The REIT’s method of calculating FFO and AFFO is substantially in accordance with REALPAC’s recommendations, but may differ from other issuers’ methods and, accordingly, may not be comparable to FFO and AFFO, respectively, reported by other issuers.
The REIT defines FFO as IFRS Accounting Standards consolidated net income or loss adjusted for items such as unrealized changes in the estimated fair value of investment properties, the effect of changes in value of puttable instruments classified as financial liabilities, property taxes accounted for under IFRS Interpretations Committee 21 Levies, transaction costs expensed as a result of the purchase of a property being accounted for as a business combination, transaction costs expensed as a result of the issuance of Convertible Debentures (as defined herein), changes in the fair value of financial instruments which are economically effective hedges but do not qualify or were not designated for hedge accounting, losses on extinguishment of debt, operational revenue and expenses from right of use assets, transaction costs expensed as a result of property dispositions and restructuring costs. FFO should not be construed as an alternative to net loss or cash flows provided by or used in operating activities determined in accordance with IFRS Accounting Standards. The REIT regards FFO as a key measure of operating performance.
The REIT defines AFFO as FFO adjusted for items such as actual maintenance capital expenditures incurred and straight-line rental revenue differences. AFFO should not be construed as an alternative to net loss or cash flows provided by or used in operating activities determined in accordance with IFRS Accounting Standards. The REIT regards AFFO as a key measure of operating performance.
FFO per Unit and AFFO per Unit
“FFO per Unit” is defined as FFO divided by the weighted average Unit count for the period, which is representative of the combined REIT Units, holders of Class B units of BSR Trust (“Class B Units”) and issued deferred units of the REIT granted to trustees (“Deferred Units”).
“AFFO per Unit” is defined as AFFO divided by the weighted average Unit count for the period, which is representative of the combined REIT Units, Class B Units and Deferred Units.
The REIT regards FFO per Unit and AFFO per Unit as an important measure to further evaluate the performance of FFO and AFFO on a per Unit basis in order to normalize for changes driven by unit issuances and therefore better compare the REIT’s performance period to period.
AFFO Payout Ratio
“AFFO Payout Ratio” is defined as total cash distributions of the REIT (including distributions on Class B Units) divided by AFFO. The REIT uses the AFFO Payout Ratio in assessing its distribution paying capacity.
5
BSR REAL ESTATE INVESTMENT TRUST
Management’s Discussion and Analysis of Financial Condition and Results of Operations
for the three months ended March 31, 2025
Amounts in thousands of U.S. dollars (except for unit amounts, per unit amounts and as otherwise noted)
Gross Book Value
“Gross Book Value” means the book value of the total assets of the REIT and its consolidated subsidiaries, as shown on its then most recent consolidated statement of financial position prepared in accordance with IFRS Accounting Standards.
Debt to Gross Book Value Ratio
“Debt to Gross Book Value Ratio” is calculated by dividing debt, which consists of total loans and borrowings and Convertible Debentures, by Gross Book Value.
Liquidity
“Liquidity” is defined as (a) cash and cash equivalents (unrestricted), plus (b) borrowing capacity available under any existing credit facilities. This metric is a useful measure of the REIT’s cash resources and credit available under committed credit facilities.
Net Asset Value and Net Asset Value per Unit
Net Asset Value (“NAV”) is calculated as the sum of the value of Unitholders’ equity and Class B Units as of the balance sheet date. NAV is a useful measure of the overall value of the REIT’s investment properties (net of outstanding debt) as of a point in time and also serves as a measure to depict the overall value driven from the performance of the REIT’s assets.
“NAV per Unit” is calculated by dividing NAV by the number of Units, Class B Units and issued Deferred Units outstanding as of the balance sheet date. The REIT regards NAV per Unit as an important measure to further evaluate the performance of NAV in order to normalize for changes driven by unit issuances and therefore better compares the REIT’s overall value.
6
BSR REAL ESTATE INVESTMENT TRUST
Management’s Discussion and Analysis of Financial Condition and Results of Operations
for the three months ended March 31, 2025
Amounts in thousands of U.S. dollars (except for unit amounts, per unit amounts and as otherwise noted)
BUSINESS OVERVIEW
The REIT is an internally managed, unincorporated, open-ended real estate investment trust governed by the third amended and restated declaration of trust of the REIT dated May 11, 2022 (the “Declaration of Trust”), as it may be further amended and restated from time to time, and established under the laws of the Province of Ontario. A copy of the Declaration of Trust is available on SEDAR+ at www.sedarplus.ca and print copies are available upon request. The REIT has been formed for the purpose of acquiring and owning multifamily real estate properties.
The objectives of the REIT are to:
| · | provide holders of Units (“Unitholders”) with an opportunity to invest in a portfolio of quality multifamily real estate properties located in attractive U.S. markets having outsized estimated employment and population growth as well as diverse economies including industry, government and education, with a particular focus on the Sunbelt region which is generally considered the southeastern and southwestern regions of the United States. The REIT currently operates in Texas, Oklahoma and Arkansas; | |
| · | enhance the value of the REIT’s assets and maximize long-term Unit value through active internal asset and property management programs and procedures; | |
| · | expand the asset base of the REIT and increase the REIT’s AFFO per Unit and NAV per Unit primarily through acquisitions in attractive growth markets, improvement of its properties using targeted capital expenditures; and | |
| · | provide Unitholders with predictable, sustainable, growing and tax efficient cash distributions. |
Prior to the closing of the IPO, ownership and profit interests in BSR Trust were held by approximately 400 members (the “Legacy BSR Holders”). Upon closing of the IPO, and following certain pre-closing reorganization events involving BSR Trust, a subsidiary of the REIT merged with and into BSR (the “Merger”), with BSR Trust continuing as the surviving entity. As a result, the REIT holds all of the Class A Units of BSR Trust (“Class A Units”) and the portfolio of properties are indirectly held by the REIT, through its indirect ownership of BSR Trust. Class A Units are not economically equivalent to the Units in any regard and do not carry a voting right with respect to matters put before Unitholders of the REIT for a vote. In connection with the Merger, all of the issued and outstanding securities of BSR Trust held by the Legacy BSR Holders were exchanged for 23,158,226 new Class B Units pursuant to a prescribed exchange formula taking into account the relative economic terms of the different classes of securities of BSR Trust. The Class B Units are economically equivalent to Units and are redeemable by the holder thereof for cash or Units (on a one-for-one basis subject to customary anti-dilution adjustments), as determined by BSR in its sole discretion. However, Class B Units do not carry a voting right with respect to matters put before Unitholders of the REIT for vote. The Class B Units are non-voting as a result of tax considerations applicable to the cross-border REIT structure, and do not give the holders of Class B Units any enhanced economic or voting power at the REIT level relative to voting public Unitholders. Accordingly, the Class B Units do not create a traditional dual-class voting structure of the REIT.
On January 9, 2025, the REIT acquired Venue Craig Ranch Apartments, a 277-unit garden-style community in McKinney, TX (Dallas MSA) for a contractual purchase price of $61.0 million. The REIT funded the transaction using the Credit Facility availability.
On February 27, 2025, the REIT announced that it had entered into agreements to sell an aggregate of nine properties, consisting of 2,701 apartment units, to AvalonBay Communities, Inc. (“AvalonBay” or “AVB”) (NYSE: AVB) for a stated aggregate contractual purchase price of $618.5 million (collectively, the “Transaction”). On March 31, 2025, pursuant to the Transaction, the REIT closed the sale to AVB of three Austin properties (Cielo I, Cielo II and Retreat at Wolf Ranch) for cash proceeds of $187.0 million (the “Direct Asset Sale Transaction”), completing the Direct Asset Sale Transaction portion of the Transaction. On April 30, 2025, the REIT closed the contribution transaction (the “Contribution Transaction”) pursuant to which BSR Trust sold six properties (Auberry at Twin Creeks, Aura Benbrook, Lakeway Castle Hills, Satori Frisco, Vale Frisco and Wimberly) comprising 1,844 apartment units located in Dallas, TX to AVB valued at $431.5 million in the aggregate. Under the Contribution Transaction, BSR Trust received $193.0 million in cash, a portion of which was used to extinguish all existing mortgage debt on the contributed properties, and the remainder of which is anticipated to be used for repayment of other indebtedness, transaction expenses and general corporate purposes, including future acquisitions. In addition, the previously announced participation offer under the Contribution Transaction was fully subscribed, resulting in the cancellation on April 30, 2025, of 15,000,000 (approximately 75%) of the Class B Units, which Class B Units were exchanged for equity of a newly formed “DownREIT” partnership of AVB. In connection with the Contribution Transaction, the contractual rights held by a subset of legacy holders of Class B Units, including consent rights over certain fundamental sale transactions, were eliminated.
7
BSR REAL ESTATE INVESTMENT TRUST
Management’s Discussion and Analysis of Financial Condition and Results of Operations
for the three months ended March 31, 2025
Amounts in thousands of U.S. dollars (except for unit amounts, per unit amounts and as otherwise noted)
As the 1,844 apartment units of the Contribution Transaction were sold after March 31, 2025, these apartment units and the performance of the six aforementioned properties are considered Same Community properties within this document for the three months ended March 31, 2025. As the Contribution Transaction closed on April 30, 2025, they will be considered Non-Same Community properties beginning with the second quarter of 2025.
For further information on the Transaction, please reference the REIT’s announcement of the Transaction on February 27, 2025. The Material Change Report, including a copy of the agreements which governed both the Contribution Transaction and Direct Asset Sale Transaction is available under the REIT’s profile on SEDAR+ at www.sedarplus.ca.
Certain of the Legacy BSR Holders are members or affiliates of the Bailey family or are members or affiliates of the Hughes family (collectively, the “Bailey/Hughes Holders”), who together founded BSR. As of March 31, 2025, the Bailey/Hughes Holders together owned 16,079,276 Class B Units and 4,886,506 Units, together representing an approximate 39.1% ownership interest in the REIT (determined as if all Class B Units are redeemed for Units). Following the completion of the Contribution Transaction, as of April 30, 2025, the Bailey/Hughes Holders together owned 3,239,398 Class B Units and 4,020,584 Units, together representing an approximate 18.8% ownership interest in the REIT (determined as if all Class B Units are redeemed for Units).
On March 24, 2025, the REIT sold Bluff Creek Apartments, a 316 unit apartment community located in Oklahoma City, OK, for a contractual purchase price of $28.3 million.
On March 31, 2025, the REIT completed the previously announced Direct Asset Sale Transaction, which included the sale of Cielo I, Cielo II and Retreat at Wolf Ranch, spanning 857 apartment units to AvalonBay for a contractual purchase price of $187.0 million in cash. In connection with this portion of the Transaction, BSR retained $109.4 million of secured Fannie Mae mortgage indebtedness with an attractive interest rate of approximately 2.7%, which was previously secured by the three assets included in the Direct Asset Sale Transaction.
For the Dispositions mentioned above, unless otherwise noted, existing loans and borrowings were not assumed by the REIT or the purchasers. Proceeds from the Dispositions were used to repay loans and borrowings and to fund future acquisitions.
As of March 31, 2025, the REIT owned 29 multifamily garden-style residential properties consisting of 8,008 apartment units. 88% of the apartment units are located in Texas, 8% in Oklahoma and 4% in Arkansas. The investment guidelines of the REIT are outlined in the Declaration of Trust. As of March 31, 2025, the REIT was in compliance with all investment guidelines and operating policies stipulated in the Declaration of Trust.
8
BSR REAL ESTATE INVESTMENT TRUST
Management’s Discussion and Analysis of Financial Condition and Results of Operations
for the three months ended March 31, 2025
Amounts in thousands of U.S. dollars (except for unit amounts, per unit amounts and as otherwise noted)
HIGHLIGHTS
Highlights1
| · | Same Community revenue for the three months ended March 31, 2025 (“Q1 2025) increased 0.6% over the three months ended March 31, 2024 (“Q1 2024”); | |
| · | Same Community NOI for Q1 2025 increased 2.3% compared to Q1 2024; | |
| · | Weighted average occupancy was 95.9% as of March 31, 2025, compared to 95.3% as of March 31, 2024; | |
| · | During Q1 2025, the REIT’s AFFO payout ratio was 63.8%; | |
| · | Debt to Gross Book Value was 45.3% as of March 31, 2025 which decreased 120 basis points from 46.5% as of December 31, 2024; | |
| · | On January 3, 2025, the REIT redeemed all issued and outstanding convertible subordinated debentures (“Convertible Debentures”) for $41.5 million, plus accrued and unpaid interest; | |
| · | On January 9, 2025, the REIT acquired Venue Craig Ranch, a 277-apartment unit community in McKinney, TX (Dallas MSA) for $61.0 million; | |
| · | On February 27, 2025, the REIT announced the strategic disposition of $618.5 million of assets to AvalonBay, unlocking value embedded in stabilized assets and further positioning BSR for future growth. The Transaction was expected to be completed in two phases: the Direct Asset Sale Transaction (which closed on March 31, 2025, see below) and the Contribution Transaction (which closed subsequent to quarter end, see below). Based on the potential impact of the Transaction, the REIT is temporarily suspending guidance but intends to revisit the release of 2025 guidance in a future period; | |
| · | On March 24, 2025, the REIT sold Bluff Creek Apartments, a 316 apartment unit community located in Oklahoma City, OK for $28.3 million; and | |
| · | On March 31, 2025 the REIT completed the Direct Asset Sale Transaction portion of the Transaction by selling Cielo I, Cielo II and Retreat at Wolf Ranch comprising 857 apartment units located in Austin, TX, for a price of $187.0 million. |
Subsequent Highlights
| · | On April 3, 2025, the REIT entered into a new receive-variable based USD-SOFR CME/pay fixed interest rate swap with a notional value of $150.0 million at a fixed rate of 2.88% effective July 1, 2025, and maturing July 1, 2030, subject to the counterparty’s optional early termination date of July 1, 2027. | |
| · | On April 30, 2025, the REIT closed the Contribution Transaction, pursuant to which BSR Trust sold six properties (Auberry at Twin Creeks, Aura Benbrook, Lakeway Castle Hills, Satori Frisco, Vale Frisc and Wimberly) comprising 1,844 apartment units located in Dallas, TX to AVB for $431.5 million. Under the Contribution Transaction, BSR Trust received $193.0 million in cash, and the balance through the cancellation of 15,000,000, or 75% of the outstanding Class B Units of the REIT, BSR used a portion of the cash to extinguish all existing mortgage debt on the contributed properties, and the remainder is to be used for the repayment of other indebtedness, transaction expenses and general corporate purposes, including future acquisitions. |
| 1 | This section refers to certain non-GAAP measures including NAV per Unit, FFO per Unit, AFFO per Unit, Same Community, AFFO Payout Ratio and Debt to Gross Book Value. These measures are not recognized under IFRS Accounting Standards and do not have standardized meanings prescribed by IFRS Accounting Standards. For definitions, reconciliations and the basis of presentation of the REIT’s non-GAAP measures, refer to sections “Non-GAAP Measures” and “Reconciliation of Non-GAAP Measures”. |
9
BSR REAL ESTATE INVESTMENT TRUST
Management’s Discussion and Analysis of Financial Condition and Results of Operations
for the three months ended March 31, 2025
Amounts in thousands of U.S. dollars (except for unit amounts, per unit amounts and as otherwise noted)
OUTLOOK
Management believes characteristics and trends in the REIT’s target markets in the United States multifamily sector suggest these markets are an attractive investment. These trends include, but are not limited to, (i) favourable supply and demand fundamentals driven by demographics and declining homeownership rates, (ii) compelling population, demographic and job growth characteristics, (iii) historically large multifamily transaction volume and external growth opportunities in the U.S., (iv) an absence of rent control policies, (v) regulatory frameworks that tend to be more landlord-friendly and (vi) the development of significant new product and repurposing of older product. Together, these factors suggest to the REIT’s management that U.S. multifamily assets, and in particular those located in the REIT’s key target markets, may experience stronger cash flow growth and property value appreciation.
Compared to other real estate sectors, the shorter lease durations of the multifamily sector can provide a natural hedge against inflation. Unprecedented demand for housing in 2021, coupled with favourable low cost of financing, drove a wave of development resulting in an increase in new deliveries in the second half of 2023 and 2024. Nevertheless, migration continues into the REIT’s primary markets, from the east and west coasts of the United States, and the new supply is anticipated to be absorbed in the second half of 2025 and early 2026. The pace of new development slowed as interest rates continued to rise in 2023, and the resulting slowdown in deliverables is expected to render additional rent growth in 2026 and 2027. Annual rent as a percentage of median household income in the REIT’s core markets averages less than 25.0%. Management believes these dynamics, when coupled with REIT’s average lease term of 14 months, could portend additional rent growth in future periods.
Acquisition Strategy
As an established regional owner and operator of multifamily communities, the REIT expects to leverage its concentrated regional scale and internal management platform to make acquisitions primarily in the attractive markets within the Sunbelt region consistent with its proven acquisition strategy. The REIT’s acquisitions to-date reflect its strategy of acquiring modern properties, clustered in target markets with above average population growth. The REIT will continue to seek acquisition targets in high growth markets, such as certain markets in Texas. There continues to be strong investor demand for high-quality, well-located properties in the REIT’s operating regions of the country, causing capitalisation rates to adjust slower than the higher interest rate environment. Management will continue to opportunistically acquire new communities when accretive to the REIT.
In addition, the REIT consistently reviews its portfolio with the goal of opportunistically recycling capital to maximize total Unitholder returns, by selling non-core properties that no longer meet the long-term growth strategy and allowing the REIT to redeploy capital to properties in high growth markets where it can maximize the platform’s capabilities. The recently announced Transaction with AVB combined with the sale of Bluff Creek Apartments demonstrates management’s commitment to these initiatives. Management anticipates that proceeds from the Dispositions will be redeployed as described.
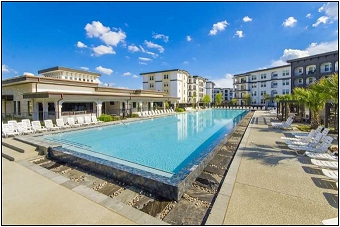
Palermo by the Park – Dallas, Texas MSA
10
BSR REAL ESTATE INVESTMENT TRUST
Management’s Discussion and Analysis of Financial Condition and Results of Operations
for the three months ended March 31, 2025
Amounts in thousands of U.S. dollars (except for unit amounts, per unit amounts and as otherwise noted)
Current Portfolio
As of March 31, 2025, the REIT currently owns 29 multifamily garden-style residential properties consisting of 8,008 apartment units, located in Texas, Oklahoma and Arkansas. With a primary focus on resident experience, our properties include many modern features and amenities such as resort style swimming pools, splash pads, upscale clubhouses, modern fitness centers, dog parks, pet care centers, garages and covered parking, bicycle storage, cinemas, private work pods, conference rooms, business centers, community game rooms, and outdoor barbeque areas.
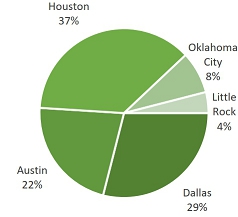
The following chart depicts the percentage of total NOI by Metropolitan Service Area (“MSA”) for the current portfolio of properties within the REIT’s markets of Austin, Dallas, Houston, Oklahoma City and Little Rock.
Percentage of NOI by MSA for Current Portfolio*
 Dallas Dallas |
 Austin
 |
 Houston Houston |
 Oklahoma City
 |
 Little
Rock Little
Rock |
*Current portfolio NOI excludes NOI from properties disposed through May 7, 2025, and includes pro forma NOI for properties in lease-up.
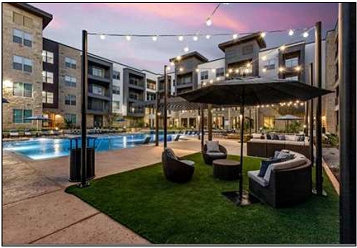
Aura 35Fifty – Austin, TX MSA

Hangar 19 – Dallas, TX MSA

Vale Luxury – Houston, TX MSA
11
BSR REAL ESTATE INVESTMENT TRUST
Management’s Discussion and Analysis of Financial Condition and Results of Operations
for the three months ended March 31, 2025
Amounts in thousands of U.S. dollars (except for unit amounts, per unit amounts and as otherwise noted)
The weighted average monthly rent on in-place leases for the Same Community portfolio was $1,492 per apartment unit as of March 31, 2025 compared to $1,513 as of March 31, 2024. During Q1 2025, excluding short term leases, rental rates for new leases and renewals changed -7.3% and 0.1%, respectively, resulting in a -3.2% blended decrease over the prior leases. This blended decrease is expected to reverse in 2025, setting the stage for potential increases in rental revenue in 2026, as supply in our core markets is absorbed with minimal new product expected to be added over the next 24 months.
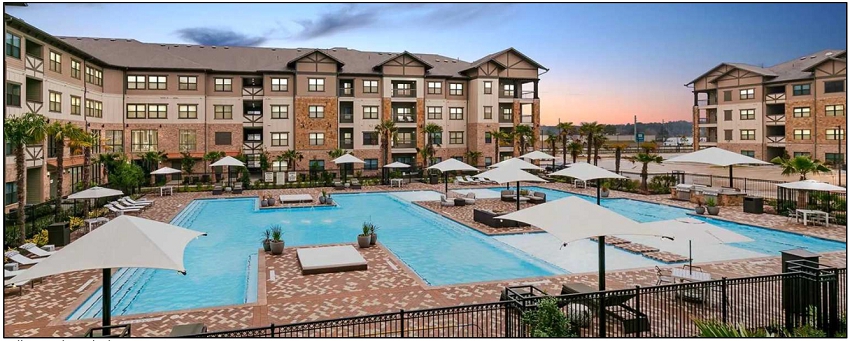
Adley at Gleannloch – Houston, TX MSA
ENVIRONMENTAL, SOCIAL AND GOVERNANCE
At our core, BSR is focused on our company’s impact on our residents, employees, stakeholders and communities where we operate and serve. The mission of BSR is to provide an exceptional living experience for residents at a community they are proud to call home while creating value for our Unitholders through strength, profitability and growth. BSR conducts business with integrity and strives for the highest ethical standards by always treating partners, team members, residents and vendors with respect, honesty and fairness. We believe that any interaction with our company should be a genuinely positive experience, and we believe in leaving things better than we found them. This ideology has been integral to our success since the roots of the formation of BSR in 1956.
The REIT’s Environmental and Social Responsibility Policy outlines the REIT’s approach to environmental sustainability and social responsibility from a corporate governance perspective as well as the REIT’s commitments to embed these practices into its business model. Additionally, the REIT’s enhanced Diversity Policy (the “Diversity Policy”) reflects the REIT’s commitment toward adding additional members to the REIT’s board of trustees (the “Board”) and senior management team with diversity in business and other professional experience, gender, geography, age, race and ethnicity.
The following is an outline of the REIT’s ongoing efforts to summarize our organization’s impact:
Environmental
BSR is committed to operating in an environmentally responsible manner, and we continue to identify and implement innovative practices that promote sustainability and resilience.
| · | BSR has upgraded 5,332 apartment units with smart home and energy management technology. This results in an energy reduction of up to 15-20% for our residents and around 50% savings for any vacant BSR apartment units under this program. | |
| · | BSR invests in smart waste management across all properties to optimize dumpster capacity and identify contamination issues. |
12
BSR REAL ESTATE INVESTMENT TRUST
Management’s Discussion and Analysis of Financial Condition and Results of Operations
for the three months ended March 31, 2025
Amounts in thousands of U.S. dollars (except for unit amounts, per unit amounts and as otherwise noted)
| · | Utilities for 70% of BSR properties are sub-metered. On average, properties that are sub-metered are 38% more efficient than non-sub-metered properties. | |
| · | BSR uses a third-party utility biller providing vacant apartment unit charge backs, energy consumption variance reporting, pre-acquisition energy audits and detection of water leaks. | |
| · | BSR uses smart irrigation systems to conserve water usage through the analysis of weather data. | |
| · | Air filters in BSR suites are changed and inspected on a quarterly basis. | |
| · | When performing renovations, BSR uses low-flow toilets, LED lighting, high efficiency fixtures and Energy Star approved appliances. | |
| · | BSR offers virtual signatures on leasing documents, paperless rent payments, and service requests. | |
| · | Multiple BSR communities have electric vehicle charging stations for resident use. | |
| · | When identifying properties to acquire, the REIT obtains a Phase I environmental report conducted by independent and experienced consultants prior to an acquisition, and if recommended, the REIT also obtains a Phase II environmental report. |
Social
Residents
BSR is committed to providing healthy and safe living spaces as well as exceptional customer service to our residents.
| · | J Turner Research publishes Online Reputation Assessment (“ORA”) scores between 1 and 100, measuring online review sentiment for all multifamily properties across the United States. BSR’s score consistently ranks in the Top 5 of publicly traded multifamily REITs. BSR placed second with an ORA score of 81.29 for 2024 while the national average ORA score of all U.S. multifamily properties was 62.05. | |
| · | J Turner Research announced its Elite 1% list in February 2024 which included four BSR properties. Further, BSR was ranked 23rd of approximately 500 public and private multifamily companies for the highest percentage of its portfolio in the Elite 1%. | |
| · | BSR provides its residents access to a credit builder program, which reports on-time rent payment history and paid-in-full status to TransUnion and Equifax to help residents build better credit scores. | |
| · | To encourage resident health, wellness and quality of life, 100% of BSR’s apartment communities have on-site pools and fitness centers. | |
| · | 44% of BSR employees chose to live alongside our residents at our communities. This shows the level of pride BSR team members have in our product and also enhances the experience and service provided for all of our residents. |
Employees
BSR is committed to maintaining a workplace culture that attracts, retains and rewards the best and brightest people.
| · | BSR is committed to providing a diverse and inclusive workforce. We currently have 46% female and 54% male team members, approximately 64% of which are racially diverse. | |
| · | For the third year in a row, BSR was named one of the Best Places to Work in Multifamily, and Best Places to Work in Multifamily for Women at the Multifamily Innovation Awards held in December 2024. | |
| · | BSR performs a company-wide Team Member Satisfaction Survey every year, and the feedback is meticulously reviewed by our executive team. Results are shared throughout the organization, along with action items resulting from the feedback in the survey. A few key responses are highlighted below: |
| o | 94% of our team members say BSR provides them the opportunity to excel in their position through professional development and in-house training. | |
| o | 91% of our team members are proud of BSR’s brand. | |
| o | 99% of our team members say BSR operates in a socially responsible manner. | |
| o | 96% of our team members say BSR’s work positively impacts people’s lives. | |
| o | 92% of our team members are satisfied with the workplace flexibility offered by BSR. |
13
BSR REAL ESTATE INVESTMENT TRUST
Management’s Discussion and Analysis of Financial Condition and Results of Operations
for the three months ended March 31, 2025
Amounts in thousands of U.S. dollars (except for unit amounts, per unit amounts and as otherwise noted)
| o | 94% of our team members are satisfied with BSR’s investment in training and education. | |
| o | 91% of our team members are inspired to give their best effort at work each day. | |
| o | 87% of our team members are satisfied with BSR’s total benefits package. | |
| o | 88% of our team members are satisfied with the amount of paid leave offered by BSR. |
| · | BSR provided $1.8 million of employee rent discounts at BSR communities in 2024. | |
| · | BSR’s Career Succession Program provides a framework for employees to reach their career goals at BSR. In 2024, we promoted 20 team members internally. | |
| · | Our comprehensive training program of over 1,000 courses offers many options for team members including on-demand, virtual live instruction and in-person training. Many courses are available in both English and Spanish. Topics include fair housing and safety compliance, team member orientation, sales, management development, and virtual reality maintenance skills training. In 2024, BSR employees completed 3,198 courses. | |
| · | BSR’s Team Member Appreciation Month is a special time to show appreciation to our team members for serving our residents well. | |
| · | Our annual Celebration of Excellence Award Ceremony recognizes our on-site management teams and the corporate team with awards based on job performance. Our most recent Celebration of Excellence was held in February 2025 in Austin, Texas. | |
| · | Each quarter, we celebrate team member achievements in our internal newsletter and intranet. | |
| · | BSR team members have an opportunity to become “BSR Certified” which consists of completing orientation training and taking a certification exam with one of our area proctors. Certifications are available for the following positions: Community Manager, Assistant Community Manager, Leasing Specialist and Service Manager. Team members can pass a test on a variety of position related policies and procedures to show they have a working knowledge of their role. | |
| · | BSR’s human resources’ department hosts in-person roadshows to each of our MSAs to objectively review BSR’s comprehensive benefits package with employees. | |
| · | BSR has kept voluntary employee turnover below the industry average (27.5% in 2024 compared to the industry average of 34.8%). Further, the average tenure of our employees is four years. |
Community
| · | BSR formed the Home Away from Home Foundation in 2021. The non-profit initiative provides apartment homes for those needing to travel for extended medical treatment and requiring temporary housing as well as for individuals who need temporary housing due to natural disasters. | |
| · | In 2024, BSR dedicated an apartment home in Little Rock, Arkansas to a family that lost their residence because of a catastrophic event. | |
| · | In 2024, BSR has provided lodging at a BSR property for a family receiving long term medical treatment. | |
| · | BSR maintains an active partnership with local colleges for yearly summer internship opportunities. | |
| · | BSR team members are actively involved in community and non-profit volunteering resulting in the selection of employees in various watch lists like “40 Under 40” and “20 in their 20s”. |
Governance
BSR is committed to good corporate governance to maximize shareholder value in a manner consistent with the highest standards of integrity.
| · | The Board maintains oversight of the individual committees’ responsibilities and environmental, social and governance (“ESG”) matters as a whole, along with overall enterprise risk management. | |
| · | Our executive management team maintains regular contact with a broad base of investors. | |
| · | BSR maintains high quality IT infrastructure and active cybersecurity monitoring and protection initiatives. | |
| · | BSR leadership and audit committee chair actively monitor our third-party anonymous whistleblower hotline. |
14
BSR REAL ESTATE INVESTMENT TRUST
Management’s Discussion and Analysis of Financial Condition and Results of Operations
for the three months ended March 31, 2025
Amounts in thousands of U.S. dollars (except for unit amounts, per unit amounts and as otherwise noted)
| · | Our Board survey is conducted every year, which is collectively discussed and reviewed to gauge completeness and effectiveness of corporate governance. | |
| · | BSR maintains a code of business conduct and ethics, as well as a disclosure and confidential information policy. | |
| · | BSR has a non-discrimination policy which protects residents and prospective residents from discrimination based on race, color, national origin, religion, sex, family status and disability as covered under the Fair Housing Act. | |
| · | BSR maintains an employee handbook which is accessible by all team members. | |
| · | BSR has a Diversity Policy that reflects our commitment toward adding additional members to the Board and senior management team with diversity in business and other professional experience, gender, geography, age, race and ethnicity. BSR’s Board has 29% female representation and 71% male representation. |
BUSINESS PERFORMANCE MEASURES
The following table highlights certain key business performance measures as of March 31, 2025, compared to March 31, 2024.
| March 31, 2025 | March 31, 2024 | |||
| Number of investment properties | 29 | 31 | ||
| Total apartment units | 8,008 | 8,666 | ||
| Average monthly in-place leases | $1,503 | $1,502 | ||
| Average monthly in-place leases - Same Community Properties | $1,492 | $1,513 | ||
| Weighted average ending occupancy rate | 95.9% | 95.3% | ||
| Retention rate | 56.9% | 52.3% |
The following table highlights certain key business performance measures as of March 31, 2025, compared to December 31, 2024.
| March 31, 2025 | December 31, 2024 | |||
| Weighted average contractual interest rate of all loans and borrowings and Convertible Debentures 1 | 3.8% | 3.9% | ||
| Weighted average contractual interest rate of all loans and borrowings | 3.8% | 3.8% | ||
| Weighted average contractual mortgage interest rate | 3.3% | 3.5% | ||
| Weighted average debt term of all loans and borrowings (in years) | 2.7 | 2.9 | ||
| Weighted average mortgage debt term (in years) | 3.6 | 3.7 | ||
| Unitholders' equity | $612,880 | $657,596 | ||
| Debt to Gross Book Value * | 45.3% | 46.5% | ||
| NAV * | $899,486 | $901,308 | ||
| NAV per Unit * | $16.66 | $16.75 |
*These measures are not recognized under and do not have standardized meanings prescribed by IFRS Accounting Standards. For definitions, reconciliations and the basis of presentation of the REIT’s non-GAAP measures, refer to sections “Non-GAAP Measures” and “Reconciliation of Non-GAAP Measures”.
1 The REIT redeemed all issued and outstanding Convertible Debentures on January 3, 2025, prior to their maturity on September 30, 2025. Refer to sections “Liquidity and Capital Resources” for additional information.
15
BSR REAL ESTATE INVESTMENT TRUST
Management’s Discussion and Analysis of Financial Condition and Results of Operations
for the three months ended March 31, 2025
Amounts in thousands of U.S. dollars (except for unit amounts, per unit amounts and as otherwise noted)
The following table highlights certain key financial performance measures of the REIT for the three months ended March 31, 2025, compared to the three months ended March 31, 2024:
| Three
months ended March 31, 2025 | Three
months ended March 31, 2024 | Change | ||||||||||
| Revenue | $ | 43,476 | $ | 41,983 | $ | 1,493 | ||||||
| Revenue, Same Community * Properties | $ | 36,709 | $ | 36,506 | $ | 203 | ||||||
| Revenue, Non-Same Community * Properties | $ | 6,767 | $ | 5,477 | $ | 1,290 | ||||||
| Net loss and comprehensive loss | $ | (40,848 | ) | $ | (1,571 | ) | $ | (39,277 | ) | |||
| NOI * | $ | 24,030 | $ | 23,839 | $ | 191 | ||||||
| NOI *, Same Community * Properties | $ | 20,918 | $ | 20,444 | $ | 474 | ||||||
| NOI *, Non-Same Community * Properties | $ | 3,112 | $ | 3,395 | $ | (283 | ) | |||||
| NOI Margin * | 55.3% | 56.8% | (150) bps | |||||||||
| NOI Margin *, Same Community * Properties | 57.0% | 56.0% | 100 bps | |||||||||
| NOI Margin *, Non-Same Community * Properties | 46.0% | 62.0% | (1,600) bps | |||||||||
| FFO * | $ | 12,433 | $ | 13,617 | $ | (1,184 | ) | |||||
| FFO per Unit * | $ | 0.23 | $ | 0.25 | $ | (0.02 | ) | |||||
| Maintenance capital expenditures | $ | (549 | ) | $ | (713 | ) | $ | 164 | ||||
| Straight line rental revenue differences | $ | (97 | ) | $ | (16 | ) | $ | (81 | ) | |||
| AFFO * | $ | 11,787 | $ | 12,888 | $ | (1,101 | ) | |||||
| AFFO per Unit * | $ | 0.22 | $ | 0.24 | $ | (0.02 | ) | |||||
| AFFO Payout Ratio * | 63.8% | 53.9% | 990 bps | |||||||||
| Weighted average unit count | 53,905,295 | 53,856,476 | 48,819 | |||||||||
*These measures are not recognized under and do not have standardized meanings prescribed by IFRS Accounting Standards. For definitions, reconciliations and the basis of presentation of the REIT’s non-GAAP measures, refer to sections “Non-GAAP Measures” and “Reconciliation of Non-GAAP Measures”.
16
BSR REAL ESTATE INVESTMENT TRUST
Management’s Discussion and Analysis of Financial Condition and Results of Operations
for the three months ended March 31, 2025
Amounts in thousands of U.S. dollars (except for unit amounts, per unit amounts and as otherwise noted)
Financial Summary for Q1 2025
Total portfolio revenue of $43.5 million for Q1 2025 increased 3.6% compared to $42.0 million for Q1 2024. This increase was the result of contributions of $1.3 million from the Property Acquisition, $0.2 million from Same Community properties (discussed further below) and $0.2 million from the continued lease-up on the Non-Stabilized Property, partially offset by the Property Dispositions that reduced revenue by $0.3 million. Total revenue resulting from the Non-Stabilized Property will continue to improve in future periods as the lease-up progresses through to completion.
Same Community revenue of $36.7 million for Q1 2025 increased $0.2 million, or 0.6%, compared to $36.5 million for Q1 2024, primarily due to a $0.2 million increase in other property income, driven by enhanced resident participation in credit building services, and an increase in utility reimbursements. The increase in utility reimbursements was primarily due to increased preventative maintenance on water meters allowing an increase in the pass through of water charges as well as an increase in properties receiving valet trash service over the prior year.
The net loss and comprehensive loss change between Q1 2025 and Q1 2024 is primarily due to non-cash adjustments to fair value of investment properties, derivatives and other financial liabilities from December 31, 2024 to March 31, 2025 and December 31, 2023 to March 31, 2024, respectively, as well as the costs of dispositions of $5.2 million, and is not considered comparable period over period.
Total portfolio NOI for Q1 2025 of $24.0 million increased 0.8% from $23.8 million in Q1 2024. The increase was the result of the contribution of $0.7 million from the Property Acquisition, and $0.5 million from Same Community properties described below, partially offset by a decrease of $0.6 million from the Property Dispositions and $0.4 million from the Non-Stabilized Property.
The 2.3% increase in Same Community NOI for Q1 2025 of $20.9 million compared to $20.4 million in Q1 2024 was attributable to the increase in revenue described above as well as a $0.1 million decrease in operating expenses; the change is primarily related to (i) a $0.2 million decline in administrative expenses offset by a $0.1 million increase in payroll expenses, (ii) a $0.1 million net decrease in real estate taxes as a result of property refunds in excess of tax increases, and (iii) a $0.1 million decrease in the cost of property insurance.
FFO in Q1 2025 was $12.4 million, or $0.23 per Unit, compared to $13.6 million, or $0.25 per Unit, for Q1 2024. The decrease was primarily related to higher finance costs (net of finance income) associated with interest costs related to the Property Acquisition in January 2025 and the completion of the Non-Stabilized Property in the second half of 2024, partially offset by the increase in total portfolio NOI described above.
AFFO was $11.8 million, or $0.22 per Unit for Q1 2025 compared to $12.9 million, or $0.24 per Unit, for Q1 2024. The decrease in AFFO was primarily the result of the decrease in FFO discussed above.
NAV was $899.5 million, or $16.66 per unit, as of March 31, 2025 compared to $901.3 million, or $16.75 per unit, as of December 31, 2024. The decrease is primarily due to a slight reduction in the fair value of interest rate derivatives as well as the timing of costs associated with the AvalonBay Transaction.
17
BSR REAL ESTATE INVESTMENT TRUST
Management’s Discussion and Analysis of Financial Condition and Results of Operations
for the three months ended March 31, 2025
Amounts in thousands of U.S. dollars (except for unit amounts, per unit amounts and as otherwise noted)
The following table highlights key information about the properties as of March 31, 2025, organized by MSA for the full portfolio. The rental change rates shown for Q1 2025 are calculated as the average percentage change over the prior lease for new or renewed leases during the quarter, excluding short term leases.
| MSA | State | Number of Units | Avg
Rent Per Unit as of March 31, 2025 | Occupancy
Rate as of March 31, 2025 | Effective
New Lease Rate Change for Q1 2025 | Effective Renewal Lease Rate Change for Q1 2025 | Effective
Blended Lease Rate Change for Q1 2025 | ||||||||||||||||||||
| Austin | Texas | 1,079 | $ | 1,544 | 96.0% | (12.3% | ) | (2.7% | ) | (7.5% | ) | ||||||||||||||||
| Dallas | Texas | 3,225 | $ | 1,577 | 96.1% | (8.5% | ) | (0.6% | ) | (4.0% | ) | ||||||||||||||||
| Houston | Texas | 2,236 | $ | 1,525 | 96.3% | (3.7% | ) | 1.8% | (0.5% | ) | |||||||||||||||||
| Little Rock | Arkansas | 304 | $ | 1,114 | 93.4% | (7.7% | ) | 2.5% | (2.9% | ) | |||||||||||||||||
| Oklahoma City | Oklahoma | 649 | $ | 1,031 | 94.9% | (3.4% | ) | 1.7% | (1.1% | ) | |||||||||||||||||
| Total Same Community | 7,493 | $ | 1,492 | 96.0% | (7.3 | )% | 0.1% | (3.2% | ) | ||||||||||||||||||
The following table highlights key information about the properties as of March 31, 2025 and 2024, organized by MSA:
| March 31, 2025 | March 31, 2024 | ||||||||||||||||||||||||||
| MSA | State | Number
of Units | Avg
Rent Per Unit | Occupancy
Rate | Number of Units | Avg
Rent Per Unit | Occupancy
Rate | ||||||||||||||||||||
| Austin | Texas | 1,079 | $ | 1,544 | 96.0% | 1,079 | $ | 1,615 | 95.1 | % | |||||||||||||||||
| Dallas | Texas | 3,225 | $ | 1,577 | 96.1% | 3,225 | $ | 1,617 | 95.2 | % | |||||||||||||||||
| Houston | Texas | 2,236 | $ | 1,525 | 96.3% | 2,236 | $ | 1,517 | 95.7 | % | |||||||||||||||||
| Texas | 6,540 | $ | 1,554 | 96.2% | 6,540 | $ | 1,582 | 95.3 | % | ||||||||||||||||||
| Little Rock | Arkansas | 304 | $ | 1,114 | 93.4% | 304 | $ | 1,094 | 95.7 | % | |||||||||||||||||
| Oklahoma City | Oklahoma | 649 | $ | 1,031 | 94.9% | 649 | $ | 1,005 | 95.1 | % | |||||||||||||||||
| Total Same Community | 7,493 | $ | 1,492 | 96.0% | 7,493 | $ | 1,513 | 95.3 | % | ||||||||||||||||||
| Non-Same Community * | 515 | $ | 1,752 | 92.8% | 1,173 | $ | 1,437 | 94.7 | % | ||||||||||||||||||
| Total Portfolio | 8,008 | $ | 1,503 | 95.9% | 8,666 | $ | 1,502 | 95.3 | % | ||||||||||||||||||
*The figures for Number of Units, Average Rent Per Unit and Occupancy Rate for Non-Same Community are presented for properties owned as of March 31, 2025 and March 31, 2024, respectively, which excludes properties sold prior to that date as these properties were not owned as of the last day of the period. Additionally, the Occupancy Rate for Non-Same Community excludes the impact of the Non-Stabilized Property (consisting of 238 units as of March 31, 2025).
18
BSR REAL ESTATE INVESTMENT TRUST
Management’s Discussion and Analysis of Financial Condition and Results of Operations
for the three months ended March 31, 2025
Amounts in thousands of U.S. dollars (except for unit amounts, per unit amounts and as otherwise noted)
The following tables highlight key information about the properties for the three months ended March 31, 2025, compared to the three months ended March 31, 2024 organized by MSA:
| Three
months ended March 31, 2025 | Three
months ended March 31, 2024 | $ Change in | $ Change in | % Change in | % Change in | ||||||||||||||||||||||||||||||
| MSA | State | Revenue | NOI * | Revenue | NOI * | Revenue | NOI * | Revenue | NOI * | ||||||||||||||||||||||||||
| Austin | Texas | $ | 5,581 | $ | 2,929 | $ | 5,643 | $ | 3,199 | $ | (62 | ) | $ | (270 | ) | (1.1% | ) | (8.4 | )% | ||||||||||||||||
| Dallas | Texas | $ | 16,795 | $ | 10,157 | $ | 16,847 | $ | 9,469 | $ | (52 | ) | $ | 688 | (0.3% | ) | 7.3 | % | |||||||||||||||||
| Houston | Texas | $ | 11,070 | $ | 5,919 | $ | 10,799 | $ | 5,878 | $ | 271 | $ | 41 | 2.5% | 0.7 | % | |||||||||||||||||||
| Texas | $ | 33,446 | $ | 19,005 | $ | 33,289 | $ | 18,546 | $ | 157 | $ | 459 | 0.5% | 2.5 | % | ||||||||||||||||||||
| Little Rock | Arkansas | $ | 1,070 | $ | 605 | $ | 1,070 | $ | 593 | $ | - | $ | 12 | 0.0% | 2.0 | % | |||||||||||||||||||
| Oklahoma City | Oklahoma | $ | 2,193 | $ | 1,308 | $ | 2,147 | $ | 1,305 | $ | 46 | $ | 3 | 2.1% | 0.2 | % | |||||||||||||||||||
| Total Same Community | $ | 36,709 | $ | 20,918 | $ | 36,506 | $ | 20,444 | $ | 203 | $ | 474 | 0.6% | 2.3 | % | ||||||||||||||||||||
| Non-Same Community | $ | 6,767 | $ | 3,112 | $ | 5,477 | $ | 3,395 | $ | 1,290 | $ | (283 | ) | 23.6% | (8.3 | )% | |||||||||||||||||||
| Total Portfolio | $ | 43,476 | $ | 24,030 | $ | 41,983 | $ | 23,839 | $ | 1,493 | $ | 191 | 3.6% | 0.8 | % | ||||||||||||||||||||
*These measures are not recognized under and do not have standardized meanings prescribed by IFRS Accounting Standards. For definitions, reconciliations and the basis of presentation of the REIT’s non-GAAP measures, refer to sections “Non-GAAP Measures” and “Reconciliation of Non-GAAP Measures”.
19
BSR REAL ESTATE INVESTMENT TRUST
Management’s Discussion and Analysis of Financial Condition and Results of Operations
for the three months ended March 31, 2025
Amounts in thousands of U.S. dollars (except for unit amounts, per unit amounts and as otherwise noted)
SELECTED QUARTERLY FINANCIAL INFORMATION
| Three
months ended March 31, 2025 | Three
months ended December 31, 2024 | Three
months ended September 30, 2024 | Three
months ended June 30, 2024 | Three
months ended March 31, 2024 | Three
months ended December 31, 2023 | Three
months ended September 30, 2023 | Three
months ended June 30, 2023 | |||||||||||||||||||||||||
| Revenue: | ||||||||||||||||||||||||||||||||
| Rental revenue | $ | 38,295 | $ | 37,046 | $ | 37,130 | $ | 37,284 | $ | 37,122 | $ | 37,253 | $ | 37,124 | $ | 37,086 | ||||||||||||||||
| Other property income | 5,181 | 5,119 | 5,160 | 4,948 | 4,861 | 4,843 | 4,955 | 4,957 | ||||||||||||||||||||||||
| 43,476 | 42,165 | 42,290 | 42,232 | 41,983 | 42,096 | 42,079 | 42,043 | |||||||||||||||||||||||||
| Expenses (Income): | ||||||||||||||||||||||||||||||||
| Property operating expenses | 12,607 | 12,862 | 13,017 | 12,066 | 11,960 | 12,667 | 12,898 | 12,198 | ||||||||||||||||||||||||
| Real estate taxes | 29,259 | 1,015 | (314 | ) | (2,267 | ) | 28,395 | 336 | (1,327 | ) | (945 | ) | ||||||||||||||||||||
| General and administrative expenses | 2,544 | 2,445 | 2,340 | 2,503 | 2,507 | 1,939 | 2,446 | 2,595 | ||||||||||||||||||||||||
| Fair value adjustment to investment properties | 74 | 16,069 | (15,161 | ) | 30,683 | 38,718 | 70,987 | 111,080 | 71,805 | |||||||||||||||||||||||
| Fair value adjustment to investment properties (IFRIC 21) | (22,420 | ) | 6,552 | 7,332 | 8,327 | (22,211 | ) | 6,603 | 7,814 | 7,746 | ||||||||||||||||||||||
| Finance costs from operations | 11,573 | 10,593 | 11,305 | 11,425 | 11,576 | 10,953 | 10,570 | 10,320 | ||||||||||||||||||||||||
| Finance income from interest rate derivatives and note receivable | (2,556 | ) | (3,199 | ) | (3,585 | ) | (3,963 | ) | (3,895 | ) | (3,521 | ) | (3,436 | ) | (3,181 | ) | ||||||||||||||||
| Restructuring costs | — | — | — | — | — | 263 | — | — | ||||||||||||||||||||||||
| Costs of disposition of investment properties | 5,181 | — | — | — | — | — | — | — | ||||||||||||||||||||||||
| Distributions on Class B Units | 2,822 | 2,815 | 2,750 | 2,617 | 2,626 | 2,650 | 2,663 | 2,665 | ||||||||||||||||||||||||
| Depreciation of right-of-use asset | 33 | 34 | 33 | 34 | 33 | 33 | 34 | 33 | ||||||||||||||||||||||||
| Fair value adjustment to derivatives and other financial liabilities | 45,272 | (45,958 | ) | 63,049 | 19,729 | (26,153 | ) | 8,790 | (20,913 | ) | (15,107 | ) | ||||||||||||||||||||
| Fair value adjustment to unit-based compensation | (65 | ) | (848 | ) | 775 | 283 | (2 | ) | (74 | ) | (464 | ) | (170 | ) | ||||||||||||||||||
| 84,324 | 2,380 | 81,541 | 81,437 | 43,554 | 111,626 | 121,365 | 87,959 | |||||||||||||||||||||||||
| Net (loss) income and comprehensive (loss) income* | $ | (40,848 | ) | $ | 39,785 | $ | (39,251 | ) | $ | (39,205 | ) | $ | (1,571 | ) | $ | (69,530 | ) | $ | (79,286 | ) | $ | (45,916 | ) | |||||||||
*Net (loss) income and comprehensive (loss) income include non-cash adjustments to fair value of investment properties, derivatives and other financial liabilities, and are not considered comparable period over period.
20
BSR REAL ESTATE INVESTMENT TRUST
Management’s Discussion and Analysis of Financial Condition and Results of Operations
for the three months ended March 31, 2025
Amounts in thousands of U.S. dollars (except for unit amounts, per unit amounts and as otherwise noted)
| Three
months ended March 31, 2025 | Three
months ended December 31, 2024 | Three
months ended September 30, 2024 | Three
months ended June 30, 2024 | Three
months ended March 31, 2024 | Three
months ended December 31, 2023 | Three
months ended September 30, 2023 | Three
months ended June 30, 2023 | |||||||||||||||||||||||||
| Net (loss) income and comprehensive (loss) income* | $ | (40,848 | ) | $ | 39,785 | $ | (39,251 | ) | $ | (39,205 | ) | $ | (1,571 | ) | $ | (69,530 | ) | $ | (79,286 | ) | $ | (45,916 | ) | |||||||||
| Adjustments to arrive at FFO | ||||||||||||||||||||||||||||||||
| Distributions on Class B Units | 2,822 | 2,815 | 2,750 | 2,617 | 2,626 | 2,650 | 2,663 | 2,665 | ||||||||||||||||||||||||
| Fair value adjustment to investment properties | 74 | 16,069 | (15,161 | ) | 30,683 | 38,718 | 70,987 | 111,080 | 71,805 | |||||||||||||||||||||||
| Fair value adjustment to investment properties (IFRIC 21) | (22,420 | ) | 6,552 | 7,332 | 8,327 | (22,211 | ) | 6,603 | 7,814 | 7,746 | ||||||||||||||||||||||
| Property tax liability adjustment, net (IFRIC 21) | 22,420 | (6,552 | ) | (7,332 | ) | (8,327 | ) | 22,211 | (6,603 | ) | (7,814 | ) | (7,746 | ) | ||||||||||||||||||
| Fair value adjustment to derivatives and other financial liabilities | 45,272 | (45,958 | ) | 63,049 | 19,729 | (26,153 | ) | 8,790 | (20,913 | ) | (15,107 | ) | ||||||||||||||||||||
| Fair value adjustment to unit-based compensation | (65 | ) | (848 | ) | 775 | 283 | (2 | ) | (74 | ) | (464 | ) | (170 | ) | ||||||||||||||||||
| Restructuring costs | — | — | — | — | — | 263 | — | — | ||||||||||||||||||||||||
| Loss on extinguishment of debt | — | — | — | — | — | 176 | — | — | ||||||||||||||||||||||||
| Costs of disposition of investment properties | 5,181 | — | — | — | — | — | — | — | ||||||||||||||||||||||||
| Principal payments on lease liability | (36 | ) | (36 | ) | (36 | ) | (35 | ) | (34 | ) | (33 | ) | (33 | ) | (33 | ) | ||||||||||||||||
| Depreciation of right-to-use asset | 33 | 34 | 33 | 34 | 33 | 33 | 34 | 33 | ||||||||||||||||||||||||
| Funds from Operations ("FFO") * | $ | 12,433 | $ | 11,861 | $ | 12,159 | $ | 14,106 | $ | 13,617 | $ | 13,262 | $ | 13,081 | $ | 13,277 | ||||||||||||||||
| FFO per Unit * | $ | 0.23 | $ | 0.22 | $ | 0.23 | $ | 0.26 | $ | 0.25 | $ | 0.24 | $ | 0.23 | $ | 0.23 | ||||||||||||||||
| Adjustments to arrive at AFFO | ||||||||||||||||||||||||||||||||
| Maintenance capital expenditures | (549 | ) | (933 | ) | (1,067 | ) | (1,401 | ) | (713 | ) | (818 | ) | (1,141 | ) | (1,776 | ) | ||||||||||||||||
| Straight line rental revenue differences | (97 | ) | (51 | ) | 13 | 8 | (16 | ) | — | (2 | ) | 25 | ||||||||||||||||||||
| Adjusted Funds from Operations ("AFFO") * | $ | 11,787 | $ | 10,877 | $ | 11,105 | $ | 12,713 | $ | 12,888 | $ | 12,444 | $ | 11,938 | $ | 11,526 | ||||||||||||||||
| AFFO per Unit * | $ | 0.22 | $ | 0.20 | $ | 0.21 | $ | 0.24 | $ | 0.24 | $ | 0.22 | $ | 0.21 | $ | 0.20 | ||||||||||||||||
| AFFO Payout Ratio * | 63.8% | 68.9% | 65.9% | 54.5% | 53.9% | 58.3% | 61.6% | 63.9% | ||||||||||||||||||||||||
| Weighted average unit count | 53,905,295 | 53,805,811 | 53,789,870 | 53,838,699 | 53,856,476 | 55,799,773 | 56,930,050 | 57,199,497 | ||||||||||||||||||||||||
| Distributions declared | $ | 7,515 | $ | 7,498 | $ | 7,316 | $ | 6,929 | $ | 6,946 | $ | 7,256 | $ | 7,349 | $ | 7,369 | ||||||||||||||||
*These measures are not recognized under and do not have standardized meanings prescribed by IFRS Accounting Standards. For definitions, reconciliations and the basis of presentation of the REIT’s non-GAAP measures, refer to sections “Non-GAAP Measures” and “Reconciliation of Non-GAAP Measures”.
21
BSR REAL ESTATE INVESTMENT TRUST
Management’s Discussion and Analysis of Financial Condition and Results of Operations
for the three months ended March 31, 2025
Amounts in thousands of U.S. dollars (except for unit amounts, per unit amounts and as otherwise noted)
REVIEW OF SELECTED OPERATING INFORMATION
The following table highlights selected financial information of the REIT for the three months ended March 31, 2025, compared to the three months ended March 31, 2024. This information has been compiled from the condensed consolidated interim financial statements and notes thereto for the periods then ended.
| Three
months ended March 31, 2025 | Three
months ended March 31, 2024 | Change | ||||||||||
| Revenue: | ||||||||||||
| Rental revenue | $ | 38,295 | $ | 37,122 | $ | 1,173 | ||||||
| Other property income | 5,181 | 4,861 | 320 | |||||||||
| 43,476 | 41,983 | 1,493 | ||||||||||
| Expenses (Income): | ||||||||||||
| Property operating expenses | 12,607 | 11,960 | 647 | |||||||||
| Real estate taxes | 29,259 | 28,395 | 864 | |||||||||
| General and administrative expenses | 2,544 | 2,507 | 37 | |||||||||
| Fair value adjustment to investment properties | 74 | 38,718 | (38,644 | ) | ||||||||
| Fair value adjustment to investment properties (IFRIC 21) | (22,420 | ) | (22,211 | ) | (209 | ) | ||||||
| Finance costs from operations | 11,573 | 11,576 | (3 | ) | ||||||||
| Finance income from interest rate derivatives and note receivable |
(2,556 | ) | (3,895 | ) | 1,339 | |||||||
| Costs of disposition of investment properties | 5,181 | — | 5,181 | |||||||||
| Distributions on Class B Units | 2,822 | 2,626 | 196 | |||||||||
| Depreciation on right-of-use asset | 33 | 33 | — | |||||||||
| Fair value adjustment to derivatives and other financial liabilities |
45,272 | (26,153 | ) | 71,425 | ||||||||
| Fair value adjustment to unit-based compensation | (65 | ) | (2 | ) | (63 | ) | ||||||
| 84,324 | 43,554 | 40,770 | ||||||||||
| Net loss and comprehensive loss | $ | (40,848 | ) | $ | (1,571 | ) | $ | (39,277 | ) | |||
22
BSR REAL ESTATE INVESTMENT TRUST
Management’s Discussion and Analysis of Financial Condition and Results of Operations
for the three months ended March 31, 2025
Amounts in thousands of U.S. dollars (except for unit amounts, per unit amounts and as otherwise noted)
Revenue
Rental revenue consists of all rental related income earned from the investment properties, including rent earned from residents under lease agreements. Other property income mainly comprises fees associated with moving in or out, such as application fees and cleaning fees, late rental payment fees, renters’ liability insurance, parking fees, utility charges and other fee income from residents under the terms of the lease arrangements.
| Three
months ended March 31, 2025 | Three
months ended March 31, 2024 | Change | Change % | |||||||||||||
| Rental revenue | $ | 38,295 | $ | 37,122 | $ | 1,173 | 3.2% | |||||||||
| Other property income | 5,181 | 4,861 | 320 | 6.6% | ||||||||||||
| $ | 43,476 | $ | 41,983 | $ | 1,493 | 3.6% | ||||||||||
Rental revenue for the three months ended March 31, 2025 as compared to the three months ended March 31, 2024 increased $1.2 million, or 3.2%, and is primarily the result of the Property Acquisition and the Non-Stabilized Property, net of the Property Dispositions. The Property Acquisition and Non-Stabilized Property increased rental revenue by $1.4 million, partially offset by the Property Dispositions which decreased rental revenue by $0.2 million. Rental revenue for Same Community properties was flat versus the comparative period.
Other property income for the three months ended March 31, 2025 compared to the three months ended March 31, 2024 increased $0.3 million, or 6.6%, primarily due to an increase in participation in resident credit building services and an increase in utility reimbursements related to increased preventative maintenance on water meters allowing an increase in the pass through of water charges as well as an increase in properties receiving valet trash service over the prior year.
Property operating expenses
Property operating expenses are comprised mainly of payroll, rental, administrative, maintenance and insurance expenses, as well as other costs associated with the management of the investment properties.
| Three
months ended March 31, 2025 | Three
months ended March 31, 2024 | Change | Change % | |||||||||||||
| Property operating expenses | $ | 12,607 | $ | 11,960 | $ | 647 | 5.4% | |||||||||
The higher property operating expenses for the three months ended March 31, 2025, as compared to the three months ended March 31, 2024, of $0.6 million, or 5.4%, is related primarily to $0.7 million of operating expenses on the Property Acquisition and continued lease-up of the Non-Stabilized Property. This increase is offset by a $0.1 million decrease in Same Community property operating expenses, primarily related to administrative expenses.
Real estate taxes and fair value adjustment to investment properties (IFRIC 21)
Annual property taxes are recognized when the realty tax obligation is imposed and recorded as real estate taxes.
Fair value adjustment to investment properties (IFRIC 21) results from a pro rata property tax basis adjustment commonly included in property sales prices in the United States, as real estate taxes are recognized when the respective realty tax obligation is imposed for the year. The fair value adjustment to investment property (IFRIC 21) represents the difference between the presumed pro rata property tax basis adjustment over the period the obligation relates to and the recognition of the realty tax obligation when it is imposed. Effectively, the fair value adjustment to investment properties (IFRIC 21) levels the annual property tax obligation proportionally throughout the year, offsetting the real estate taxes line item which is recorded at a single point in time during the year. The respective real estate taxes and fair value adjustment to investment properties (IFRIC 21) line items can fluctuate period to period depending on the timing of when revised tax assessments are received and tax credits are realized.
23
BSR REAL ESTATE INVESTMENT TRUST
Management’s Discussion and Analysis of Financial Condition and Results of Operations
for the three months ended March 31, 2025
Amounts in thousands of U.S. dollars (except for unit amounts, per unit amounts and as otherwise noted)
While these line items are presented separately on the statement of net loss and comprehensive loss, they should be aggregated to practically explain the movement in property taxes for the REIT for the comparative periods, as shown below.
| Three
months ended March 31, 2025 | Three
months ended March 31, 2024 | Change | Change % | |||||||||||||
| Real estate taxes | $ | 29,259 | $ | 28,395 | $ | 864 | 3.0% | |||||||||
| Fair value adjustment to investment properties (IFRIC 21) | (22,420 | ) | (22,211 | ) | (209 | ) | 0.9% | |||||||||
| $ | 6,839 | $ | 6,184 | $ | 655 | 10.6% | ||||||||||
The increase in combined real estate taxes and fair value adjustment to investment properties (IFRIC 21) for the three months ended March 31, 2025, as compared to the three months ended March 31, 2024, is due to a $0.3 million decrease in real estate tax refunds related to the Property Dispositions. The Property Acquisition and Non-Stabilized Property increased real estate taxes by $0.5 million. Real estate taxes for Same Community properties decreased by $0.1 million due to an increase in real estate tax refunds received in Q1 2025 compared to Q1 2024.
General and administrative expenses
General and administrative expenses include payroll and benefits for certain REIT employees, professional fees, trustee fees, insurance and other administrative costs.
| Three
months ended March 31, 2025 | Three
months ended March 31, 2024 | Change | Change % | |||||||||||||
| General and administrative expenses | $ | 2,544 | $ | 2,507 | $ | 37 | 1.5% | |||||||||
The increase in general and administrative expenses for the three months ended March 31, 2025, compared to the prior period, is primarily related to a slight increase in payroll expense.
Fair value adjustment to investment properties
In accordance with IFRS Accounting Standards, management has elected to use the fair value model to account for investment properties. Fair value adjustments were determined based on the movement of various parameters, including changes in NOI and capitalization rates.
For the three months ended March 31, 2025, total investment properties (including investment properties in use and held for sale) decreased by $152.6 million primarily due to the Property Dispositions of $215.3 million partially offset by the Property Acquisition of $61.0 million and additions to investment properties in use of $1.7 million.
Further information can be found in the “Investment property portfolio” section below.
Finance costs from operations and finance income
Finance costs from operations consist of interest expense on loans and borrowings, amortization of deferred financing costs, amortization of issuance (premium) discounts, interest paid on hedging instruments which are recognized in profit or loss, interest expense on Convertible Debentures, loss on extinguishment of debt, transaction costs for the issuance of Convertible Debentures and distributions to tenant in common interests.
Finance income consists of interest income on interest rate derivatives, consisting of interest rate swaps and swaptions, and interest income on a note receivable and other interest-bearing accounts.
24
BSR REAL ESTATE INVESTMENT TRUST
Management’s Discussion and Analysis of Financial Condition and Results of Operations
for the three months ended March 31, 2025
Amounts in thousands of U.S. dollars (except for unit amounts, per unit amounts and as otherwise noted)
While these line items are presented separately on the condensed consolidated interim statement of net loss and comprehensive loss, they should be aggregated to practically explain the overall movement in net finance costs for the REIT for the comparative periods, as shown below.
| Three
months ended March 31, 2025 | Three
months ended March 31, 2024 | Change | Change % | |||||||||||||
| Finance costs from operations | $ | 11,573 | $ | 11,576 | $ | (3 | ) | (0.0% | ) | |||||||
| Finance
income from interest rate derivatives and note receivable | (2,556 | ) | (3,895 | ) | 1,339 | (34.4% | ) | |||||||||
| $ | 9,017 | $ | 7,681 | $ | 1,336 | 17.4% | ||||||||||
The increase in finance costs from operations, net of finance income, for the three months ended March 31, 2025, as compared to the three months ended March 31, 2024, is primarily attributable to a $1.3 million increase in interest costs due to the Property Acquisition in January 2025 and the refinancing of the Non-Stabilized Property, which occurred in December 2024.
Costs of disposition of investment properties
Costs of disposition of investment properties are the difference between the net sale proceeds and the carrying amount of the investment properties. They represent the costs incurred to sell the assets such as brokerage and other advisory fees, title costs, real estate tax credits, legal and other costs associated with sales and are recognized in the statement of loss and comprehensive loss in the year of the sale.
The REIT incurred costs of disposition of investment properties of $5.2 million as a result of the Property Dispositions during the three months ended March 31, 2025, as well as initial costs incurred relating to assets held for sale.
Distributions on Class B Units
Class B Units are designated as financial liabilities and are, in all material aspects, economically equivalent to the Units on a per unit basis.
| Three
months ended March 31, 2025 | Three
months ended March 31, 2024 | Change | Change % | |||||||||||||
| Distributions on Class B Units | $ | 2,822 | $ | 2,626 | $ | 196 | 7.5 | % | ||||||||
Distributions on Class B Units for the three months ended March 31, 2025, compared to the three months ended March 31, 2024, increased $0.2 million due to an increase in the REIT’s monthly distribution in August 2024 (annualized $0.56 per Class B Unit).
Fair value adjustment to derivatives and other financial liabilities
Fair value adjustments to derivatives and other financial liabilities consists of fair value adjustments recorded to Class B Units, interest rate derivatives, Convertible Debentures, prepayment embedded derivatives and Unit-based compensation.
Class B Units are measured at fair value with any changes in fair value recorded in profit or loss. The fair value adjustments of Class B Units are calculated using the Unit closing price as of the end of the reporting period. An increase in the Unit closing price over the period results in a fair value loss whereas a decrease in the Unit closing price over the period results in a fair value gain. The fair value adjustment results from the fair value of Class B Units as of the end of the period.
The REIT is subject to eight receive-variable / pay-fixed interest rate derivatives based on various USD – Secured Overnight Financing Rate (“SOFR”) Chicago Mercantile Exchange (“CME”) terms. These instruments are used to manage interest rate exposure over their respective maturities. The valuation of these instruments was determined using discounted cash flow or mark-to-market analyses based on the contractual terms of the derivatives, including the period to maturity of each instrument, using observable market-based inputs, including interest rate curves and implied volatilities. Changes in fair value are recognized as a fair value adjustment to interest rate derivatives in the condensed consolidated interim financial statements.
25
BSR REAL ESTATE INVESTMENT TRUST
Management’s Discussion and Analysis of Financial Condition and Results of Operations
for the three months ended March 31, 2025
Amounts in thousands of U.S. dollars (except for unit amounts, per unit amounts and as otherwise noted)
Management considers whether a contract contains an embedded derivative at inception of the contract. Derivatives embedded in other financial instruments or other host contracts are treated as separate derivatives when their risks and characteristics are not closely related to those of the host contracts and the host contracts are not measured at fair value through the statements of comprehensive income. Under IFRS 9, Financial Instruments: Recognition and Measurement, (“IFRS 9”) certain early redemption options that meet the definition of an embedded derivative are bifurcated from the financial liability and measured at fair value. The fair value of the prepayment embedded derivatives has been determined using a SOFR based interest rate swap options as a proxy.
| Three
months ended March 31, 2025 | Three
months ended March 31, 2024 | |||||||
| Fair value adjustment to Class B Units - (gain)/loss | $ | 41,538 | $ | (20,534 | ) | |||
| Fair value adjustment to Convertible Debentures - (gain)/loss | — | 104 | ||||||
| Fair value adjustment to interest rate derivatives - (gain)/loss | 3,639 | (5,848 | ) | |||||
| Fair value adjustment to other liabilities (gain)/loss | 79 | — | ||||||
| Fair value adjustment to prepayment embedded derivatives - (gain)/loss | 16 | 125 | ||||||
| Fair value adjustment to derivatives and other financial liabilities - (gain)/loss | $ | 45,272 | $ | (26,153 | ) | |||
For the three months ended March 31, 2025, the REIT recognized a fair value loss on Class B Units of $17.4 million as a result of an increase in the Unit closing price from $12.13 per Unit as of December 31, 2024 to $13.00 per Unit as of March 31, 2025. Additionally, based on contractual commitments of certain Class B Unit holders under the Contribution Transaction as of March 31, 2025, 8,310,620 Class B Units were remeasured at the contractual exchange price of $15.90 per Class B Unit, resulting in a fair value loss of $24.1 million. For the three months ended March 31, 2024, the fair value gain of $20.5 million was a result of the decrease in the Unit closing price from $11.87 per Unit as of December 31, 2023 to $11.05 per Unit as of March 31, 2024.
No fair value adjustment to Convertible Debentures was recorded for the three months ended March 31, 2025 (which was repaid in full on January 3, 2025). For the three months ended March 31, 2024, the REIT recognized a fair value loss on Convertible Debentures of $0.1 million as a result of a decrease in the closing price of the REIT’s Convertible Debentures to $97.50 as of March 31, 2024 from $95.00 per Convertible Debenture as of December 31, 2023.
For the three months ended March 31, 2025, the REIT recognized a fair value loss on interest rate derivatives of $3.6 million due to current forecasted SOFR rates as of March 31, 2025, as compared to the contractual fixed rates inherent in the derivatives.
For the three months ended March 31, 2025, the fair value on prepayment embedded derivatives remained flat as a result of minimal changes in the proxy SOFR based interest rate swap options as of March 31, 2025.
26
BSR REAL ESTATE INVESTMENT TRUST
Management’s Discussion and Analysis of Financial Condition and Results of Operations
for the three months ended March 31, 2025
Amounts in thousands of U.S. dollars (except for unit amounts, per unit amounts and as otherwise noted)
Net loss and comprehensive loss
| Three
months ended March 31, 2025 | Three
months ended March 31, 2024 | Change | ||||||||||
| Net loss and comprehensive loss | $ | (40,848 | ) | $ | (1,571 | ) | (39,277 | ) | ||||
Net loss and comprehensive loss for the three months ended March 31, 2025 compared to the net loss and comprehensive loss for the three months ended March 31, 2024 decreased by $39.3 million, primarily due to adjustments to fair value of investment properties and derivatives and other financial liabilities from December 31, 2024 to March 31, 2025 and December 31, 2023 to March 31, 2024, respectively, as well as costs of dispositions of $5.2 million, and is not considered comparable period over period.
| RECONCILIATION OF NON-GAAP MEASURES | ||
| FFO, FFO per Unit, AFFO, AFFO per Unit and AFFO Payout Ratio |
| Set out below is a reconciliation of unaudited FFO and AFFO for the periods presented: |
| Three
months ended March 31, 2025 | Three
months ended March 31, 2024 | |||||||
| Net loss and comprehensive loss | $ | (40,848 | ) | $ | (1,571 | ) | ||
| Adjustments to arrive at FFO | ||||||||
| Distributions on Class B Units | 2,822 | 2,626 | ||||||
| Fair value adjustment to investment properties | 74 | 38,718 | ||||||
| Fair value adjustment to investment properties (IFRIC 21) | (22,420 | ) | (22,211 | ) | ||||
| Property tax liability adjustment, net (IFRIC 21) | 22,420 | 22,211 | ||||||
| Fair value adjustment to derivatives and other financial liabilities | 45,272 | (26,153 | ) | |||||
| Fair value adjustment to unit-based compensation | (65 | ) | (2 | ) | ||||
| Costs of dispositions of investment properties | 5,181 | — | ||||||
| Principal payments on lease liability | (36 | ) | (34 | ) | ||||
| Depreciation of right-to-use asset | 33 | 33 | ||||||
| Funds from Operations ("FFO") | $ | 12,433 | $ | 13,617 | ||||
| FFO per Unit | $ | 0.23 | $ | 0.25 | ||||
| Adjustments to arrive at AFFO | ||||||||
| Maintenance capital expenditures | (549 | ) | (713 | ) | ||||
| Straight line rental revenue differences | (97 | ) | (16 | ) | ||||
| Adjusted Funds from Operations ("AFFO") | $ | 11,787 | $ | 12,888 | ||||
| AFFO per Unit | $ | 0.22 | $ | 0.24 | ||||
| Distributions declared | $ | 7,515 | $ | 6,946 | ||||
| AFFO Payout Ratio | 63.8% | 53.9% | ||||||
| Weighted average unit count | 53,905,295 | 53,856,476 | ||||||
27
BSR REAL ESTATE INVESTMENT TRUST
Management’s Discussion and Analysis of Financial Condition and Results of Operations
for the three months ended March 31, 2025
Amounts in thousands of U.S. dollars (except for unit amounts, per unit amounts and as otherwise noted)
NOI and NOI Margin
Set out below is a reconciliation of the unaudited NOI and NOI margin for the periods presented:
| Three
months ended March 31, 2025 | Three
months ended March 31, 2024 | |||||||
| Total revenue | $ | 43,476 | $ | 41,983 | ||||
| Property operating expenses | (12,607 | ) | (11,960 | ) | ||||
| Real estate taxes | (29,259 | ) | (28,395 | ) | ||||
| 1,610 | 1,628 | |||||||
| Property tax liability adjustment (IFRIC 21) | 22,420 | 22,211 | ||||||
| Net Operating Income ("NOI") | $ | 24,030 | $ | 23,839 | ||||
| NOI margin | 55.3 | % | 56.8 | % | ||||
NAV and NAV per Unit
Set out below is a reconciliation of the NAV and NAV per Unit as March 31, 2025, and December 31, 2024:
| March 31, 2025 | December 31, 2024 | |||||||
| Unitholders' equity | $ | 612,880 | $ | 657,596 | ||||
| Class B Units | 286,606 | 243,712 | ||||||
| NAV | $ | 899,486 | $ | 901,308 | ||||
| Unit count, as of the end of period | 54,006,453 | 53,822,040 | ||||||
| NAV per Unit | $ | 16.66 | $ | 16.75 | ||||
| Debt to Gross Book Value | ||||||||
Set out below is a reconciliation of the Debt to Gross Book Value as of March 31, 2025, and December 31, 2024:
| March 31, 2025 | December 31, 2024 | |||||||
| Loans and borrowings (current portion) | $ | 77,441 | $ | 49,951 | ||||
| Loans and borrowings (non-current portion) | 692,396 | 737,572 | ||||||
| Convertible Debentures | — | 41,764 | ||||||
| Total loans and borrowings and Convertible Debentures ("Debt") | 769,837 | 829,287 | ||||||
| Gross Book Value | $ | 1,698,747 | $ | 1,782,583 | ||||
| Debt to Gross Book Value | 45.3 | % | 46.5 | % | ||||
LIQUIDITY AND CAPITAL RESOURCES
As of March 31, 2025, the capital structure of the REIT was as follows:
| March 31,
2025 | December 31,
2024 | |||||||
| Indebtedness | ||||||||
| Loans and borrowings (current portion) | $ | 77,441 | $ | 49,951 | ||||
| Loans and borrowings (non-current portion) | 692,396 | 737,572 | ||||||
| Convertible Debentures | — | 41,764 | ||||||
| Class B Units | 286,606 | 243,712 | ||||||
| 1,056,443 | 1,072,999 | |||||||
| Unitholders' equity | ||||||||
| Unitholders' equity | 612,880 | 657,596 | ||||||
| Total capitalization | $ | 1,669,323 | $ | 1,730,595 |
28
BSR REAL ESTATE INVESTMENT TRUST
Management’s Discussion and Analysis of Financial Condition and Results of Operations
for the three months ended March 31, 2025
Amounts in thousands of U.S. dollars (except for unit amounts, per unit amounts and as otherwise noted)
Liquidity and capital resources are used to fund capital investments in the investment properties, development and acquisition activities, servicing of debt obligations and distributions to Unitholders. The principal source of liquidity is NOI generated from property operations. For the three months ended March 31, 2025, cash provided by operating activities was $4.1 million. Business operations are also financed using property-specific mortgages, credit facilities and equity financing.
As of March 31, 2025, the REIT had liquidity of $148.1 million, consisting of cash and cash equivalents of $84.3 million and $63.8 million available on the Credit Facility (defined below). The REIT can obtain additional liquidity through adding unencumbered properties to the borrowing base.
As of March 31, 2025, current assets of $532.4 million exceeded current liabilities of $392.0 million, resulting in working capital of $140.4 million, which includes Investment properties held for sale of $431.5 million and Class B Units of $286.6 million. The Class B Units are economically equivalent to Units and are redeemable by the holder thereof for cash or Units (on a one-for-one basis subject to customary anti-dilution adjustments), as determined by BSR in its sole discretion.
On January 3, 2025, the REIT redeemed all the issued and outstanding Convertible Debentures in the aggregate principal amount of $41.5 million plus accrued and unpaid interest of $0.5 million. The redemption of the Convertible Debentures was funded with available capacity under the REIT’s Credit Facility.
The REIT maintains a senior secured revolving credit facility provided by various banks (the “Credit Facility”) with a maximum revolving credit availability of $500.0 million, of which $381.6 million was available as of March 31, 2025. The Credit Facility is secured by twelve borrowing base properties. On June 9, 2023, the Credit Facility was extended by one year to September 30, 2026, with no other contractual changes as a result of the extension. The Credit Facility currently bears interest at SOFR at a selected term of daily, one-month, three-months or six months plus a contractual margin adjustment based on the duration selected (“Adjusted Term SOFR”), as defined in the Credit Facility, plus 1.45% to 1.90% based on meeting certain leverage ratios as defined in the Credit Facility. Alternatively, the REIT has the ability to borrow using the greatest of (i) lender prime rate, (ii) the Fed Funds rate plus 0.5%, or (iii) 1-month SOFR plus 1.0% (the “Base Rate”) loans plus a rate equal to 0.45% to 0.90%. As of March 31, 2025 and December 31, 2024, the balance outstanding on the Credit Facility was $317.7 million and $295.2 million, respectively, at a variable interest rate of 6.0%.
Mortgage notes as of March 31, 2025 mature at various dates from 2025 through 2056. Outside of the regular principal amortization of existing loans and borrowings; balloon payments on property mortgages totalling $75.7 million come due in the next twelve months. On April 30, 2025, two of these mortgages, together comprising $47.9 million, were repaid through the Contribution Transaction. No formal agreements have been entered into at this time to refinance the remaining mortgage ($27.8 million) that is set to expire in the next twelve months; however, the REIT has borrowing capacity under its credit facility as well as various other opportunities to refinance this specific property.
In February 2025, the REIT placed Aura 35Fifty onto the Credit Facility as a borrowing base property and refinanced the $38.7 million outstanding mortgage using the Credit Facility availability.
In March 2025, the REIT extended the maturity of the mortgage note connected to the Auberry at Twin Creeks property by 61 days to June 1, 2025 with no other contractual changes as a result of this extension.
The REIT has entered into eight receive-variable / pay-fixed interest rate derivatives based on various USD – SOFR CME terms with an aggregate notional value of $553.0 million to manage interest rate exposure with respect to the Credit Facility, as well as other variable rate mortgage notes payable.
29
BSR REAL ESTATE INVESTMENT TRUST
Management’s Discussion and Analysis of Financial Condition and Results of Operations
for the three months ended March 31, 2025
Amounts in thousands of U.S. dollars (except for unit amounts, per unit amounts and as otherwise noted)
As of March 31, 2025, the interest rate derivatives structure of the REIT was as follows:
| Maturity date | Fixed rate | Forward
swap effective date | Counterparty optional termination date | Notional
amount | Carrying
value and fair value | |||||||||||||||||||
| Interest rate derivatives, as of March 31, 2025 | ||||||||||||||||||||||||
| Raymond James | 9/1/2025 | 5.07 | % | n/a | n/a | $ | 1,010 | $ | (8 | ) | ||||||||||||||
| Bank of Montreal | 8/31/2029 | 2.16 | % | n/a | 7/3/2025 | 150,000 | 758 | |||||||||||||||||
| Bank of Montreal | 7/27/2029 | 2.09 | % | n/a | 7/3/2026 | 65,000 | 1,211 | |||||||||||||||||
| Bank of Montreal | 7/1/2032 | 3.48 | % | n/a | 1/2/2026 | 60,000 | (718 | ) | ||||||||||||||||
| Bank of Montreal | 4/26/2030 | 1.83 | % | n/a | 6/10/2025 | 80,000 | 275 | |||||||||||||||||
| Bank of Montreal | 7/1/2032 | 3.27 | % | n/a | 1/2/2026 | 105,000 | (680 | ) | ||||||||||||||||
| Bank of Montreal | 7/1/2031 | 2.25 | % | n/a | 2/1/2027 | 50,000 | 944 | |||||||||||||||||
| Bank of Montreal | 2/1/2030 | 3.13 | % | n/a | 2/2/2026 | 42,000 | (91 | ) | ||||||||||||||||
| $ | 553,010 | $ | 1,691 | |||||||||||||||||||||
On November 1, 2024, the REIT entered into a receive-variable based USD – SOFR CME/pay-fixed interest rate swap on a notional value of $42.0 million at a fixed rate of 3.13%. The swap is effective February 3, 2025 and matures February 1, 2030, subject to the counterparty’s optional early termination date of February 2, 2026.
Subsequent to March 31, 2025, on April 3, 2025, the REIT entered into a new receive-variable based USD-SOFR CME/pay fixed interest rate swap on a notional value of $150,000 at a fixed rate of 2.88% effective July 1, 2025, and maturing July 1, 2030, subject to the counterparty’s optional early termination date of July 1, 2027.
The REIT funds capital expenditures with cash flows from operations and available borrowing capacity under existing credit facilities.
Subject to market conditions, the REIT may raise funding through equity financing. The REIT believes that its capital structure will provide it with financial flexibility to pursue future growth strategies. However, the REIT’s ability to fund operating expenses, capital expenditures and future debt service requirements will depend on, among other things, future operating performance, which will be affected by general economic, industry, financial and other factors, including the impact of factors beyond the REIT’s control. See “Risk Factors”.
CONTRACTUAL COMMITMENTS
The REIT seeks to maintain a combination of short, medium and long-term debt maturities that are appropriate for the overall debt level of its portfolio, considering the availability of financing and market conditions, and the financial characteristics of each investment property. As of March 31, 2025, the REIT’s mortgage debt and Credit Facility was 100% fixed or economically hedged to fixed rates.
Management administers a portion of its variable-rate loans and borrowings using interest rate derivatives that alter the REIT’s exposure to the impact of changing interest rates. See section “Fair value adjustments to derivatives and other financial liabilities” for more detail. The REIT expects to be able to meet all obligations as they become due using some or all of the following sources of liquidity: cash flow generated from property operations, property-specific mortgages, existing cash and cash equivalents on hand and available borrowing capacity under existing credit facilities.
30
BSR REAL ESTATE INVESTMENT TRUST
Management’s Discussion and Analysis of Financial Condition and Results of Operations
for the three months ended March 31, 2025
Amounts in thousands of U.S. dollars (except for unit amounts, per unit amounts and as otherwise noted)
The following table provides information on the carrying balance and the non-discounted contractual maturities of financial liabilities of the REIT with fixed repayment terms, including estimated interest payments:
| Carrying amount | Contractual
cash flows | 1 year | 2 years | 3 years | 4 years | 5 years | More
than 5 years | |||||||||||||||||||||||||
| Loans and borrowings | $ | 769,837 | $ | 774,348 | $ | 77,441 | $ | 478,589 | $ | 878 | $ | 146,500 | $ | 943 | $ | 69,997 | ||||||||||||||||
| Interest payable | 2,922 | 89,712 | 36,276 | 22,989 | 7,173 | 4,508 | 2,485 | 16,281 | ||||||||||||||||||||||||
| Interest rate derivatives liability | 1,497 | 1,406 | 8 | — | — | — | — | 1,398 | ||||||||||||||||||||||||
| Capital improvements liability | 117 | 117 | 117 | — | — | — | — | — | ||||||||||||||||||||||||
| Accounts payable and other liabilities | 24,888 | 24,888 | 24,888 | — | — | — | — | — | ||||||||||||||||||||||||
| $ | 799,261 | $ | 890,471 | $ | 138,730 | $ | 501,578 | $ | 8,051 | $ | 151,008 | $ | 3,428 | $ | 87,676 | |||||||||||||||||
UNITHOLDERS EQUITY AND DISTRIBUTIONS
On October 4, 2023, the REIT renewed its normal course issuer bid (the “2023 NCIB”) for the 12-month period through October 5, 2024, permitting the REIT to purchase for cancellation up to a maximum of 3,186,336 Units, or approximately 10% of the public float as of September 27, 2023, over the 12-month period commencing October 6, 2023. The REIT concurrently renewed the automatic securities purchase plan (the “2023 ASPP”). On October 5, 2024, the REIT’s 2023 NCIB expired. As of December 31, 2024, the REIT purchased and cancelled 3,137,895 Units under the 2023 NCIB and 2023 ASPP at an average price of $10.65 per Unit. The REIT suspended its 2023 ASPP in December 2023.
On November 7, 2024, the Toronto Stock Exchange (the “TSX”) accepted the REIT’s notice of intention to make a normal course issuer bid (the “2024 NCIB”) commencing on November 12, 2024 for up to a maximum of 2,856,430 of its issued and outstanding Units, or approximately 10% of the public float as of October 29, 2024, for cancellation over the 12-month period commencing November 12, 2024 through to November 11, 2025. The REIT did not purchase or cancel any Units under its renewed 2024 NCIB for the three months ended March 31, 2025.
All Units purchased under the 2024 NCIB will be cancelled upon their purchase. The REIT intends to fund the purchases out of its available resources.
The REIT adopted a distribution policy pursuant to which the REIT makes cash distributions to Unitholders and, through BSR Trust, holders of Class B Units (“Class B Unitholders”), on a monthly basis. Pursuant to this distribution policy, distributions are paid to Unitholders and Class B Unitholders of record at the close of business on the last business day of a month on or about the 15th day of the following month. Distributions must be approved by the Board and are subject to change depending on the general economic outlook and financial performance of the REIT. The REIT does not use net income in accordance with IFRS Accounting Standards as the basis to establish the level of distributions as net income includes, among other items, non-cash fair value adjustments related to its property portfolio.
In February 2022, the Board approved a 4.0% increase to the cash distribution to $0.52 per Unit and Class B Unit on an annualized basis beginning with the February 2022 distribution, which was paid on March 15, 2022. In August 2024, the Board approved a 7.7% increase to the cash distribution to $0.56 per Unit and Class B Unit on an annualized basis beginning with the August 2024 distribution paid on September 16, 2024.
For the three months ended, the REIT announced total distributions of $0.14 per Unit ($0.56 per Unit annualized), resulting in total distributions declared to Unitholders and Class B Unitholders of $7.5 million for the period ($6.9 million for the three months ended March 31, 2024).
31
BSR REAL ESTATE INVESTMENT TRUST
Management’s Discussion and Analysis of Financial Condition and Results of Operations
for the three months ended March 31, 2025
Amounts in thousands of U.S. dollars (except for unit amounts, per unit amounts and as otherwise noted)
In accordance with National Policy 41-201 - Income Trusts and Other Indirect Offerings, the REIT provides the following additional disclosure relating to cash distributions:
| Three
months ended March 31, 2025 | Three
months ended March 31, 2024 | |||||||
| Cash provided by operating activities | $ | 4,076 | $ | (7,501 | ) | |||
| Less: Interest paid | (11,011 | ) | (11,733 | ) | ||||
| Add: Interest received | 2,694 | 3,759 | ||||||
| (4,241 | ) | (15,475 | ) | |||||
| Less: Distributions paid to Unitholders | (4,567 | ) | (4,318 | ) | ||||
| Less: Distributions paid to Class B Unitholders | (2,822 | ) | (2,628 | ) | ||||
| Deficit of cash provided by operating activities over distributions paid | $ | (11,630 | ) | $ | (22,421 | ) | ||
While cash flows provided by operating activities are generally sufficient to cover distribution requirements, the timing of expenses and fluctuations in non-cash working capital may result in a temporary shortfall. In these cases, some portion of distributions may come from the REIT’s capital or financing sources other than cash provided by operating activities.
INVESTMENT PROPERTY PORTFOLIO
Investment properties include land and land improvements, building and building improvements, as well as furniture and equipment. Investment properties are measured initially at cost, including transaction costs. Subsequent to initial recognition, investment properties are measured at fair value. Subsequent capital expenditures are added to the carrying value of the investment properties only when it is probable that future economic benefits will flow to the property and the cost can be measured reliably. Management evaluates financial performance of the investment property portfolio by analyzing the performance of the portfolio in a given period.
The investment property portfolio had 29 properties in use, as of March 31, 2025. A reconciliation of the carrying value for investment properties at the beginning and end of the period is set out below:
| Three
months ended March 31, 2025 | Three
months ended March 31, 2024 | |||||||
| Investment properties in use, beginning of period | $ | 1,746,650 | $ | 1,742,974 | ||||
| Property acquisitions | 61,064 | — | ||||||
| Property dispositions | (215,300 | ) | — | |||||
| Additions to investment properties in use | 1,681 | 2,851 | ||||||
| Transfer of investment property in use to held for sale | (431,500 | ) | — | |||||
| Change in fair value of investment properties | (74 | ) | (38,718 | ) | ||||
| 1,162,521 | 1,707,107 | |||||||
| IFRIC 21 fair value adjustment | 22,420 | 22,211 | ||||||
| IFRIC 21 real estate tax liability adjustment | (22,420 | ) | (22,211 | ) | ||||
| Investment property in use, end of period | 1,162,521 | 1,707,107 | ||||||
| Investment property under development, beginning of period | — | 39,987 | ||||||
| Additions to investment property under development | — | 7,133 | ||||||
| Investment property under development, end of period | — | 47,120 | ||||||
| Investment properties, end of period | $ | 1,162,521 | $ | 1,754,227 | ||||
INVESTMENT PROPERTY VALUATION
The REIT uses an internal valuation process to value the investment properties as of March 31, 2025. The REIT engages third party appraisers to prepare valuations on a portion of the portfolio annually, such that the entire portfolio is appraised at least once every three years. As part of management’s internal valuation program, the REIT considers external valuations performed by independent national real estate valuation firms for a cross-section of properties that represent different geographical locations across the REIT’s portfolio and updates, as deemed necessary, the valuation models to reflect current market data.
32
BSR REAL ESTATE INVESTMENT TRUST
Management’s Discussion and Analysis of Financial Condition and Results of Operations
for the three months ended March 31, 2025
Amounts in thousands of U.S. dollars (except for unit amounts, per unit amounts and as otherwise noted)
The estimated fair value of each investment property was determined using the direct capitalization income method. The stabilized future cash flows are divided by an overall capitalization rate. The capitalization rates were derived in part from a combination of third-party information and the observation of industry trends (Level 3 inputs). Assumptions used to derive capitalization rates include property age, amenities, renovations, geographic region, capital expenditures assumptions and location.
For the three months ended March 31, 2025, the decrease in fair value of investment properties of $0.1 million was primarily driven by slight net expansion in the capitalization rates in our primary markets as well as a net reduction in stabilized future cash flows.
A significant increase (decrease) in stabilized future cash flows in isolation would result in a significantly higher (lower) fair value. A significant increase (decrease) in capitalization rate estimates in isolation would result in significantly lower (higher) fair value.
The high, low, and overall weighted average capitalization rates are set out below:
| March 31,
2025 | December 31, 2024 | |||||||
| Capitalization rates | ||||||||
| High | 7.5 | % | 7.4 | % | ||||
| Low | 4.8 | % | 4.6 | % | ||||
| Weighted average | 5.2 | % | 5.2 | % | ||||
CASH FLOWS
The REIT held cash and cash equivalents of $84.3 million as of March 31, 2025. The changes in cash flows for the year three months ended March 31, 2025 as compared to the three months ended March 31, 2024 are as follows:
| Three
months ended March 31, 2025 | Three
months ended March 31, 2024 | |||||||
| Cash provided by (used in) operating activities | $ | 4,076 | $ | (7,501 | ) | |||
| Cash provided by investing activities | 146,810 | 567 | ||||||
| Cash (used in) provided by financing activities | (75,364 | ) | 7,940 | |||||
| Change in cash and cash equivalents during the period | $ | 75,522 | $ | 1,006 | ||||
Operating activities
Operating activities for the three months ended March 31, 2025 generated a net cash inflow of $4.1 million. This cash flow from operating activities was largely driven by cash inflows from normal business operations (net income adjusted for non-cash items and financing activities).
Investing activities
Investing activities for the three months ended March 31, 2025 generated a net cash inflow of $146.8 million. This was primarily driven by cash received on sale of investment properties of $208.5 million, offset by cash spent on the Property Acquisition of $60.7 million and other investing activities of $1.0 million.
33
BSR REAL ESTATE INVESTMENT TRUST
Management’s Discussion and Analysis of Financial Condition and Results of Operations
for the three months ended March 31, 2025
Amounts in thousands of U.S. dollars (except for unit amounts, per unit amounts and as otherwise noted)
Financing activities
Financing activities for the three months ended March 31, 2025 generated a net cash outflow of $75.4 million. This was largely driven by principal payments of loans and borrowings of $188.5 million, interest paid of $11.0 million, distributions paid of $7.4 million and redemption of Convertible Debentures of $41.5 million and other financing activities of $1.3 million, partially offset by $171.6 million in proceeds from the issuance of loans and borrowings and $2.7 million in interest received.
UNITS OUTSTANDING
The total number of Units, Class B Units and Deferred Units outstanding as of March 31, 2025 and March 31, 2024 are as follows:
| March 31,
2025 | March 31,
2024 | |||||||
| Units | 33,487,790 | 33,292,999 | ||||||
| Class B Units | 20,192,693 | 20,193,756 | ||||||
| Deferred Units | 325,970 | 438,024 | ||||||
| Total unit count outstanding | 54,006,453 | 53,924,779 | ||||||
| Weighted average unit count (three months ended) | 53,905,295 | 53,856,476 | ||||||
Under the Declaration of Trust, the REIT is permitted to issue an unlimited number of Units.
Subject to certain limitations, the Class B Units are redeemable at the option of the holder and, therefore, are considered puttable instruments in accordance with International Accounting Standard 32 (“IAS 32”). Upon notice of redemption, BSR Trust may redeem the Class B Units for cash or Units in its sole discretion. Therefore, the Class B Units meet the definition of a financial liability under IAS 32.
Deferred Units are issued to the Board and vest immediately upon grant.
The unit count includes the combined Units, Class B Units and issued Deferred Units, weighted based on the respective ownership dates during the periods.
Additionally, unvested Restricted Units (“RUs") and Performance Units (“PUs") issued to the REIT’s management as of March 31, 2025 totalled 84,716 RUs and 186,903 PUs, respectively.
TRANSACTIONS WITH RELATED PARTIES
The consolidated financial statements include the following related party transactions:
| · | Distributions on Units of $0.7 million were declared to Bailey/Hughes holders during the three months ended March 31, 2025 ($0.6 million during the three months ended March 31, 2024). |
| · | Distributions on Class B Units of $1.9 million were declared to key management personnel, primarily the Bailey/Hughes Holders, during the three months ended March 31, 2025 ($1.8 million during the three months ended March 31, 2024). Key management personnel of the REIT are those persons having the authority and responsibility for planning, directing and controlling the activities of the REIT directly or indirectly. |
| · | Compensation expenses include $1.2 million paid to key management personnel during the three months ended March 31, 2025 ($2.1 million during the three months ended March 31, 2024), which includes short-term employee compensation and benefits and unit-based compensation. |
| · | The REIT leases its Little Rock, Arkansas corporate headquarters from an irrevocable trust controlled by the family of the REIT’s President, Chief Executive Officer and Chief Investment Officer, Dan Oberste, and the former Executive Vice-Chair of the Board, John S. Bailey. The lease expired on March 31, 2025, after which the REIT will continue to make payments month-to-month. |
34
BSR REAL ESTATE INVESTMENT TRUST
Management’s Discussion and Analysis of Financial Condition and Results of Operations
for the three months ended March 31, 2025
Amounts in thousands of U.S. dollars (except for unit amounts, per unit amounts and as otherwise noted)
CRITICAL ACCOUNTING ESTIMATES AND ASSUMPTIONS
Management makes estimates and assumptions concerning the future. The resulting accounting estimates may differ from actual results. The estimates and assumptions that have a significant risk of causing a material adjustment to the carrying values of assets and liabilities within the next financial period are outlined below.
Investment properties
Investment properties consist of investment properties in use. Properties are determined to be investment properties when they are held either to earn rental income or for capital appreciation or for both, but not for sale in the ordinary course of business. Investment properties includes land and land improvements, building and building improvements, as well as furniture and equipment and certain intangibles, such as in-place leases, if any. Investment properties are measured initially at cost, including transaction costs, except for investment properties acquired in a business combination, where such costs are expensed as incurred. Subsequent to initial recognition, investment properties are measured at fair value.
Unrealized gains and losses arising from changes in the fair value of investment properties are included in profit or loss in the period in which they arise. Fair values are primarily determined internally by management using the direct capitalization income method. As part of management's internal valuation program, the REIT considers external valuations performed by independent national real estate valuation firms for a cross-section of properties that represent different geographical locations across the REIT's portfolio. On a quarterly basis, the valuation team reviews and updates, as deemed necessary, the valuation models to reflect current market data.
Subsequent capital expenditures are added to the carrying value of the investment properties only when it is probable that future economic benefits will flow to the property and the cost can be measured reliably. All repairs and maintenance costs are expensed as incurred.
The REIT uses an internal valuation process to value the investment properties as of March 31, 2025. The fair value of each investment property was determined using the direct capitalization income method. The stabilized future cash flows are divided by an overall capitalization rate. The capitalization rates were derived in part from a combination of third-party information and the observation of industry trends (Level 3 inputs). Assumptions used to derive capitalization rates include property age, amenities, renovations, geographic region and location.
As mentioned above, the REIT engages third party appraisers to prepare valuations on a portion of the portfolio annually, such that the entire portfolio is appraised at least once every three years.
DISCLOSURE CONTROLS AND INTERNAL CONTROLS OVER FINANCIAL REPORTING
Management, including the Chief Executive Officer and Chief Financial Officer, does not expect that the disclosure controls or internal controls over financial reporting of the REIT will prevent or detect all errors and all fraud or will be effective under all potential future conditions. A control system is subject to inherent limitations and, no matter how well designed and operated, can provide only reasonable, not absolute, assurance that the control systems objectives will be met.
Further, the design of a control system must reflect that there are resource constraints, and the benefits of controls must be considered relative to their costs. Inherent limitations include the realities that judgments in decision making can be faulty, and that breakdowns can occur because of simple errors or mistakes. Controls can also be circumvented by individual acts of some persons, by collusion of two or more people or by management override of the controls. Due to the inherent limitations in a cost-effective control system, misstatements due to error or fraud may occur and not be detected. The design of any control system is also based in part upon certain assumptions about the likelihood of future events, and there can be no assurance that any design will succeed in achieving its stated goals under all potential conditions. Projections of any evaluations of effectiveness to future periods are subject to the risk that controls may become inadequate because of changes in conditions, or that the degree of compliance with the policies or procedures may deteriorate.
35
BSR REAL ESTATE INVESTMENT TRUST
Management’s Discussion and Analysis of Financial Condition and Results of Operations
for the three months ended March 31, 2025
Amounts in thousands of U.S. dollars (except for unit amounts, per unit amounts and as otherwise noted)
The Chief Executive Officer and the Chief Financial Officer have evaluated, or caused an evaluation under their direct supervision of, the design of disclosure controls and procedures and internal controls over financial reporting (as defined in NI 52-109) as of March 31, 2025. In making this assessment, the Chief Executive Officer and the Chief Financial Officer used the criteria set forth by the Committee of Sponsoring Organizations (COSO) of the Treadway Commission in Internal Control – Integrated Framework (2013). Based on this evaluation, the REIT has concluded that it has a) designed disclosure controls and procedures to provide reasonable assurance that (i) material information relating to the REIT is made known to the Chief Executive Officer and the Chief Financial Officer by others, particularly during the period in which the interim filings are being prepared and (ii) information required to be disclosed by the REIT in its various reports filed or submitted under securities legislation is recorded, processed, summarized and reported within time periods specified in securities legislation; and b) designed internal controls over financial reporting to provide reasonable assurance regarding the reliability of financial reporting and the preparation of financial statements for external purposes in accordance with IFRS Accounting Standards.
There have been no changes in the internal controls over financial reporting of the REIT during the period of this MD&A that have materially affected, or are reasonably likely to materially affect, the REIT’s internal controls over financial reporting.
FINANCIAL RISK MANAGEMENT
The REIT’s activities expose it to credit risk, market risk and liquidity risk. Risk management is carried out by the Chief Financial Officer under policies approved by senior executive management. The REIT faces a variety of significant and diverse risks, many of which are inherent in the business conducted by the REIT, BSR Trust and the residents of the properties. The disclosure in this MD&A is subject to the risk factors outlined below.
Liquidity risk is the risk that the REIT will encounter difficulty in meeting obligations associated with the maturity of financial obligations. The REIT’s liquidity is subject to macroeconomic, financial, competitive and other factors that are beyond the REIT’s control.
Liquidity risk is managed through cash flow forecasting. Management monitors forecasts of the REIT’s liquidity requirements to ensure it has sufficient cash to meet operational needs through maintaining sufficient cash and/or availability on the undrawn Credit Facility and the Line of Credit and ensuring that it meets its financial covenants related to debt agreements. Such forecasting involves a significant degree of judgment, takes into consideration current and projected macroeconomic conditions, the REIT's cash collection efforts, debt financing plans, and covenant compliance required under the terms of debt agreements. There is a risk that such liquidity forecasts may not be achieved and that currently available debt financing may no longer be available to the REIT at terms and conditions that are favorable to the REIT, or at all.
RISK FACTORS
The REIT faces a variety of significant and diverse risks, many of which are inherent in the business conducted by the REIT. The AIF contains a detailed summary of risk factors pertaining to the REIT and its business under the heading “Risk Factors”, which section is hereby incorporated herein by reference. The disclosures in this MD&A are subject to the risk factors outlined in the AIF. Other risks and uncertainties that the REIT does not presently consider to be material, or of which the REIT is not presently aware, may become important factors that affect the REIT’s future financial condition and results of operations. The occurrence of any of the risks discussed in the AIF could materially and adversely affect the business, prospects, financial condition, results of operations, cash flow or the ability of the REIT to make cash distributions to Unitholders and Class B Unitholders or the value of the Units.
36