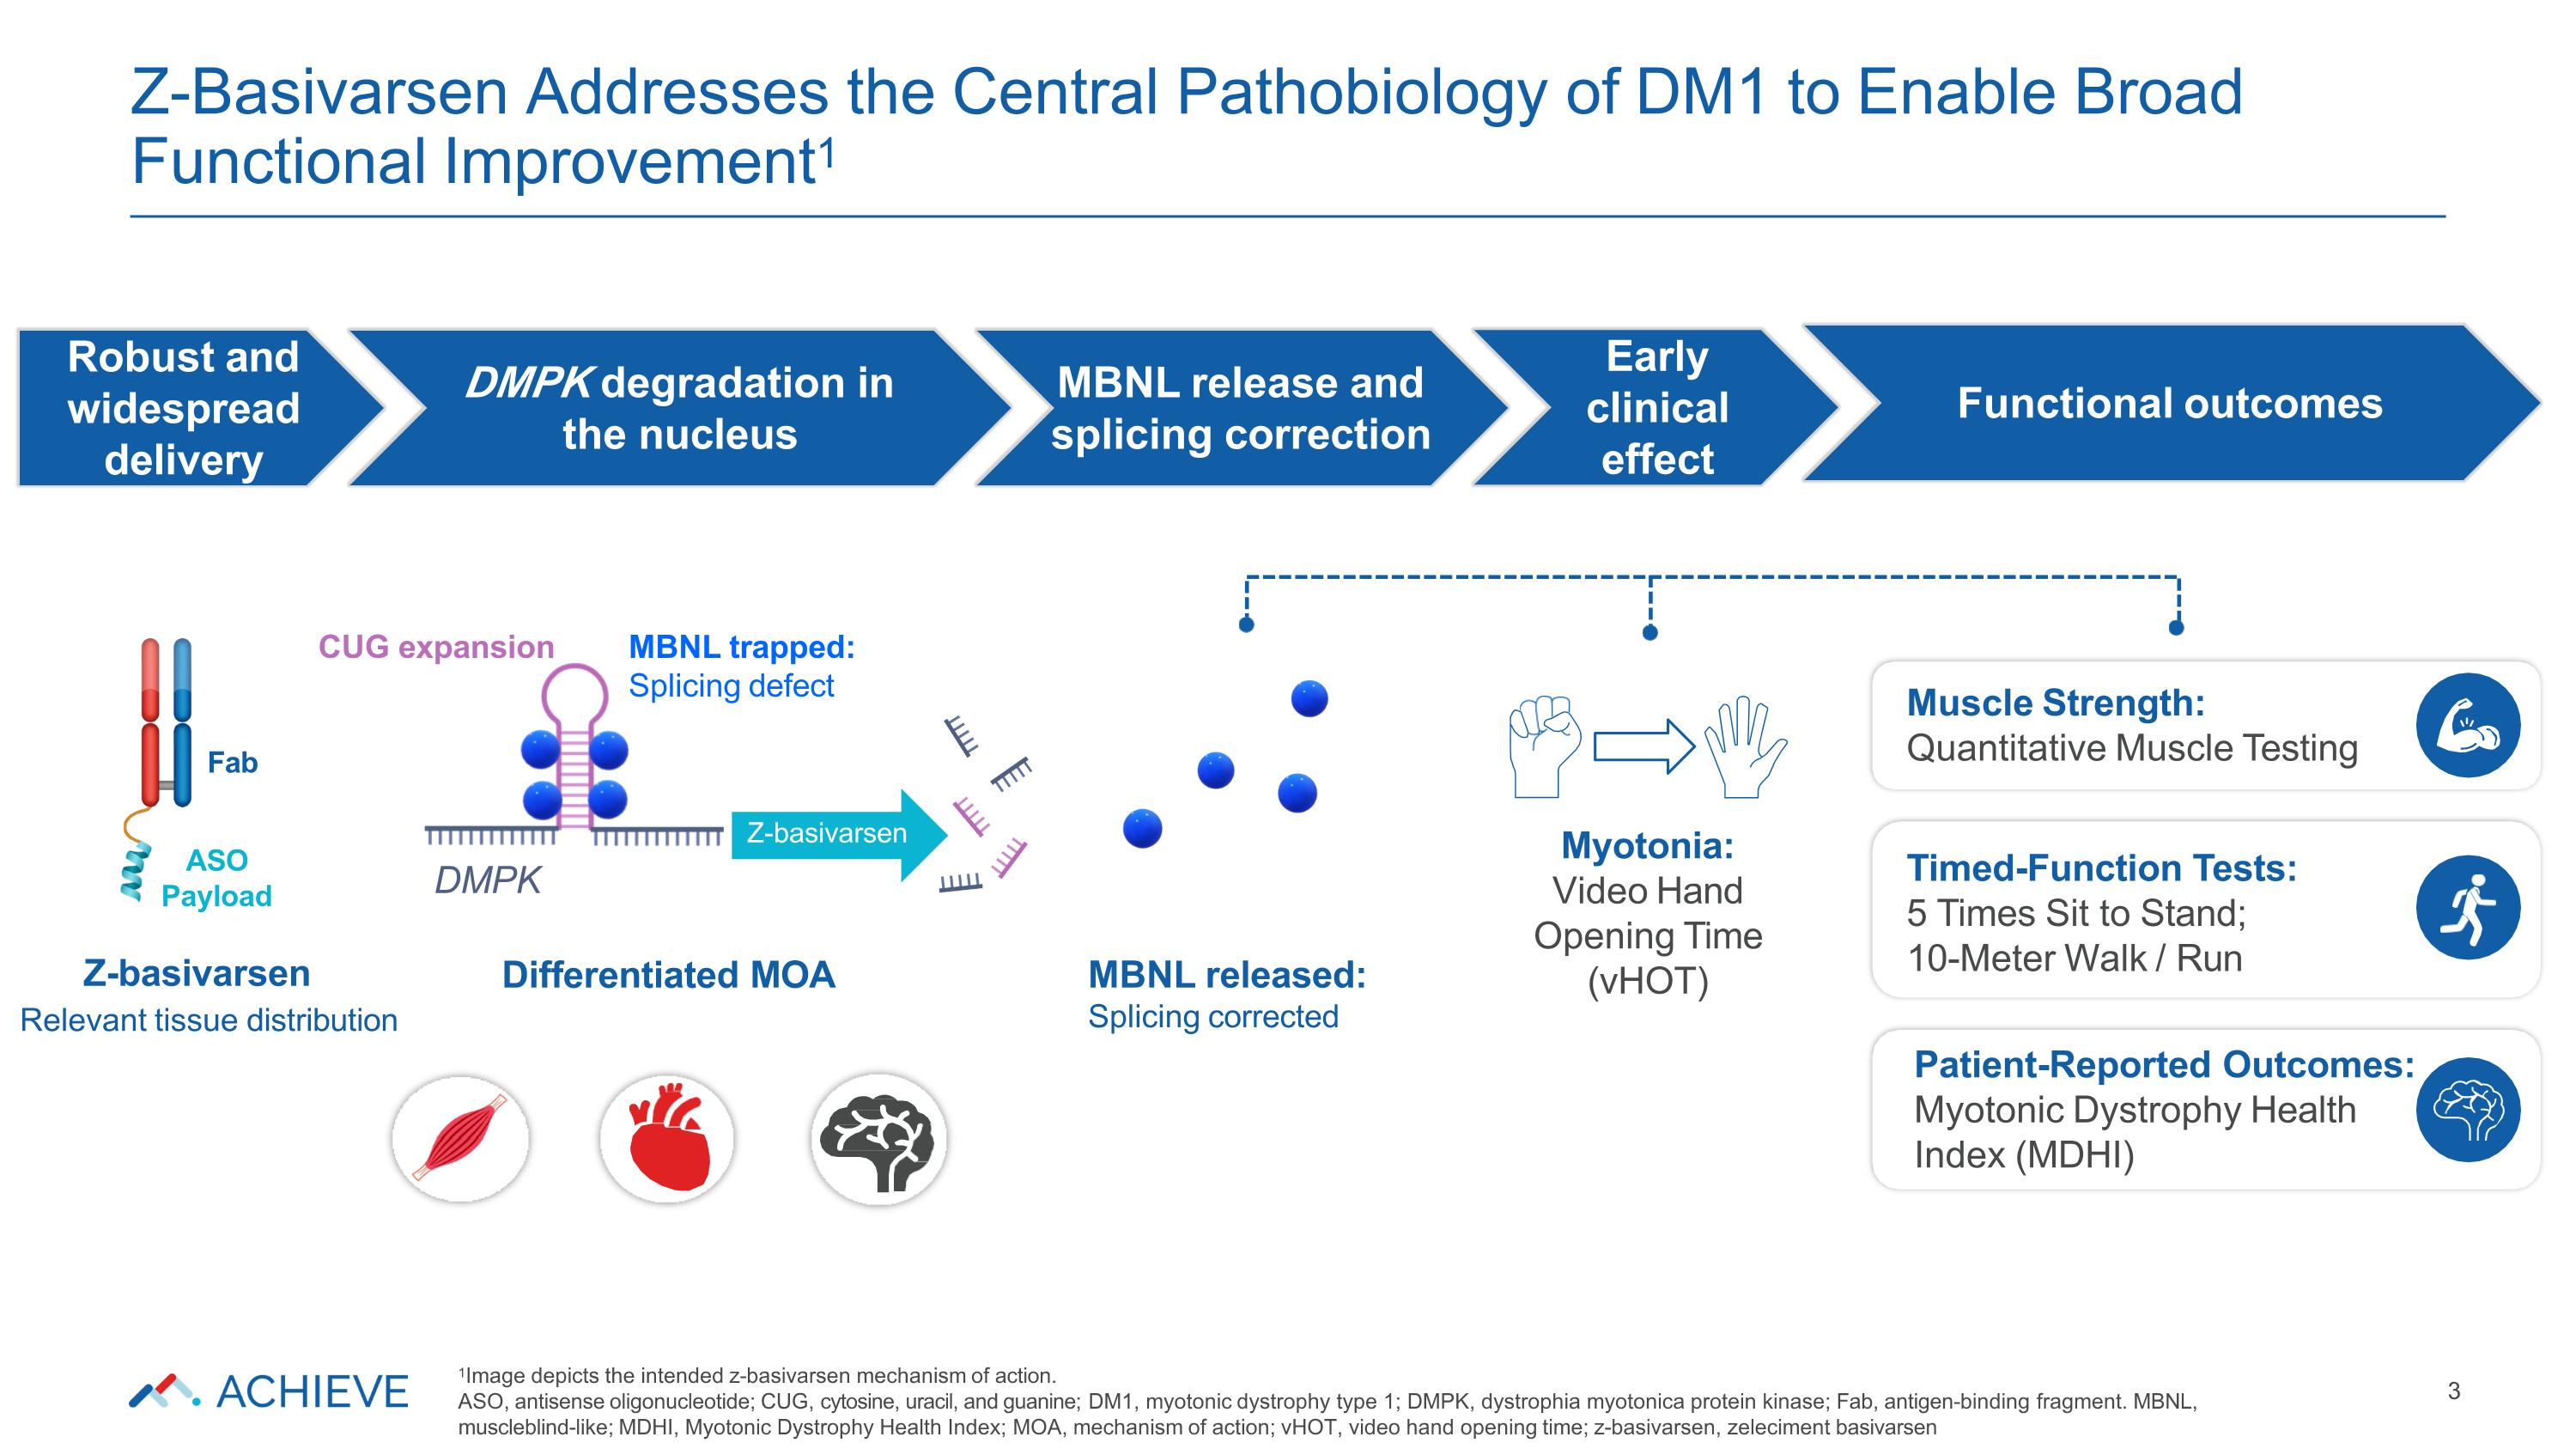
Z-Basivarsen Addresses the Central Pathobiology of DM1 to Enable Broad Functional Improvement1 3 Muscle Strength: Quantitative Muscle Testing Timed-Function Tests: 5 Times Sit to Stand; 10-Meter Walk / Run Patient-Reported Outcomes: Myotonic Dystrophy Health Index (MDHI) Robust and widespread delivery DMPK degradation in the nucleus MBNL release and splicing correction MBNL trapped: Splicing defect CUG expansion MBNL released: Splicing corrected Differentiated MOA Z-basivarsen Relevant tissue distribution Myotonia: Video Hand Opening Time (vHOT) DMPK Early clinical effect Z-basivarsen Functional outcomes 1Image depicts the intended z-basivarsen mechanism of action. ASO, antisense oligonucleotide; CUG, cytosine, uracil, and guanine; DM1, myotonic dystrophy type 1; DMPK, dystrophia myotonica protein kinase; Fab, antigen-binding fragment. MBNL, muscleblind-like; MDHI, Myotonic Dystrophy Health Index; MOA, mechanism of action; vHOT, video hand opening time; z-basivarsen, zeleciment basivarsen ASO Payload Fab
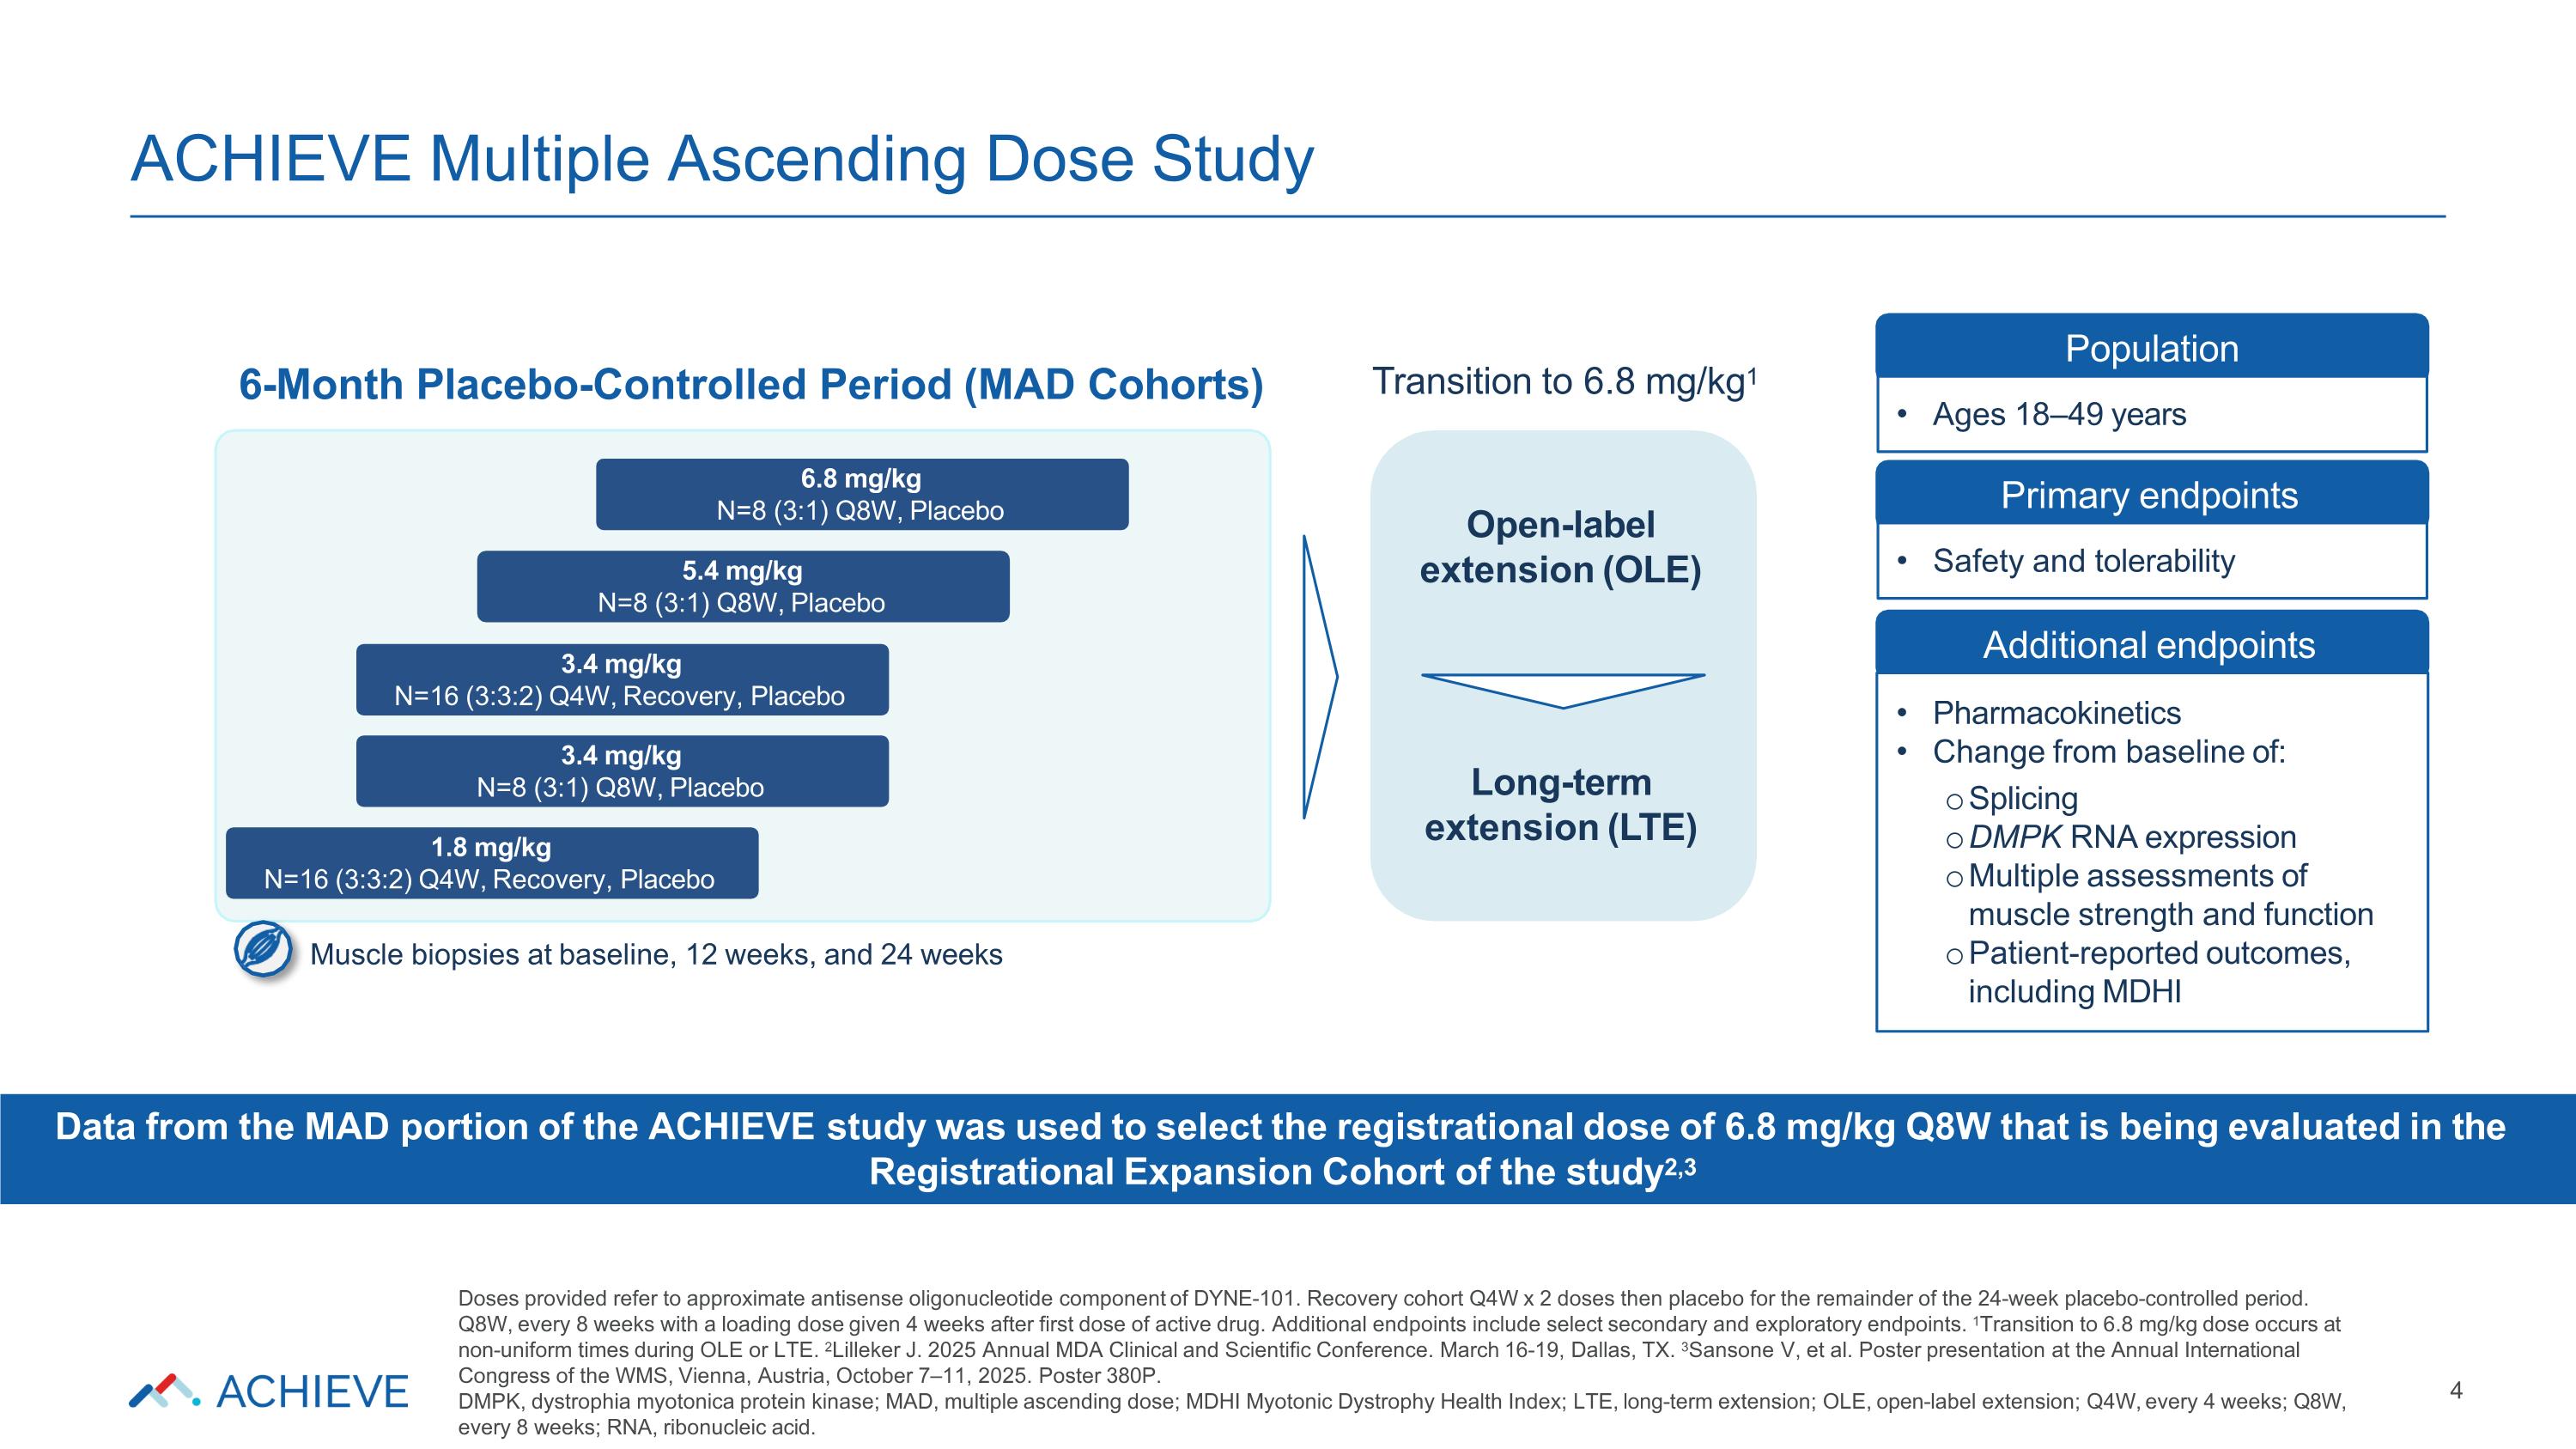
ACHIEVE Multiple Ascending Dose Study 5.4 mg/kg N=8 (3:1) Q8W, Placebo 6.8 mg/kg N=8 (3:1) Q8W, Placebo 3.4 mg/kg N=8 (3:1) Q8W, Placebo 1.8 mg/kg N=16 (3:3:2) Q4W, Recovery, Placebo Open-label extension (OLE) Long-term extension (LTE) Primary endpoints Safety and tolerability Additional endpoints Muscle biopsies at baseline, 12 weeks, and 24 weeks Transition to 6.8 mg/kg1 6-Month Placebo-Controlled Period (MAD Cohorts) Population Ages 18–49 years Pharmacokinetics Change from baseline of: Splicing DMPK RNA expression Multiple assessments of muscle strength and function Patient-reported outcomes, including MDHI Data from the MAD portion of the ACHIEVE study was used to select the registrational dose of 6.8 mg/kg Q8W that is being evaluated in the Registrational Expansion Cohort of the study2,3 Doses provided refer to approximate antisense oligonucleotide component of DYNE-101. Recovery cohort Q4W x 2 doses then placebo for the remainder of the 24-week placebo-controlled period. Q8W, every 8 weeks with a loading dose given 4 weeks after first dose of active drug. Additional endpoints include select secondary and exploratory endpoints. 1Transition to 6.8 mg/kg dose occurs at non-uniform times during OLE or LTE. 2Lilleker J. 2025 Annual MDA Clinical and Scientific Conference. March 16-19, Dallas, TX. 3Sansone V, et al. Poster presentation at the Annual International Congress of the WMS, Vienna, Austria, October 7–11, 2025. Poster 380P. DMPK, dystrophia myotonica protein kinase; MAD, multiple ascending dose; MDHI Myotonic Dystrophy Health Index; LTE, long-term extension; OLE, open-label extension; Q4W, every 4 weeks; Q8W, every 8 weeks; RNA, ribonucleic acid. 3.4 mg/kg N=16 (3:3:2) Q4W, Recovery, Placebo 4
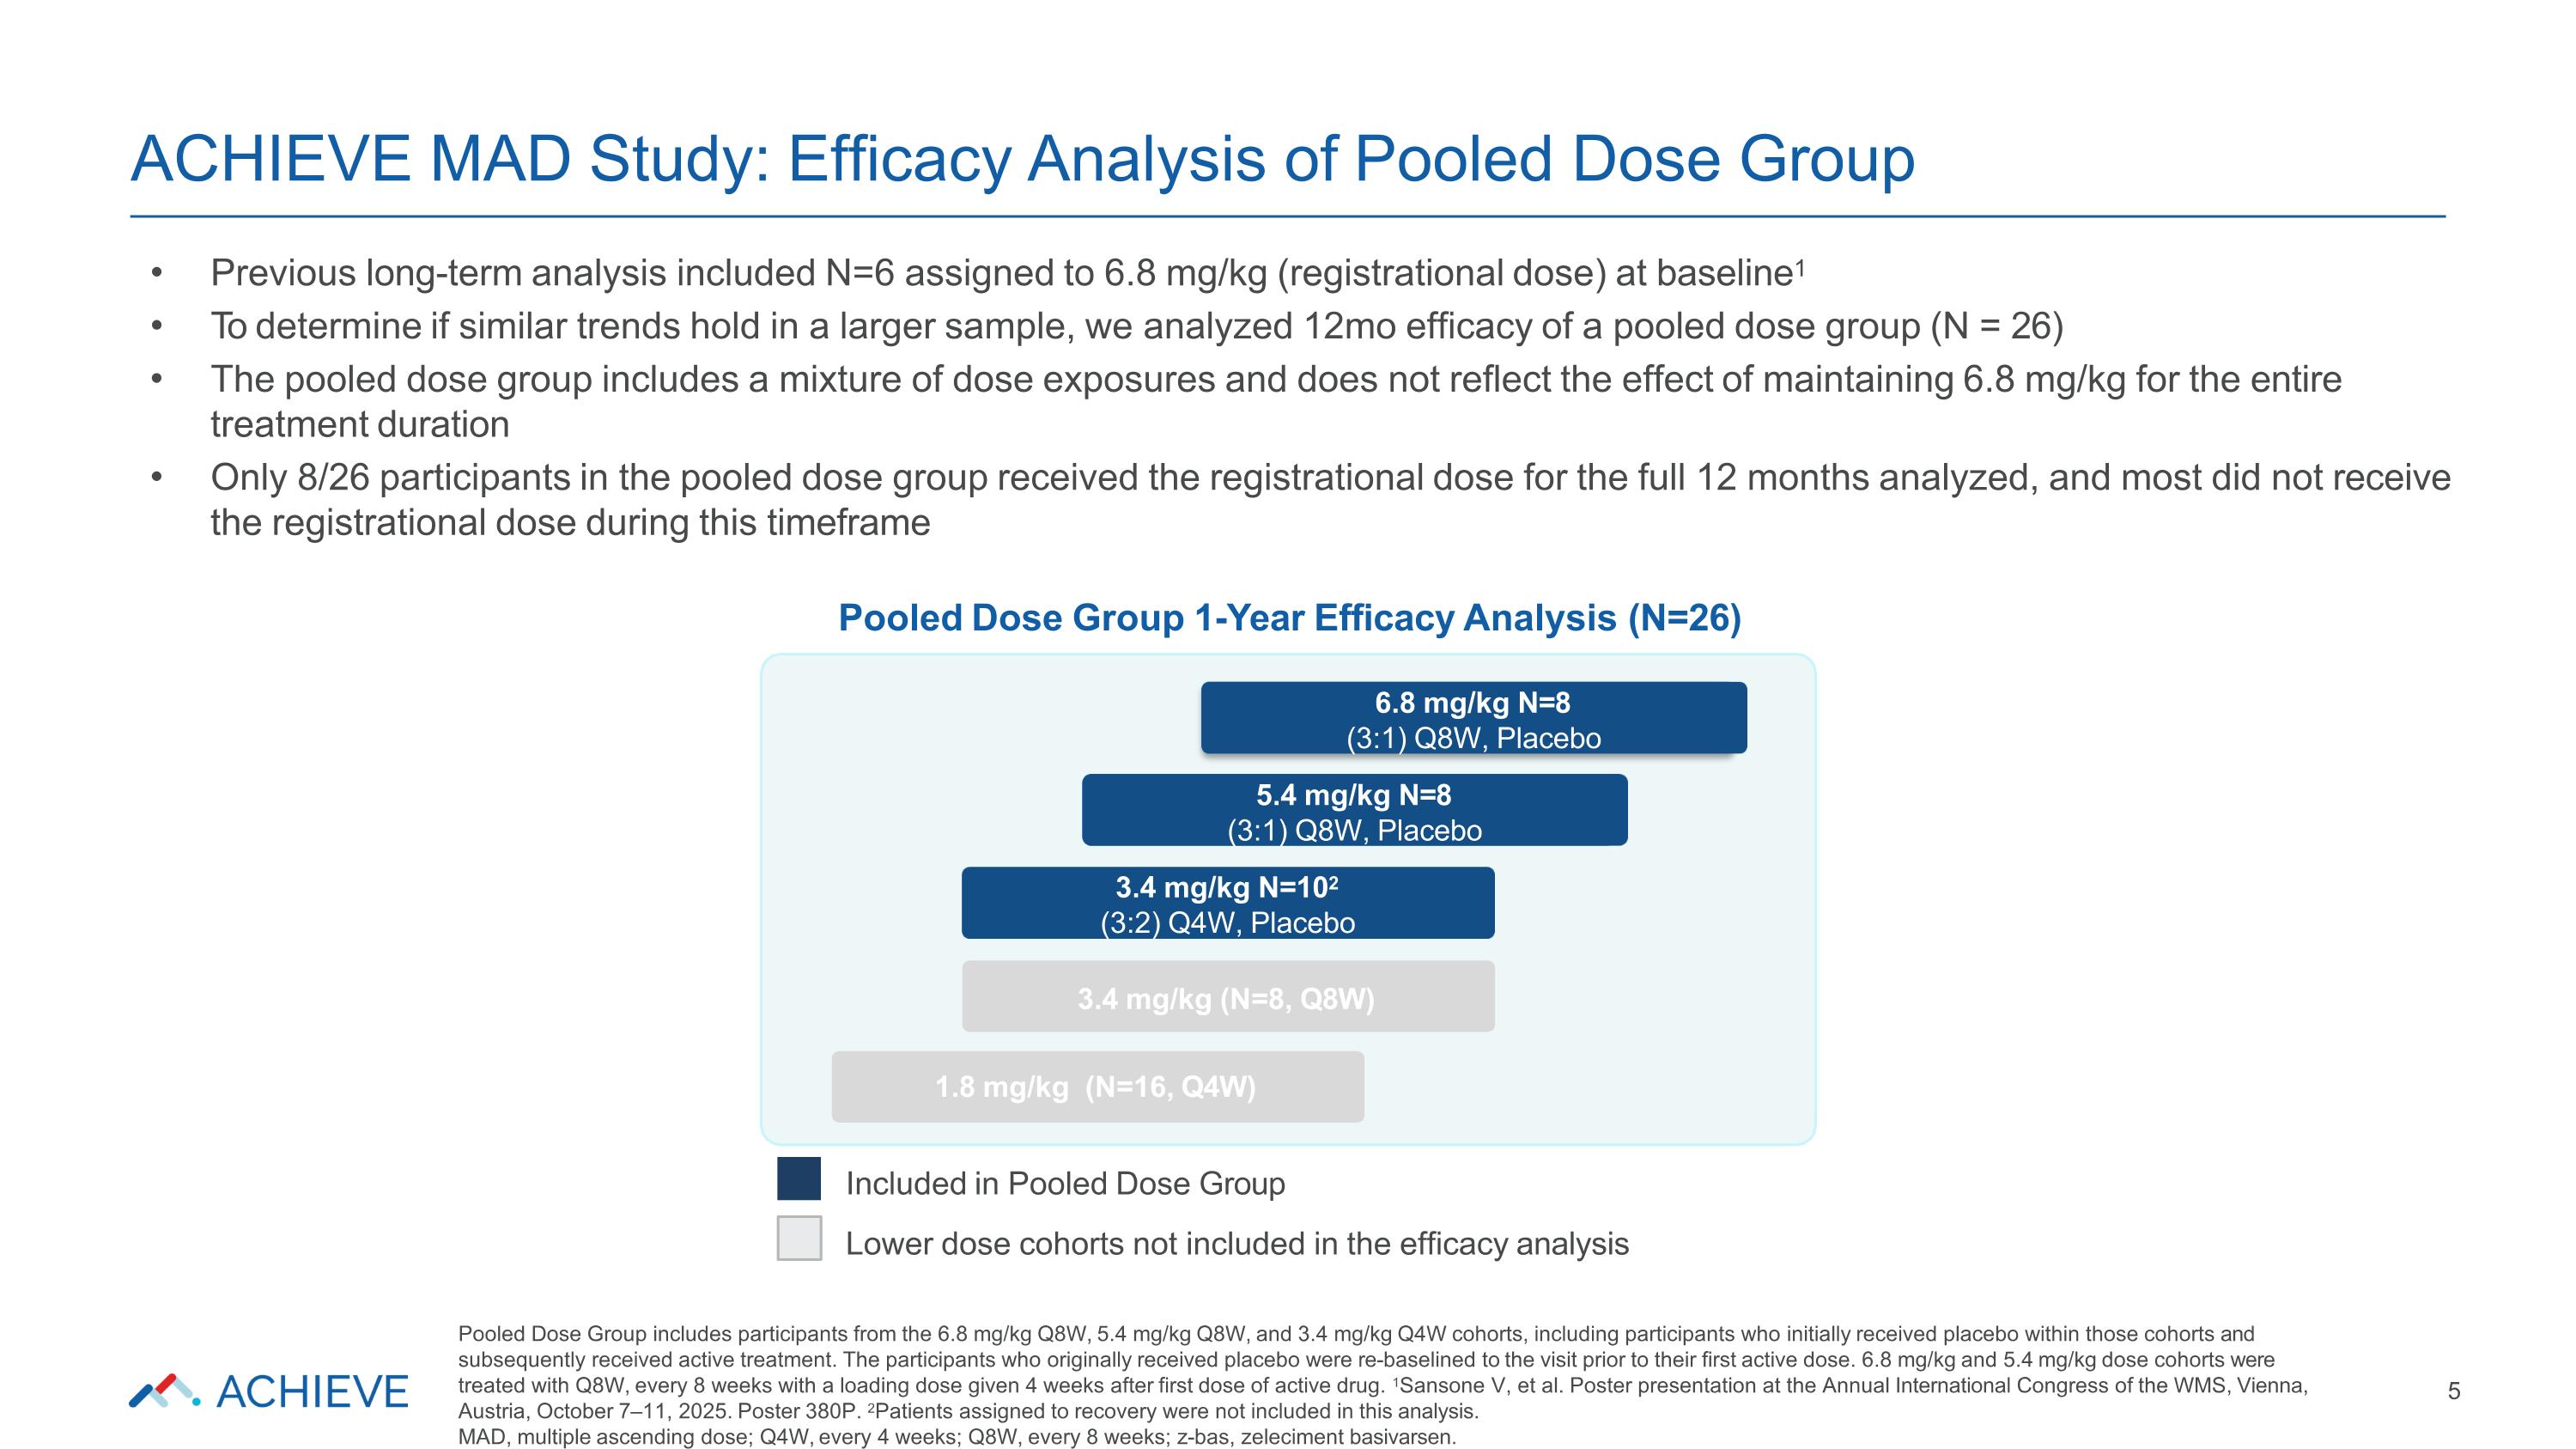
ACHIEVE MAD Study: Efficacy Analysis of Pooled Dose Group 5 1.8 mg/kg (N=16, Q4W) Included in Pooled Dose Group Lower dose cohorts not included in the efficacy analysis 5.4 mg/kg (N=8, Q8W) 6.8 mg/kg (N=8, Q8W) Previous long-term analysis included N=6 assigned to 6.8 mg/kg (registrational dose) at baseline1 To determine if similar trends hold in a larger sample, we analyzed 12mo efficacy of a pooled dose group (N = 26) The pooled dose group includes a mixture of dose exposures and does not reflect the effect of maintaining 6.8 mg/kg for the entire treatment duration Only 8/26 participants in the pooled dose group received the registrational dose for the full 12 months analyzed, and most did not receive the registrational dose during this timeframe Pooled Dose Group 1-Year Efficacy Analysis (N=26) 6.8 mg/kg N=8 (3:1) Q8W, Placebo 5.4 mg/kg N=8 (3:1) Q8W, Placebo 3.4 mg/kg N=102 (3:2) Q4W, Placebo 3.4 mg/kg (N=8, Q8W) Pooled Dose Group includes participants from the 6.8 mg/kg Q8W, 5.4 mg/kg Q8W, and 3.4 mg/kg Q4W cohorts, including participants who initially received placebo within those cohorts and subsequently received active treatment. The participants who originally received placebo were re-baselined to the visit prior to their first active dose. 6.8 mg/kg and 5.4 mg/kg dose cohorts were treated with Q8W, every 8 weeks with a loading dose given 4 weeks after first dose of active drug. 1Sansone V, et al. Poster presentation at the Annual International Congress of the WMS, Vienna, Austria, October 7–11, 2025. Poster 380P. 2Patients assigned to recovery were not included in this analysis. MAD, multiple ascending dose; Q4W, every 4 weeks; Q8W, every 8 weeks; z-bas, zeleciment basivarsen.
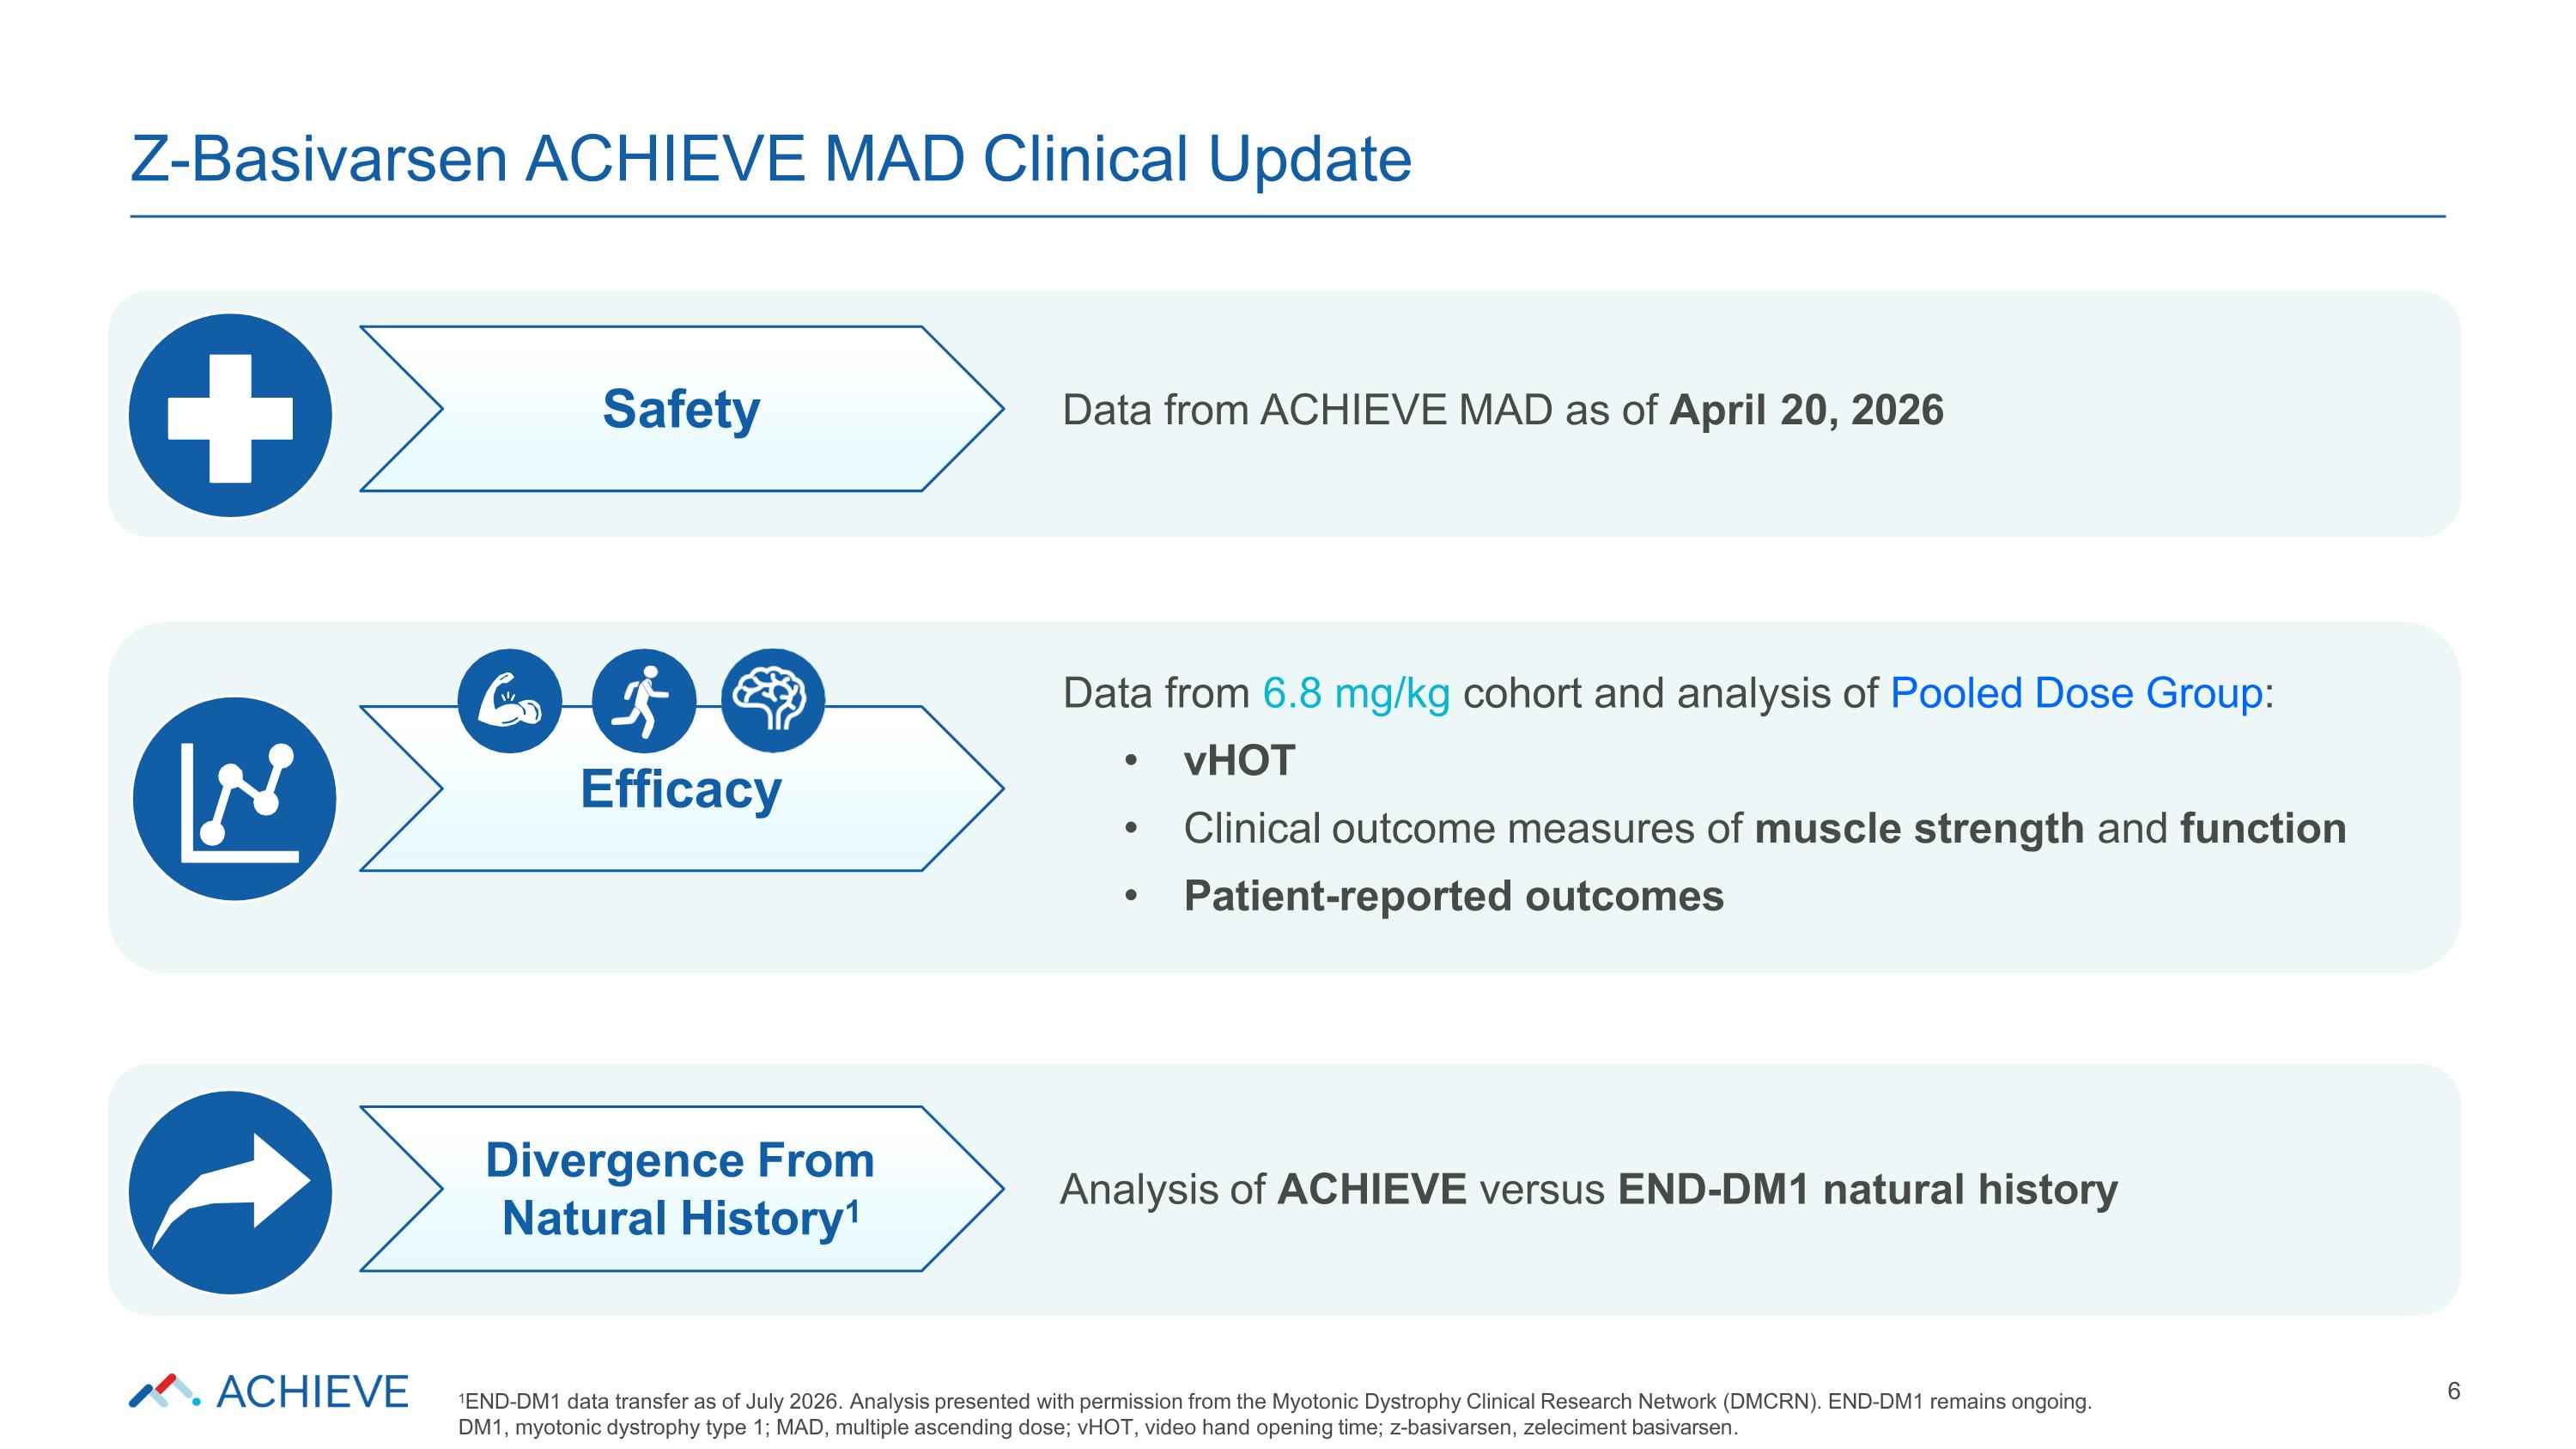
Analysis of ACHIEVE versus END-DM1 natural history Data from 6.8 mg/kg cohort and analysis of Pooled Dose Group: vHOT Clinical outcome measures of muscle strength and function Patient-reported outcomes Data from ACHIEVE MAD as of April 20, 2026 Z-Basivarsen ACHIEVE MAD Clinical Update 6 Safety Efficacy Divergence From Natural History1 1END-DM1 data transfer as of July 2026. Analysis presented with permission from the Myotonic Dystrophy Clinical Research Network (DMCRN). END-DM1 remains ongoing. DM1, myotonic dystrophy type 1; MAD, multiple ascending dose; vHOT, video hand opening time;; z-basivarsen, zeleciment basivarsen..
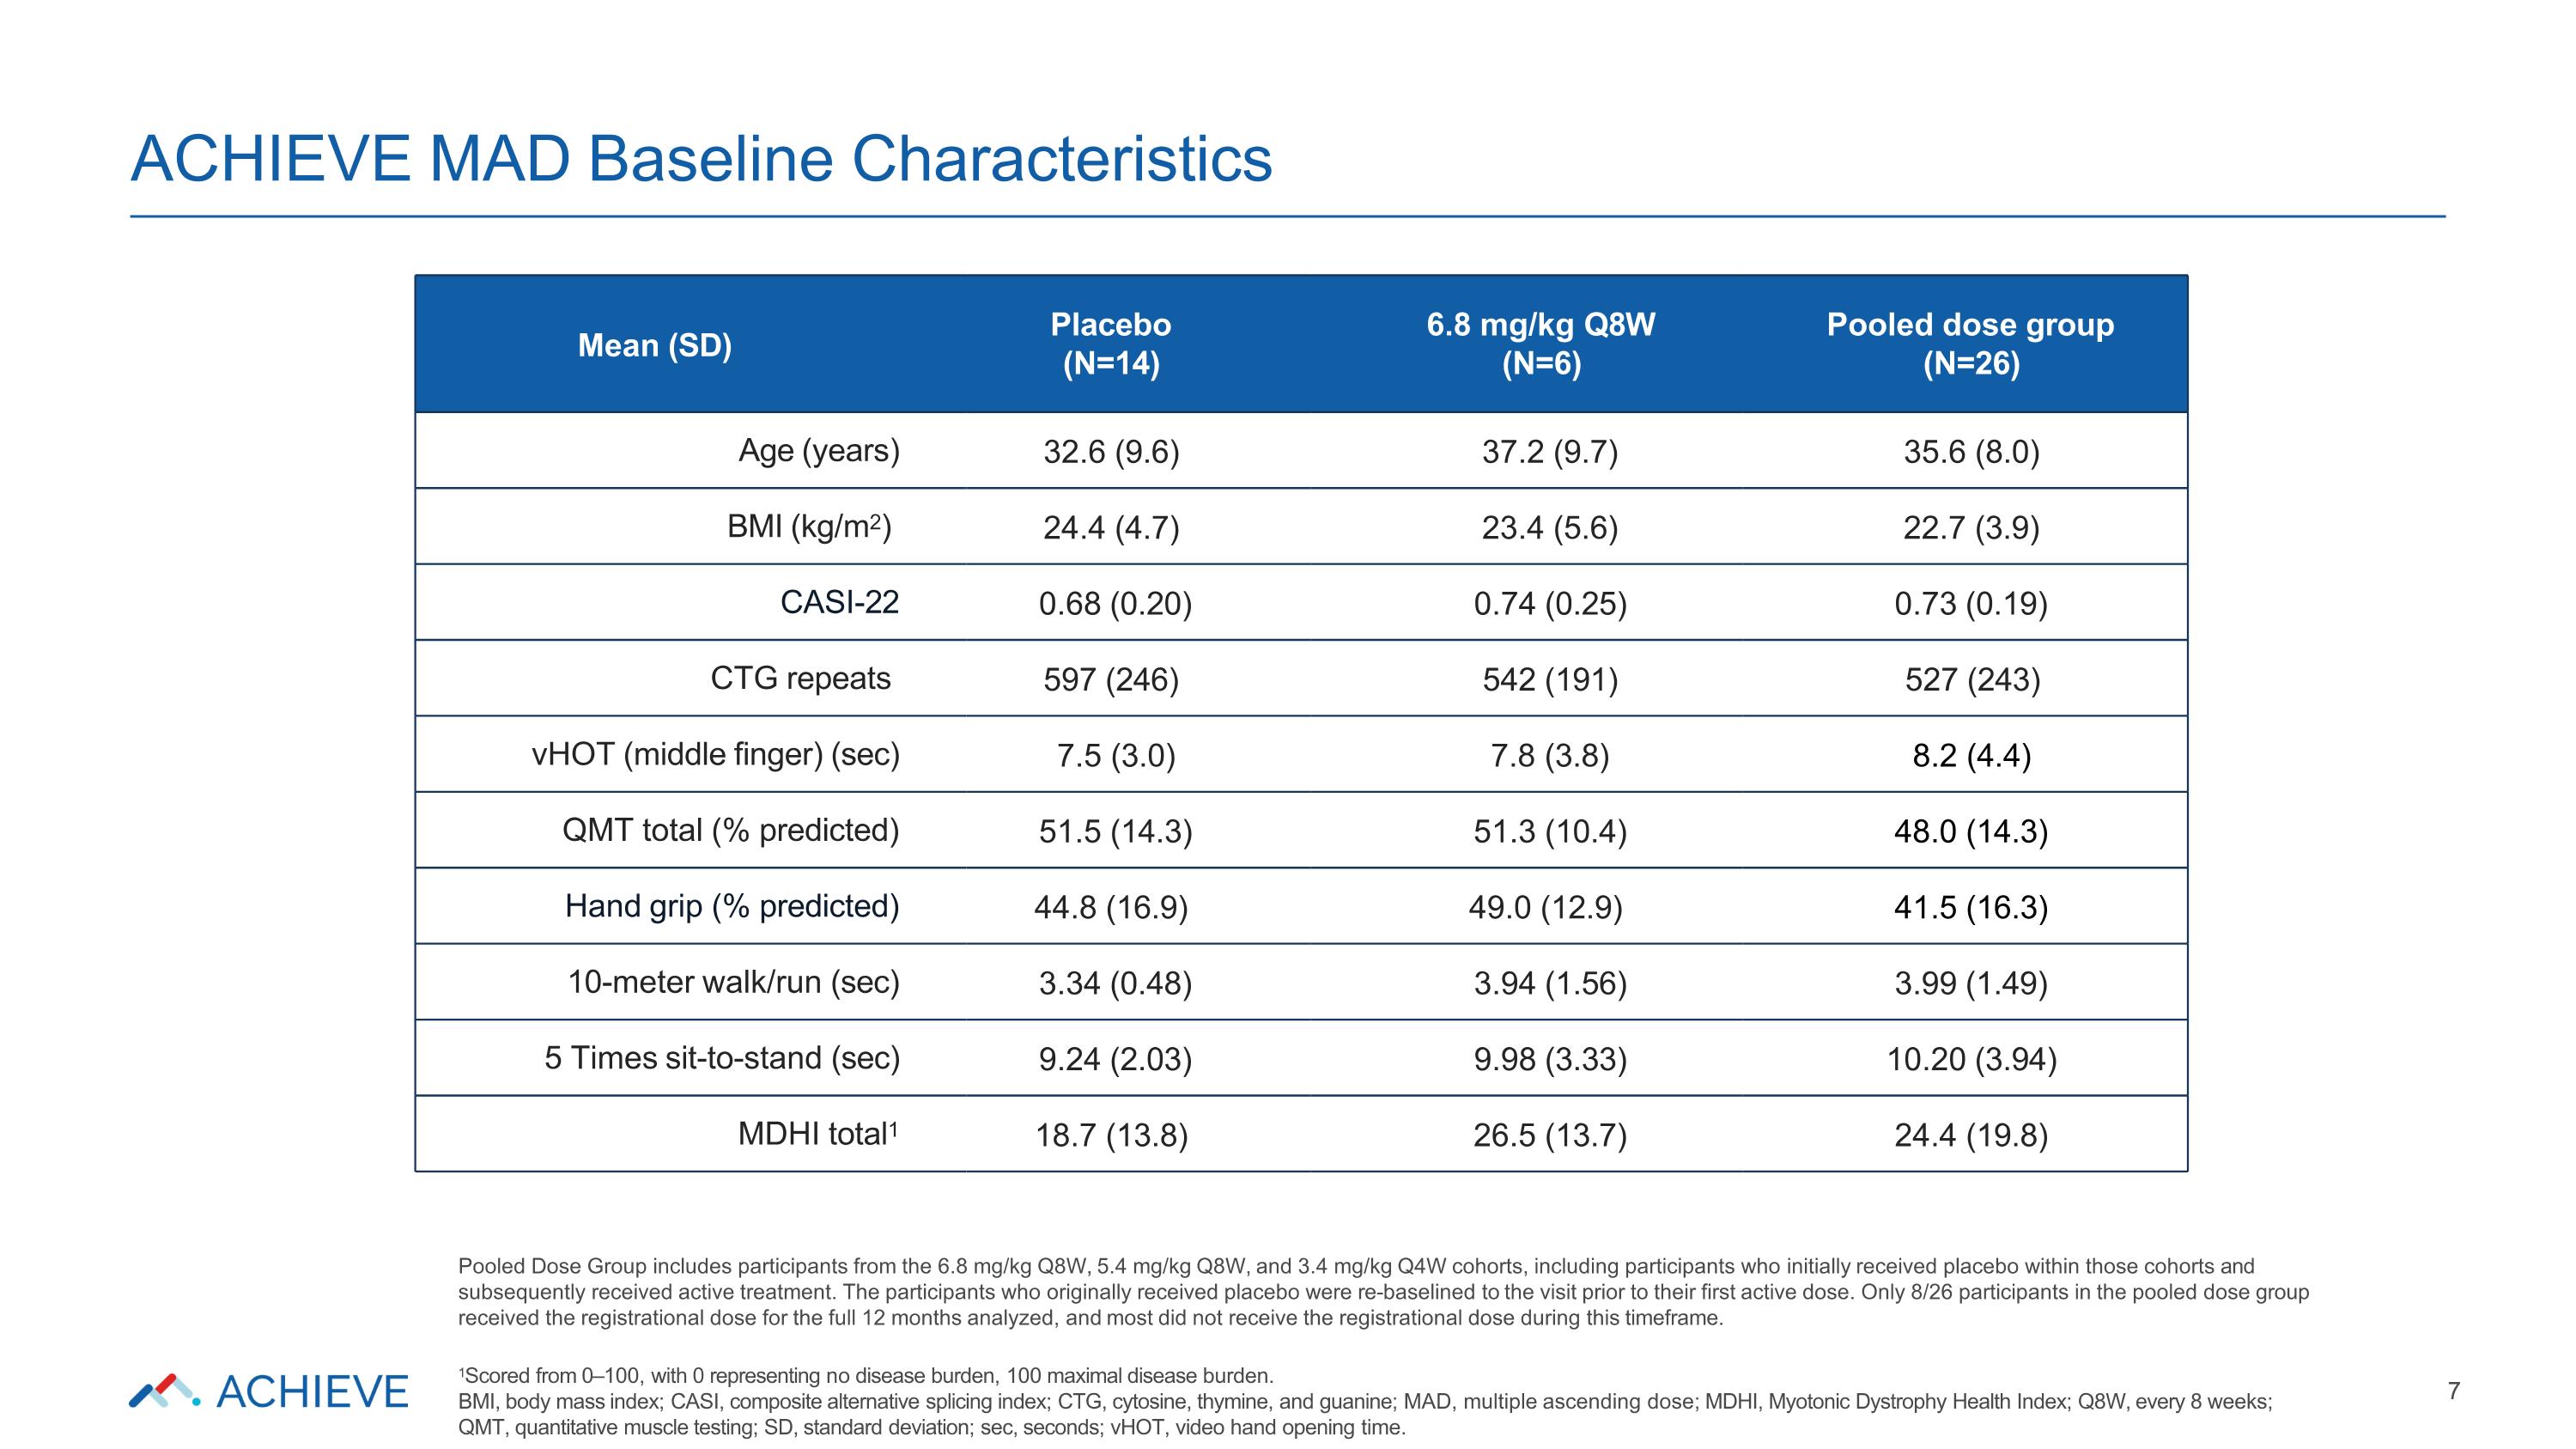
ACHIEVE MAD Baseline Characteristics 7 Mean (SD) Placebo (N=14) 6.8 mg/kg Q8W (N=6) Pooled dose group (N=26) Age (years) 32.6 (9.6) 37.2 (9.7) 35.6 (8.0) BMI (kg/m2) 24.4 (4.7) 23.4 (5.6) 22.7 (3.9) CASI-22 0.68 (0.20) 0.74 (0.25) 0.73 (0.19) CTG repeats 597 (246) 542 (191) 527 (243) vHOT (middle finger) (sec) 7.5 (3.0) 7.8 (3.8) 8.2 (4.4) QMT total (% predicted) 51.5 (14.3) 51.3 (10.4) 48.0 (14.3) Hand grip (% predicted) 44.8 (16.9) 49.0 (12.9) 41.5 (16.3) 10-meter walk/run (sec) 3.34 (0.48) 3.94 (1.56) 3.99 (1.49) 5 Times sit-to-stand (sec) 9.24 (2.03) 9.98 (3.33) 10.20 (3.94) MDHI total1 18.7 (13.8) 26.5 (13.7) 24.4 (19.8) Pooled Dose Group includes participants from the 6.8 mg/kg Q8W, 5.4 mg/kg Q8W, and 3.4 mg/kg Q4W cohorts, including participants who initially received placebo within those cohorts and subsequently received active treatment. The participants who originally received placebo were re-baselined to the visit prior to their first active dose. Only 8/26 participants in the pooled dose group received the registrational dose for the full 12 months analyzed, and most did not receive the registrational dose during this timeframe. 1Scored from 0–100, with 0 representing no disease burden, 100 maximal disease burden. BMI, body mass index; CASI, composite alternative splicing index; CTG, cytosine, thymine, and guanine; MAD, multiple ascending dose; MDHI, Myotonic Dystrophy Health Index; Q8W, every 8 weeks; QMT, quantitative muscle testing; SD, standard deviation; sec, seconds; vHOT, video hand opening time.
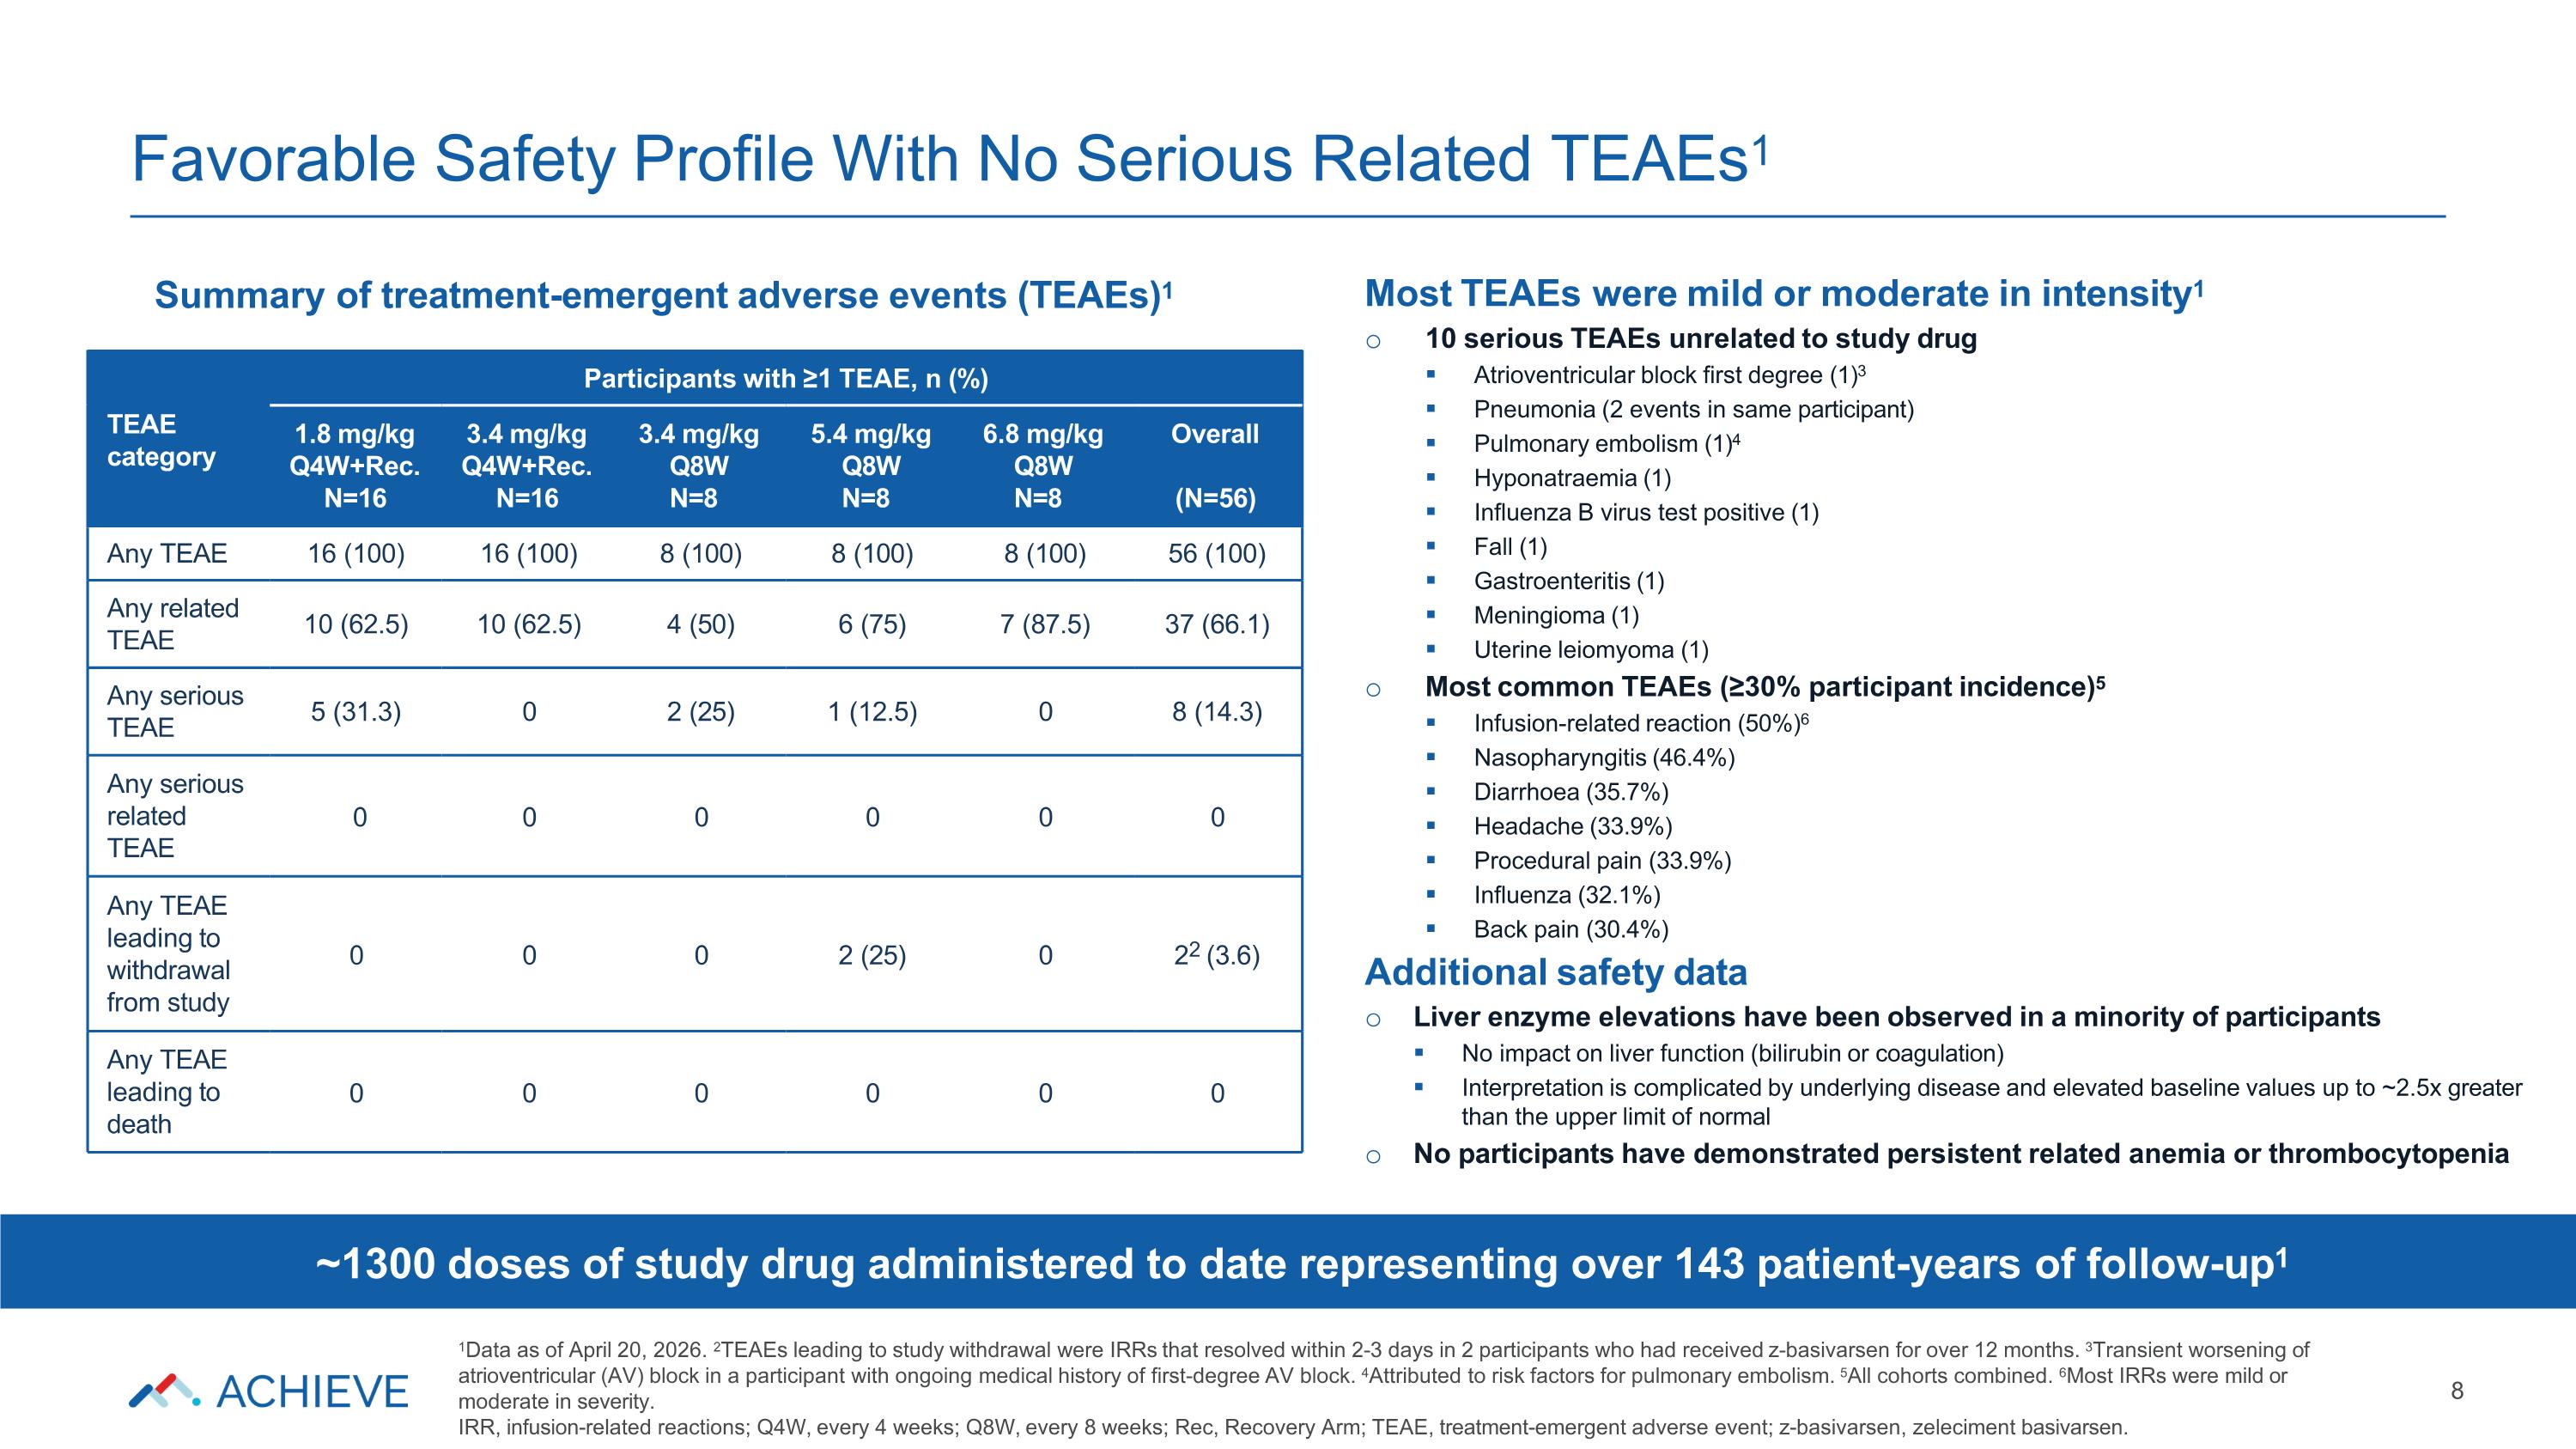
Favorable Safety Profile With No Serious Related TEAEs1 Summary of treatment-emergent adverse events (TEAEs)1 TEAE category Participants with ≥1 TEAE, n (%) 1.8 mg/kg Q4W+Rec. N=16 3.4 mg/kg Q4W+Rec. N=16 3.4 mg/kg Q8W N=8 5.4 mg/kg Q8W N=8 6.8 mg/kg Q8W N=8 Overall (N=56) Any TEAE 16 (100) 16 (100) 8 (100) 8 (100) 8 (100) 56 (100) Any related TEAE 10 (62.5) 10 (62.5) 4 (50) 6 (75) 7 (87.5) 37 (66.1) Any serious TEAE 5 (31.3) 0 2 (25) 1 (12.5) 0 8 (14.3) Any serious related TEAE 0 0 0 0 0 0 Any TEAE leading to withdrawal from study 0 0 0 2 (25) 0 22 (3.6) Any TEAE leading to death 0 0 0 0 0 0 Most TEAEs were mild or moderate in intensity1 10 serious TEAEs unrelated to study drug Atrioventricular block first degree (1)3 Pneumonia (2 events in same participant) Pulmonary embolism (1)4 Hyponatraemia (1) Influenza B virus test positive (1) Fall (1) Gastroenteritis (1) Meningioma (1) Uterine leiomyoma (1) Most common TEAEs (≥30% participant incidence)5 Infusion-related reaction (50%)6 Nasopharyngitis (46.4%) Diarrhoea (35.7%) Headache (33.9%) Procedural pain (33.9%) Influenza (32.1%) Back pain (30.4%) Additional safety data Liver enzyme elevations have been observed in a minority of participants No impact on liver function (bilirubin or coagulation) Interpretation is complicated by underlying disease and elevated baseline values up to ~2.5x greater than the upper limit of normal No participants have demonstrated persistent related anemia or thrombocytopenia ~1300 doses of study drug administered to date representing over 143 patient-years of follow-up1 1Data as of April 20, 2026. 2TEAEs leading to study withdrawal were IRRs that resolved within 2-3 days in 2 participants who had received z-basivarsen for over 12 months. 3Transient worsening of atrioventricular (AV) block in a participant with ongoing medical history of first-degree AV block. 4Attributed to risk factors for pulmonary embolism. 5All cohorts combined. 6Most IRRs were mild or moderate in severity. IRR, infusion-related reactions; Q4W, every 4 weeks; Q8W, every 8 weeks; Rec, Recovery Arm; TEAE, treatment-emergent adverse event; z-basivarsen, zeleciment basivarsen. 8
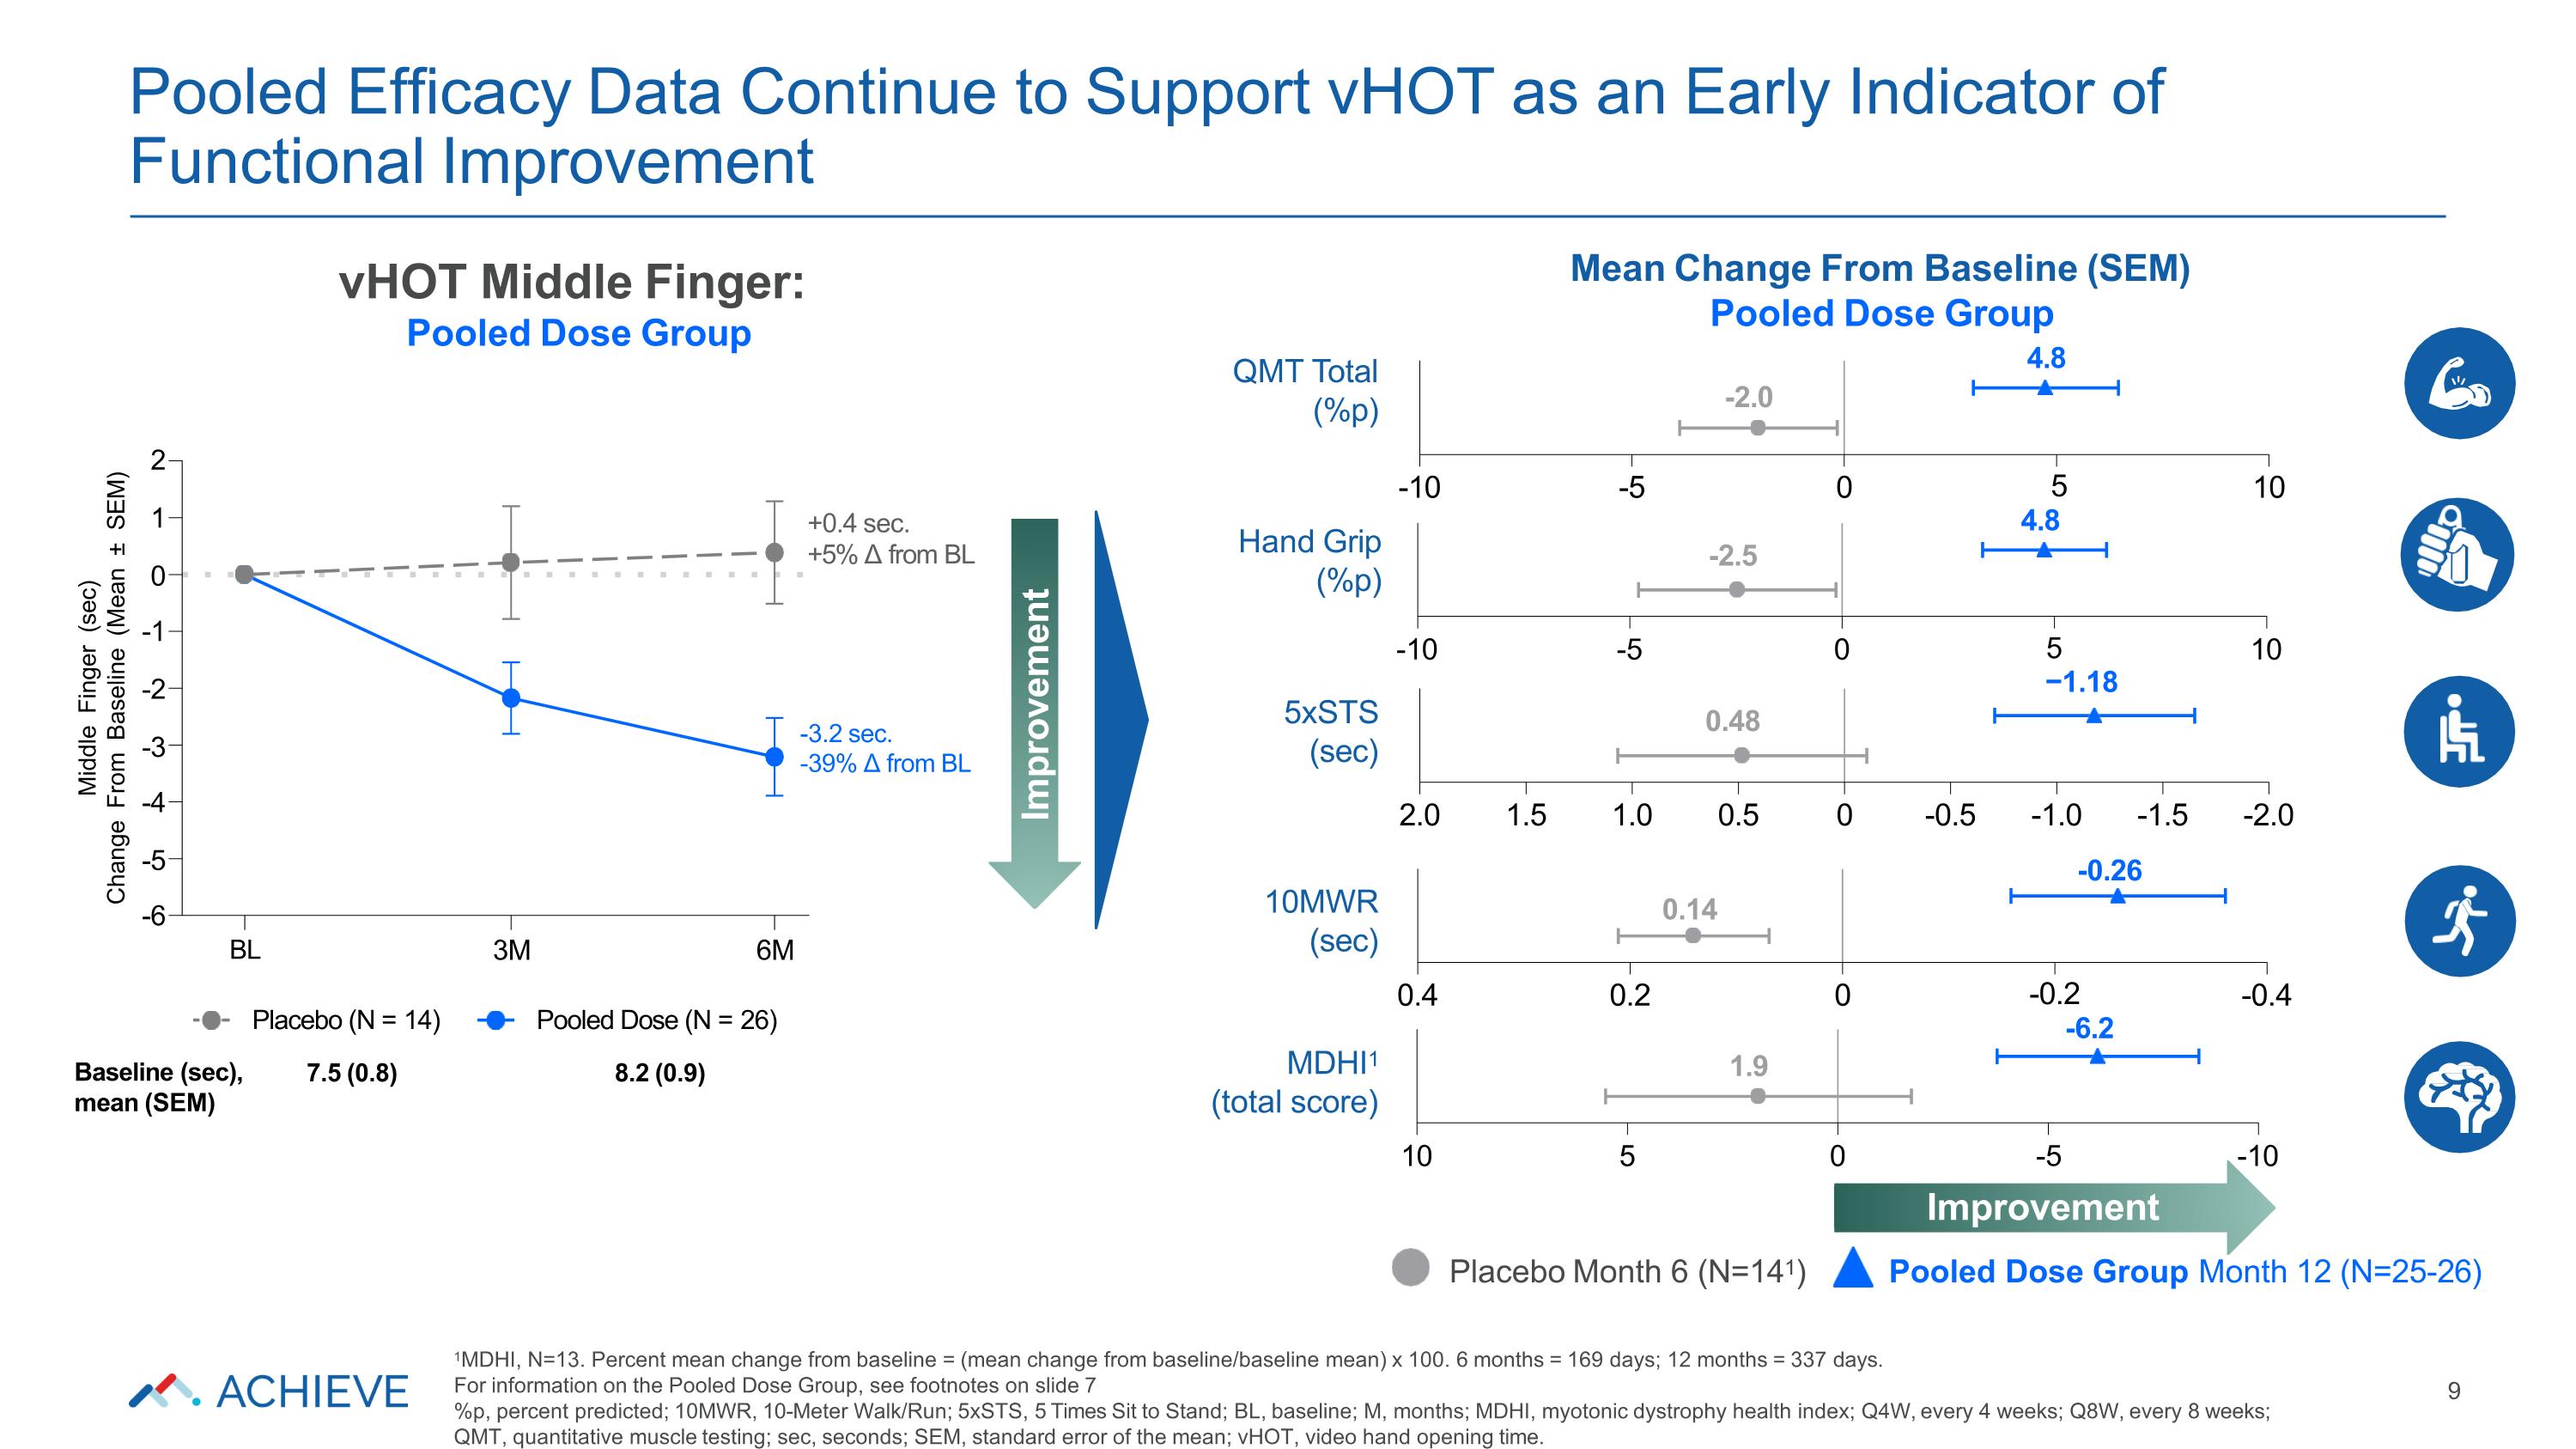
-10 -5 0 10 9 Placebo Month 6 (N=141) Pooled Dose Group Month 12 (N=25-26) 5xSTS (sec) 0.48 5 −1.18 QMT Total (%p) -2.0 4.8 Improvement Mean Change From Baseline (SEM) Pooled Dose Group vHOT Middle Finger: Pooled Dose Group MDHI1 (total score) 1.9 10MWR (sec) -0.26 0.14 Hand Grip (%p) -2.5 Pooled Efficacy Data Continue to Support vHOT as an Early Indicator of Functional Improvement 1MDHI, N=13. Percent mean change from baseline = (mean change from baseline/baseline mean) x 100. 6 months = 169 days; 12 months = 337 days. For information on the Pooled Dose Group, see footnotes on slide 7 %p, percent predicted; 10MWR, 10-Meter Walk/Run; 5xSTS, 5 Times Sit to Stand; BL, baseline; M, months; MDHI, myotonic dystrophy health index; Q4W, every 4 weeks; Q8W, every 8 weeks; QMT, quantitative muscle testing; sec, seconds; SEM, standard error of the mean; vHOT, video hand opening time. 2 1 0 -1 -2 -3 -4 -5 -6 Middle Finger (sec) Change From Baseline (Mean ± SEM) BL 3M 6M Placebo (N = 14) 7.5 (0.8) Pooled Dose (N = 26) 8.2 (0.9) +0.4 sec. +5% Δ from BL Baseline (sec), mean (SEM) -3.2 sec. -39% Δ from BL -10 -5 0 5 4.8 10 -2.0 -1.5 -1.0 -0.5 0.5 1.0 1.5 2.0 0 -0.4 -0.2 -6.2 0.2 0.4 0 -10 -5 Improvement 0 5 10
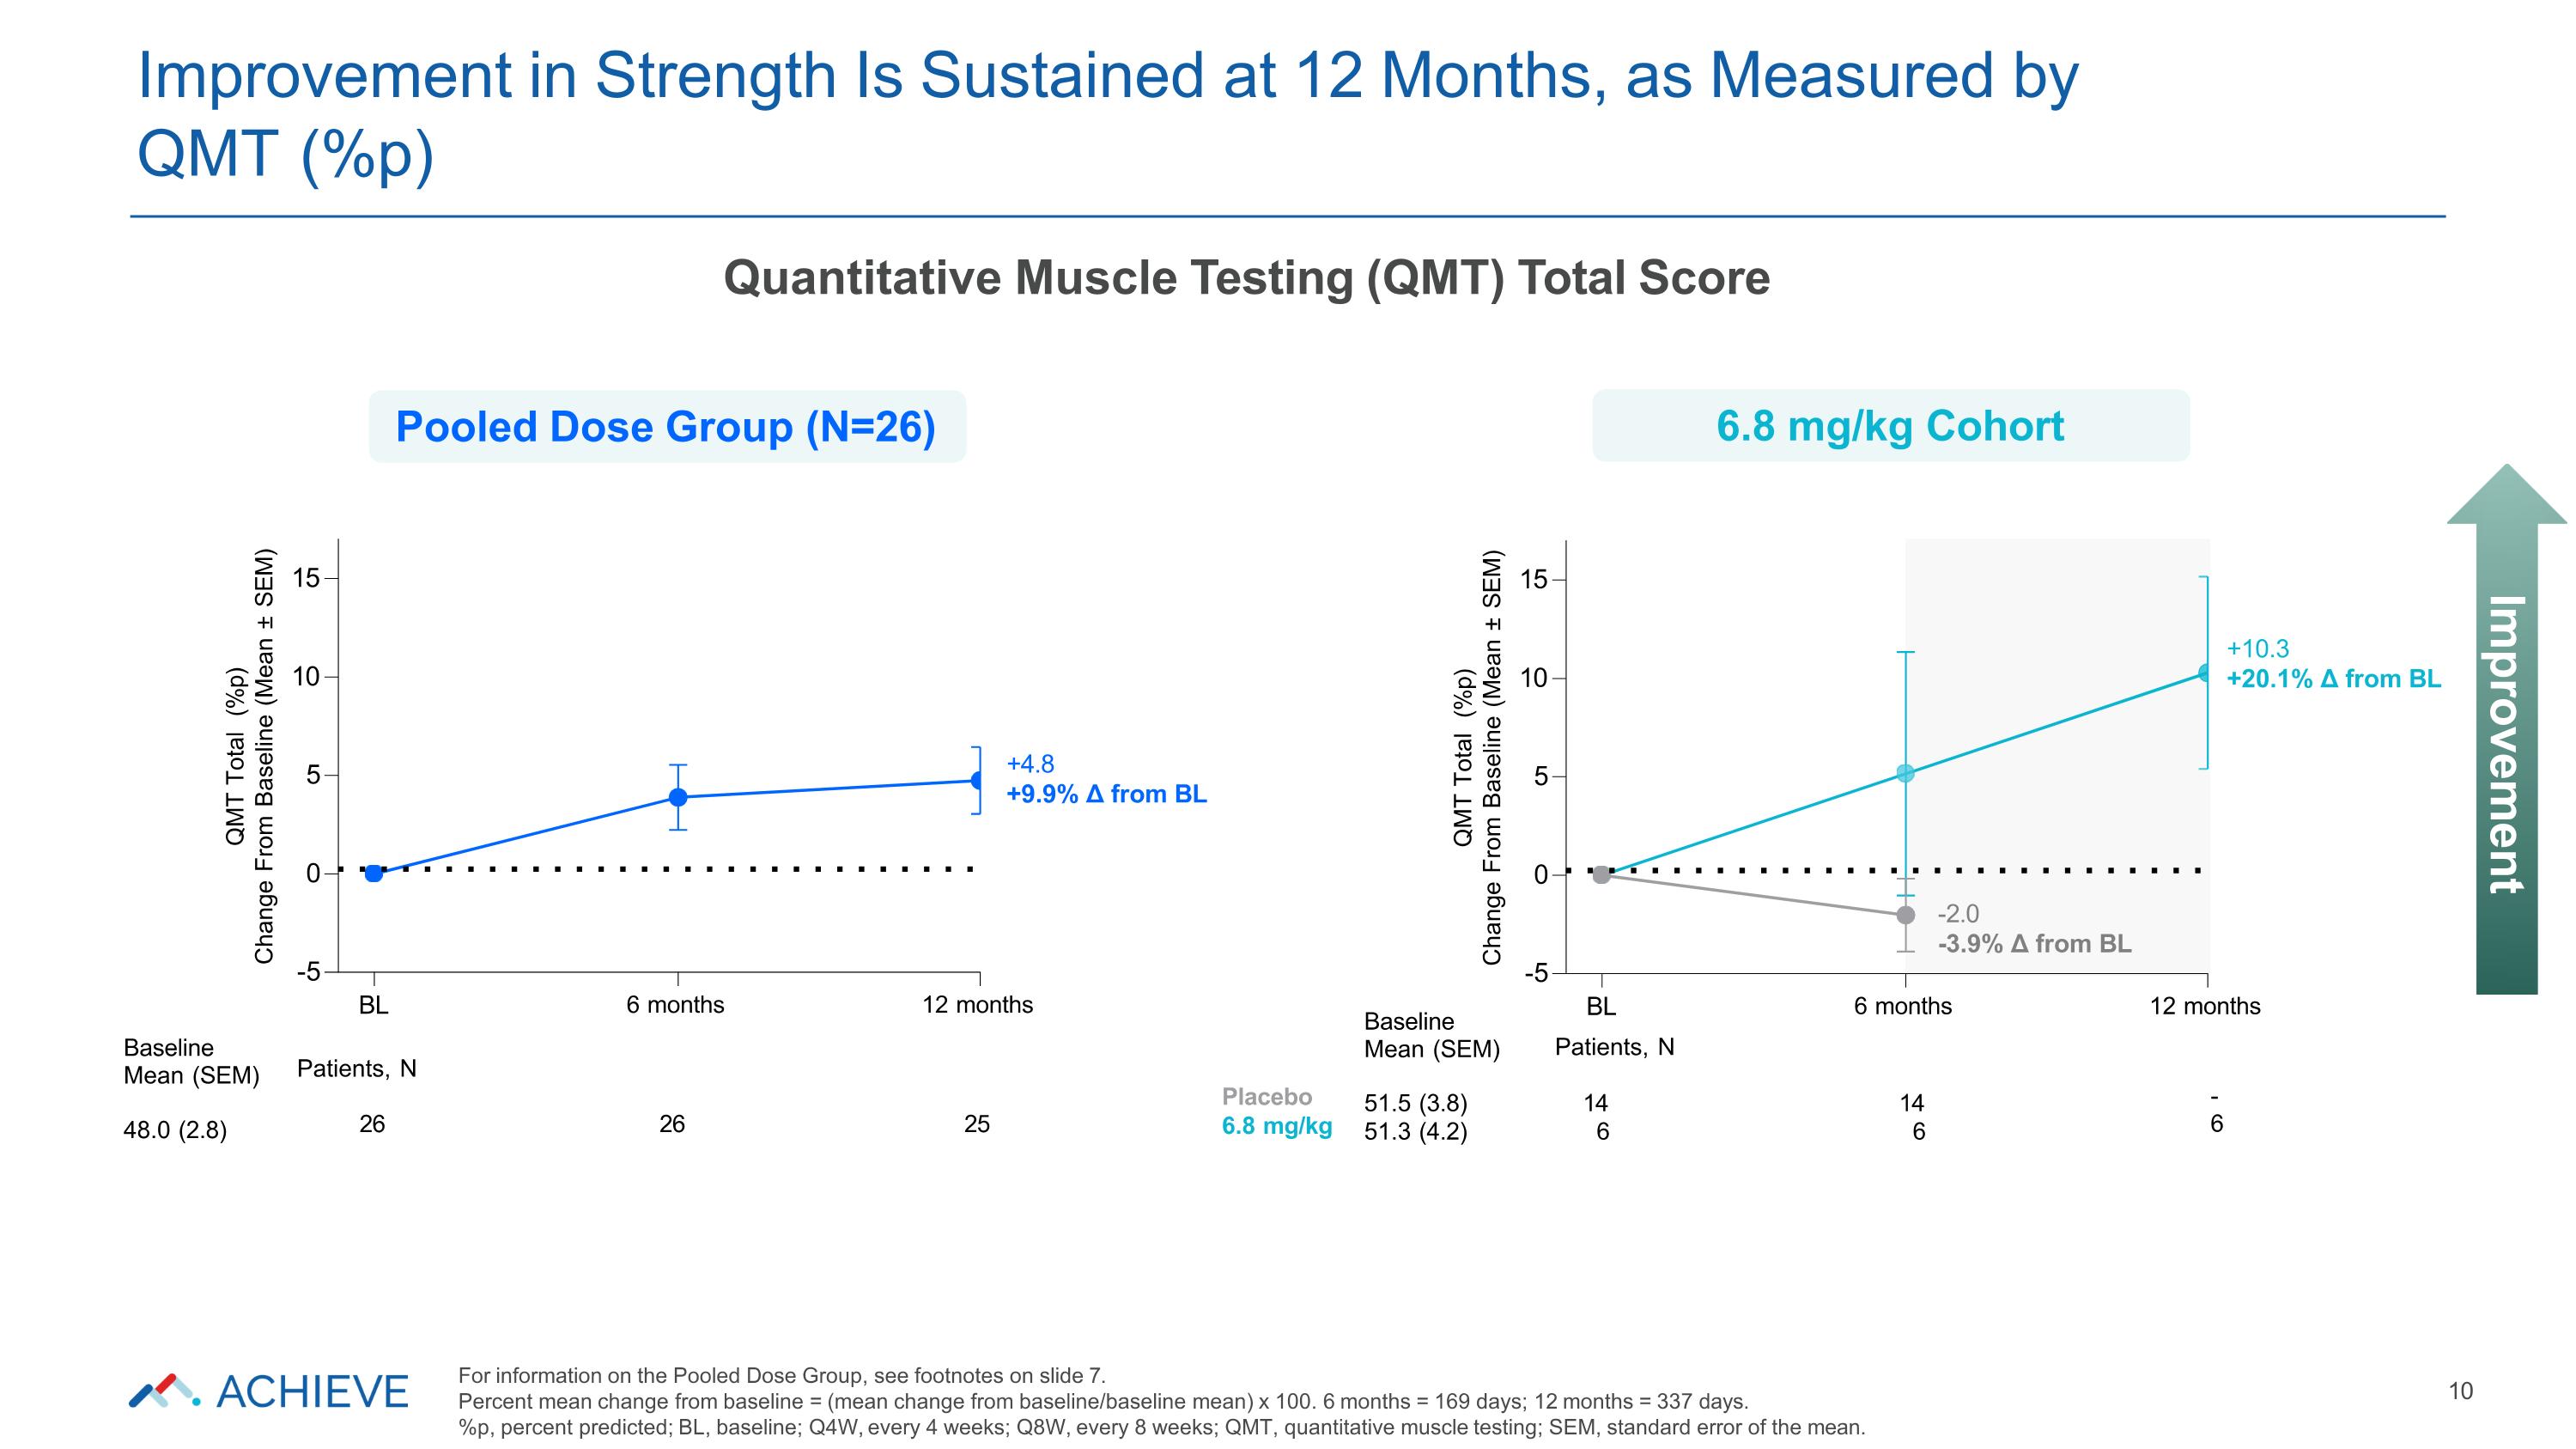
QMT Total (%p) Change From Baseline (Mean ± SEM) 6 months 12 months 0 5 10 15 -5 +10.3 +20.1% Δ from BL -2.0 -3.9% Δ from BL BL Patients, N Placebo 6.8 mg/kg 14 6 14 6 - 6 Baseline Mean (SEM) 51.5 (3.8) 51.3 (4.2) QMT Total (%p) Change From Baseline (Mean ± SEM) BL 6 months 12 months 0 5 10 15 -5 +4.8 +9.9% Δ from BL Baseline Mean (SEM) 48.0 (2.8) Patients, N 26 26 25 Improvement in Strength Is Sustained at 12 Months, as Measured by QMT (%p) 10 Pooled Dose Group (N=26) 6.8 mg/kg Cohort Quantitative Muscle Testing (QMT) Total Score Improvement For information on the Pooled Dose Group, see footnotes on slide 7. Percent mean change from baseline = (mean change from baseline/baseline mean) x 100. 6 months = 169 days; 12 months = 337 days. %p, percent predicted; BL, baseline; Q4W, every 4 weeks; Q8W, every 8 weeks; QMT, quantitative muscle testing; SEM, standard error of the mean.
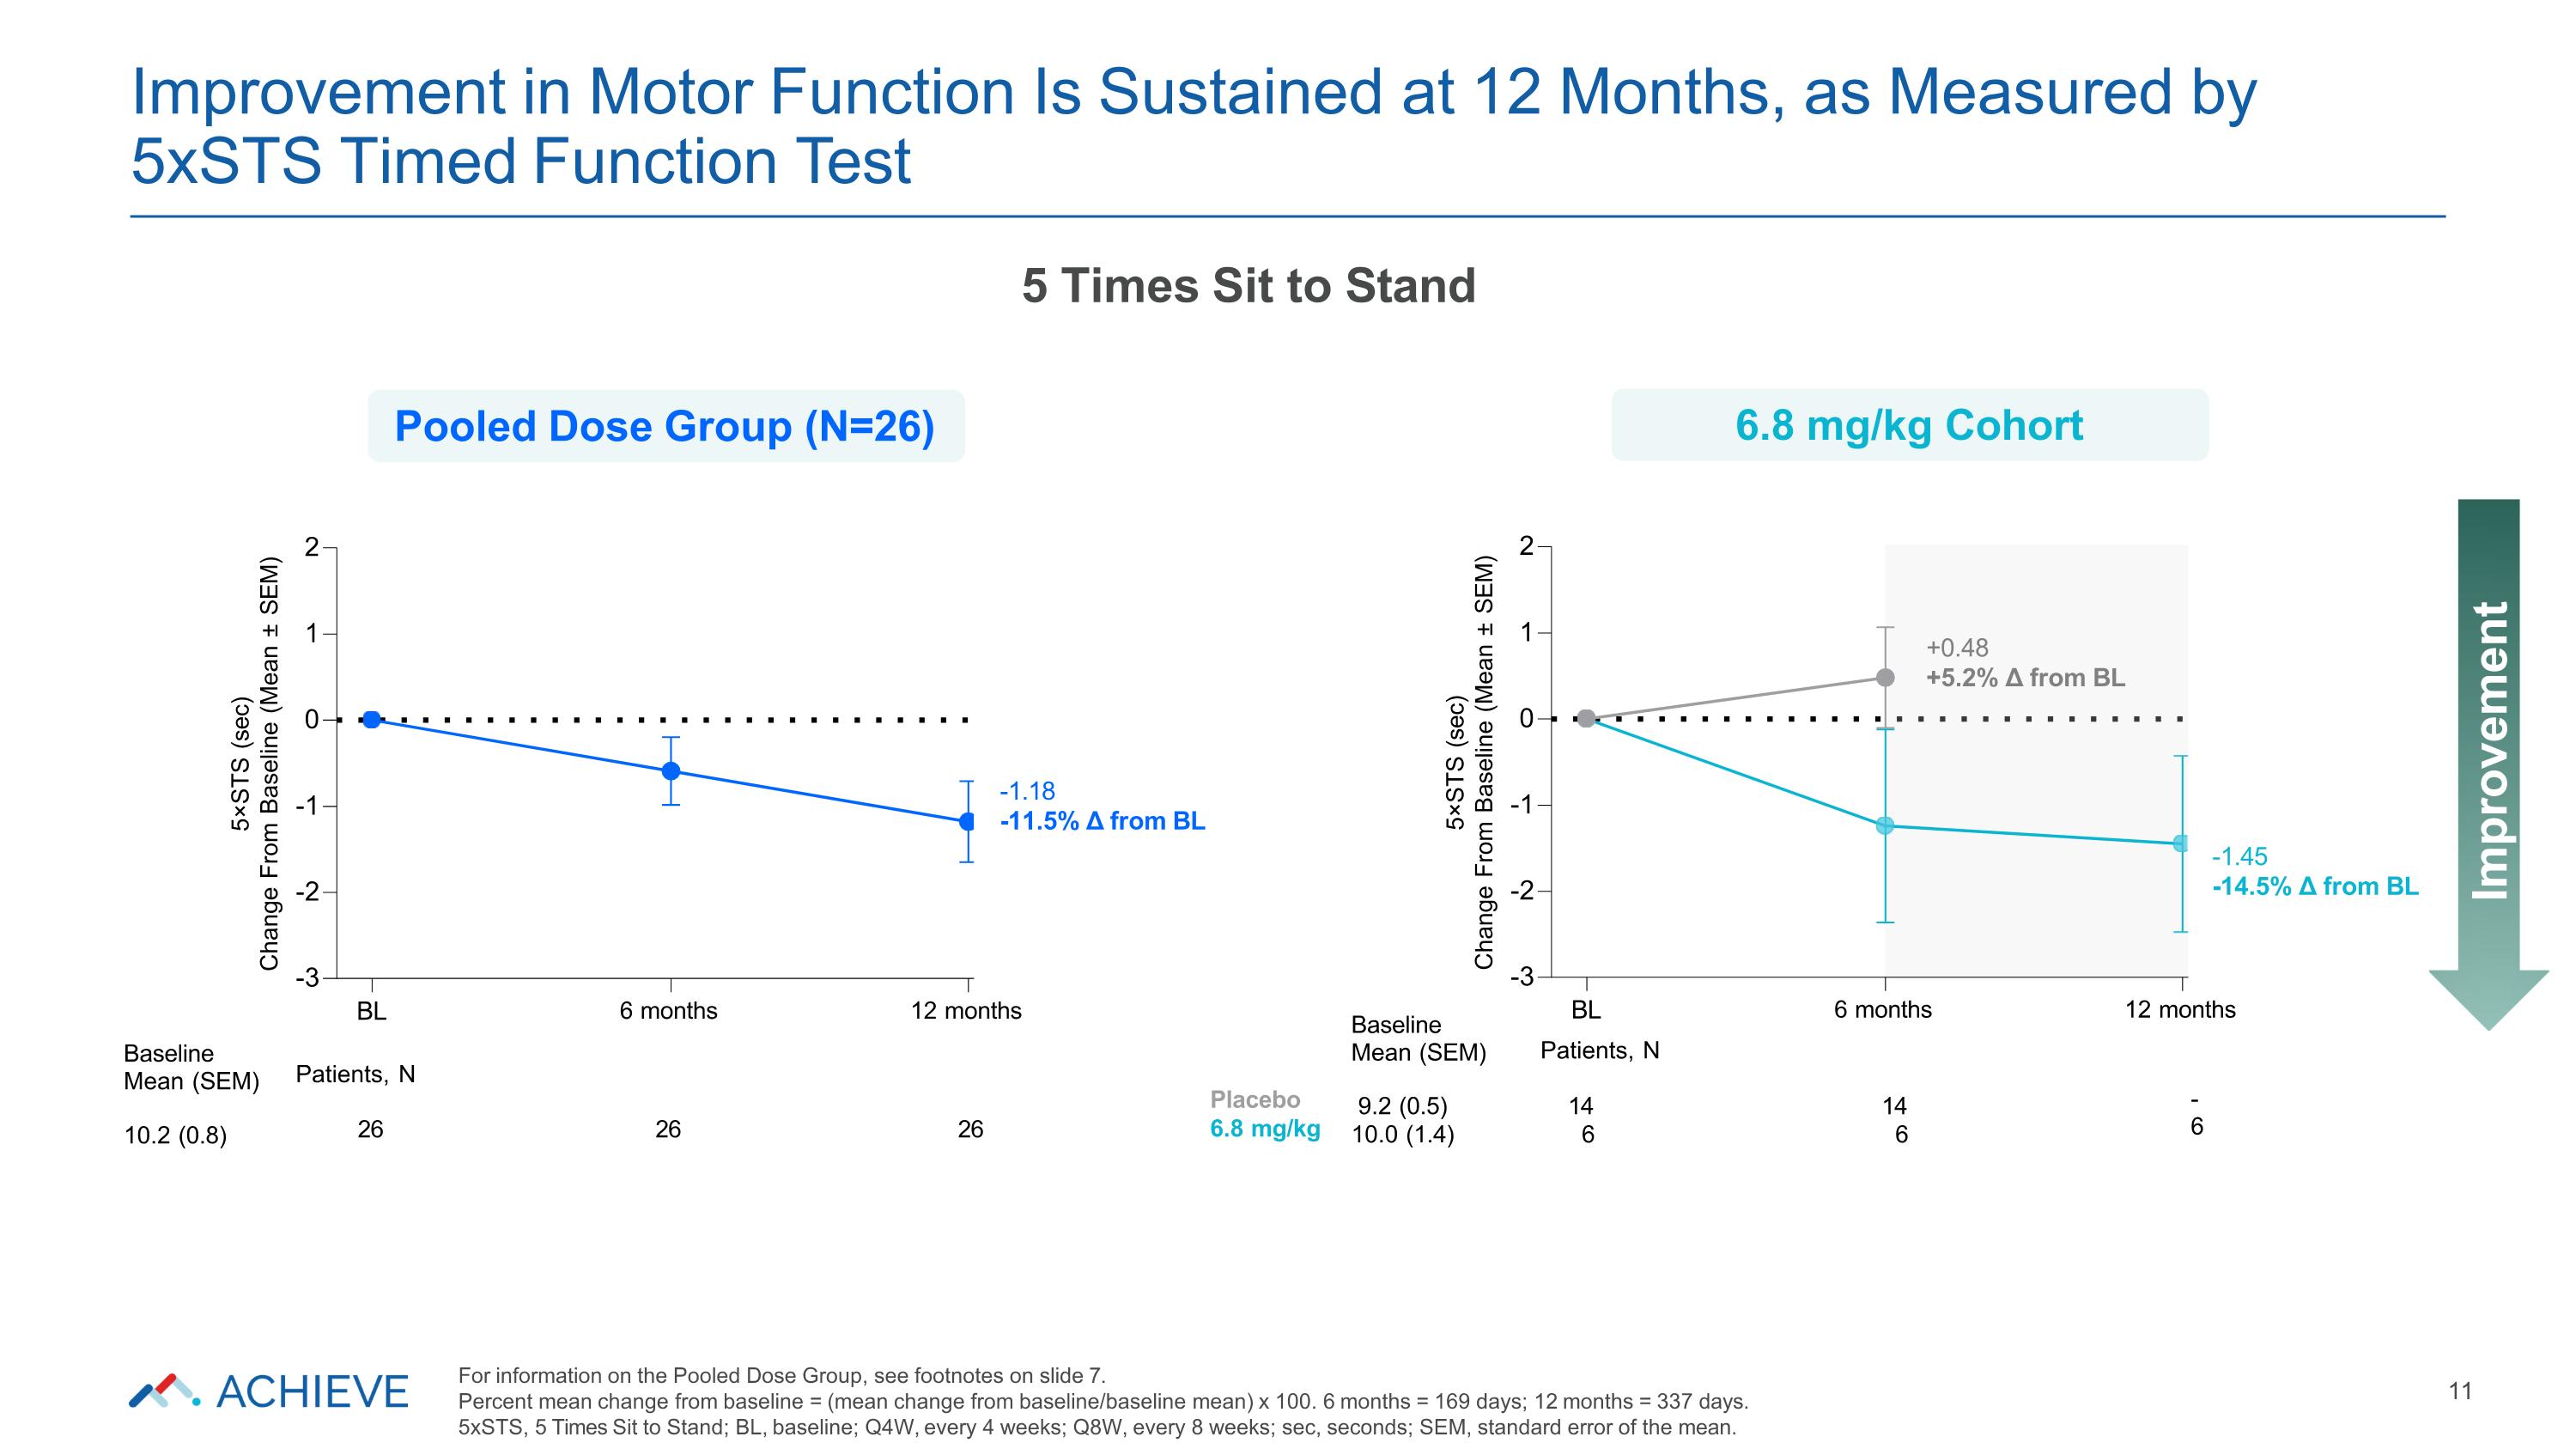
-3 -2 -1 0 1 2 5×STS (sec) Change From Baseline (Mean ± SEM) 6 months 12 months -1.45 -14.5% Δ from BL +0.48 +5.2% Δ from BL BL Patients, N Placebo 6.8 mg/kg 14 6 14 6 - 6 Baseline Mean (SEM) 9.2 (0.5) 10.0 (1.4) -3 -2 -1 0 1 2 5×STS (sec) Change From Baseline (Mean ± SEM) BL 6 months 12 months -1.18 -11.5% Δ from BL Baseline Mean (SEM) 10.2 (0.8) Patients, N 26 26 26 Improvement in Motor Function Is Sustained at 12 Months, as Measured by 5xSTS Timed Function Test 11 Improvement 5 Times Sit to Stand Pooled Dose Group (N=26) 6.8 mg/kg Cohort For information on the Pooled Dose Group, see footnotes on slide 7. Percent mean change from baseline = (mean change from baseline/baseline mean) x 100. 6 months = 169 days; 12 months = 337 days. 5xSTS, 5 Times Sit to Stand; BL, baseline; Q4W, every 4 weeks; Q8W, every 8 weeks; sec, seconds; SEM, standard error of the mean.
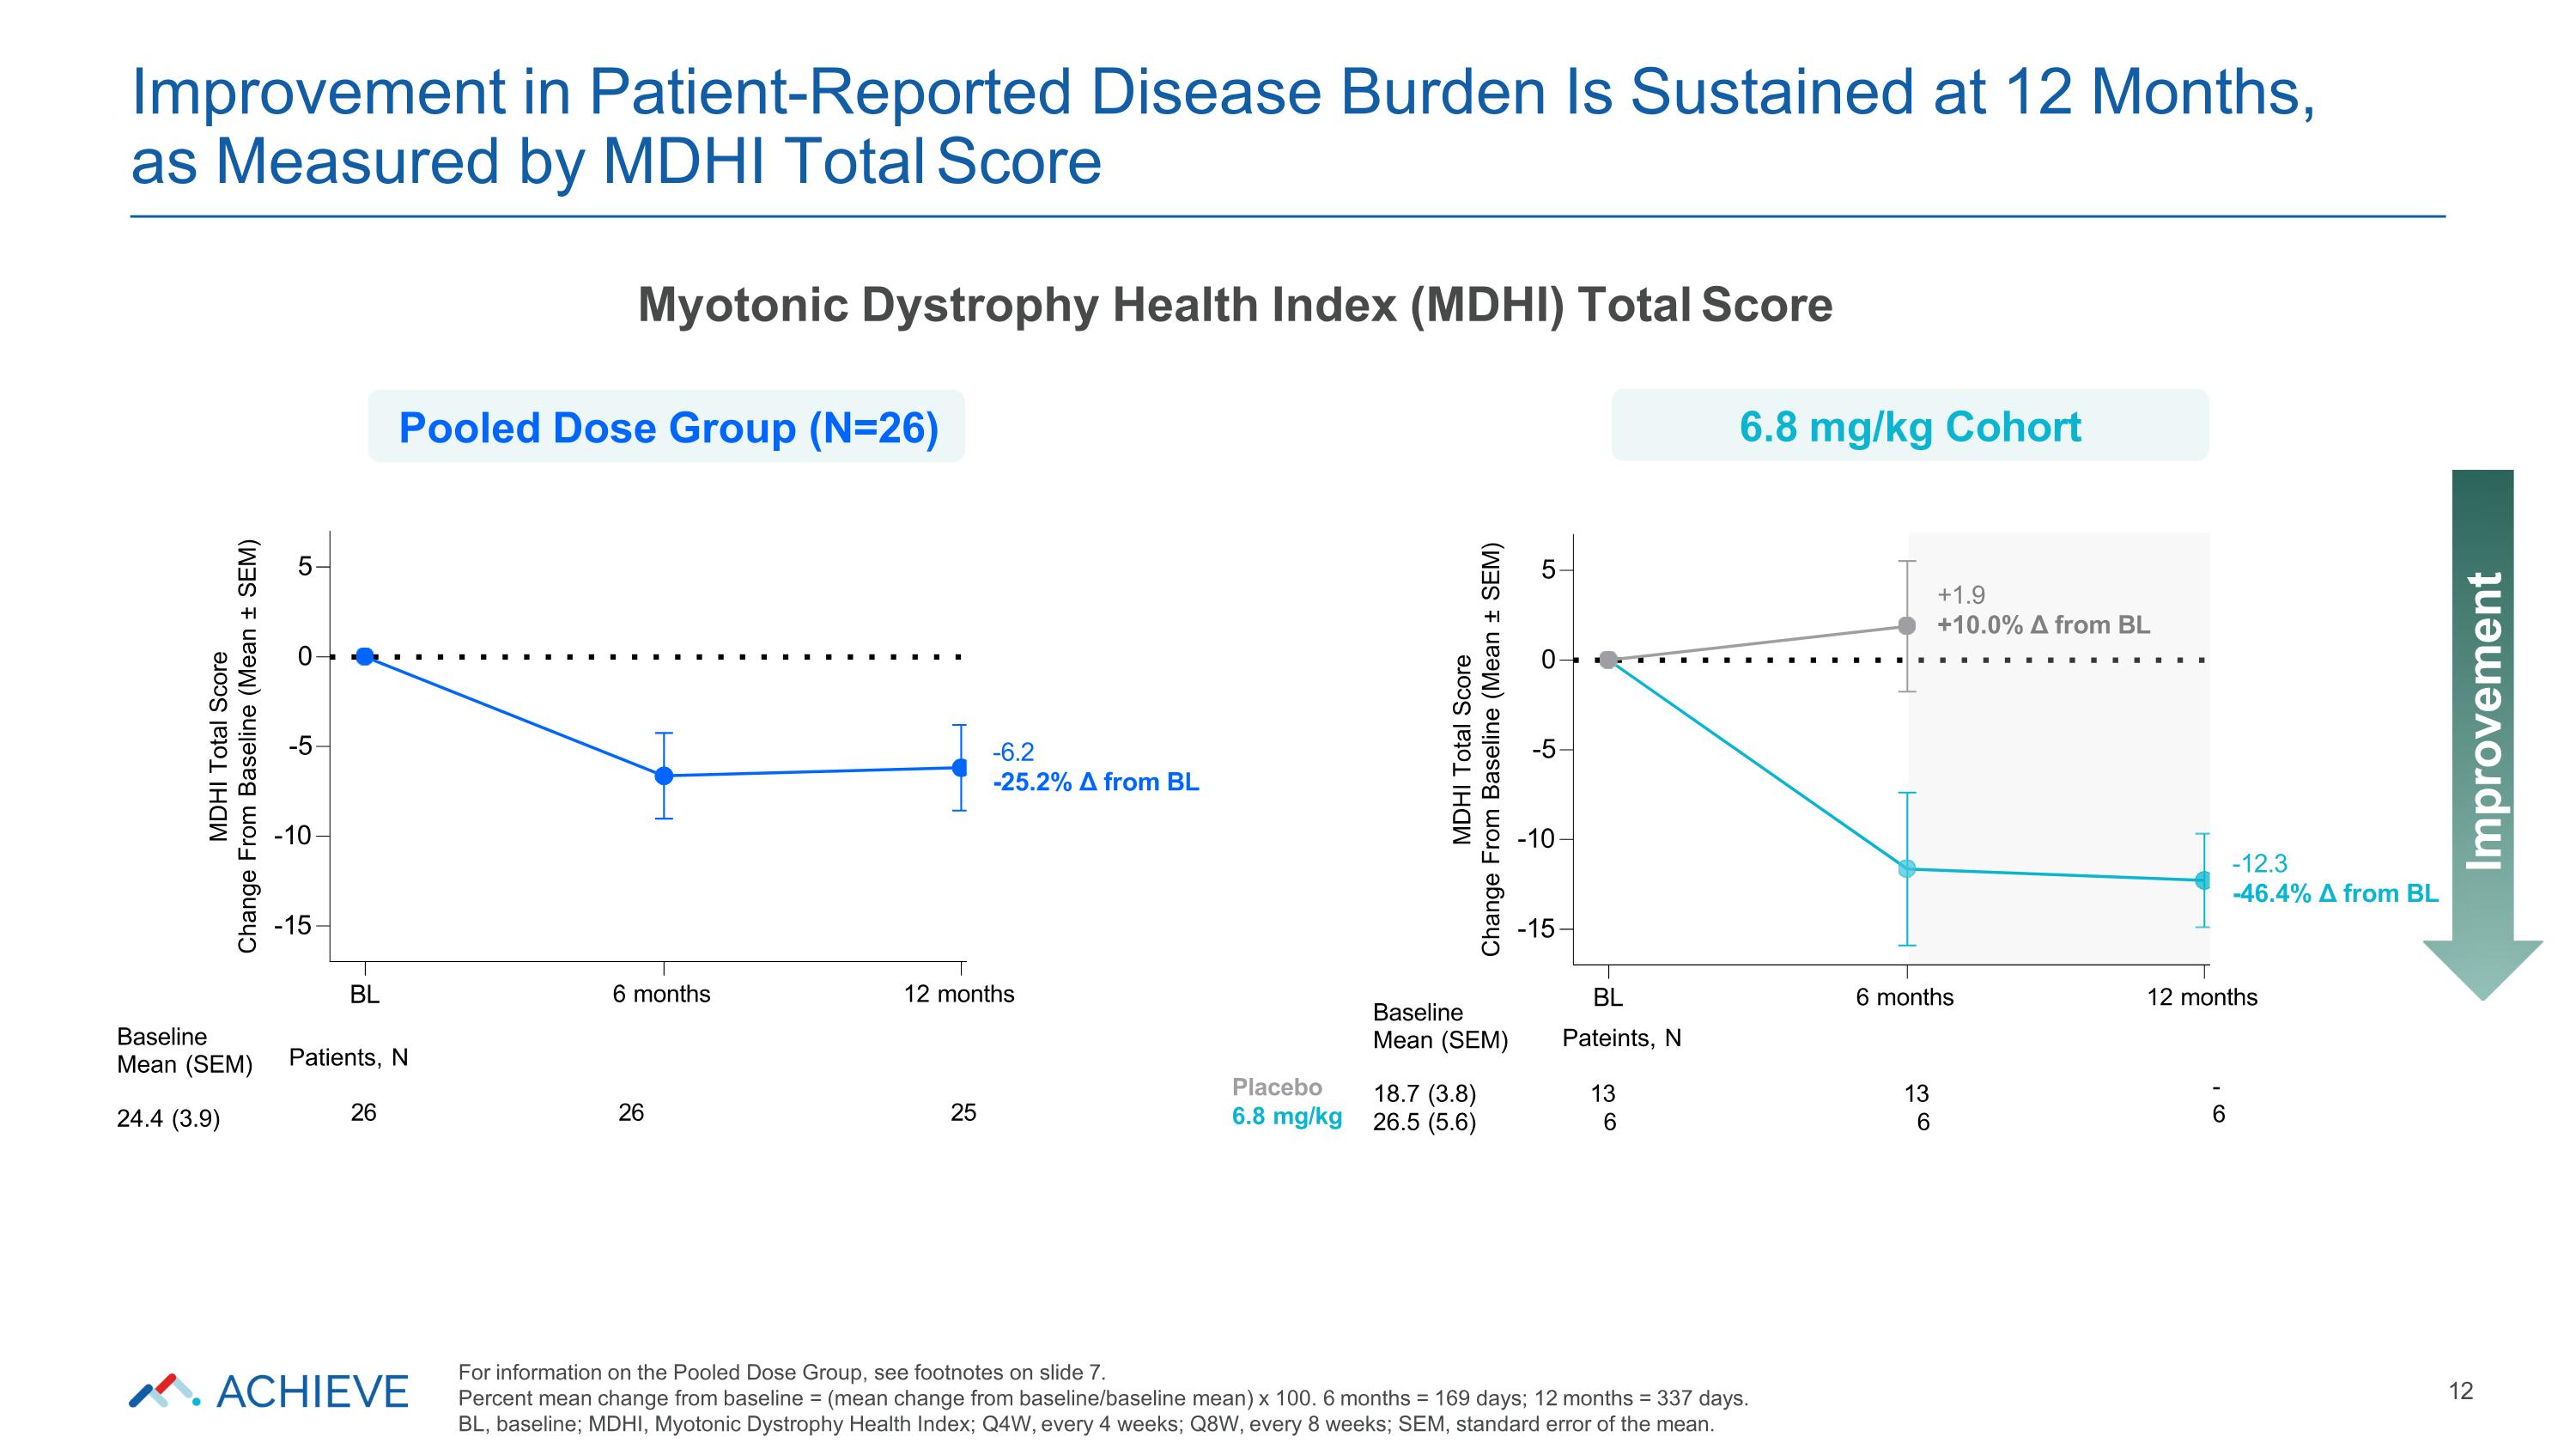
-15 -10 -5 0 5 MDHI Total Score Change From Baseline (Mean ± SEM) 6 months 12 months +1.9 +10.0% Δ from BL BL Pateints, N -12.3 -46.4% Δ from BL Placebo 6.8 mg/kg 13 6 13 6 - 6 Baseline Mean (SEM) 18.7 (3.8) 26.5 (5.6) -15 -10 -5 0 5 MDHI Total Score Change From Baseline (Mean ± SEM) BL 6 months 12 months -6.2 -25.2% Δ from BL Baseline Mean (SEM) 24.4 (3.9) Patients, N 26 26 25 Improvement in Patient-Reported Disease Burden Is Sustained at 12 Months, as Measured by MDHI Total Score 12 Improvement Myotonic Dystrophy Health Index (MDHI) Total Score Pooled Dose Group (N=26) 6.8 mg/kg Cohort For information on the Pooled Dose Group, see footnotes on slide 7. Percent mean change from baseline = (mean change from baseline/baseline mean) x 100. 6 months = 169 days; 12 months = 337 days. BL, baseline; MDHI, Myotonic Dystrophy Health Index; Q4W, every 4 weeks; Q8W, every 8 weeks; SEM, standard error of the mean.
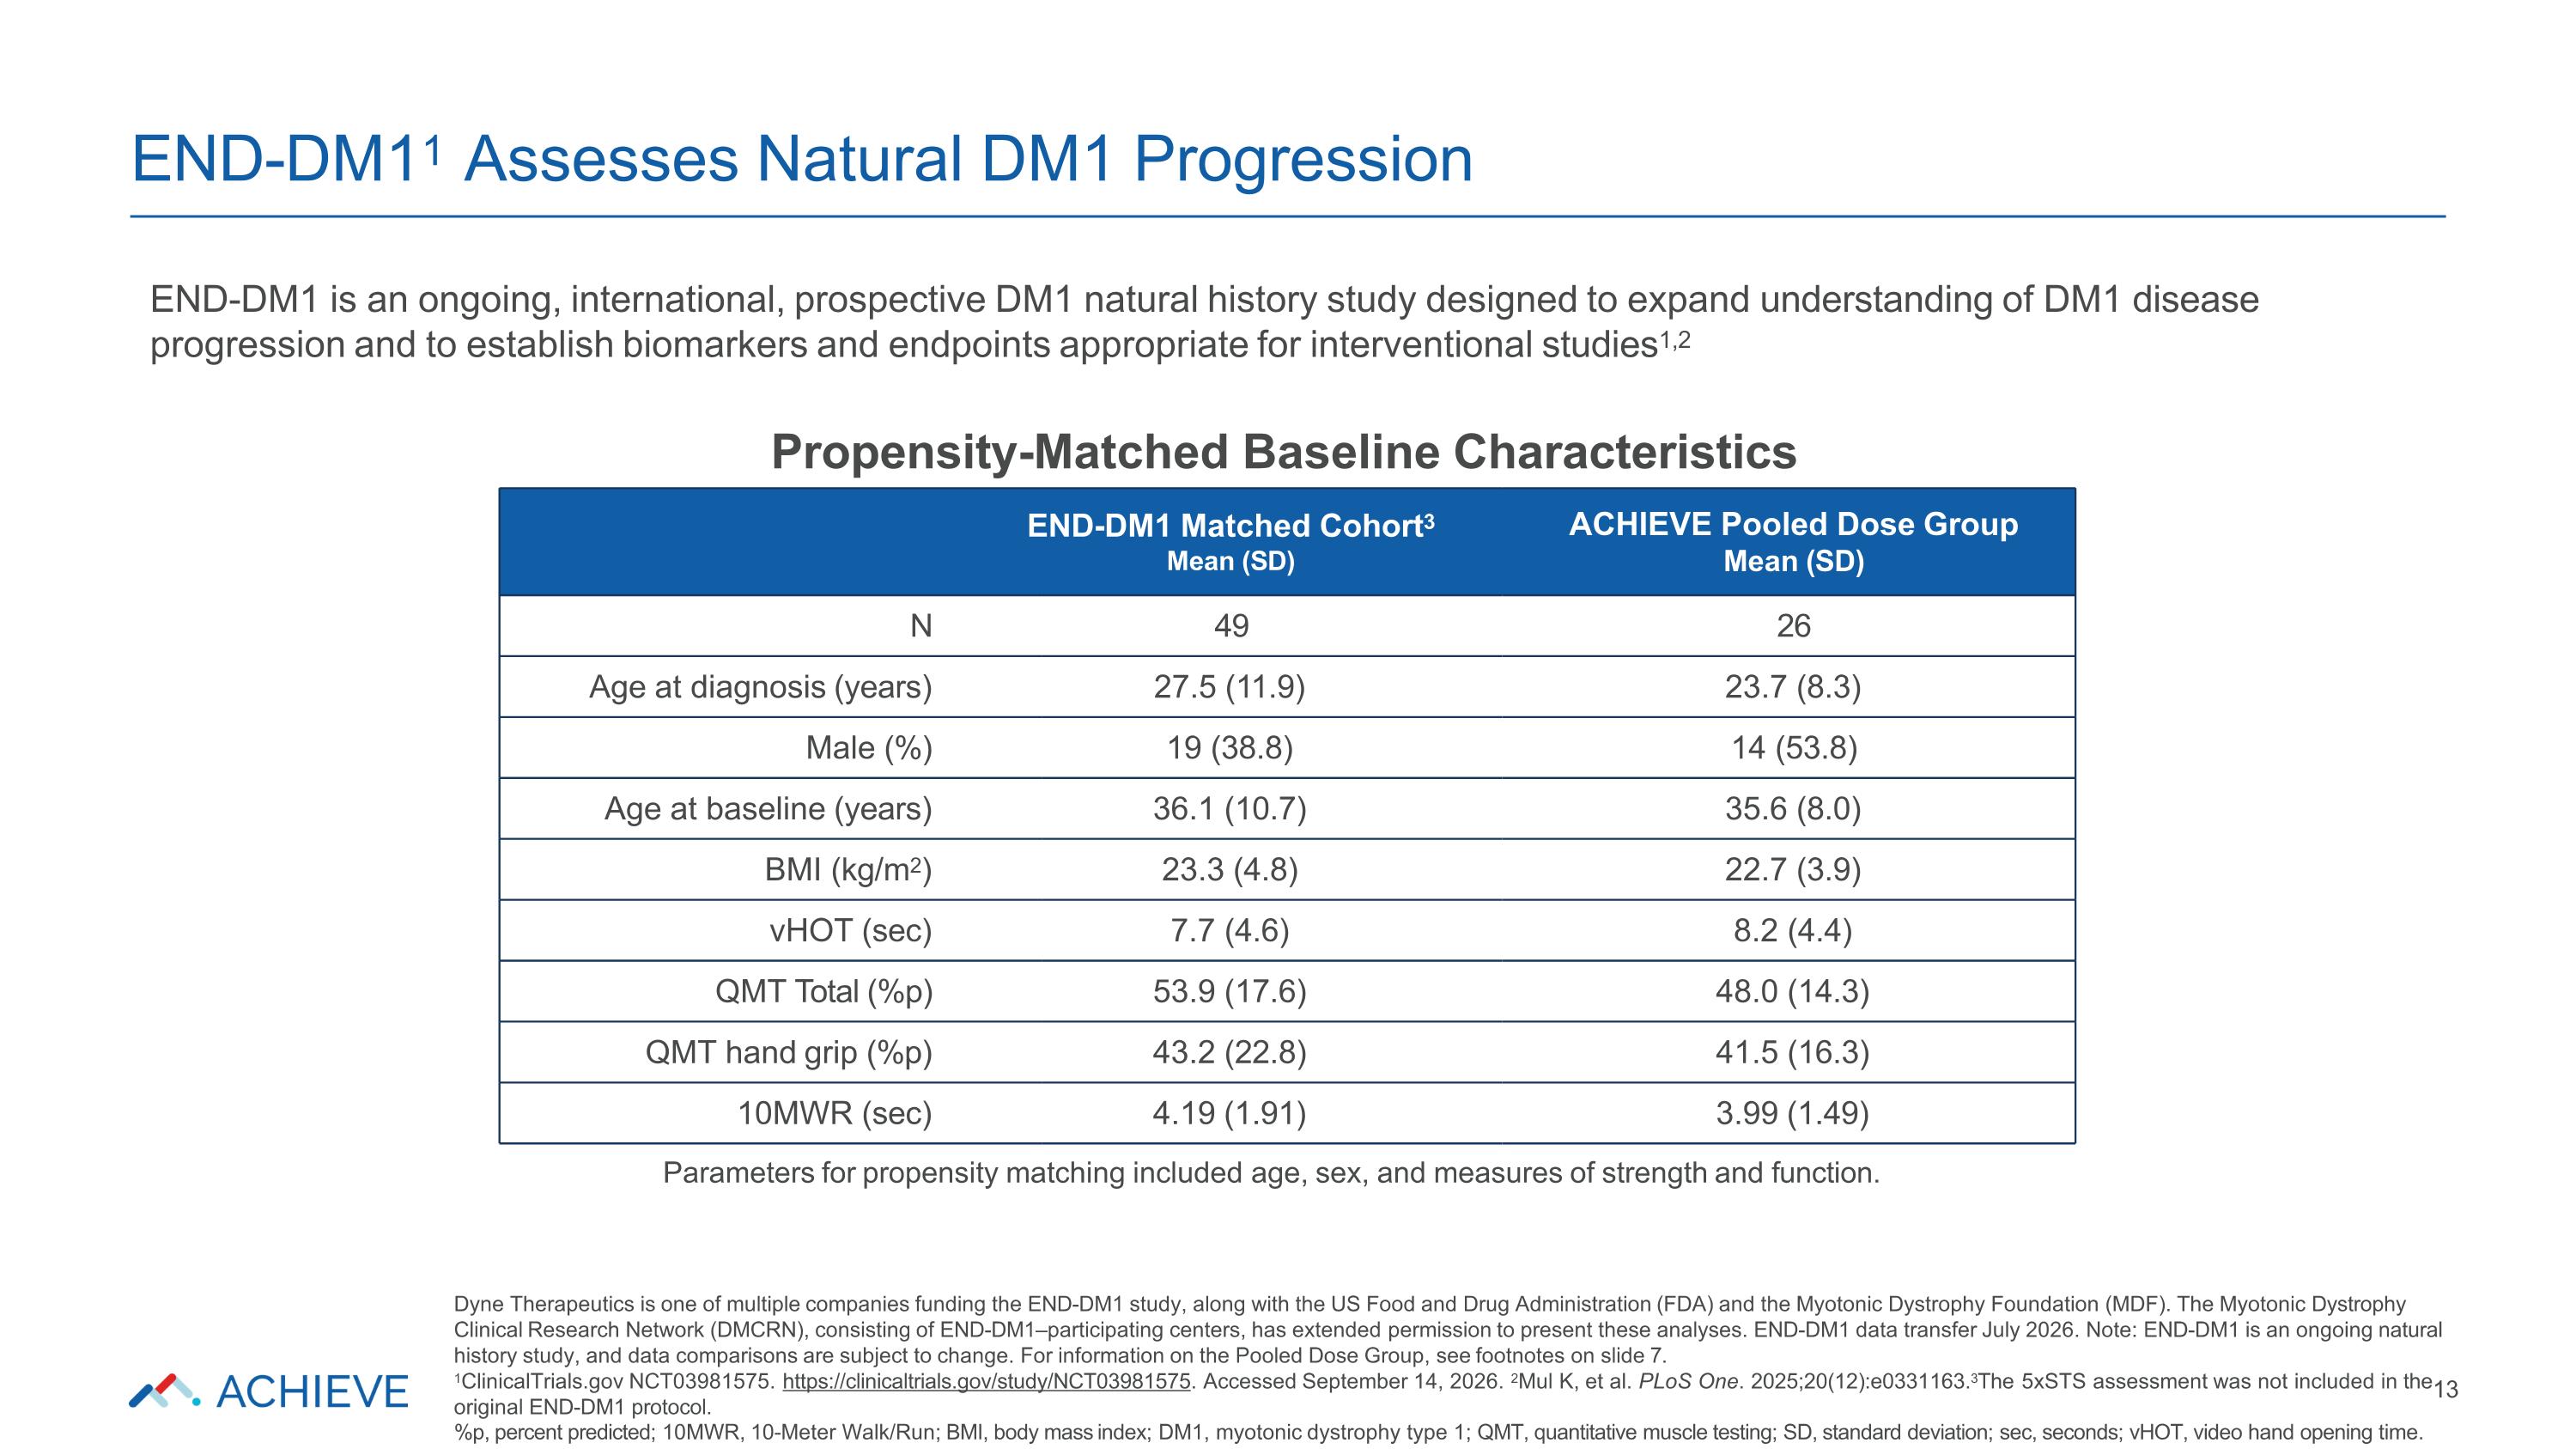
END-DM11 Assesses Natural DM1 Progression Dyne Therapeutics is one of multiple companies funding the END-DM1 study, along with the US Food and Drug Administration (FDA) and the Myotonic Dystrophy Foundation (MDF). The Myotonic Dystrophy Clinical Research Network (DMCRN), consisting of END-DM1–participating centers, has extended permission to present these analyses. END-DM1 data transfer July 2026. Note: END-DM1 is an ongoing natural history study, and data comparisons are subject to change. For information on the Pooled Dose Group, see footnotes on slide 7. 1ClinicalTrials.gov NCT03981575. https://clinicaltrials.gov/study/NCT03981575. Accessed September 14, 2026. 2Mul K, et al. PLoS One. 2025;20(12):e0331163.3The 5xSTS assessment was not included in the13 original END-DM1 protocol. %p, percent predicted; 10MWR, 10-Meter Walk/Run; BMI, body mass index; DM1, myotonic dystrophy type 1; QMT, quantitative muscle testing; SD, standard deviation; sec, seconds; vHOT, video hand opening time. END-DM1 Matched Cohort3 Mean (SD) ACHIEVE Pooled Dose Group Mean (SD) N 49 26 Age at diagnosis (years) 27.5 (11.9) 23.7 (8.3) Male (%) 19 (38.8) 14 (53.8) Age at baseline (years) 36.1 (10.7) 35.6 (8.0) BMI (kg/m2) 23.3 (4.8) 22.7 (3.9) vHOT (sec) 7.7 (4.6) 8.2 (4.4) QMT Total (%p) 53.9 (17.6) 48.0 (14.3) QMT hand grip (%p) 43.2 (22.8) 41.5 (16.3) 10MWR (sec) 4.19 (1.91) 3.99 (1.49) END-DM1 is an ongoing, international, prospective DM1 natural history study designed to expand understanding of DM1 disease progression and to establish biomarkers and endpoints appropriate for interventional studies1,2 Propensity-Matched Baseline Characteristics Parameters for propensity matching included age, sex, and measures of strength and function.
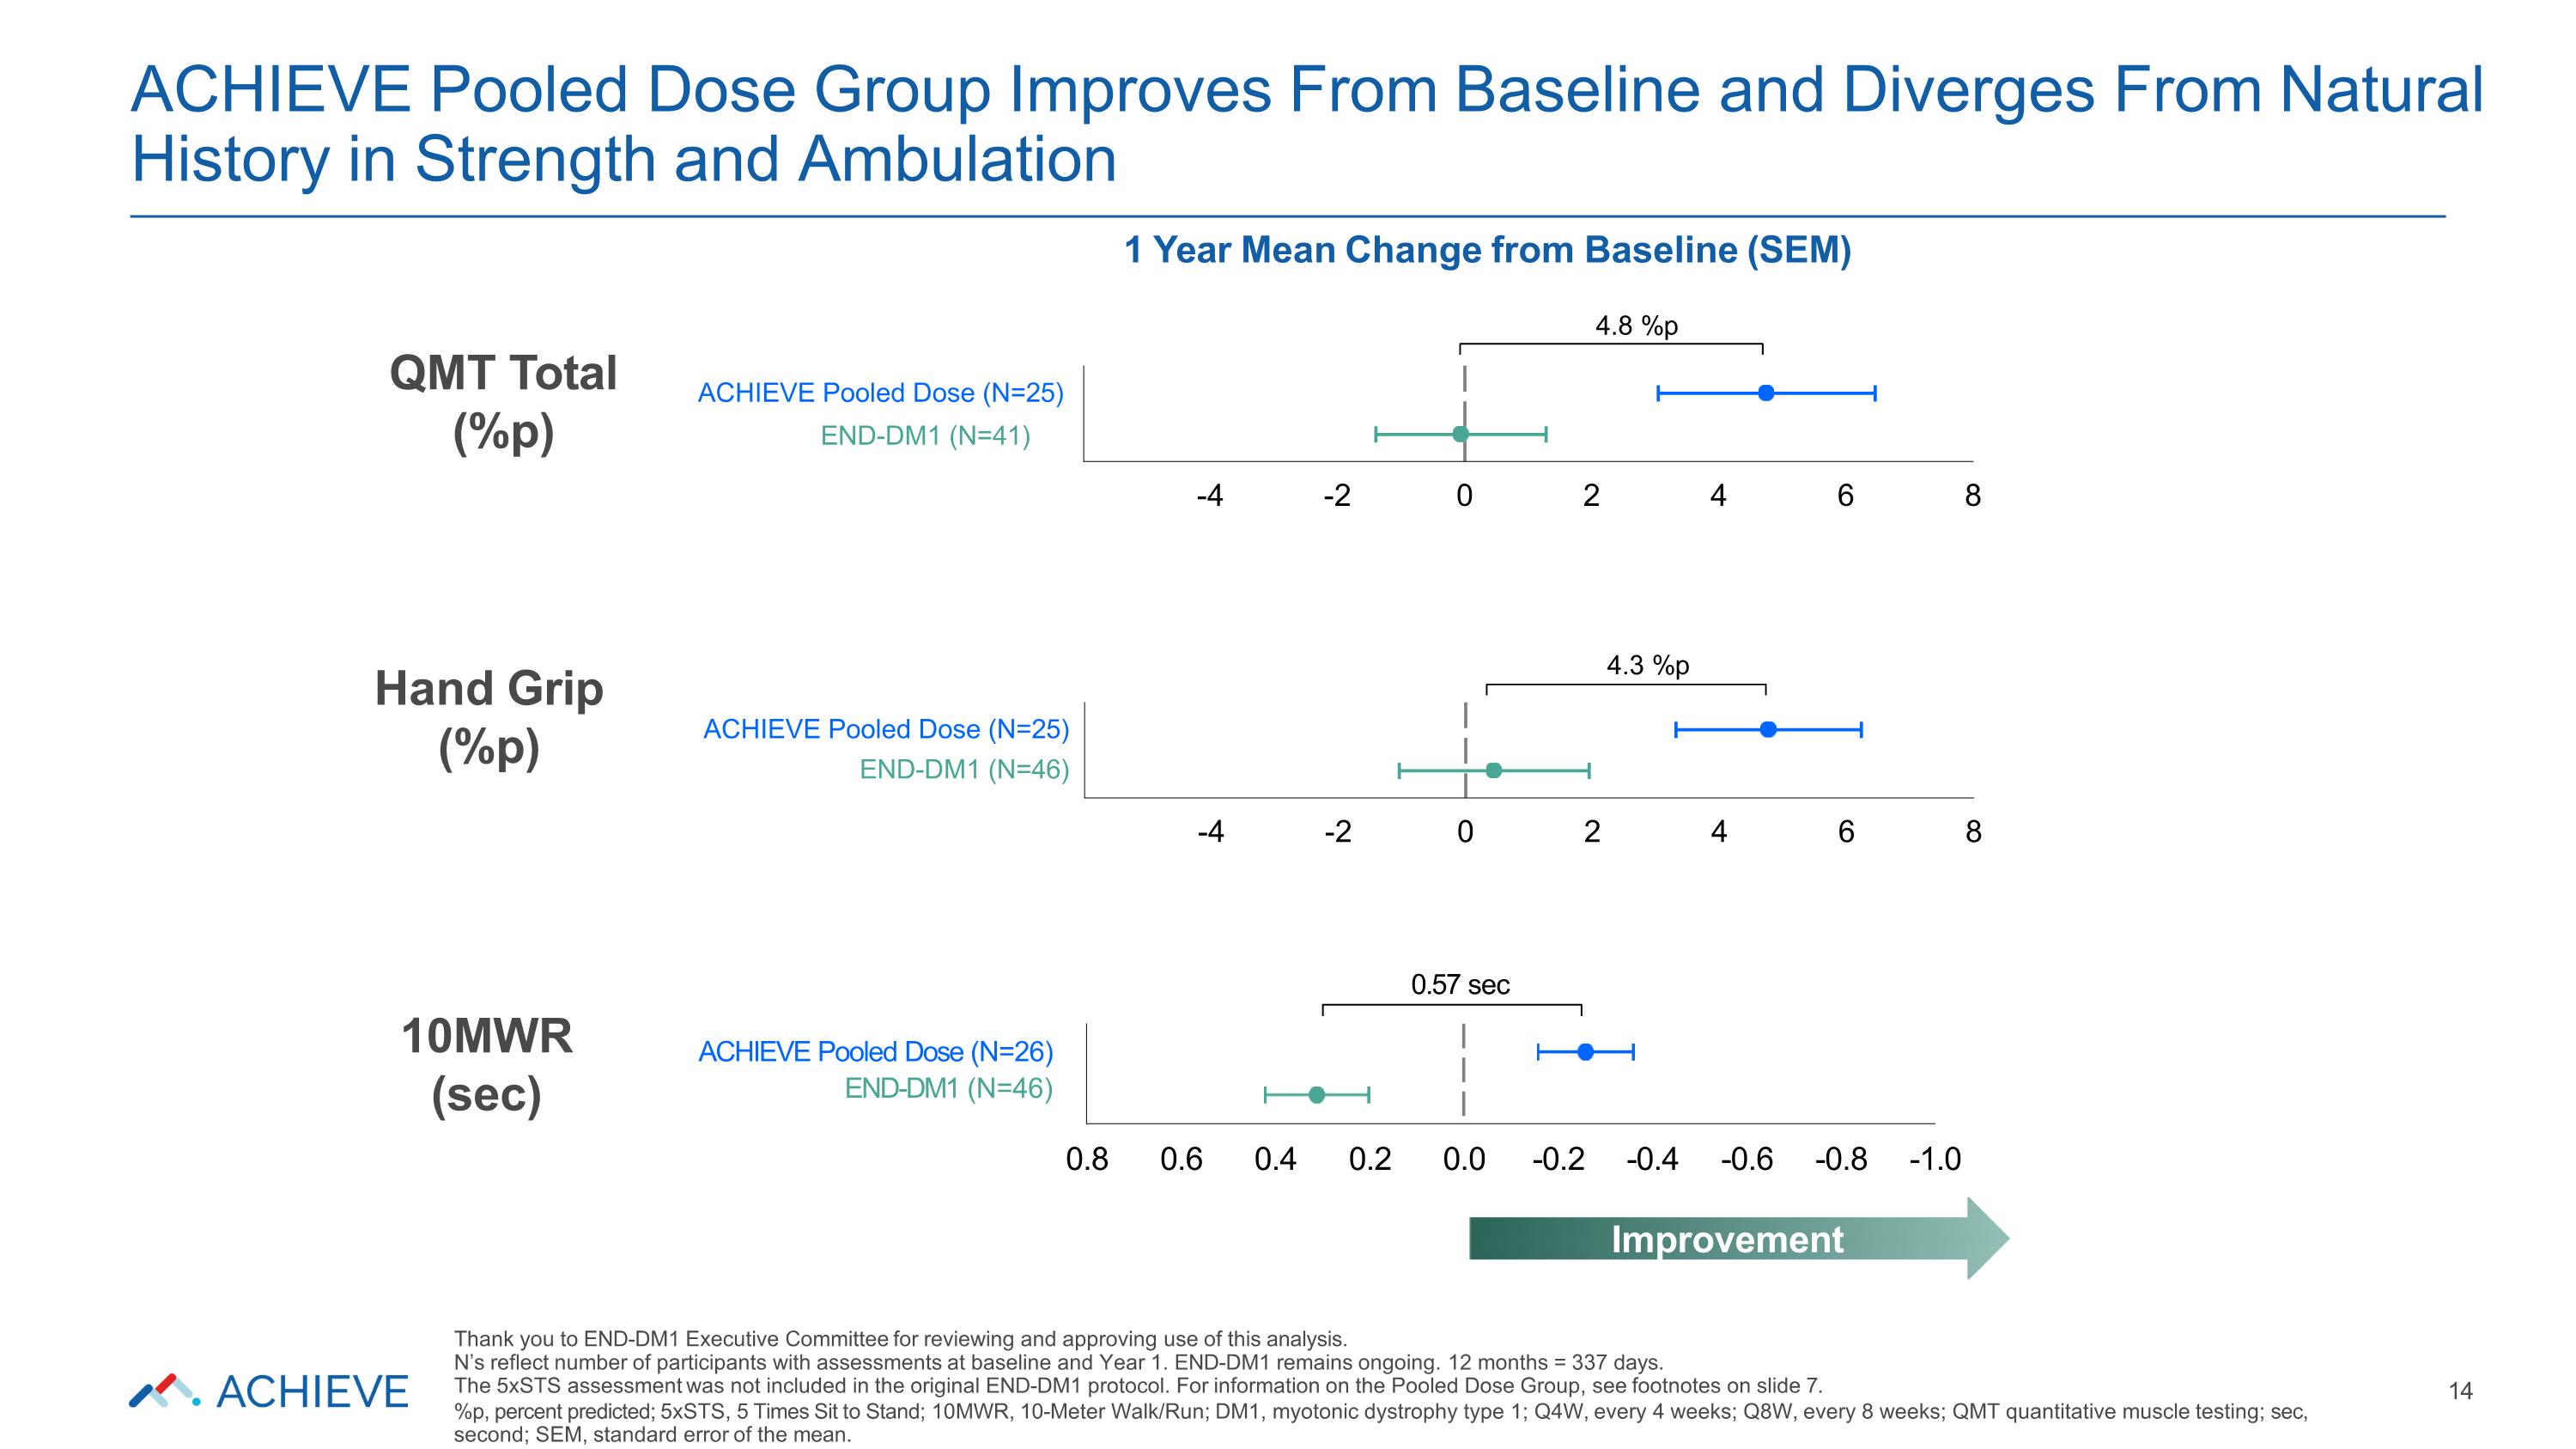
ACHIEVE Pooled Dose (N=26) END-DM1 (N=46) 0.57 sec -4 -2 0 2 4 6 8 4.3 %p ACHIEVE Pooled Dose (N=25) END-DM1 (N=46) -4 -2 0 2 4 6 8 1 Year Mean Change from Baseline (SEM) 4.8 %p ACHIEVE Pooled Dose (N=25) END-DM1 (N=41) ACHIEVE Pooled Dose Group Improves From Baseline and Diverges From Natural History in Strength and Ambulation 14 QMT Total (%p) Hand Grip (%p) 10MWR (sec) 0.8 0.6 0.4 0.2 0.0 -0.2 -0.4 -0.6 -0.8 -1.0 Improvement Thank you to END-DM1 Executive Committee for reviewing and approving use of this analysis. N’s reflect number of participants with assessments at baseline and Year 1. END-DM1 remains ongoing. 12 months = 337 days. The 5xSTS assessment was not included in the original END-DM1 protocol. For information on the Pooled Dose Group, see footnotes on slide 7. %p, percent predicted; 5xSTS, 5 Times Sit to Stand; 10MWR, 10-Meter Walk/Run; DM1, myotonic dystrophy type 1; Q4W, every 4 weeks; Q8W, every 8 weeks; QMT quantitative muscle testing; sec, second; SEM, standard error of the mean.
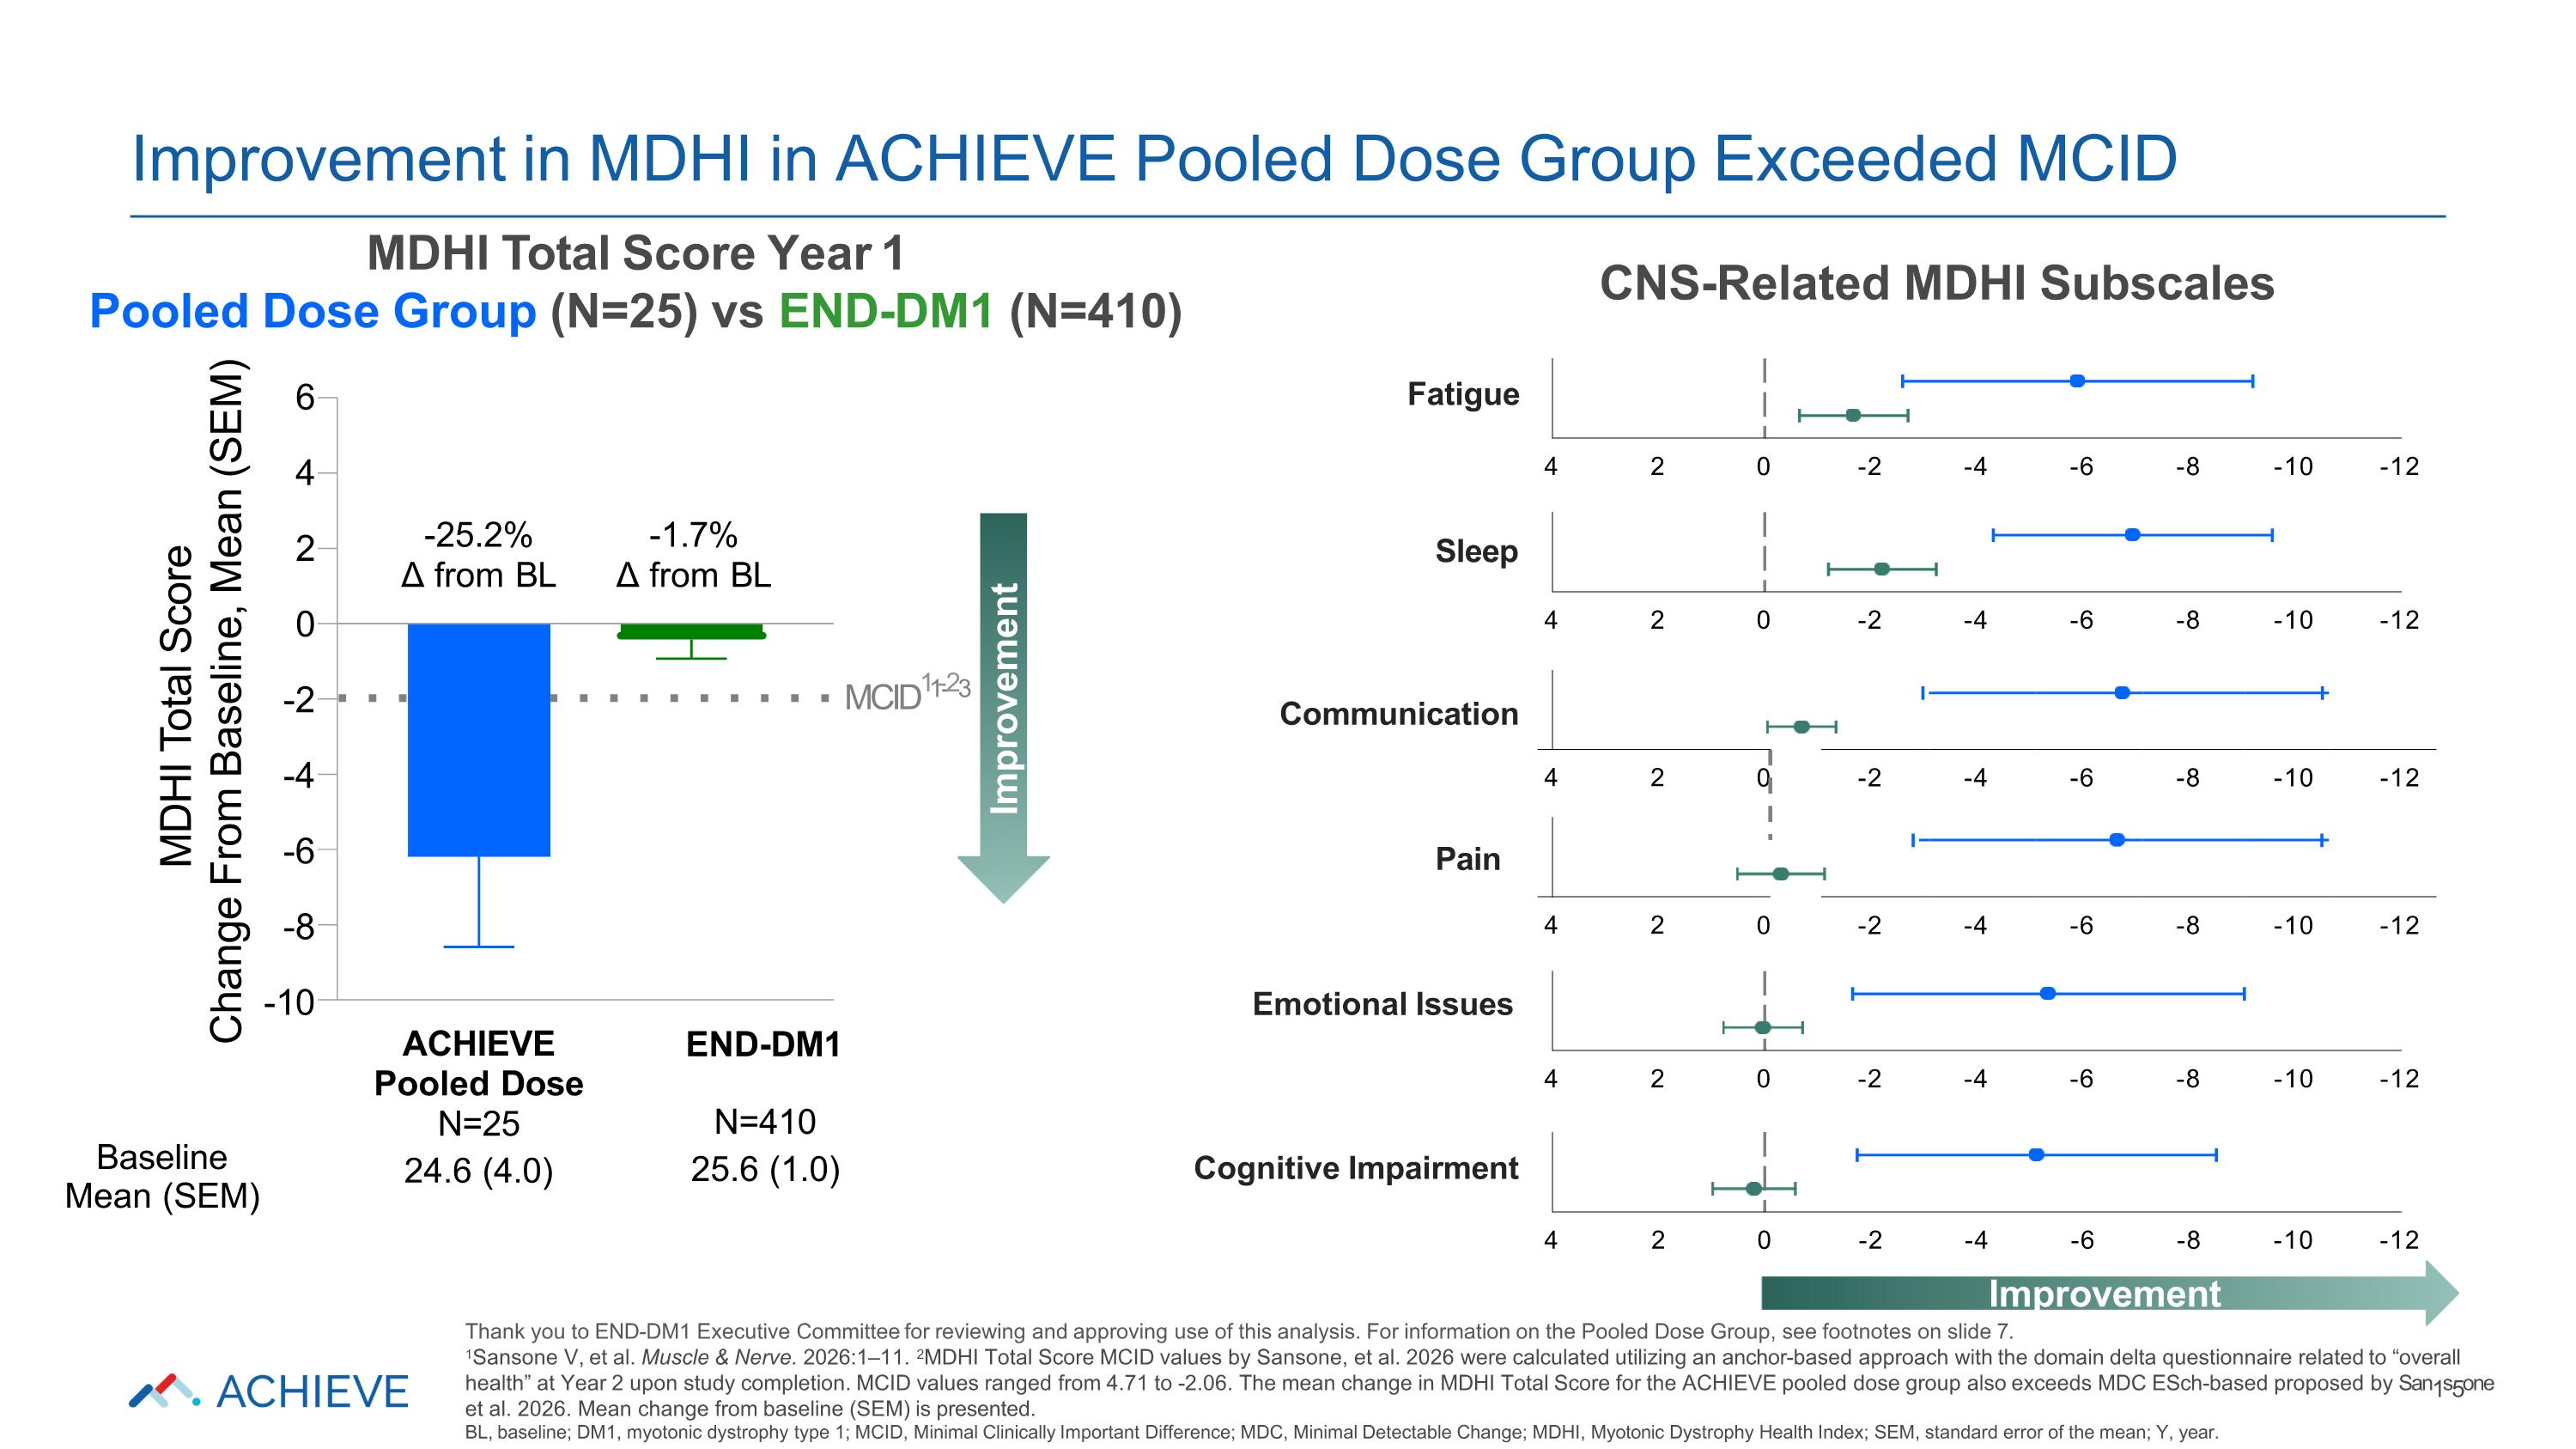
4 2 0 -2 -4 -6 -8 -10 -12 -12 -10 -8 -6 -4 -2 0 2 4 -12 -10 -8 -6 -4 -2 0 -12 -10 -8 -6 -4 -2 0 -12 -10 -8 -6 -4 -2 0 4 2 4 2 4 2 -12 -10 -8 -6 -4 -2 0 2 4 6 4 2 0 -2 -4 -6 -8 -10 -25.2% Δ from BL ACHIEVE Pooled Dose N=25 24.6 (4.0) MDHI Total Score Change From Baseline, Mean (SEM) END-DM1 N=410 25.6 (1.0) -1.7% Δ from BL Baseline Mean (SEM) Improvement in MDHI in ACHIEVE Pooled Dose Group Exceeded MCID MDHI Total Score Year 1 Pooled Dose Group (N=25) vs END-DM1 (N=410) Improvement Fatigue Communication Emotional Issues Sleep Pain Cognitive Impairment Improvement Thank you to END-DM1 Executive Committee for reviewing and approving use of this analysis. For information on the Pooled Dose Group, see footnotes on slide 7. 1Sansone V, et al. Muscle & Nerve. 2026:1–11. 2MDHI Total Score MCID values by Sansone, et al. 2026 were calculated utilizing an anchor-based approach with the domain delta questionnaire related to “overall health” at Year 2 upon study completion. MCID values ranged from 4.71 to -2.06. The mean change in MDHI Total Score for the ACHIEVE pooled dose group also exceeds MDC ESch-based proposed by San1s5one et al. 2026. Mean change from baseline (SEM) is presented. BL, baseline; DM1, myotonic dystrophy type 1; MCID, Minimal Clinically Important Difference; MDC, Minimal Detectable Change; MDHI, Myotonic Dystrophy Health Index; SEM, standard error of the mean; Y, year. CNS-Related MDHI Subscales MCID11--23
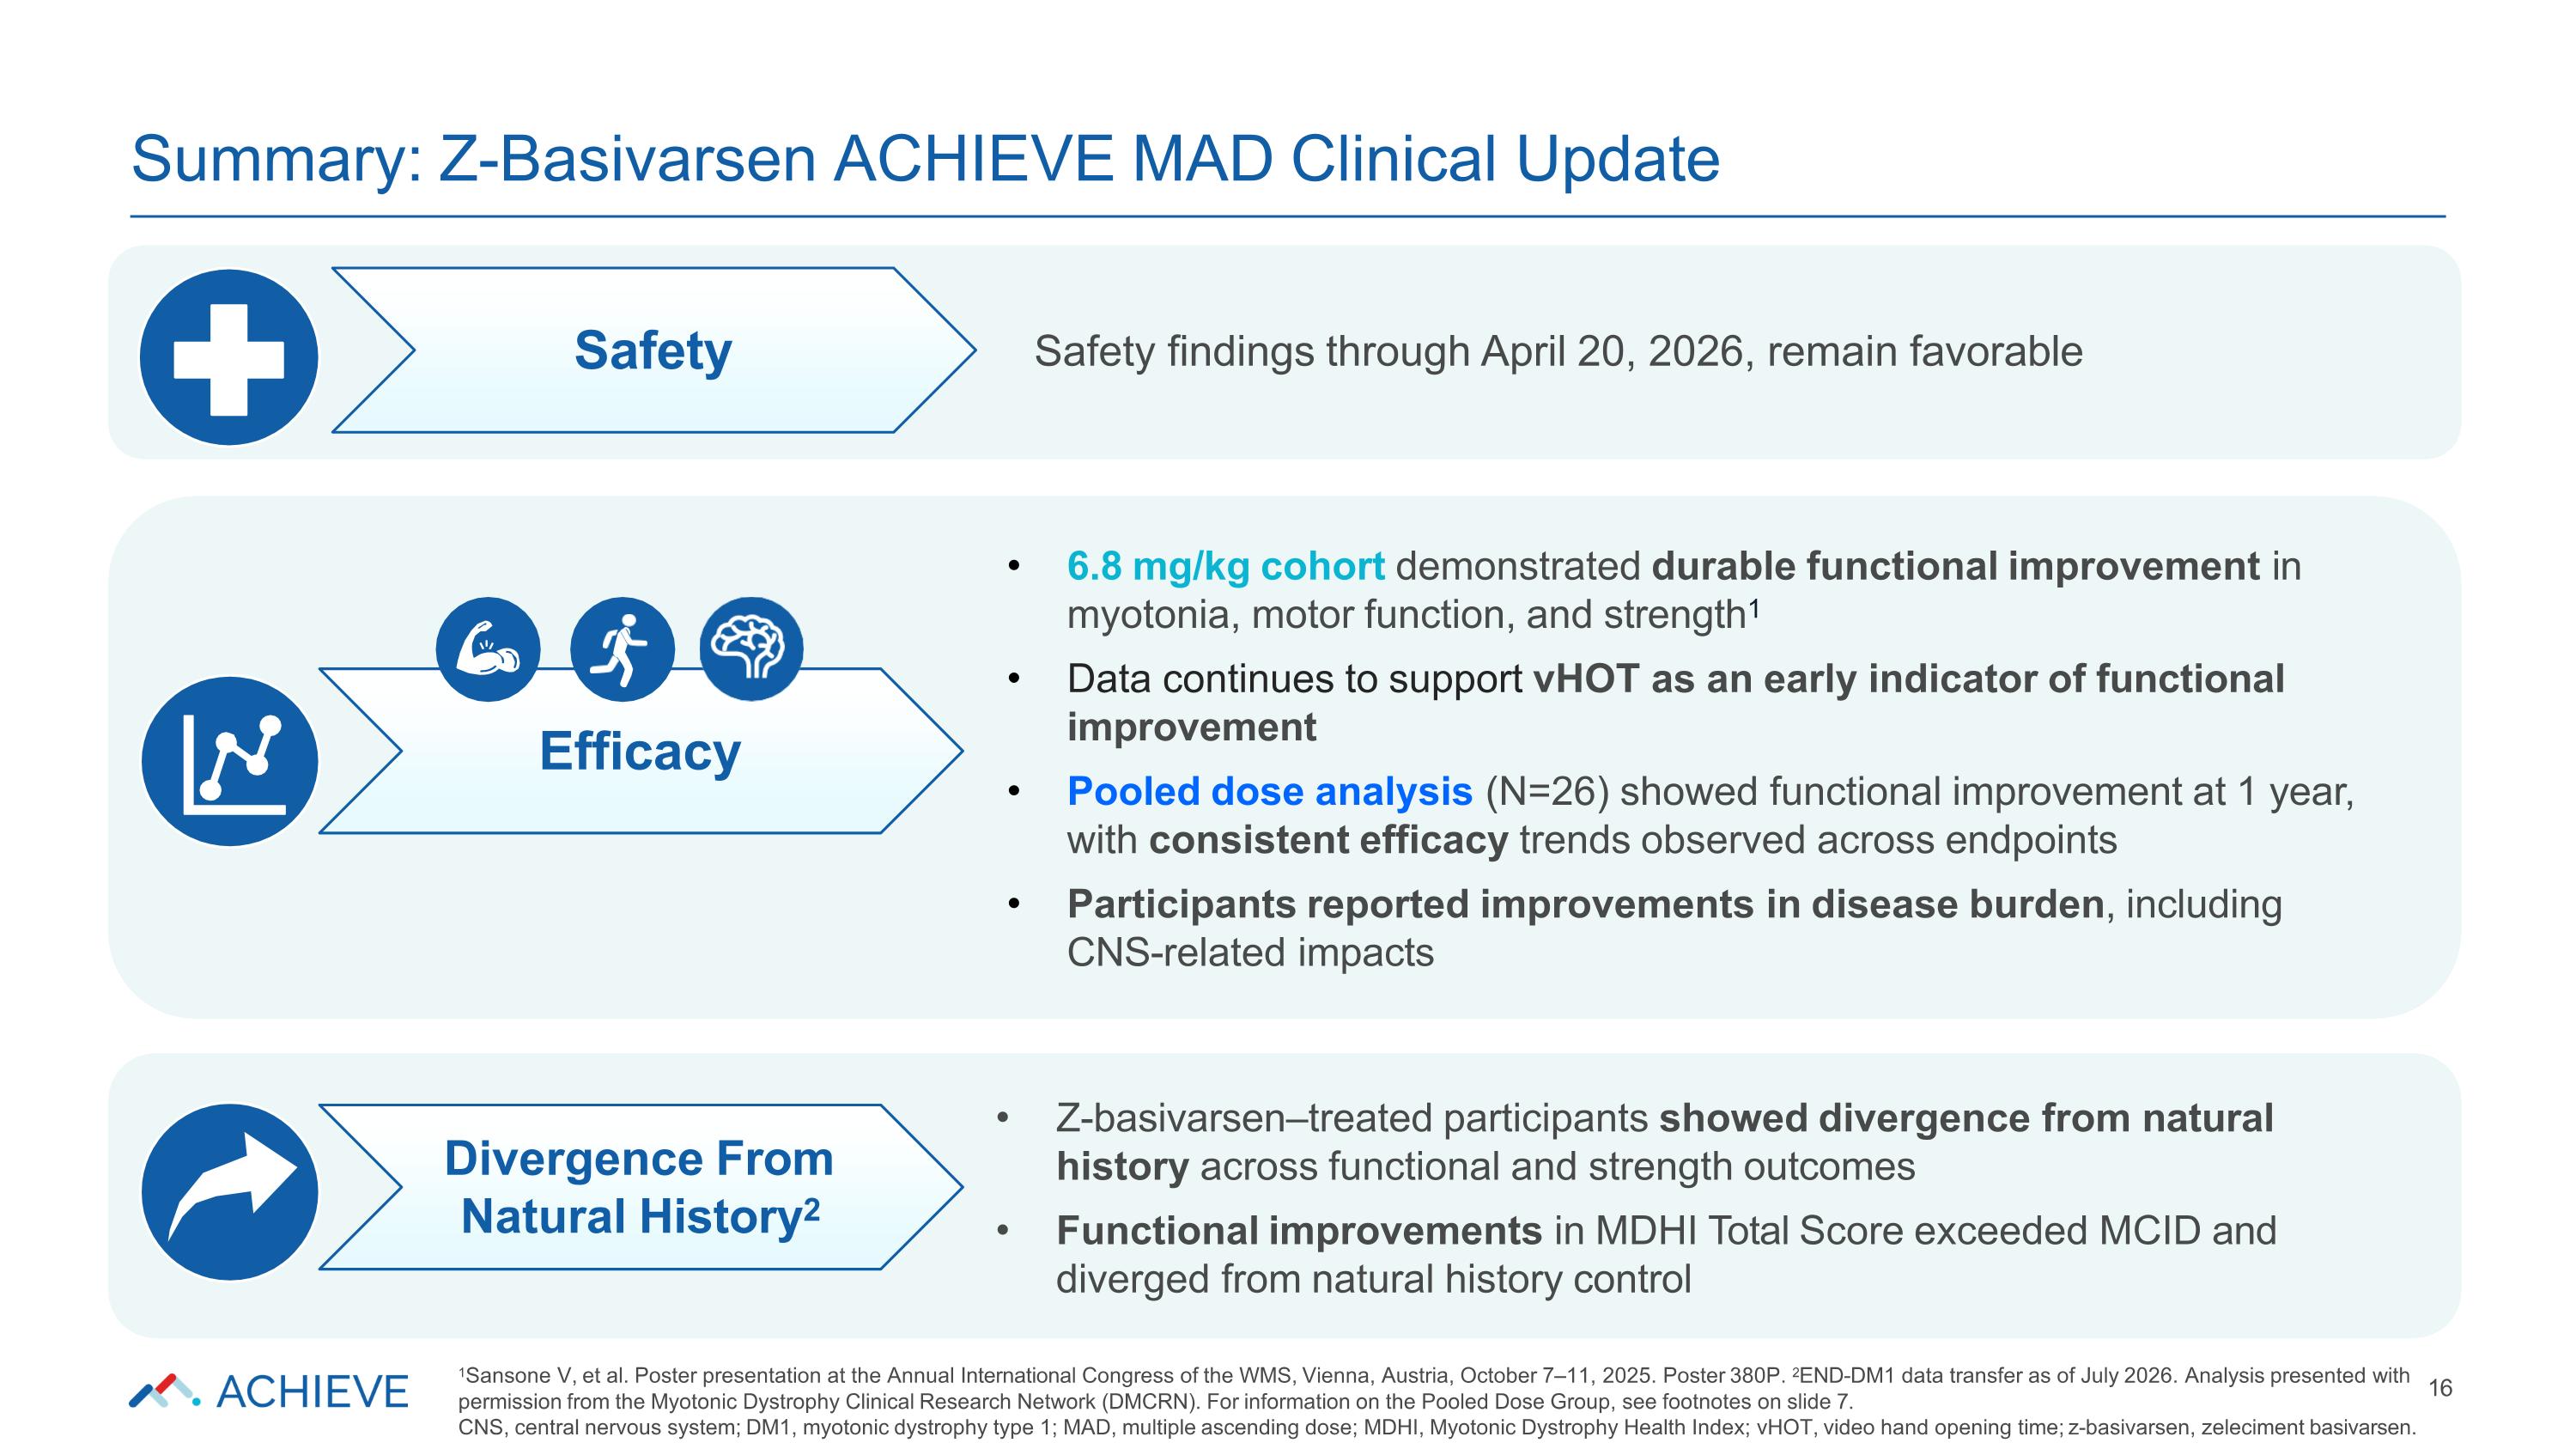
Z-basivarsen–treated participants showed divergence from natural history across functional and strength outcomes Functional improvements in MDHI Total Score exceeded MCID and diverged from natural history control 6.8 mg/kg cohort demonstrated durable functional improvement in myotonia, motor function, and strength1 Data continues to support vHOT as an early indicator of functional improvement Pooled dose analysis (N=26) showed functional improvement at 1 year, with consistent efficacy trends observed across endpoints Participants reported improvements in disease burden, including CNS-related impacts Safety findings through April 20, 2026, remain favorable Summary: Z-Basivarsen ACHIEVE MAD Clinical Update 1Sansone V, et al. Poster presentation at the Annual International Congress of the WMS, Vienna, Austria, October 7–11, 2025. Poster 380P. 2END-DM1 data transfer as of July 2026. Analysis presented with 16 permission from the Myotonic Dystrophy Clinical Research Network (DMCRN). For information on the Pooled Dose Group, see footnotes on slide 7. CNS, central nervous system; DM1, myotonic dystrophy type 1; MAD, multiple ascending dose; MDHI, Myotonic Dystrophy Health Index; vHOT, video hand opening time; z-basivarsen, zeleciment basivarsen. Safety Efficacy Divergence From Natural History2
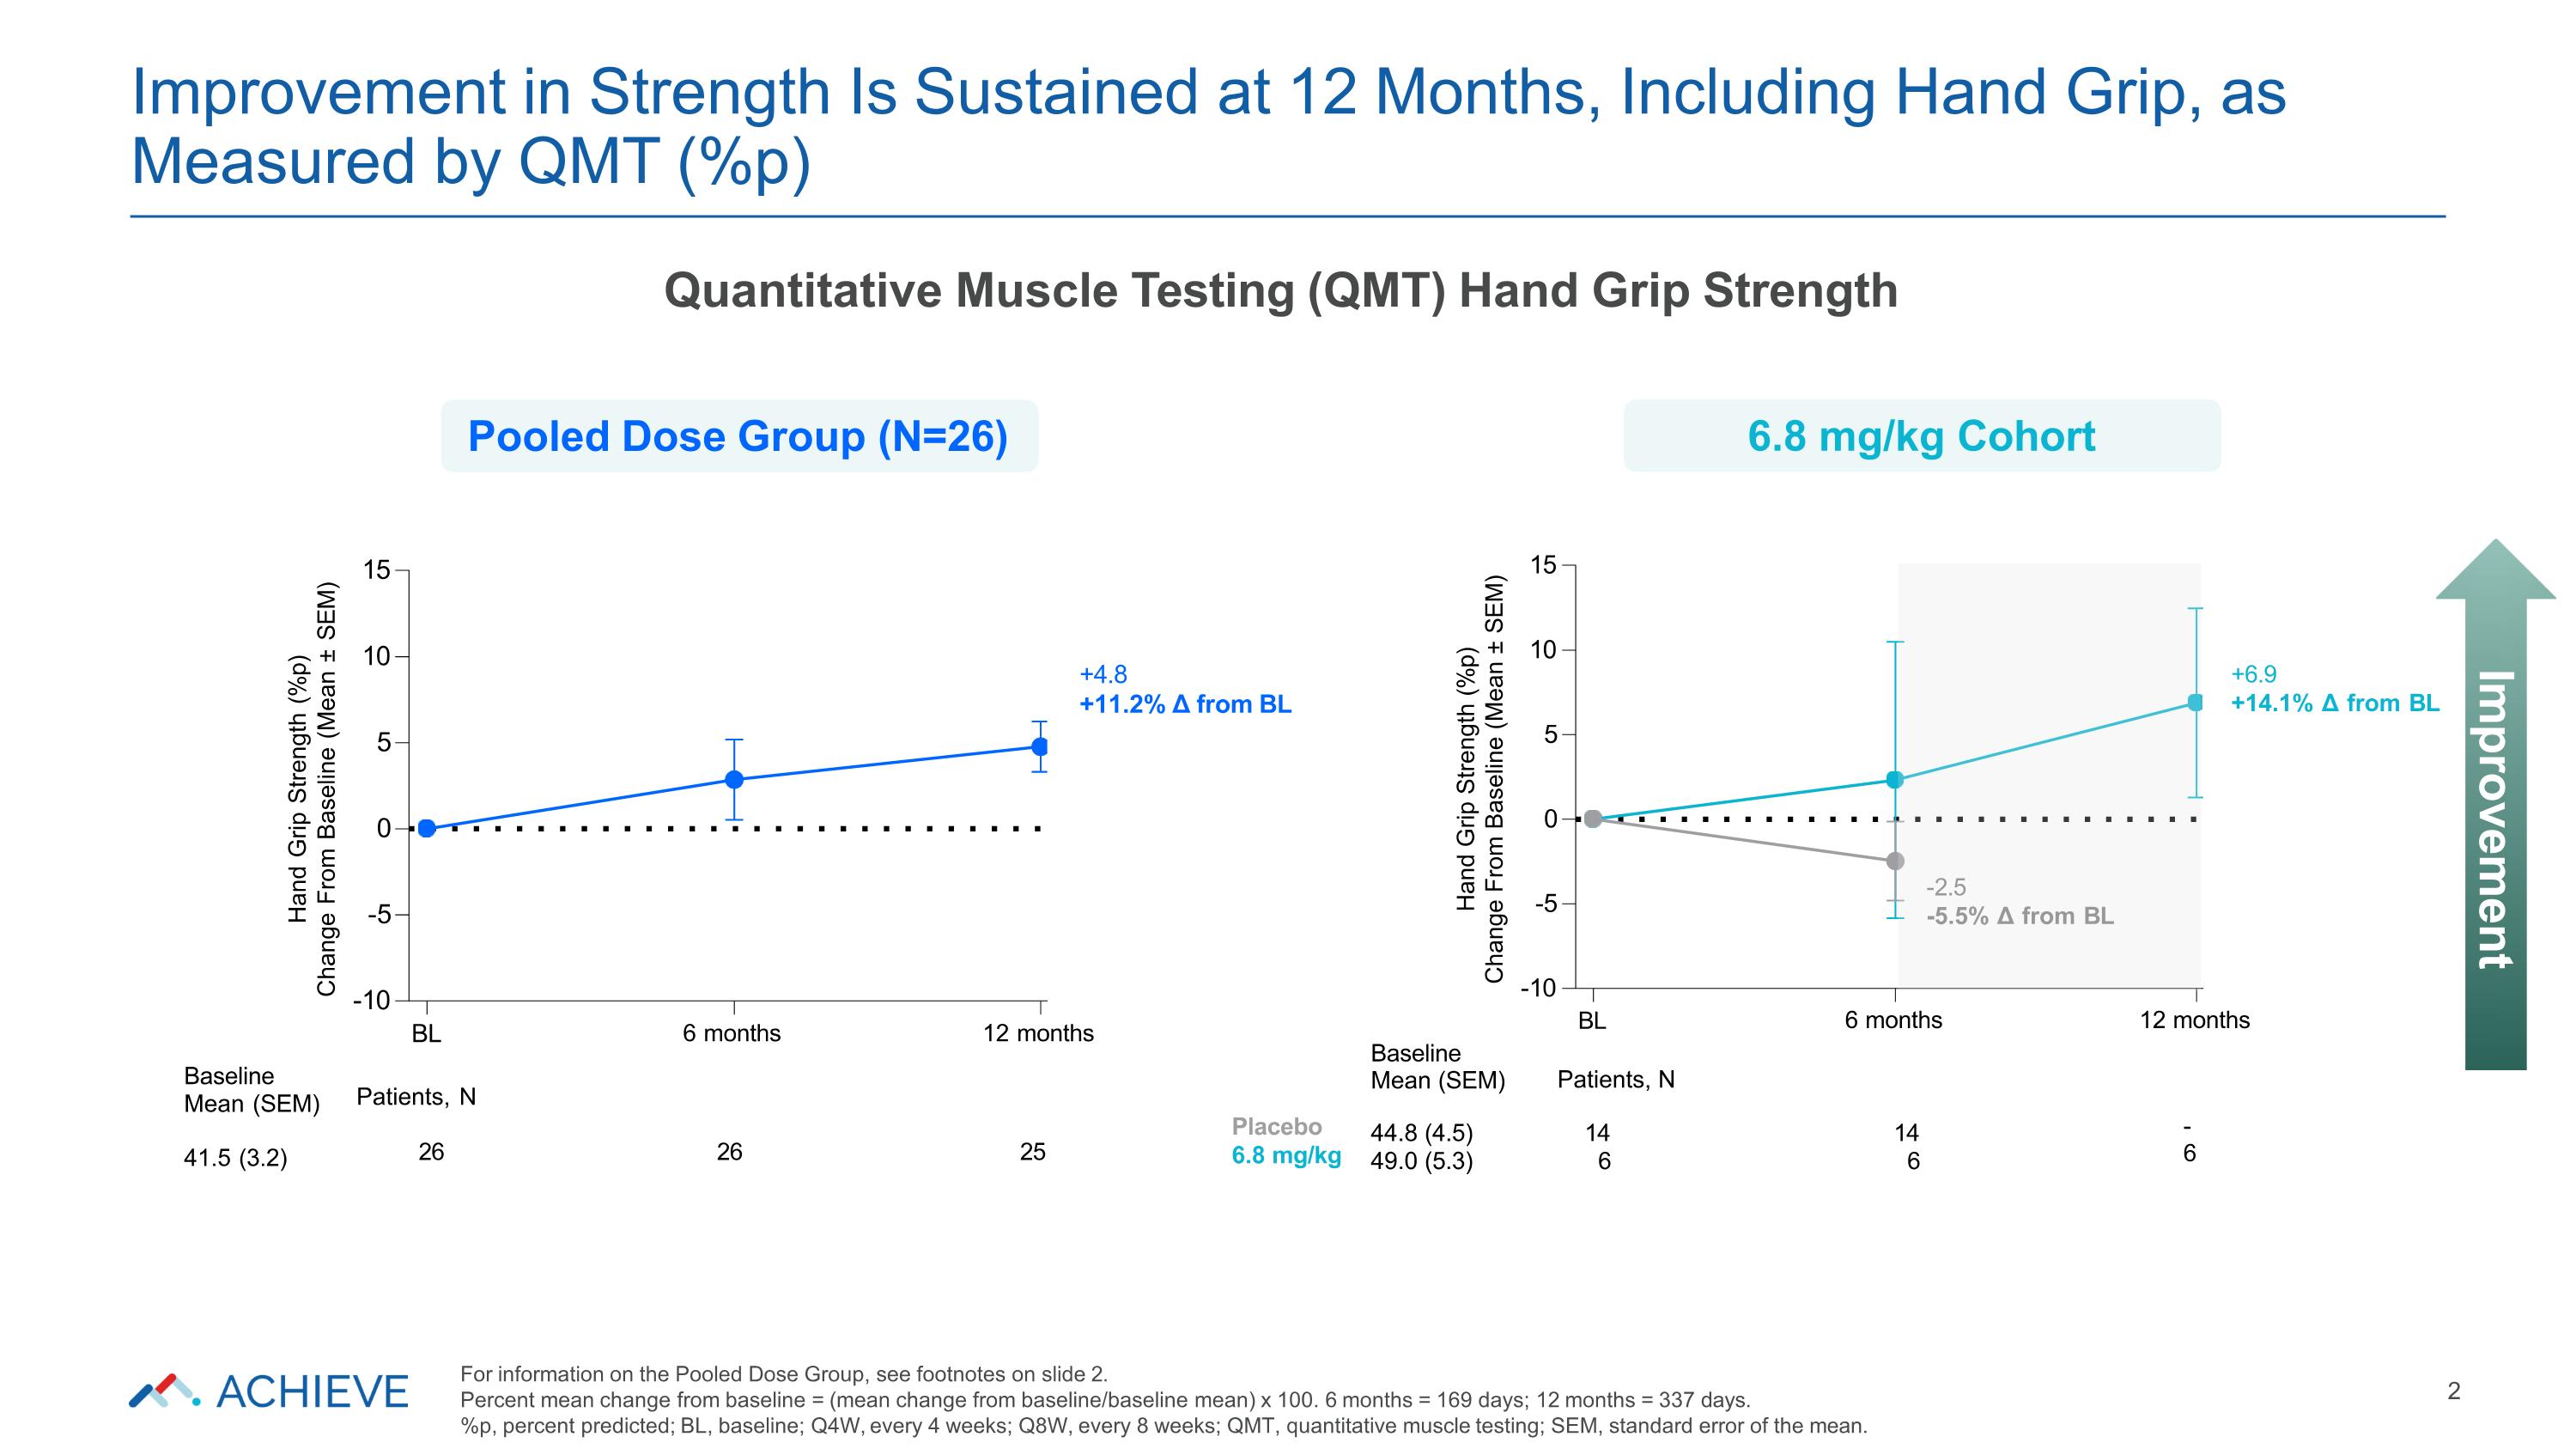
-10 -5 0 5 10 15 Hand Grip Strength (%p) Change From Baseline (Mean ± SEM) BL 6 months 12 months -2.5 -5.5% Δ from BL +6.9 +14.1% Δ from BL Placebo 6.8 mg/kg Patients, N 14 6 14 6 - 6 Baseline Mean (SEM) 44.8 (4.5) 49.0 (5.3) -10 -5 0 5 10 15 Hand Grip Strength (%p) Change From Baseline (Mean ± SEM) BL 6 months 12 months +4.8 +11.2% Δ from BL Baseline Mean (SEM) 41.5 (3.2) Patients, N 26 26 25 Improvement in Strength Is Sustained at 12 Months, Including Hand Grip, as Measured by QMT (%p) 2 Improvement Quantitative Muscle Testing (QMT) Hand Grip Strength Pooled Dose Group (N=26) 6.8 mg/kg Cohort For information on the Pooled Dose Group, see footnotes on slide 2. Percent mean change from baseline = (mean change from baseline/baseline mean) x 100. 6 months = 169 days; 12 months = 337 days. %p, percent predicted; BL, baseline; Q4W, every 4 weeks; Q8W, every 8 weeks; QMT, quantitative muscle testing; SEM, standard error of the mean.
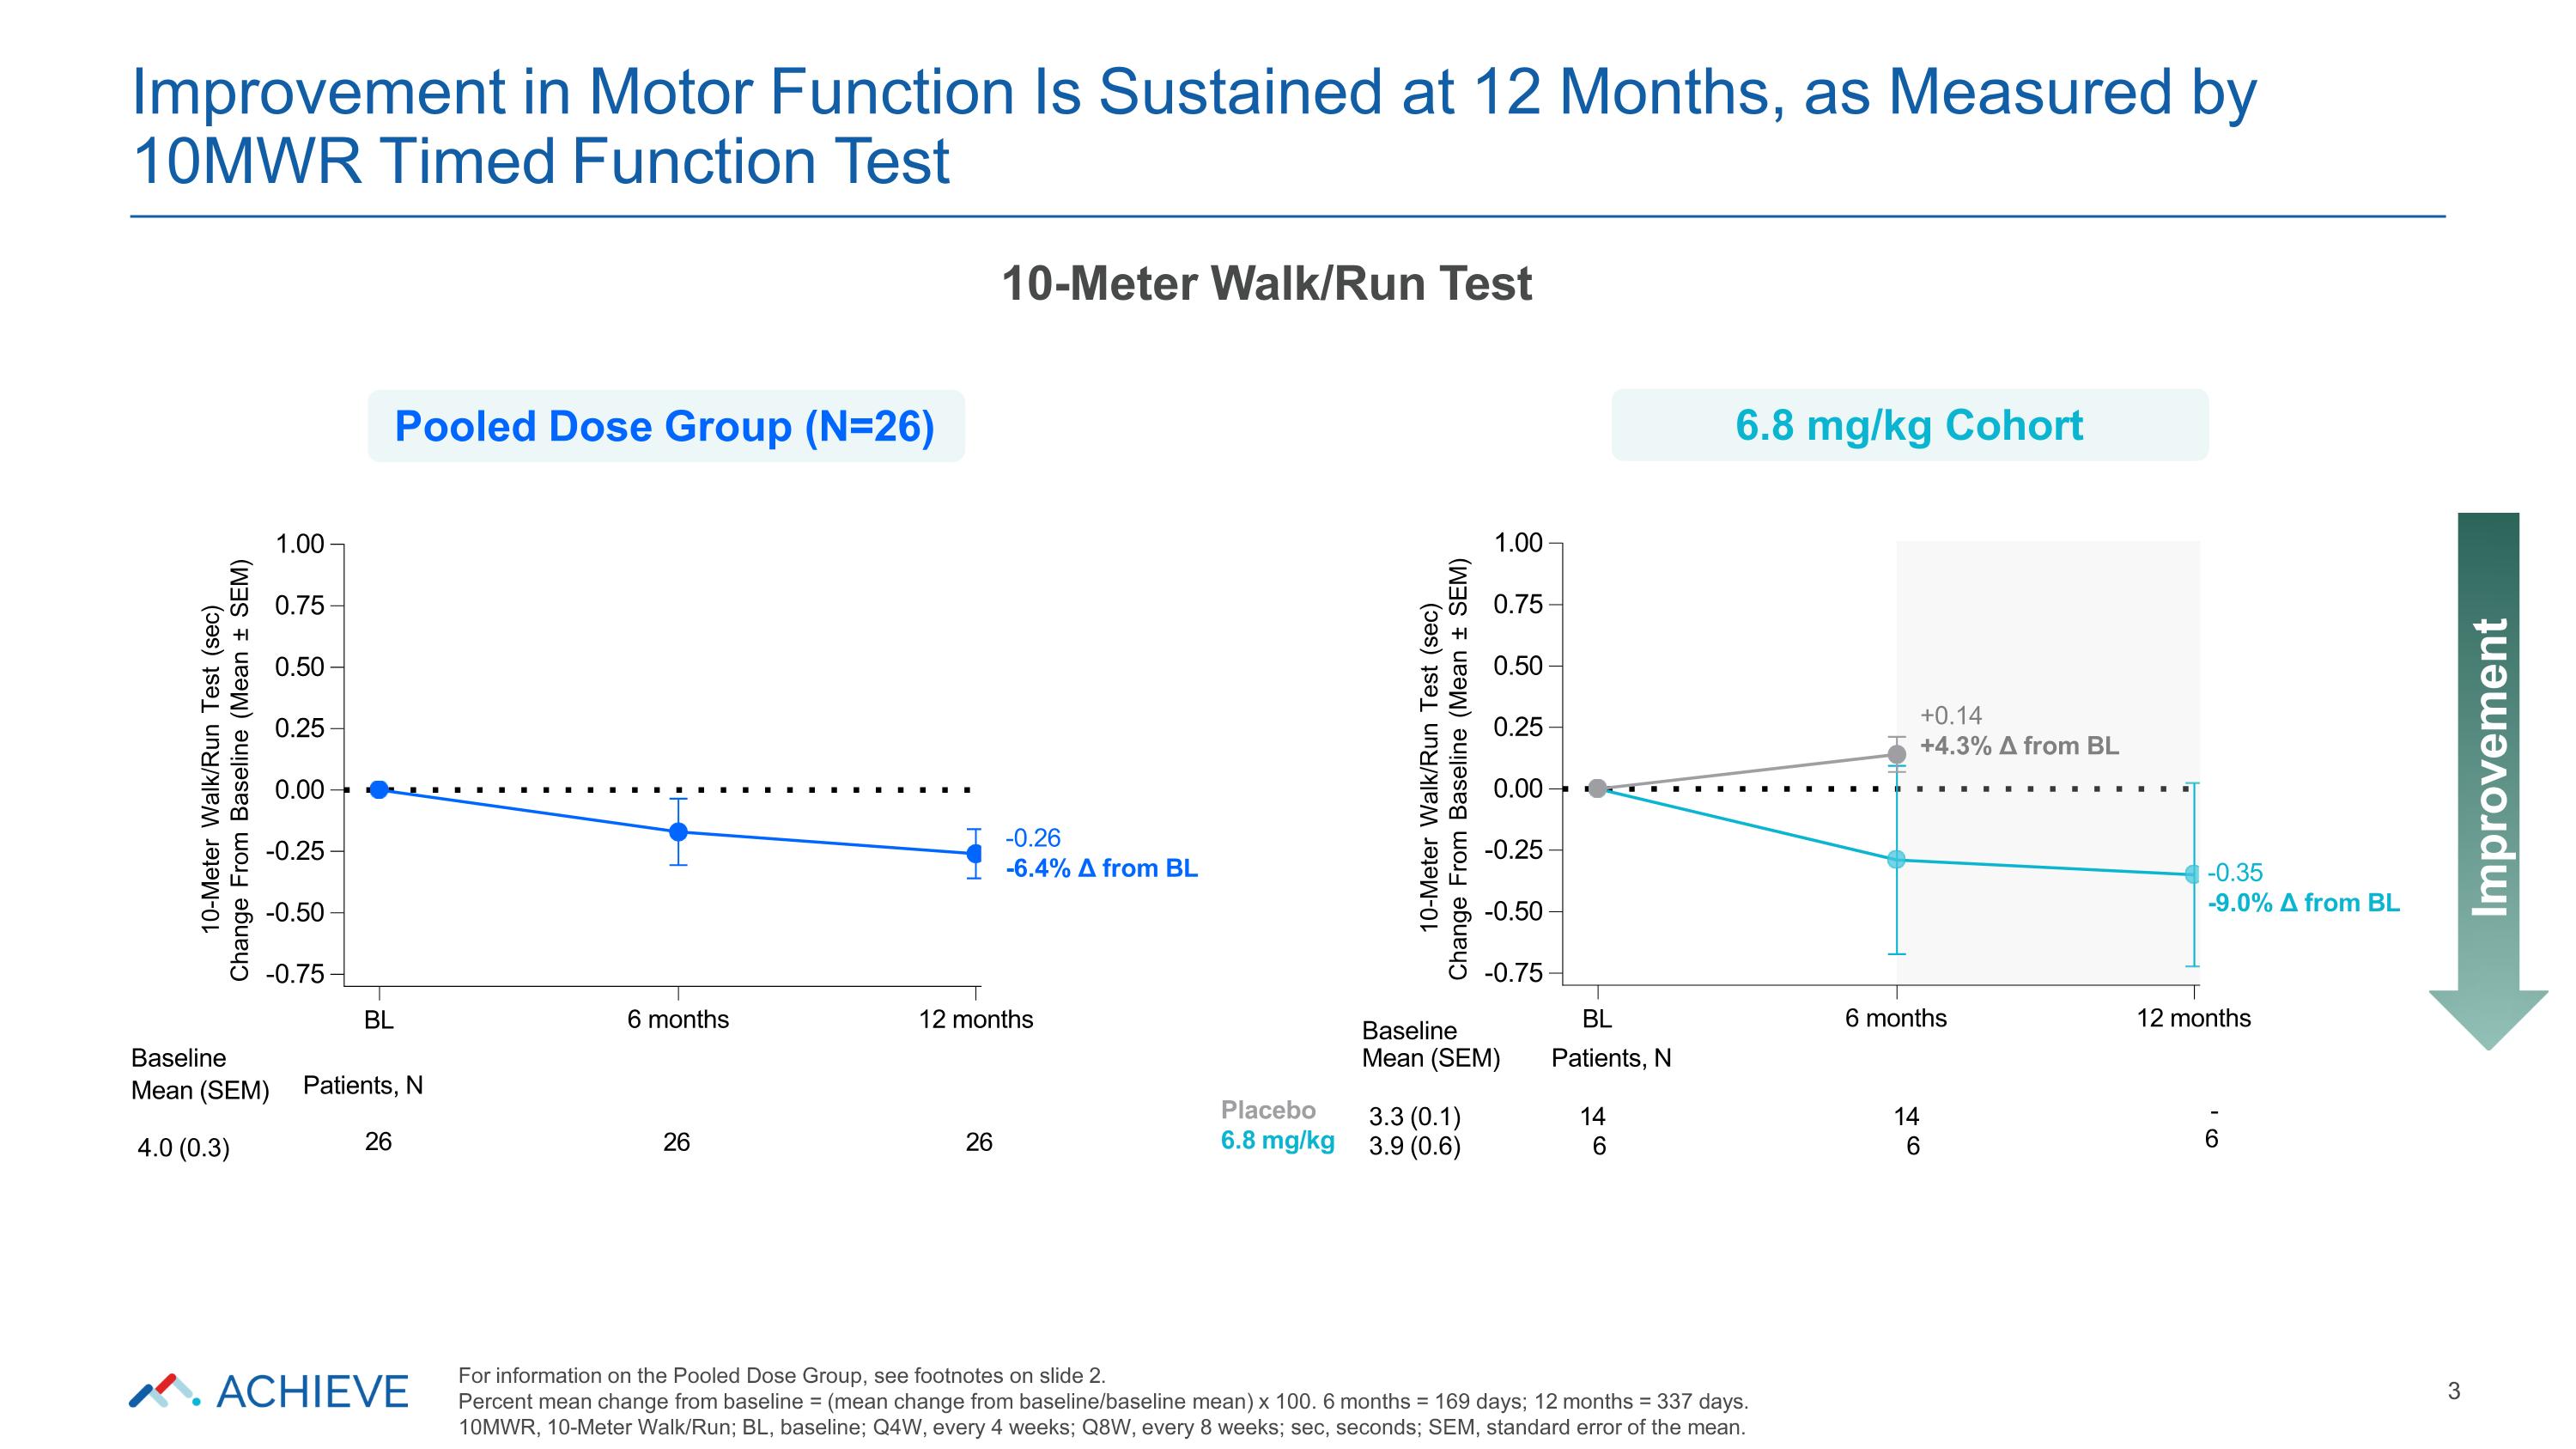
-0.75 -0.50 -0.25 0.00 0.25 0.50 0.75 1.00 10-Meter Walk/Run Test (sec) Change From Baseline (Mean ± SEM) +0.14 +4.3% Δ from BL BL 6 months 12 months Baseline BL 6 months 12 months Baseline Mean (SEM) Patients, N Mean (SEM) 4.0 (0.3) Patients, N 26 26 26 Placebo 6.8 mg/kg 3.3 (0.1) 3.9 (0.6) 14 6 14 6 - 6 -0.35 -9.0% Δ from BL -0.75 -0.50 -0.25 0.00 0.25 0.50 0.75 1.00 10-Meter Walk/Run Test (sec) Change From Baseline (Mean ± SEM) -0.26 -6.4% Δ from BL Improvement in Motor Function Is Sustained at 12 Months, as Measured by 10MWR Timed Function Test 3 Improvement 10-Meter Walk/Run Test Pooled Dose Group (N=26) 6.8 mg/kg Cohort For information on the Pooled Dose Group, see footnotes on slide 2. Percent mean change from baseline = (mean change from baseline/baseline mean) x 100. 6 months = 169 days; 12 months = 337 days. 10MWR, 10-Meter Walk/Run; BL, baseline; Q4W, every 4 weeks; Q8W, every 8 weeks; sec, seconds; SEM, standard error of the mean.
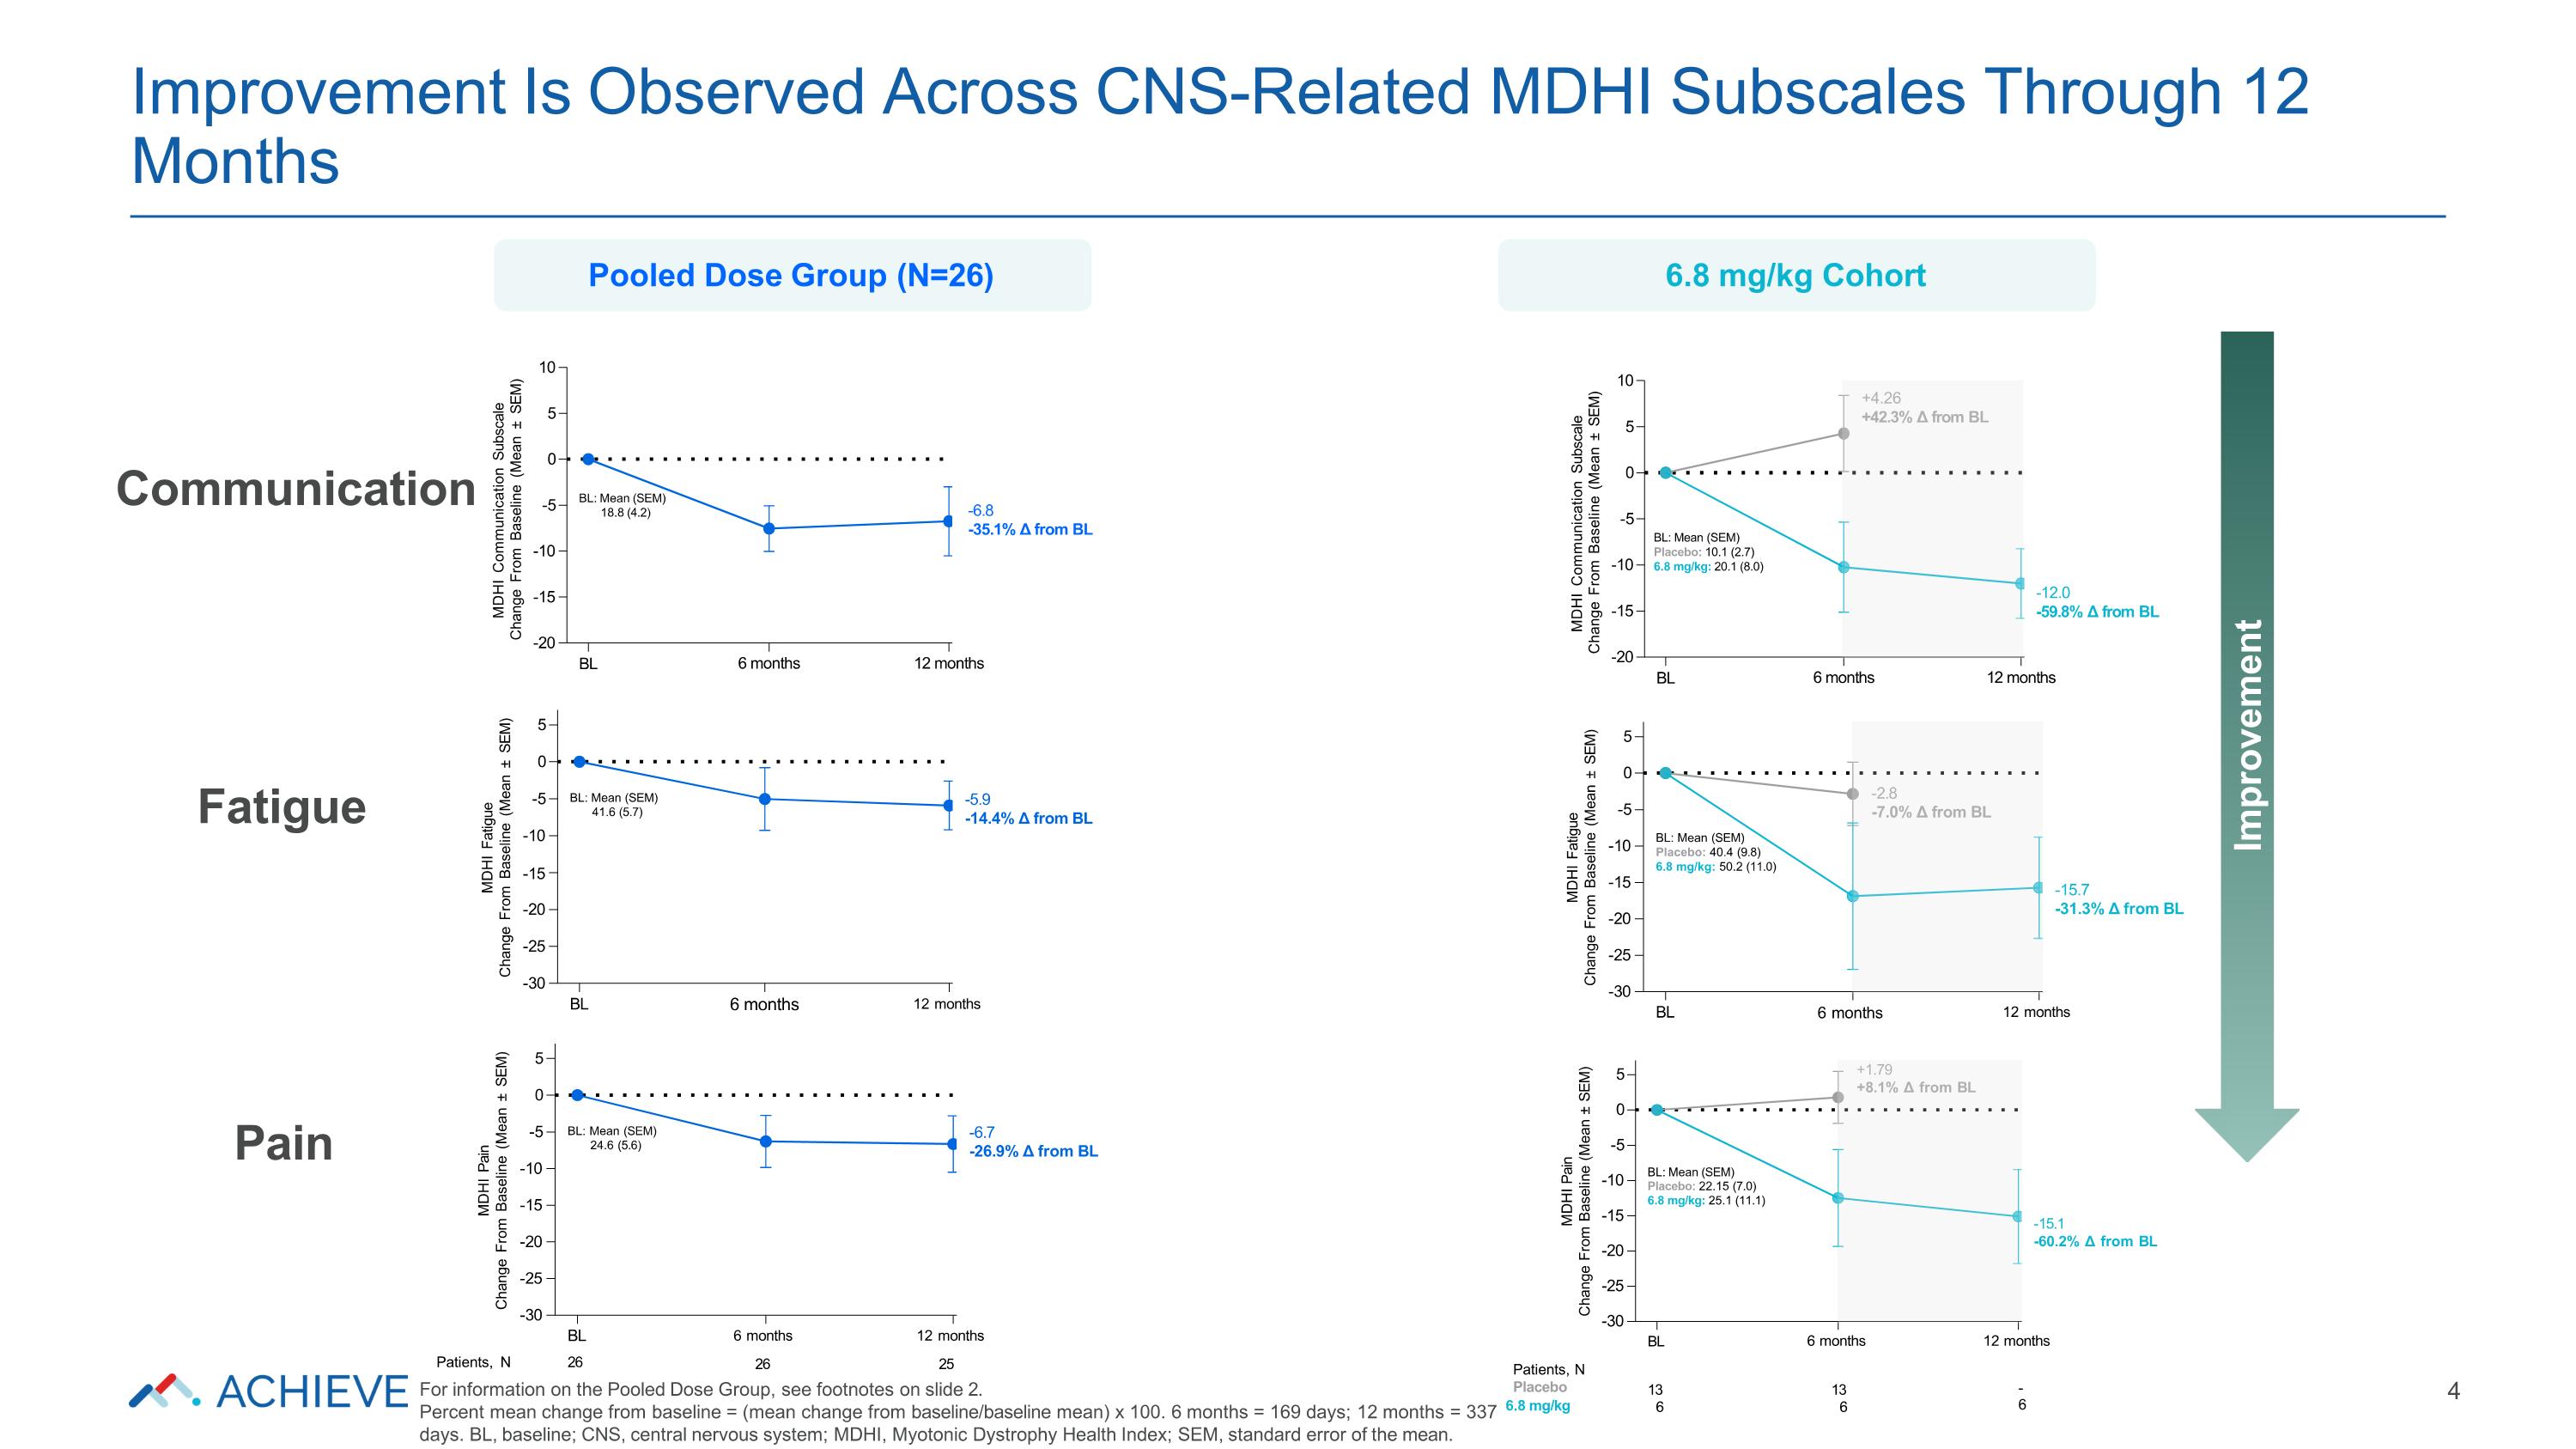
-30 -25 -20 -10 -15 -5 0 5 MDHI Pain Change From Baseline (Mean ± SEM) BL 6 months 12 months -15.1 -60.2% Δ from BL +1.79 +8.1% Δ from BL Patients, N Placebo 13 6 13 6 - 6 BL: Mean (SEM) Placebo: 22.15 (7.0) 6.8 mg/kg: 25.1 (11.1) -30 -25 -20 -15 -10 -5 0 5 MDHI Fatigue Change From Baseline (Mean ± SEM) BL 6 months 12 months -15.7 -31.3% Δ from BL -2.8 -7.0% Δ from BL BL: Mean (SEM) Placebo: 40.4 (9.8) 6.8 mg/kg: 50.2 (11.0) -20 -15 -10 -5 0 5 10 MDHI Communication Subscale Change From Baseline (Mean ± SEM) BL 6 months 12 months -12.0 -59.8% Δ from BL +4.26 +42.3% Δ from BL BL: Mean (SEM) Placebo: 10.1 (2.7) 6.8 mg/kg: 20.1 (8.0) -30 -25 -20 -15 -10 -5 0 5 MDHI Pain Change From Baseline (Mean ± SEM) BL 26 6 months 12 months 26 25 -6.7 -26.9% Δ from BL Patients, N BL: Mean (SEM) 24.6 (5.6) -30 -25 -20 -10 -15 -5 0 5 MDHI Fatigue Change From Baseline (Mean ± SEM) BL 6 months 12 months -5.9 -14.4% Δ from BL BL: Mean (SEM) 41.6 (5.7) -20 -15 -10 -5 0 5 10 MDHI Communication Subscale Change From Baseline (Mean ± SEM) BL 6 months 12 months -6.8 -35.1% Δ from BL BL: Mean (SEM) 18.8 (4.2) Improvement Is Observed Across CNS-Related MDHI Subscales Through 12 Months 4 Improvement Communication Fatigue Pain Pooled Dose Group (N=26) 6.8 mg/kg Cohort For information on the Pooled Dose Group, see footnotes on slide 2. Percent mean change from baseline = (mean change from baseline/baseline mean) x 100. 6 months = 169 days; 12 months = 337 6.8 mg/kg days. BL, baseline; CNS, central nervous system; MDHI, Myotonic Dystrophy Health Index; SEM, standard error of the mean.
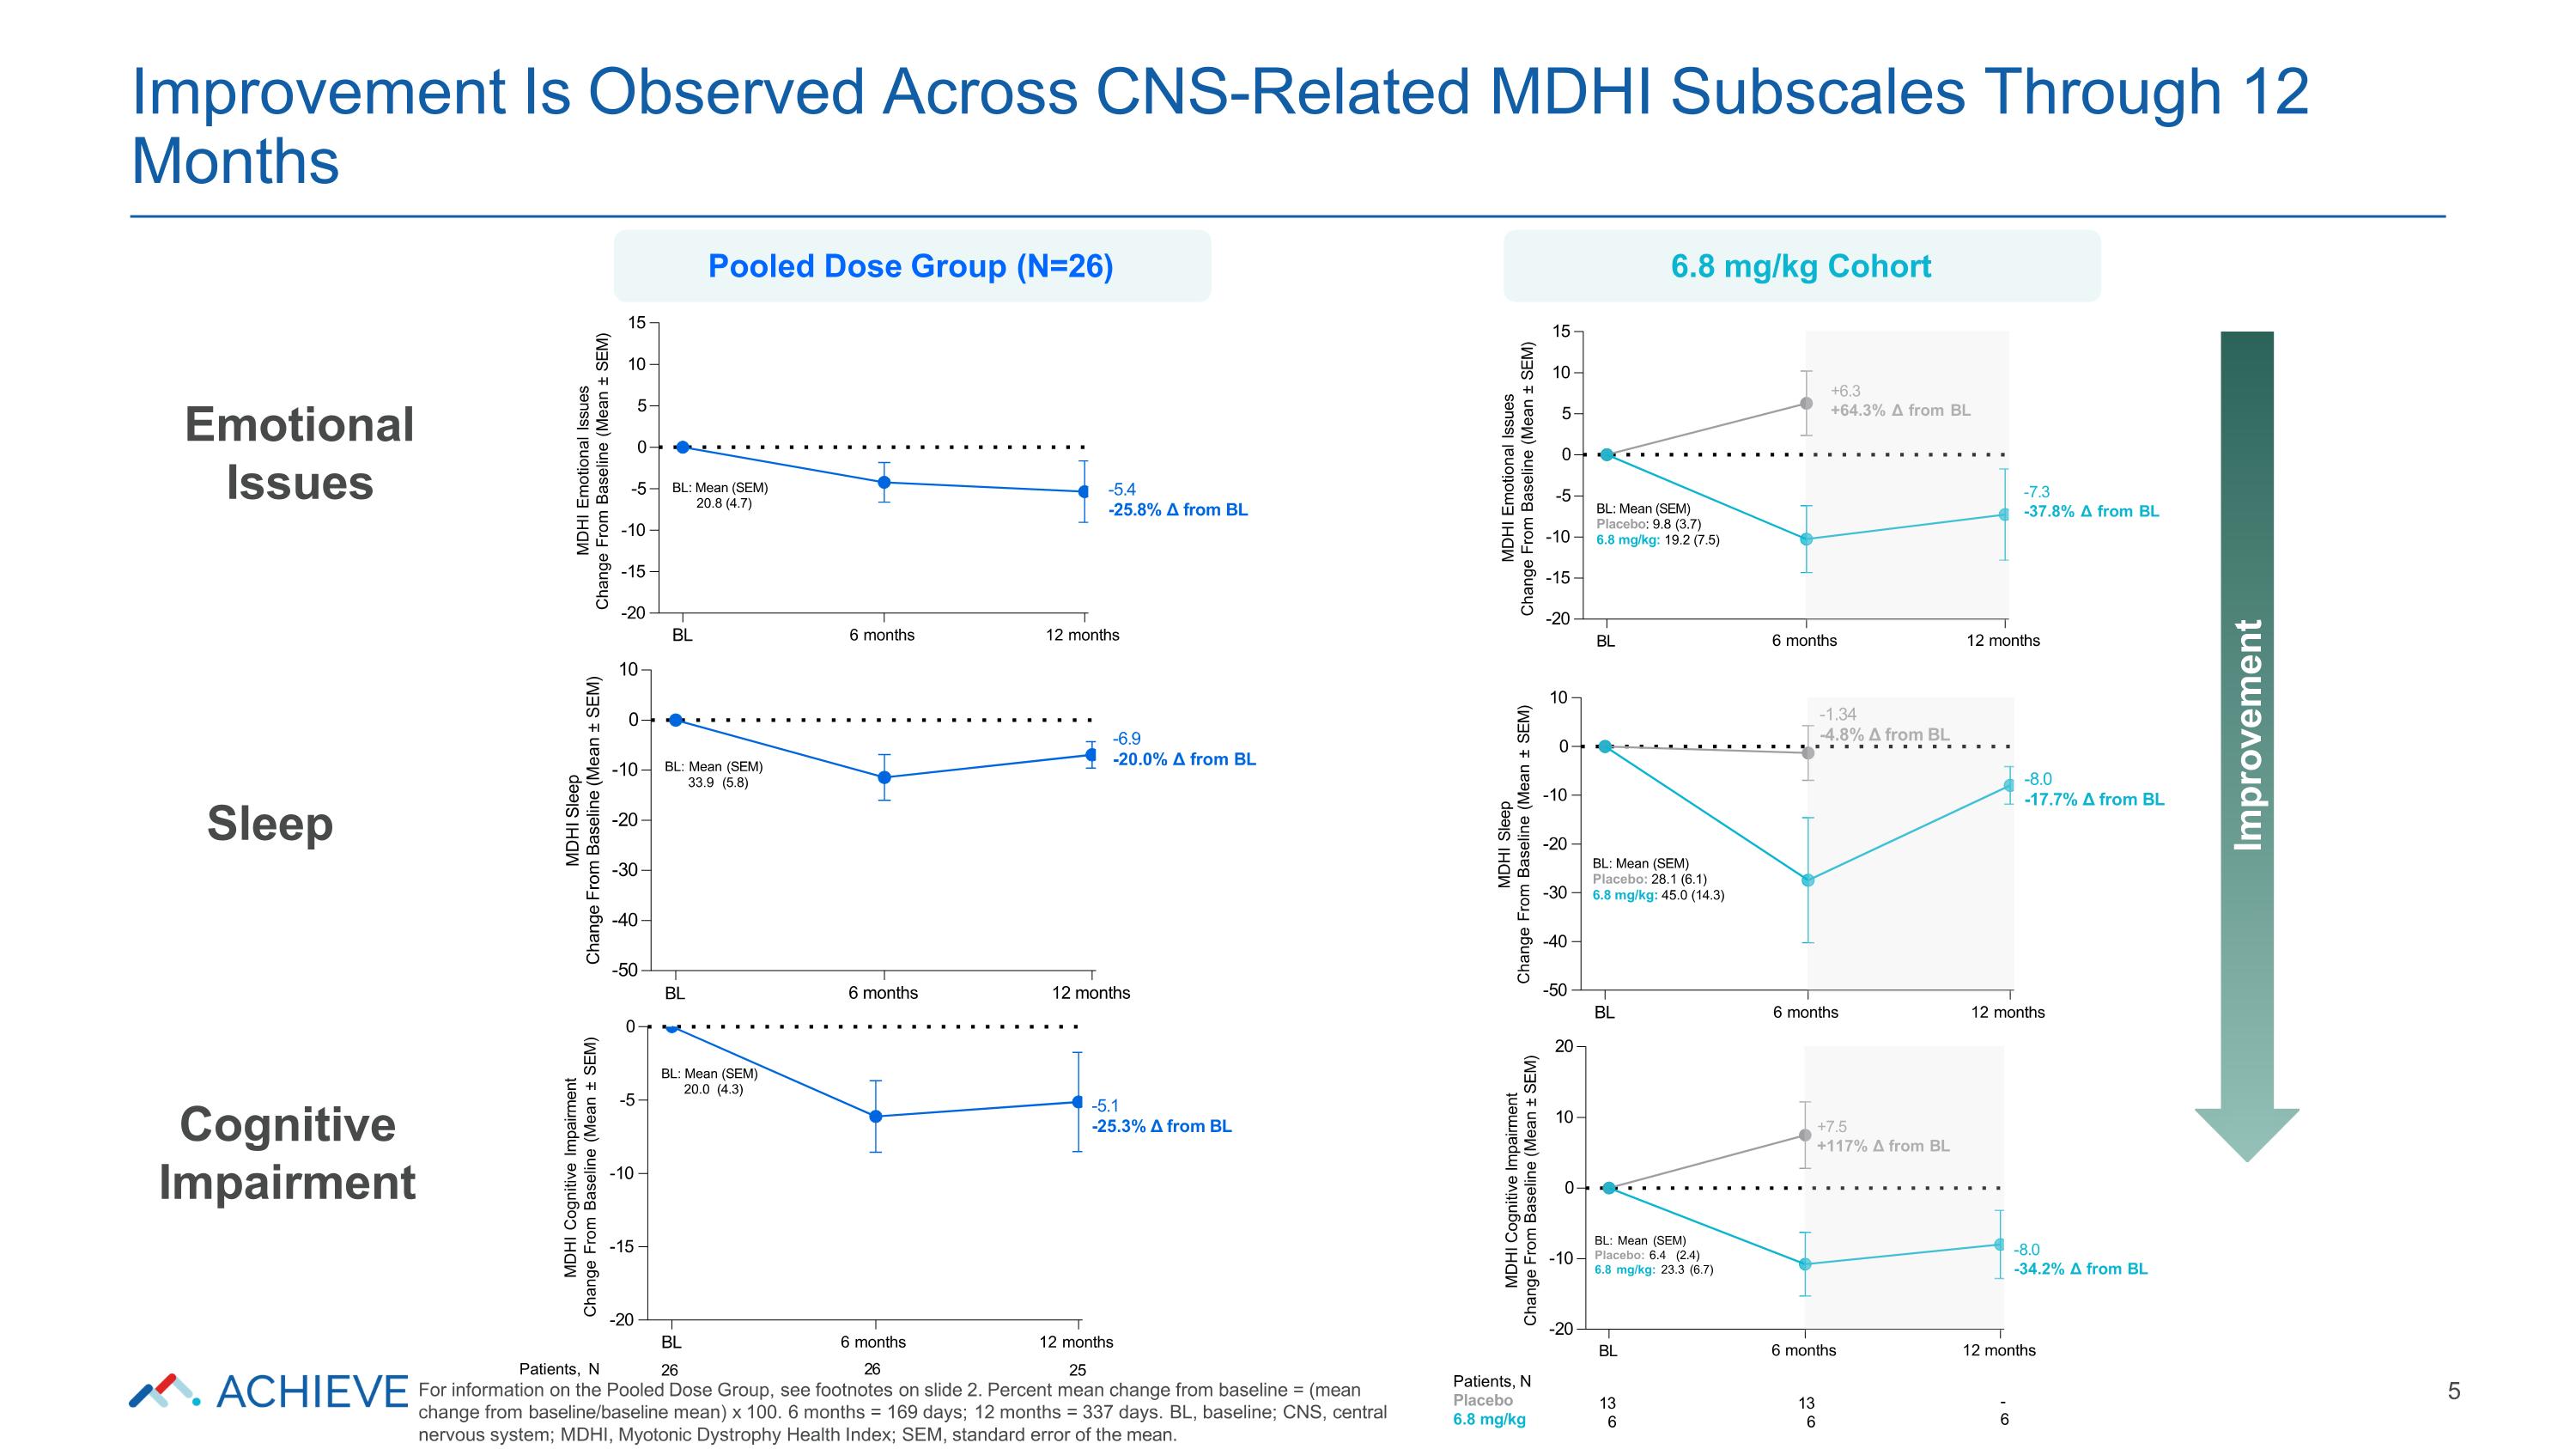
-20 -10 0 10 20 MDHI Cognitive Impairment Change From Baseline (Mean ± SEM) BL 6 months 12 months -8.0 -34.2% Δ from BL +7.5 +117% Δ from BL Patients, N Placebo 6.8 mg/kg 13 6 13 6 - 6 BL: Mean (SEM) Placebo: 6.4 (2.4) 6.8 mg/kg: 23.3 (6.7) -50 -40 -30 -20 -10 0 10 MDHI Sleep Change From Baseline (Mean ± SEM) BL 6 months 12 months -8.0 -17.7% Δ from BL -1.34 -4.8% Δ from BL BL: Mean (SEM) Placebo: 28.1 (6.1) 6.8 mg/kg: 45.0 (14.3) -20 -15 -10 -5 0 5 10 15 MDHI Emotional Issues Change From Baseline (Mean ± SEM) BL 6 months 12 months -7.3 -37.8% Δ from BL +6.3 +64.3% Δ from BL BL: Mean (SEM) Placebo: 9.8 (3.7) 6.8 mg/kg: 19.2 (7.5) -20 -15 -10 -5 0 MDHI Cognitive Impairment Change From Baseline (Mean ± SEM) BL 6 months 12 months -5.1 -25.3% Δ from BL Patients, N 26 26 25 For information on the Pooled Dose Group, see footnotes on slide 2. Percent mean change from baseline = (mean change from baseline/baseline mean) x 100. 6 months = 169 days; 12 months = 337 days. BL, baseline; CNS, central nervous system; MDHI, Myotonic Dystrophy Health Index; SEM, standard error of the mean. BL: Mean (SEM) 20.0 (4.3) -50 -40 -30 -20 -10 0 10 MDHI Sleep Change From Baseline (Mean ± SEM) BL 6 months 12 months -6.9 -20.0% Δ from BL BL: Mean (SEM) 33.9 (5.8) -20 -15 -10 -5 0 5 10 15 MDHI Emotional Issues Change From Baseline (Mean ± SEM) BL 6 months 12 months -5.4 -25.8% Δ from BL BL: Mean (SEM) 20.8 (4.7) Improvement Is Observed Across CNS-Related MDHI Subscales Through 12 Months 5 Pooled Dose Group (N=26) 6.8 mg/kg Cohort Emotional Issues Sleep Cognitive Impairment Improvement