Pay vs Performance Disclosure
Jun. 30, 2026
USD ($)
$ / shares
Jun. 30, 2025
USD ($)
$ / shares
Jun. 30, 2024
USD ($)
$ / shares
Jun. 30, 2023
USD ($)
$ / shares
Jun. 30, 2022
USD ($)
$ / shares
Pay Versus Performance
Pay Versus Performance Table
The following table sets forth information concerning: (1) the compensation of our Principal Executive Officer or CEO and the average compensation for our other NEOs, both as reported in the “Summary Compensation” table and with certain adjustments to reflect the “compensation actually paid” to such individuals, as defined under SEC rules, for each of the fiscal years ended June 30, 2022, 2023, 2024, 2025, and 2026 and (2) our cumulative total shareholder return (“TSR”), the cumulative TSR of our selected peer group (“Compensation Peer Group TSR”), our Net Income and our Adjusted EPS (our Company Selected Measure), over such years in accordance with SEC rules.
Year | Summary Compensation Table Total for CEO ($)(1) | Compensation Actually Paid to CEO ($)(1)(2) | Average Summary Compensation Table Total for Non-CEO NEOs ($)(1) | Average Compensation Actually Paid to Non-CEO NEOs ($)(1)(2) | Value of Initial Fixed $100 Investment Based on: | GAAP Net Income (millions) | Adjusted EPS ($)(4) | |||||||||||||||||||
Total Shareholder Return ($) | Compensation Peer Group Total Shareholder Return ($)(3) | |||||||||||||||||||||||||
2026 | $19,130,826 | $(9,808,518) | $4,634,768 | $156,962 | $92.59 | $72.96 | $1,124.3 | $9.60 | ||||||||||||||||||
2025 | $17,188,658 | $30,364,453 | $3,673,472 | $5,456,968 | $160.99 | $122.59 | $839.5 | $8.55 | ||||||||||||||||||
2024 | $14,251,992 | $21,967,487 | $3,840,974 | $5,132,750 | $128.49 | $104.13 | $698.1 | $7.73 | ||||||||||||||||||
2023 | $12,235,278 | $18,075,686 | $3,689,303 | $4,817,733 | $106.27 | $89.27 | $630.6 | $7.01 | ||||||||||||||||||
2022 | $10,068,228 | $9,168,948 | $4,236,261 | $3,909,638 | $89.72 | $81.74 | $539.1 | $6.46 | ||||||||||||||||||
(1) | The following individuals are our other NEOs for each fiscal year: |
Year | CEO | Non-CEO NEOs | |||||
2026 | Timothy C. Gokey | Ashima Ghei, Christopher J. Perry, Thomas P. Carey, and Douglas R. DeSchutter | |||||
2025 | Timothy C. Gokey | Ashima Ghei, Christopher J. Perry, Thomas P. Carey, and Hope M. Jarkowski | |||||
2024 | Timothy C. Gokey | Edmund J. Reese, Christopher J. Perry, Thomas P. Carey, and Hope M. Jarkowski | |||||
2023 | Timothy C. Gokey | Edmund J. Reese, Christopher J. Perry, Robert Schifellite, and Thomas P. Carey | |||||
2022 | Timothy C. Gokey | Edmund J. Reese, Christopher J. Perry, Robert Schifellite, and Keir D. Gumbs | |||||
(2) | Compensation actually paid to our NEOs represents the compensation reported in the “Total” column in the “Summary Compensation” table for the applicable fiscal year, adjusted as follows: |
2026 | ||||||||
Adjustments | CEO | Average Non- CEO NEOs | ||||||
Deduction for amounts reported under the “Stock Awards” and “Option Awards” columns in the “Summary Compensation” table for applicable fiscal year | $(14,642,868) | $(2,707,989) | ||||||
Deduction for change in the actuarial present values reported under the “Change in Pension Value and Non-Qualified Deferred Compensation Earnings” column of the “Summary Compensation” table for applicable fiscal year | $(1,383,397) | $(114,807) | ||||||
Increase for service cost and, if applicable, prior service cost for pension plans | $133,855 | $50,449 | ||||||
Increase for awards that remain outstanding and unvested as of applicable fiscal year end that were granted during the applicable fiscal year, determined as of applicable fiscal year end and based on ASC 718 Fair Value | $8,584,192 | $1,587,516 | ||||||
Increase for awards granted during applicable fiscal year that vested during applicable fiscal year, determined as of vesting date and based on ASC 718 Fair Value | $0 | $0 | ||||||
Increase/deduction for outstanding and unvested awards as of applicable fiscal year that were granted during prior fiscal years, determined based on change in ASC 718 Fair Value from prior fiscal year to applicable fiscal year | $(15,656,326) | $(2,330,693) | ||||||
Increase/deduction for awards granted during prior fiscal years that vested during applicable fiscal year, determined based on change in ASC 718 Fair Value from prior fiscal year to vesting date | $(5,974,801) | $(962,282) | ||||||
Deduction for awards granted during prior fiscal years that were forfeited during applicable fiscal year, determined as of prior fiscal year end based on ASC 718 Fair Value | $0 | $0 | ||||||
Increase based on dividends or other earnings paid on awards during applicable fiscal year prior to vesting date | $0 | $0 | ||||||
TOTAL ADJUSTMENTS | $(28,939,344) | $(4,477,806) | ||||||
(3) | TSR is cumulative for the measurement periods beginning on June 30, 2021 and ending on June 30 of each of 2022, 2023, 2024, 2025, and 2026 respectively, calculated in accordance with Item 201(e) of Regulation S-K. The peer group includes: Equifax Inc., Euronet Worldwide, Inc., FactSet Research Systems Inc., Fidelity National Information Services, Inc., Fiserv, Inc., Gartner, Inc., Global Payments Inc., Intercontinental Exchange, Inc., Jack Henry & Associates, Inc., Paychex, Inc., SS&C Technologies Holdings, Inc., Verisk Analytics, Inc., The Western Union Company, and Nasdaq Inc. In fiscal year 2026, the Company added Nasdaq, Inc. See “Peer Group Selection and Market Data” on page 55 of this Proxy Statement for more details. |
(4) | Adjusted EPS is a non-GAAP financial measure. For more information on the Company’s use of this metric, see “Non-GAAP Financial Measures” beginning on page 87 of this Proxy Statement. |
(5) | The TSR peer group for 2025, which differed from the 2026 Peer Group, consisted of the following companies: Equifax Inc., Euronet Worldwide, Inc., FactSet Research Systems Inc., Fidelity National Information Services, Inc., Fiserv, Inc., Gartner, Inc., Global Payments Inc., Intercontinental Exchange, Inc., Jack Henry & Associates, Inc., Paychex, Inc., SS&C Technologies Holdings, Inc., Verisk Analytics, Inc., and The Western Union Company (collectively “2025 Peer Group”). If the 2025 Peer Group were used, the peer group TSR for each year would be $81.34, $89.39, $103.91, $119.60, and $67.37 for 2022, 2023, 2024, 2025 and 2026, respectively. Please refer to the CD&A portion of this Proxy Statement above for details regarding the Compensation Committee’s design of the 2026 Peer Group. |
(1) | The following individuals are our other NEOs for each fiscal year: |
Year | CEO | Non-CEO NEOs | |||||
2026 | Timothy C. Gokey | Ashima Ghei, Christopher J. Perry, Thomas P. Carey, and Douglas R. DeSchutter | |||||
2025 | Timothy C. Gokey | Ashima Ghei, Christopher J. Perry, Thomas P. Carey, and Hope M. Jarkowski | |||||
2024 | Timothy C. Gokey | Edmund J. Reese, Christopher J. Perry, Thomas P. Carey, and Hope M. Jarkowski | |||||
2023 | Timothy C. Gokey | Edmund J. Reese, Christopher J. Perry, Robert Schifellite, and Thomas P. Carey | |||||
2022 | Timothy C. Gokey | Edmund J. Reese, Christopher J. Perry, Robert Schifellite, and Keir D. Gumbs | |||||
(3) | TSR is cumulative for the measurement periods beginning on June 30, 2021 and ending on June 30 of each of 2022, 2023, 2024, 2025, and 2026 respectively, calculated in accordance with Item 201(e) of Regulation S-K. The peer group includes: Equifax Inc., Euronet Worldwide, Inc., FactSet Research Systems Inc., Fidelity National Information Services, Inc., Fiserv, Inc., Gartner, Inc., Global Payments Inc., Intercontinental Exchange, Inc., Jack Henry & Associates, Inc., Paychex, Inc., SS&C Technologies Holdings, Inc., Verisk Analytics, Inc., The Western Union Company, and Nasdaq Inc. In fiscal year 2026, the Company added Nasdaq, Inc. See “Peer Group Selection and Market Data” on page 55 of this Proxy Statement for more details. |
(5) | The TSR peer group for 2025, which differed from the 2026 Peer Group, consisted of the following companies: Equifax Inc., Euronet Worldwide, Inc., FactSet Research Systems Inc., Fidelity National Information Services, Inc., Fiserv, Inc., Gartner, Inc., Global Payments Inc., Intercontinental Exchange, Inc., Jack Henry & Associates, Inc., Paychex, Inc., SS&C Technologies Holdings, Inc., Verisk Analytics, Inc., and The Western Union Company (collectively “2025 Peer Group”). If the 2025 Peer Group were used, the peer group TSR for each year would be $81.34, $89.39, $103.91, $119.60, and $67.37 for 2022, 2023, 2024, 2025 and 2026, respectively. Please refer to the CD&A portion of this Proxy Statement above for details regarding the Compensation Committee’s design of the 2026 Peer Group. |
(2) | Compensation actually paid to our NEOs represents the compensation reported in the “Total” column in the “Summary Compensation” table for the applicable fiscal year, adjusted as follows: |
2026 | ||||||||
Adjustments | CEO | Average Non- CEO NEOs | ||||||
Deduction for amounts reported under the “Stock Awards” and “Option Awards” columns in the “Summary Compensation” table for applicable fiscal year | $(14,642,868) | $(2,707,989) | ||||||
Deduction for change in the actuarial present values reported under the “Change in Pension Value and Non-Qualified Deferred Compensation Earnings” column of the “Summary Compensation” table for applicable fiscal year | $(1,383,397) | $(114,807) | ||||||
Increase for service cost and, if applicable, prior service cost for pension plans | $133,855 | $50,449 | ||||||
Increase for awards that remain outstanding and unvested as of applicable fiscal year end that were granted during the applicable fiscal year, determined as of applicable fiscal year end and based on ASC 718 Fair Value | $8,584,192 | $1,587,516 | ||||||
Increase for awards granted during applicable fiscal year that vested during applicable fiscal year, determined as of vesting date and based on ASC 718 Fair Value | $0 | $0 | ||||||
Increase/deduction for outstanding and unvested awards as of applicable fiscal year that were granted during prior fiscal years, determined based on change in ASC 718 Fair Value from prior fiscal year to applicable fiscal year | $(15,656,326) | $(2,330,693) | ||||||
Increase/deduction for awards granted during prior fiscal years that vested during applicable fiscal year, determined based on change in ASC 718 Fair Value from prior fiscal year to vesting date | $(5,974,801) | $(962,282) | ||||||
Deduction for awards granted during prior fiscal years that were forfeited during applicable fiscal year, determined as of prior fiscal year end based on ASC 718 Fair Value | $0 | $0 | ||||||
Increase based on dividends or other earnings paid on awards during applicable fiscal year prior to vesting date | $0 | $0 | ||||||
TOTAL ADJUSTMENTS | $(28,939,344) | $(4,477,806) | ||||||
(2) | Compensation actually paid to our NEOs represents the compensation reported in the “Total” column in the “Summary Compensation” table for the applicable fiscal year, adjusted as follows: |
2026 | ||||||||
Adjustments | CEO | Average Non- CEO NEOs | ||||||
Deduction for amounts reported under the “Stock Awards” and “Option Awards” columns in the “Summary Compensation” table for applicable fiscal year | $(14,642,868) | $(2,707,989) | ||||||
Deduction for change in the actuarial present values reported under the “Change in Pension Value and Non-Qualified Deferred Compensation Earnings” column of the “Summary Compensation” table for applicable fiscal year | $(1,383,397) | $(114,807) | ||||||
Increase for service cost and, if applicable, prior service cost for pension plans | $133,855 | $50,449 | ||||||
Increase for awards that remain outstanding and unvested as of applicable fiscal year end that were granted during the applicable fiscal year, determined as of applicable fiscal year end and based on ASC 718 Fair Value | $8,584,192 | $1,587,516 | ||||||
Increase for awards granted during applicable fiscal year that vested during applicable fiscal year, determined as of vesting date and based on ASC 718 Fair Value | $0 | $0 | ||||||
Increase/deduction for outstanding and unvested awards as of applicable fiscal year that were granted during prior fiscal years, determined based on change in ASC 718 Fair Value from prior fiscal year to applicable fiscal year | $(15,656,326) | $(2,330,693) | ||||||
Increase/deduction for awards granted during prior fiscal years that vested during applicable fiscal year, determined based on change in ASC 718 Fair Value from prior fiscal year to vesting date | $(5,974,801) | $(962,282) | ||||||
Deduction for awards granted during prior fiscal years that were forfeited during applicable fiscal year, determined as of prior fiscal year end based on ASC 718 Fair Value | $0 | $0 | ||||||
Increase based on dividends or other earnings paid on awards during applicable fiscal year prior to vesting date | $0 | $0 | ||||||
TOTAL ADJUSTMENTS | $(28,939,344) | $(4,477,806) | ||||||
TSR amounts reported in the graph assume an initial fixed investment of $100, and that all dividends, if any, were reinvested.
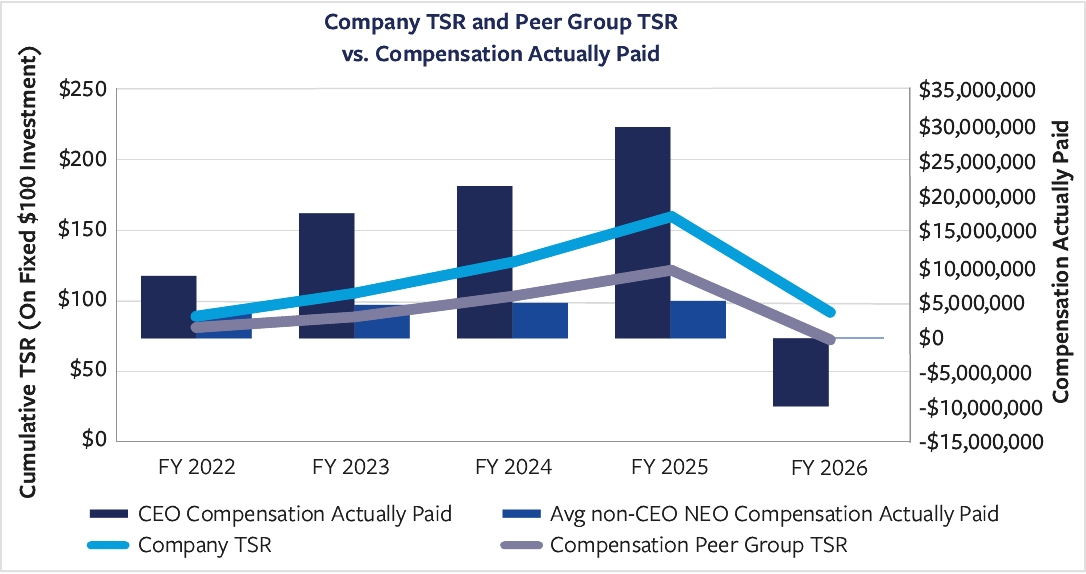
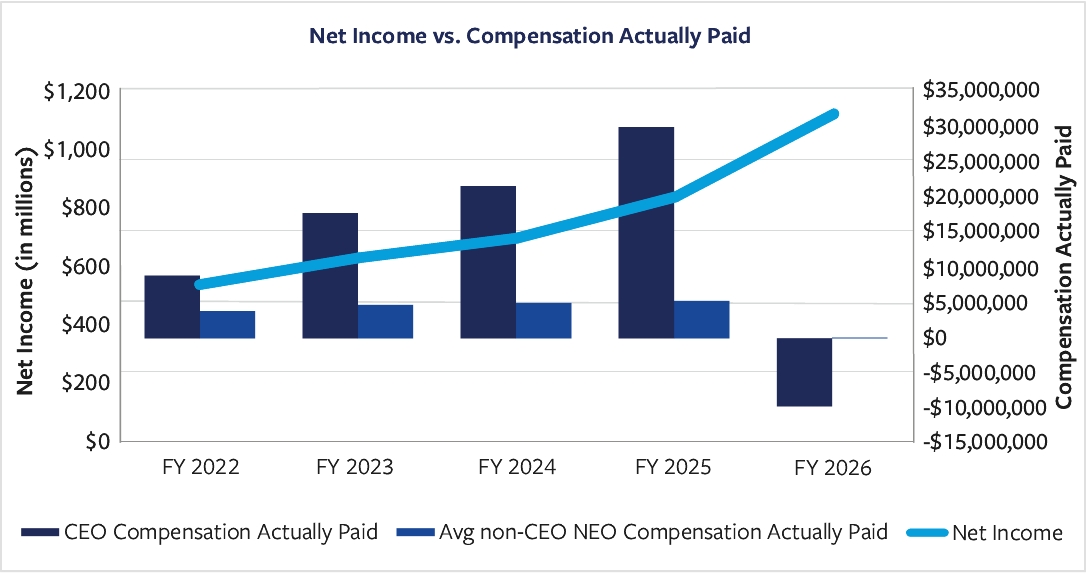
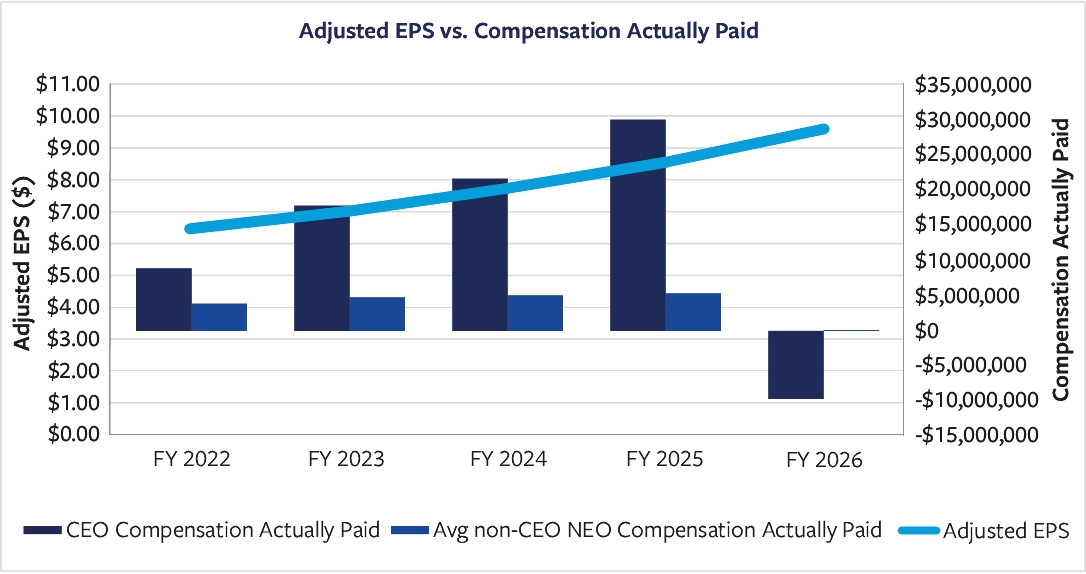
TSR amounts reported in the graph assume an initial fixed investment of $100, and that all dividends, if any, were reinvested.
Pay Versus Performance Tabular List
The following performance measures represent the most important financial performance measures used by us to link compensation actually paid to our NEOs to performance for the fiscal year ended June 30, 2026:
• | Adjusted EPS |
• | Adjusted EBT |
• | Closed Sales |
(4) | Adjusted EPS is a non-GAAP financial measure. For more information on the Company’s use of this metric, see “Non-GAAP Financial Measures” beginning on page 87 of this Proxy Statement. |