

Exhibit 96.1
|
|
SK-1300 TECHNICAL REPORT SUMMARY
ON THE
MALACACHETA PROJECT,
MINAS GERAIS STATE, BRAZIL
Prepared for:
Atlas Critical Minerals Corporation (NASDAQ: ATCX)
Rua Antônio de Albuquerque, 156, Suite 1720, Belo Horizonte,
Minas Gerais, Brazil, 30112-010
Report Date: September 23, 2026
Effective Date: September 14, 2026
Prepared by:
SGS Canada Inc.
SGS Project #21169-03
| SGS Canada Inc. | Geological Services |
| 10 boul. de la Seigneurie Est, Suite 203, Blainville, Québec Canada J7C 3V5 t (450) 433-1050 f (450) 433-1048 www.geostat.com | |
| Member of SGS Group (SGS SA) |
| S-K 1300 Technical Report – Malacacheta Graphite Project – Minas Gerais, Brazil | Page i |
| TABLE OF CONTENTS | |
| TABLE OF CONTENTS | i |
| LIST OF FIGURES | iii |
| LIST OF TABLES | iv |
| 1 SUMMARY | 5 |
| 1.1 Introduction | 5 |
| 1.2 Property Description, Location, Access, and Physiography | 5 |
| 1.3 History | 6 |
| 1.4 Geology and Mineralization | 6 |
| 1.5 Exploration | 7 |
| 1.6 Data Verification | 7 |
| 1.7 Mineral Resource Estimates | 7 |
| 1.8 Adjacent Properties | 8 |
| 1.9 Conclusions and Recommendations | 8 |
| 1.9.1 Conclusions | 8 |
| 1.9.2 Recommendations | 8 |
| 2 INTRODUCTION | 10 |
| 2.1 Registrant Information | 10 |
| 2.2 Terms of Reference and Purpose | 10 |
| 2.3 Sources of Information | 10 |
| 2.4 Personal Inspection Summary | 11 |
| 2.5 Previously Filed Technical Report Summary Report | 11 |
| 2.6 Units and Abbreviations | 11 |
| 3 PROPERTY DESCRIPTION | 13 |
| 3.1 Property Description and Location | 13 |
| 3.2 Mineral Tenure | 14 |
| 3.3 Surface Rights | 14 |
| 3.4 Royalties and Encumbrances | 14 |
| 3.5 Reliance on Other Experts | 14 |
| 4 ACCESSIBILITY, CLIMATE, LOCAL RESOURCES, INFRASTRUCTURE, AND PHYSIOGRAPHY | 15 |
| 4.1 Accessibility | 15 |
| 4.2 Climate | 15 |
| 4.3 Local Resources | 16 |
| 4.4 Infrastructure | 16 |
| 4.5 Physiography | 17 |
| 5 HISTORY | 18 |
| 5.1 Historical Resource Estimates | 18 |
| 5.2 Past Production | 18 |
| 6 GEOLOGICAL SETTING, MINERALIZATION, AND DEPOSIT | 19 |
| 6.1 Regional Geology | 19 |
| 6.2 Local Geology | 21 |
| 6.3 Property Geology | 22 |
| 6.4 Structural Geology | 26 |
| 6.5 Deposit Type | 28 |
| 7 EXPLORATION | 29 |
| 7.1 Compilation of Public Data | 29 |
| 7.2 Geological Reconnaissance and Mapping | 29 |
| 7.3 Grab Sampling and Geochemistry | 29 |
| 7.4 Topographic Survey (LiDAR) | 31 |
| 7.5 Geophysics | 31 |
| 7.6 Drilling | 34 |
| 7.6.1 Introduction | 34 |
| 7.6.2 Drill Methods | 34 |
| 7.6.3 Collar Surveys | 34 |
| 7.6.4 Downhole Surveys | 35 |
| 7.6.5 Significant Drill Results | 35 |
 |
| SGS Geological Services |
| S-K 1300 Technical Report – Malacacheta Graphite Project – Minas Gerais, Brazil | Page ii |
| 8 SAMPLE PREPARATION, ANALYSES, AND SECURITY | 37 |
| 8.1 Core Sampling | 37 |
| 8.2 Analytical and Test Laboratories | 37 |
| 8.3 Sample Preparation and Analysis | 38 |
| 8.4 Density Determinations | 38 |
| 8.5 Quality Assurance and Quality Control | 38 |
| 8.5.1 Certified Reference Materials (CRMs) | 39 |
| 8.5.2 Blanks | 41 |
| 8.5.3 Duplicates | 42 |
| 8.6 Sample Security | 43 |
| 8.7 QP Comments | 43 |
| 9 DATA VERIFICATION | 44 |
| 9.1 Drilling Database | 44 |
| 9.2 Site Visit | 44 |
| 10 MINERAL PROCESSING AND METALLURGICAL TESTING | 45 |
| 10.1 Sample Analysis and Initial Flotation Test Work | 45 |
| 10.1.1 Scope | 45 |
| 10.1.2 Methods of Chemical Analysis | 46 |
| 10.1.3 Flotation | 46 |
| 10.1.4 Sample Receiving | 47 |
| 10.1.5 Chemical Analysis of The Original Samples | 48 |
| 10.1.6 Flotation Results | 50 |
| 10.1.7 Size by Size Analysis | 51 |
| 10.1.8 Results and Conclusion | 52 |
| 10.1.9 Suggestion For Further Work | 53 |
| 10.2 Graphite Processing and Characterization | 53 |
| 10.2.1 Scope | 53 |
| 10.2.2 Methods of Analysis and Characterization | 54 |
| 10.2.3 Incoming Raw Materials Analysis (IRMA) | 55 |
| 10.2.4 Thermal Purification | 59 |
| 10.2.5 Results and Conclusions | 65 |
| 11 MINERAL RESOURCE ESTIMATES | 66 |
| 11.1 Exploratory Data Analysis | 66 |
| 11.2 Analytical Data | 66 |
| 11.3 Composite Data | 67 |
| 11.4 High Grade Capping | 68 |
| 11.5 Density | 69 |
| 11.6 Geologic Interpretation | 69 |
| 11.7 Resource Block Modelling | 71 |
| 11.8 Block Model Interpretation | 71 |
| 11.9 Block Model Validation | 73 |
| 11.10 Mineral Resource Classification | 77 |
| 11.11 Reasonable Prospects for Eventual Economic Extraction | 79 |
| 11.12 Mineral Resource Estimate | 80 |
| 12 MINERAL RESERVE ESTIMATES | 82 |
| 13 MINING METHODS | 83 |
| 14 PROCESSING AND RECOVERY METHODS | 84 |
| 15 INFRASTRUCTURE | 85 |
| 16 MARKET STUDIES | 86 |
| 17 ENVIRONMENTAL STUDIES, PERMITTING, AND PLANS, NEGOTIATIONS, OR AGREEMENTS WITH LOCAL INDIVIDUALS OR GROUPS | 87 |
| 18 CAPITAL AND OPERATING COSTS | 88 |
| 19 ECONOMIC ANALYSIS | 89 |
| 20 ADJACENT PROPERTIES | 90 |
| 21 OTHER RELEVANT DATA AND INFORMATION | 91 |
| 22 INTERPRETATION AND CONCLUSIONS | 92 |
| 22.1 Mineral Resource Estimates | 92 |
| 23 RECOMMENDATIONS | 94 |
| 24 REFERENCES | 95 |
| 25 RELIANCE ON INFORMATION PROVIDED BY THE REGISTRANT | 95 |
| |
| SGS Geological Services |
| S-K 1300 Technical Report – Malacacheta Graphite Project – Minas Gerais, Brazil | Page iii |
LIST OF FIGURES
| Figure 3-1 | Location of the Malacacheta Project | 13 |
| Figure 4-1 | Location and Access to Malacacheta Project from Belo Horizonte | 15 |
| Figure 4-2 | Climate Classification of the Project Area According to Köppen | 16 |
| Figure 6-1 | Geological Map of the Araçuaí Orogen | 20 |
| Figure 6-2 | Simplified Geology of the Macaúbas Group (Pedrosa-Soares et al., 2007) | 22 |
| Figure 6-3 | A) Gneisses of Guanhães Complex. B) Quartzites of Macaúbas Group | 23 |
| Figure 6-4 | A) Amphibolite of Macaúbas Group. B) Mica Schists of Macaúbas Group | 24 |
| Figure 6-5 | A) Graphite Schist outcrop. B) Graphite Schist Sample in Detail. C) Drill Core Samples of Graphite Schists from Tenement 830.954/2021 | 25 |
| Figure 6-6 | Geological Map | 27 |
| Figure 7-1 | Location of Surface Samples | 31 |
| Figure 7-2 | Malacacheta IP Grid Lines | 32 |
| Figure 7-3 | Metal Factor Map at 30 m and 60 m Depth | 33 |
| Figure 8-1 | Results for Standard OREAS 722 | 40 |
| Figure 8-2 | Results for Standard OREAS 724 | 40 |
| Figure 8-3 | Results for Standard OREAS 725 | 41 |
| Figure 8-4 | Blank sample Results | 42 |
| Figure 8-5 | Core Duplicate Sample Results | 43 |
| Figure 10-1 | Test Work Flowsheet for Graphite Samples | 45 |
| Figure 10-2 | Flotation Test Work Flowsheet | 47 |
| Figure 10-3 | Block Diagram Flowsheet of Graphite Processing and Characterization | 54 |
| Figure 10-4 | SEM Imagery of the “As Received” Sample | 56 |
| Figure 10-5 | Screen Analysis Results for the “As Received” Sample | 58 |
| Figure 10-6 | Screen Analysis Results for Purified Material | 60 |
| Figure 10-7 | SEM Images of +40 Mesh Purified Material | 61 |
| Figure 10-8 | SEM Images of +50 Mesh Purified Material | 62 |
| Figure 10-9 | SEM Images of +80 Mesh Purified Material | 63 |
| Figure 10-10 | SEM Images of +100 Mesh Purified Material | 64 |
| Figure 10 11 | SEM Images of -100 Mesh Purified Material | 65 |
| Figure 11-1 | Malacacheta Drillhole Locations | 66 |
| Figure 11-2 | Graphitic Carbon Grade Frequency Plot | 67 |
| Figure 11-3 | Sample Length Frequency Histogram | 68 |
| Figure 11-4 | Malacacheta Graphitic Schist Solids | 70 |
| Figure 11-5 | Cross-Section through Block 3 Looking East | 70 |
| Figure 11-6 | Search Ellipse Orientations | 72 |
| Figure 11-7 | Malacacheta Interpolated Block Model showing Graphitic Carbon Grades | 73 |
| Figure 11-8 | Graphitic Carbon Frequency Histogram | 74 |
| Figure 11-9 | Graphitic Carbon Block Model versus Composites | 75 |
| Figure 11-10 | Swath Plot X Direction | 76 |
| Figure 11-11 | Swath Plot Y Direction | 76 |
| Figure 11-12 | Swath Plot Z Direction | 77 |
| Figure 11-13 | Malacacheta Classified Block Model | 79 |
| Figure 11-14 | Malacacheta Deposit Open Pit | 80 |
| |
| SGS Geological Services |
| S-K 1300 Technical Report – Malacacheta Graphite Project – Minas Gerais, Brazil | Page iv |
LIST OF TABLES
| Table 1-1 | Combined Malacacheta Mineral Resource Estimate at 2.0% Graphitic Carbon | 8 |
| Table 2-1 | List of Abbreviations | 12 |
| Table 3-1 | Malacacheta Mineral Rights Description | 14 |
| Table 7-1 | Results of High-Grade Outcrop Sampling | 30 |
| Table 7-2 | Collar Co-Ordinates of Completed Drillholes | 34 |
| Table 7-3 | 2026 Malacacheta Significant Assays | 35 |
| Table 8-1 | Density Values for Graphitic Schist | 38 |
| Table 8-2 | QA/QC Protocol of Insertion Blank, Core Duplicate and Standards | 38 |
| Table 8-3 | Certified Value, SD, 95% Confidence and Tolerance Limits for OREAS 722 | 39 |
| Table 8-4 | Certified Value, SD, 95% Confidence and Tolerance Limits for OREAS 724 | 39 |
| Table 8-5 | Certified Value, SD, 95% Confidence and Tolerance Limits for OREAS 725 | 39 |
| Table 10-1 | Sample Identification and Weight | 47 |
| Table 10-2 | Analysis Results for LECO, XRF and LOI | 49 |
| Table 10-3 | Analysis Results for PHY00D on Ashes | 49 |
| Table 10-4 | Flotation Results for SMAL-00001 | 50 |
| Table 10-5 | Flotation Results for SMAL-00009 | 51 |
| Table 10-6 | Flotation Concentrate for SMAL-00001 | 51 |
| Table 10-7 | Flotation Concentrate for SMAL-00009 | 52 |
| Table 10-8 | Final Size Intervals and Grades for Flotation Test Work | 52 |
| Table 10-9 | IRMA Results for the “As Received” Sample | 56 |
| Table 10-10 | Particle Size Analysis for the “As Received” Sample | 57 |
| Table 10-11 | Screen Analysis Results for the “As Received” Sample | 58 |
| Table 10-12 | Characterization Results for Thermally Purified Material | 58 |
| Table 10-13 | Particle Size Analysis Results for Thermally Purified Material | 60 |
| Table 10-14 | Screen Analysis Results for Purified Material | 61 |
| Table 10-15 | Characterization Results for +40 Mesh Purified Material | 61 |
| Table 10-16 | Characterization Results for +50 Mesh Purified Material | 62 |
| Table 10-17 | Characterization Results for +80 Mesh Purified Material | 63 |
| Table 10-18 | Characterization Results for +100 Mesh Purified Graphite Flake | 63 |
| Table 10-19 | Characterization Results for -100 Mesh Purified Material | 63 |
| Table 11-1 | Malacacheta Assay Statistics Inside Mineralized Solid | 67 |
| Table 11-2 | Malacacheta 1 m Composite Statistics | 68 |
| Table 11-3 | Density Values for Graphitic Schist | 69 |
| Table 11-4 | Block Model Parameters for Blocks 1, 2 and 3 | 71 |
| Table 11-5 | Search Ellipse Ranges | 72 |
| Table 11-6 | Comparison of Assays, Composites and Block Model for Malacacheta | 73 |
| Table 11-7 | Malacacheta Open Pit Optimization Cut-Off Parameters | 80 |
| Table 11-8 | Combined Malacacheta Mineral Resource Estimate at 2.0% Graphitic Carbon | 81 |
| Table 22-1 | Combined Malacacheta Mineral Resource Estimate at 2.0% Graphitic Carbon | 93 |
| |
| SGS Geological Services |
| S-K 1300 Technical Report – Malacacheta Graphite Project – Minas Gerais, Brazil | Page 5 |
| 1 | SUMMARY |
SGS was engaged by Atlas Critical Minerals Corporation (Nasdaq: ATCX, “Atlas Critical Minerals”) for the preparation of an independent Technical Report Summary (“TRS”) on tenement 830.954/2021 within the Malacacheta Graphite Project (“the Project”).
This TRS presents the results of the Mineral Resource Estimate (MRE) of the Malacacheta Project including the drilling carried out in 2026 within tenement 830.954/2021 and completed for Atlas Critical Minerals.
The scope of the TRS is to complete a MRE report on tenement 830.954/2021 of the Malacacheta Project.
The Malacacheta Project is located in the northeast region of the Minas Gerais state, Brazil, near the city of Malacacheta, approximately 435 km by road from Belo Horizonte. The property is located approximately 9 km northwest of the city of Malacacheta.
The project is in UTM zone 23S and is located at approximately 804,577 m E and 8,032,489 m N.
Atlas Critical Minerals owns three tenements in the municipality of Malacacheta covering a total of 2,821.66 ha. Atlas Critical Minerals initiated geological reconnaissance of the property in 2023, which included geological mapping and outcrop sampling. In 2025 and 2026, the Company developed ground geophysics, a LiDAR topographic survey, detailed geological mapping and an exploratory drilling campaign with 2,393.90 m drilled in 21 holes on tenement 830.954/2021.
| 1.1 | Introduction |
This TRS was prepared at the request of Atlas Critical Minerals Corporation, with its principal place of business at Rua Antônio de Albuquerque, 156, Suite 1720, Belo Horizonte, Minas Gerais, Brazil, 30112-010.
Atlas Critical Minerals is a diversified critical minerals exploration company with significant mineral rights in rare earths elements (REEs), titanium, natural graphite, uranium, copper, nickel, iron ore, quartzite, and gold in Brazil.
Currently, Atlas Critical Minerals Corporation common stock is trading on the Nasdaq Capital Market under the symbol “ATCX.”
This TRS conforms to the United States Securities and Exchange Commission’s (SEC) Modernized Property Disclosure Requirements for Mining Registrants as described in Subpart 229.1300 of Regulation S-K, Disclosure by Registrants Engaged in Mining Operations (S-K 1300) and Item 601 (b)(96) Technical Report Summary.
| 1.2 | Property Description, Location, Access, and Physiography |
The Malacacheta Project is located in northeast Minas Gerais State, about 435 km by road from Belo Horizonte. The property is located approximately 9 km northwest of the city of Malacacheta.
The climate in the Project area is classified as tropical savanna (Aw) according with the Köppen classification (Köppen, 1936). This climate type is known for having a distinct wet and dry season, while temperatures remain warm to hot year-round.
Malacacheta is predominantly an agricultural centre, with limited availability for basic services.
Analytical and drilling services were contracted in the metropolitan region of Belo Horizonte. Skilled and semi-skilled labor is available in the region to support exploration activities.
| |
| SGS Geological Services |
| S-K 1300 Technical Report – Malacacheta Graphite Project – Minas Gerais, Brazil | Page 6 |
There is limited local infrastructure in proximity to the project. The Irapé Hydroelectric Power Plant is approximately 120km northwest of the property, which could provide power for the project. There is a network of mostly unpaved roads joining the property to local towns.
| 1.3 | History |
The project area has been included in some regional mapping campaigns, but there is no record of historical exploration in the area. However, there is evidence of historical artisanal mining in the form of small galleries excavated in pegmatite outcrops containing occurrences of citrine, alexandrite and large muscovite sheets.
| 1.4 | Geology and Mineralization |
The South American Platform is composed of Archean and Proterozoic metamorphic and igneous complexes, forming the continental core of South America (Almeida, 1984). Its consolidation occurred between the late Proterozoic and early Paleozoic, during the Brasiliano/Pan-African Orogenic Cycle (Trompette, 1994). This platform comprises three main shield areas, represented by cratons and Neoproterozoic fold belts: the Guiana Shield, the Central Brazil Shield, and the Atlantic Shield. The latter includes the São Francisco Craton and its surrounding belts (Almeida, 1984). The Araçuaí Belt borders the São Francisco Craton to the east and is part of the system of mobile belts associated with the amalgamation of the Gondwana supercontinent (Pedrosa-Soares and Wiedmann-Leme, 2000).
The evolution of the Araçuaí Orogen began with the opening of the Macaúbas Basin (~880 Ma) in an advanced continental rift setting, possibly forming a confined oceanic basin with limited development of oceanic crust. During this stage, the Capelinha and Chapada Acauã units were deposited. The closure of the basin led to the collision between the São Francisco and Congo cratons (~580 Ma), causing deformation and metamorphism of the entire Macaúbas Group sequence, including glacial units (Chapada Acauã) and volcano-sedimentary units (Ribeirão da Folha). Following the collision, orogenic collapse occurred, accompanied by the deposition of the Salinas Formation in post-collisional basins (Pedrosa-Soares et al., 2007).
The basement of the Araçuaí Orogen is composed of Archean and Paleoproterozoic complexes such as Guanhães, Gouveia, Porteirinha, Mantiqueira, Juiz de Fora, and Pocrane, all reworked during the Brasiliano orogeny. These complexes include TTG gneisses, migmatites, and granitoids, with isotopic signatures indicating ancient crustal sources. In the western portion of the orogen, the Espinhaço Supergroup crops out, comprising rift-related sequences that were deformed during the Brasiliano event (Noce et al., 2007; Degler et al., 2018).
The Macaúbas Group records the evolution of a Neoproterozoic basin that transitioned from a continental rift to a passive margin, with incipient oceanic crust formation, interpreted from tectonic ophiolites, plagiogranites, and records from the Ribeirão da Folha Formation. It is subdivided into pre-glacial, glacial, and post-glacial successions. The Capelinha Formation (pre-glacial) comprises graphitic metapelites associated with quartzites and amphibolites. The Ribeirão da Folha Formation (post-glacial) includes graphitic schists interlayered with turbidites and calcsilicate rocks in the western portion, and an ophiolitic sequence with graphite in metasedimentary rocks in the eastern portion (Pedrosa-Soares et al., 2007; Castro, 2014; Queiroga et al., 2007).
The mineralization at the Malacacheta project is classified as a flake graphite occurrence.
Flake graphite deposits are formed in regional metamorphic sequences ranging from upper amphibolite to granulite grade, coeval with peak metamorphism, and may also be found in the same districts as vein deposits. Texturally, flake graphite deposits vary from disseminations to high-grade (> 50 wt.%) concentrations in pods or lenses that are typically focused along lithologic contacts and within fold hinges.
| |
| SGS Geological Services |
| S-K 1300 Technical Report – Malacacheta Graphite Project – Minas Gerais, Brazil | Page 7 |
| 1.5 | Exploration |
Initial exploration started in 2023, and Atlas Critical Minerals identified surface outcrops with visible graphite, delineated mineralized bodies, and established a primary structural trend. Five grab samples were collected on the property.
Further exploration was undertaken in 2024, which expanded the understanding of the Malacacheta Project’s mineral potential. Atlas Critical Minerals systematically mapped and described new points, paying close attention to surface exposures. A sampling program was completed, with 12 samples of graphite schist and mica-schist with graphite collected from tenement 830.954/2021.
Atlas Critical Minerals identified significant graphite schist bodies within tenement 830.954/2021, intercalated as lenses within mica schist. Two highly significant occurrences were observed, mapped and sampled on the tenement.
During the 2025 exploration campaign, detailed geological mapping was undertaken on the tenement at a scale of 1:10,000 for outcrops of graphitic schist and 1:25,000 in other parts of the tenement. A total of 505 occurrences of graphite were noted, 41 in-situ graphitic schists, four blocks of graphitic schist, 20 occurrences of micaceous schist with graphite, one micaceous block with graphite and 15 occurrences of graphite within soil samples.
In 2026, Atlas undertook an induced polarization (IP) survey across the most prospective part of tenement 830.954/2021 followed by a diamond drill campaign to validate the results of the geophysical survey.
| 1.6 | Data Verification |
A site visit was conducted by the Qualified Person (QP), Marc-Antoine Laporte, P.Geo., M.Sc., from SGS, on May 11–12, 2026. The main objective of the visit was to familiarize the QP with the project, ongoing exploration methodologies, field conditions, and existing facilities. The visit included detailed discussions and key observations supporting initial project considerations.
| 1.7 | Mineral Resource Estimates |
Mineral resources have been estimated for three blocks of graphitic carbon in the Malacacheta deposit.
Mineral Resources for Malacacheta were estimated using a computerized resource block model. Three-dimensional wireframe solids of the mineralization were defined using drill hole graphitic carbon analytical data.
A 1 m composite length was selected based on the average length of core sampling. Compositing starts at the identified mineralized contact. No capping was applied on the analytical composite data.
The Mineral Resource Estimates (MREs) were calculated using an inverse distance weighting to the second power (ID2) methodology.
The combined Mineral Resource Estimate for Malacacheta is reported in Table 1-1. The Mineral Resource Estimates are constrained by the topography.
Mineral Resources are reported exclusive of Mineral Reserves.
The estimate has an effective date of the 14th September 2026.
| |
| SGS Geological Services |
| S-K 1300 Technical Report – Malacacheta Graphite Project – Minas Gerais, Brazil | Page 8 |
Table 1-1 Combined Malacacheta Mineral Resource Estimate at 2.0% Graphitic Carbon
|
Cut-off Grade Graphitic carbon (%) |
Category | Tonnage (Mt) |
Average Grade Graphitic carbon (%) |
| 2.0 | Indicated | 17.2 | 5.73 |
| 2.0 | Inferred | 7.0 | 5.40 |
Notes to accompany Mineral Resource tables:
| 1. | The effective date of the Malacacheta Mineral Resource Estimate is the September 14, 2026. | |
| 2. | The mineral resource was estimated by Marc-Antoine Laporte, P.Geo. of SGS Geological Services and is an independent Qualified Person as defined in Item 1300 of regulation S-K. | |
| 3. | The classification of the current Mineral Resource Estimate into Indicated and Inferred mineral resources is consistent with the definitions set forth in Item 1300 of Regulation S-K and Subpart 1300 of Regulation S-K. | |
| 4. | Figures are rounded to reflect the relative accuracy of the estimate and numbers may not add due to rounding. | |
| 5. | The mineral resources are presented undiluted and in situ, constrained by continuous 3D wireframe models, and is considered to have reasonable prospects for eventual economic extraction. | |
| 6. | Mineral resources which are not mineral reserves do not have demonstrated economic viability. An Inferred Mineral Resource has a lower level of confidence than that applying to an Indicated Mineral Resource and must not be converted to a Mineral Reserve. It is reasonably expected that most Inferred Mineral Resources could be upgraded to Indicated Mineral Resources with continued exploration. | |
| 7. | The Malacacheta mineral resource estimate is based on a validated database which includes data from surface diamond drilling completed in 2026. | |
| 8. | Grades for graphitic carbon were estimated using 1.0 metre composites. To generate grade within the blocks, the inverse distance squared (ID2) interpolation method was used. The SG of the deposit was classified as either saprolite, transition or fresh rock zones. | |
| 9. | Based on the location, surface exposure, size, shape, general true thickness, and orientation, it is envisioned that the Malacacheta deposit may be mined using open-pit mining methods. In-pit mineral resources are reported at a base case cut-off grade of 2% graphitic carbon (Cg) The in-pit resource grade blocks are quantified above the base case cut-off grade, above the constraining pit shell, below topography and within the constraining mineralized domain (the constraining volume). | |
| 10. | The pit optimization and base-case cut-off grade consider a Cg concentrate price of $1,300/t and considers a Cg recovery of 90%. The pit optimization and base case cut-off grade also considers a mining cost of US$2.60/t mined, pit slope of 60⁰ degrees, and processing, treatment, refining, G&A and transportation cost of USD$18.00/t of mineralized material. | |
| 11. | The results from the pit optimization are used solely for the purpose of testing the “reasonable prospects for economic extraction” by an open pit and do not represent an attempt to estimate mineral reserves. There are no mineral reserves on the Property. The results are used simply as a guide to assist in the preparation of a mineral resource statement and to select an appropriate resource reporting cut-off grade. A pit shell at a revenue factor of 1.00 was selected as the ultimate pit shell for the purposes of the current MRE. | |
| 12. | The estimate of Mineral Resources may be materially affected by environmental, permitting, legal, title, taxation, socio-political, marketing, or other relevant issues. |
| 1.8 | Adjacent Properties |
There is no information on properties adjacent to the Project necessary to make the TRS understandable and not misleading.
| 1.9 | Conclusions and Recommendations |
| 1.9.1 | Conclusions |
SGS Geological Services Inc. (“SGS”) was contracted by Atlas Critical Minerals Corporation (“Atlas Critical Minerals” or the “Company”) to complete a Mineral Resource Estimate (MRE) for tenement 830.954/2021 of the Malacacheta Graphite Project near the city of Teófilo Otoni, Brazil, and to prepare a Public Report in accordance with the §§ 229.601(b)(96) Technical report (subpart 229.1300 of Regulation S-K) written in support of the MRE on the Malacacheta Project.
| |
| SGS Geological Services |
| S-K 1300 Technical Report – Malacacheta Graphite Project – Minas Gerais, Brazil | Page 9 |
This TRS conforms to the United States Securities and Exchange Commission’s (SEC) Modernized Property Disclosure Requirements for Mining Registrants as described in Subpart 229.1300 of Regulation S-K, Disclosure by Registrants Engaged in Mining Operations (S-K 1300) and Item 601 (b)(96) Technical Report Summary.
Initial exploration started in 2023, and Atlas Critical Minerals identified surface outcrops with visible graphite, delineated mineralized bodies, and established a primary structural trend. Rock samples were collected (nine samples) providing strong indications of the project’s potential.
Further exploration was undertaken in 2024, which expanded the understanding of the Malacacheta Project’s mineral potential. Atlas Critical Minerals systematically mapped and described 43 new points, paying close attention to surface exposures and sub-surface features. A comprehensive sampling program was completed, with 17 samples of graphite schist and mica-schist with graphite collected from the two exploration permit areas.
Detailed mapping, topography and surface sampling was conducted in 2025, while an induced polarization (IP) survey and diamond drilling was undertaken in 2026. It was executed 21 drill holes, with a total of 2393,90 m.
| 1.9.2 | Recommendations |
Atlas Critical Minerals identified significant graphite schist bodies within tenement 830.954/2021 and have completed a diamond drill campaign to better define the extents of the graphite mineralization. At this stage, the deposit remains open along strike and at depth.
Given the prospective nature of the Malacacheta Deposit, it is the QP’s opinion that the Project merits further exploration. The QP is recommending Atlas continue further drilling, subject to funding and any other matters which may cause the proposed exploration program to be altered in the normal course of its business activities or alterations which may affect the program as a result of exploration activities themselves. This drilling would extend the limits of the deposit and upgrade the resource classification of the deposit.
The QP further recommends that Atlas undertake a metallurgical study on the graphitic schist to better understand the nature of the mineralization and the potential recoveries of graphitic material from the deposit.
| |
| SGS Geological Services |
| S-K 1300 Technical Report – Malacacheta Graphite Project – Minas Gerais, Brazil | Page 10 |
| 2 | INTRODUCTION |
SGS was engaged by Atlas Critical Minerals Corporation (Nasdaq: ATCX, “Atlas Critical Minerals”) for the preparation of an independent Technical Report Summary (“TRS”) on tenement 830.954/2021 within the Malacacheta Graphite Project (“the Project”).
This TRS presents the results of the Mineral Resource Estimate (MRE) of the Malacacheta Project including the drilling carried out in 2026 within tenement 830.954/2021 and completed for Atlas Critical Minerals.
The scope of the TRS is to complete a MRE report on tenement 830.954/2021 of the Malacacheta Project.
The Malacacheta Project is located in the northeast region of the Minas Gerais state, Brazil, near the city of Malacacheta, approximately 435 km by road from Belo Horizonte. The property is located approximately 9 km northwest of the city of Malacacheta.
The project is in UTM zone 23S and is located at approximately 804,577 m E and 8,032,489 m N.
Atlas Critical Minerals owns three tenements in the municipality of Malacacheta covering a total of 2,821.66 ha. Atlas Critical Minerals initiated geological reconnaissance of the property in 2023, which included geological mapping and outcrop sampling. In 2025 and 2026, the Company developed ground geophysics, a LiDAR topographic survey, detailed geological mapping and an exploratory drilling campaign with 2,393.90 m drilled in 21 holes on tenement 830.954/2021.
| 2.1 | Registrant Information |
This TRS was prepared at the request of Atlas Critical Minerals Corporation, with its principal place of business at Rua Antônio de Albuquerque, 156, Suite 1720, Belo Horizonte, Minas Gerais, Brazil, 30112-010.
Atlas Critical Minerals is a diversified critical minerals exploration company with significant mineral rights in rare earths elements (REEs), titanium, natural graphite, uranium, copper, nickel, iron ore, quartzite, and gold in Brazil.
Currently, Atlas Critical Minerals Corporation common stock is trading on the Nasdaq Capital Market under the symbol “ATCX.”
| 2.2 | Terms of Reference and Purpose |
SGS Geological Services Inc. (“SGS”) was contracted by Atlas Critical Minerals to prepare a Public Report in accordance with the §§ 229.601(b)(96) Technical report (subpart 229.1300 of Regulation S-K) written in support of the MRE on the Malacacheta Project.
This TRS conforms to the United States Securities and Exchange Commission’s (SEC) Modernized Property Disclosure Requirements for Mining Registrants as described in Subpart 229.1300 of Regulation S-K, Disclosure by Registrants Engaged in Mining Operations (S-K 1300) and Item 601 (b)(96) Technical Report Summary.
The purpose of this Technical Report is to support the disclosure of the Exploration Results and the results of an MRE on tenement 830.954/2021 of the Malacacheta Project
| 2.3 | Sources of Information |
SGS was commissioned by Atlas Critical Minerals to prepare this TRS. In preparing this report, SGS relied upon input from Atlas Critical Minerals.
Section 24 includes the reference documents that are part of the sources of information used in the preparation of this TRS.
| |
| SGS Geological Services |
| S-K 1300 Technical Report – Malacacheta Graphite Project – Minas Gerais, Brazil | Page 11 |
SGS is an independent company and is not associate or affiliate of Atlas Critical Minerals or any associated company of Atlas Critical Minerals.
This TRS was prepared by SGS, and communication with Atlas Critical Minerals sources was conducted through the following list of personnel:
| ● | Daniel Barreto – Exploration Manager | |
| ● | Gabriel Sepulveda – Geology Manager | |
| ● | Izadora Amaral - Geologist | |
| ● | Jessica Costa - Geologist | |
| ● | Lucas Roux – Mineral Resource Geologist | |
| ● | Marcos Santos – Senior Geologist |
| 2.4 | Personal Inspection Summary |
A site visit was conducted by the Qualified Person (QP), Marc-Antoine Laporte, P.Geo., M.Sc., from SGS, on May 11–12, 2026. The main objective of the visit was to familiarize the QP with the project, ongoing exploration methodologies, field conditions, and existing facilities. The visit included detailed discussions and key observations supporting initial project considerations.
| 2.5 | Previously Filed Technical Report Summary Report |
Two Property of Merit TRS on the Malacacheta Project dated July 31, 2025 and October 24, 2025 were previously filed.
| 2.6 | Units and Abbreviations |
All units of measurement used in this technical report are International System of Units (SI) or metric, except for Imperial units that are commonly used in industry (e.g., ounces (oz.) and pounds (lb.) for the mass of precious and base metals). All currency is in US dollars, unless otherwise noted. Frequently used abbreviations and acronyms can be found in Table 2-1.
| |
| SGS Geological Services |
| S-K 1300 Technical Report – Malacacheta Graphite Project – Minas Gerais, Brazil | Page 12 |
Table 2-1 List of Abbreviations
| $ | Dollar sign | km2 | Square kilometer |
| % | Percent sign | m | Metres |
| ° | Degree | m2 | Square meters |
| °C | Degree Celsius | m3 | Cubic meters |
| °F | Degree Fahrenheit | masl | Metres above sea level |
| µm | micron | mm | millimeter |
| AA | Atomic absorption | mm2 | square millimeter |
| Au | Gold | mm3 | cubic millimeter |
| Az | Azimuth | Moz | Million troy ounces |
| $CAD | Canadian dollar | MRE | Mineral Resource Estimate |
| cm | centimeter | Mt | Million tonnes |
| cm2 | square centimeter | mtph | Metric Tonnes per Hour |
| cm3 | cubic centimeter | N | North |
| C | Carbon | NAD 83 | North American Datum of 1983 |
| %Cg | Graphite Carbon | Ni | Nickel |
| Co | Cobalt | NQ | Drill core size (4.8 cm in diameter) |
| DDH | Diamond drill hole | OES | Optical emission spectroscopy |
| E | East | ppm | Parts per million |
| ft | Feet | QA | Quality Assurance |
| ft2 | Square feet | QC | Quality Control |
| ft3 | Cubic feet | QP | Qualified Person |
| g | Grams | RC | Reverse circulation drilling |
| GPS | Global Positioning System | RQD | Rock quality description |
| ha | Hectares | SG | Specific Gravity |
| HQ | Drill core size (6.3 cm in diameter) | Ton | Short Ton |
| ICP | Induced coupled plasma | Tonnes or T | Metric tonnes |
| kg | Kilograms | $US | US Dollar |
| km | Kilometers | UTM | Universal Transverse Mercator |
| |
| SGS Geological Services |
| S-K 1300 Technical Report – Malacacheta Graphite Project – Minas Gerais, Brazil | Page 13 |
| 3 | PROPERTY DESCRIPTION |
| 3.1 | Property Description and Location |
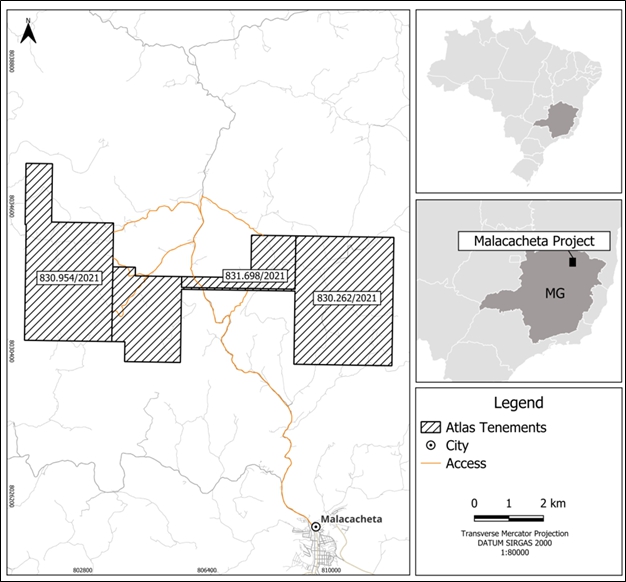
The Project is located in the northeast region of the Minas Gerais state, Brazil, near the city of Malacacheta, approximately 435 km by road from Belo Horizonte. The property is located approximately 9 km northwest of the city of Malacacheta.
The project is in UTM zone 23S and is located at approximately 804,577 m E and 8,032,489 m N.
Figure 3-1 shows the location of the project.
Figure 3-1 Location of the Malacacheta Project
| |
| SGS Geological Services |
| S-K 1300 Technical Report – Malacacheta Graphite Project – Minas Gerais, Brazil | Page 14 |
| 3.2 | Mineral Tenure |
The legal framework for the development and use of mineral resources in Brazil was established by the Brazilian Federal Constitution, which was enacted on October 5, 1988 (the Brazilian Constitution) and the Brazilian mining code, which was enacted on January 29, 1940 (Decree-law 1985/40, later modified by Decree-law 227, of the Brazilian Mining Code).
According to the Brazilian Constitution, all mineral resources in Brazil are the property of the Federal Government. The Brazilian Constitution also guarantees mining companies the full property of the mineral products that are mined under their respective concessions. Mineral rights come under the jurisdiction of the Federal Government and mining legislation is enacted at the Federal level only. To apply for and acquire mineral rights, a company must be incorporated under Brazilian law, have its management domiciled within Brazil, and its head office and administration in Brazil.
In general, there are no restrictions on foreign investment in the Brazilian mining industry, except for mining companies that operate, or hold mineral rights within a 150 km-wide strip of land parallel to the Brazilian terrestrial borders. In this instance the equity interests of such companies have to be majority Brazilian-owned. Exploration and mining activities in the border zone are regulated by the Brazilian Mining Code and supporting legislation.
The Malacacheta project consists of three exploration permits covering an area of 2,821.66 ha. The tenement holdings are summarised in Table 3-1.
This TRS focusses on tenement 830.954/2021.
Table 3-1 Malacacheta Mineral Rights Description
| Tenement | Year Granted | Area (Ha) | Phase |
| 830.262/2021 | 2021 | 1563.43 | Exploration Permit |
| 831.698/2021 | 2021 | 260.95 | Exploration Permit |
| 830.954/2021 | 2021 | 997.28 | Exploration Permit |
| 3.3 | Surface Rights |
Under Brazilian law, foreign companies may acquire surface rights as long as the share capital is controlled by Brazilians. However, the holder of an exploration license is guaranteed by law access to conduct exploration field work, provided that adequate compensation is paid to third-party landowners, and that the holder of the exploration license assumes all environmental responsibilities arising from the exploration work.
After the exploration license is granted by the Brazilian government, Atlas Critical Minerals negotiates and obtains the necessary authorizations for access to the properties for research and exploration activities, with the exercise of mining activity guaranteed by the Brazilian Federal Constitution.
Atlas Critical Minerals is responsible for the reclamation of areas used for drilling, safety of personnel in the work area, monetary compensation to the landowner for surface damage caused by mineral exploration activities, and all environmental liabilities resultant from exploration activities.
| 3.4 | Royalties and Encumbrances |
Atlas Critical Minerals reports that there are no liens and encumbrances associated with the property.
| 3.5 | Reliance on Other Experts |
The QP has not reviewed the mineral tenure, nor independently verified the legal status, ownership of the Project area, underlying property agreements or permits. The QP has fully relied upon, and disclaims responsibility for, information supplied to them by Atlas Critical Minerals.
| |
| SGS Geological Services |
| S-K 1300 Technical Report – Malacacheta Graphite Project – Minas Gerais, Brazil | Page 15 |
| 4 | ACCESSIBILITY, CLIMATE, LOCAL RESOURCES, INFRASTRUCTURE, AND PHYSIOGRAPHY |
| 4.1 | Accessibility |
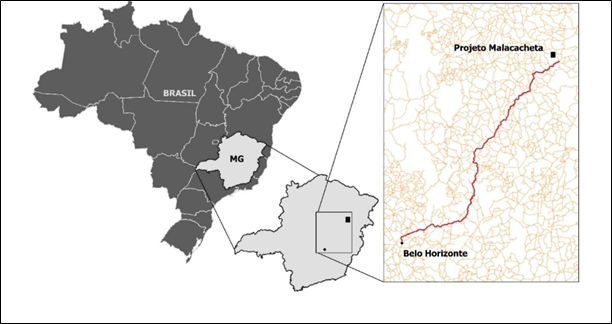
The Malacacheta Project is located in northeast Minas Gerais State, within the Teófilo Otoni microregion and the Vale do Mucuri mesoregion. This Project is situated about 435 km by road from Belo Horizonte and approximately 9 km northwest of the city of Malacacheta. Access to the project area from Malacacheta is primarily via local unpaved roads and secondary access tracks connecting the municipality to surrounding rural properties. The roads conditions may vary seasonally, particularly during periods of increased rainfall.
Figure 4-1 Location and Access to Malacacheta Project from Belo Horizonte
| 4.2 | Climate |
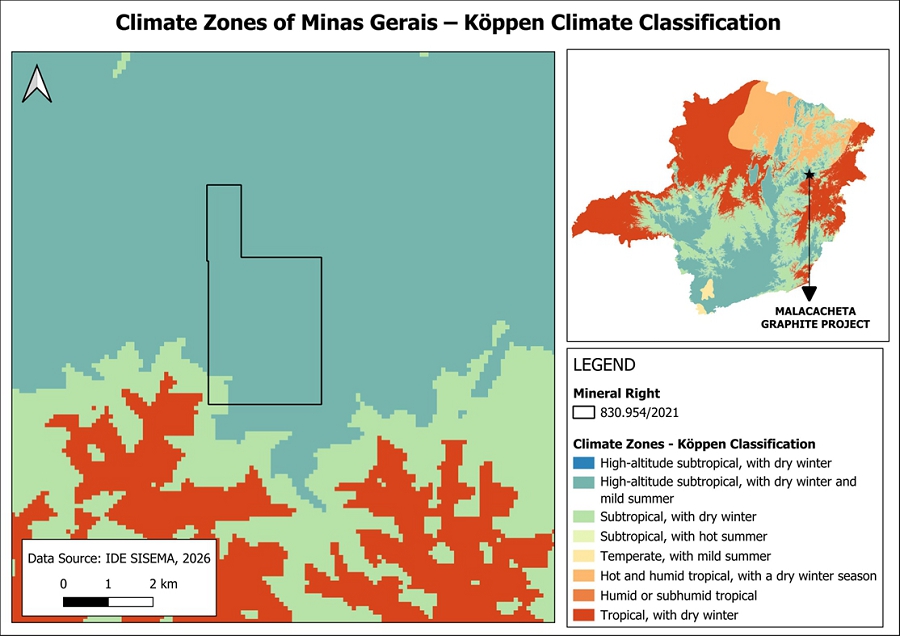
The climate in the Project area is classified as tropical savanna (Aw) according with the Köppen classification (Köppen, 1936).
This climate type is known for having a distinct wet and dry season, while temperatures remain warm to hot year-round. The daily average high ranges from 22.4°C (July) to 27.8°C (February), while the average daily low ranges from 13.5°C (July) to 18.9°C (February).
Malacacheta has a distinct wet and dry season and usually has the most precipitation between November to March, with an average of 11 rainy days and 154.4 mm of precipitation per month. The driest months in Malacacheta are June, July and August. On average, 22.3 mm of precipitation falls during these months. Exploration work can be carried out year-round.
| |
| SGS Geological Services |
| S-K 1300 Technical Report – Malacacheta Graphite Project – Minas Gerais, Brazil | Page 16 |
Figure 4-2 Climate Classification of the Project Area According to Köppen
| 4.3 | Local Resources |
Teófilo Otoni and Malacacheta are the main municipalities supporting the Project. Teófilo Otoni is the main commercial urban center in the region, while Malacacheta is the nearest city to the Project area.
According to the IBGE Demographic Census (2022), Teófilo Otoni has 137,400 inhabitants, while Malacacheta has 17,500 inhabitants.
In Malacacheta, approximately 67.8% of households have access to the general sewerage network, while 69.7% are supplied by the general water distribution network and 55.3% are served by public waste collection services (IBGE, 2022).
Malacacheta is predominantly an agricultural centre, with limited availability for basic services.
Analytical and drilling services were contracted in the metropolitan region of Belo Horizonte. Skilled and semi-skilled labor is available in the region to support exploration activities.
| 4.4 | Infrastructure |
Teófilo Otoni is strategically located along BR-116, an important road that crosses the eastern portion of Minas Gerais State. The road connects the municipality with the main cities of the state. Malacacheta is located approximately 90 km west of Teófilo Otoni.
| |
| SGS Geological Services |
| S-K 1300 Technical Report – Malacacheta Graphite Project – Minas Gerais, Brazil | Page 17 |
The nearest airport with regular commercial flights is Kemil Kumaira Airport (TFL), located in Teófilo Otoni. The airport provides commercial connections to Belo Horizonte/Confins International Airport (CNF).
There is limited local infrastructure in proximity to the project. The Irapé Hydroelectric Power Plant is approximately 120 km northwest of the property, which could provide power for the project. There is a network of mostly unpaved roads joining the property to local towns.
| 4.5 | Physiography |
The property is located within the southern portion of the Jequitinhonha River basin and within the northern portion of Rio Doce basin.
The region is entirely located within the Atlantic Forest biome, with only approximately 19% of the original forest cover remaining. The predominant vegetation physiognomy is Seasonal Semideciduous Forest (Fundação SOS Mata Atlântica; INPE, 2024).
The predominant soils in the project area are dystrophic red-yellow latosols, while eutrophic red yellow argisols occur to a lesser extent, mainly concentrated in the central portion of the area. Both soils types developed under conditions of intense tropical weathering, but differ in terms of fertility, structure and pedogenetic evolution.
From the geomorphological perspective, the project area is located within the Dissected Plateaus of Eastern Minas Gerais Geomorphological Unit, characterized by predominantly undulating to mountainous and strongly dissected terrain, with occurrences of hills, steep-sided valleys, and residual elevations.
| |
| SGS Geological Services |
| S-K 1300 Technical Report – Malacacheta Graphite Project – Minas Gerais, Brazil | Page 18 |
| 5 | HISTORY |
The project area has been included in some regional mapping campaigns, but there is no record of historical exploration in the area. However, there is evidence of historical artisanal mining in the form of small galleries excavated in pegmatite outcrops containing occurrences of citrine, alexandrite and large muscovite sheets.
| 5.1 | Historical Resource Estimates |
There are no historical estimates for the project.
| 5.2 | Past Production |
There is evidence of historical artisanal mining on the property, but there are no official records of production.
| |
| SGS Geological Services |
| S-K 1300 Technical Report – Malacacheta Graphite Project – Minas Gerais, Brazil | Page 19 |
| 6 | GEOLOGICAL SETTING, MINERALIZATION, AND DEPOSIT |
| 6.1 | Regional Geology |
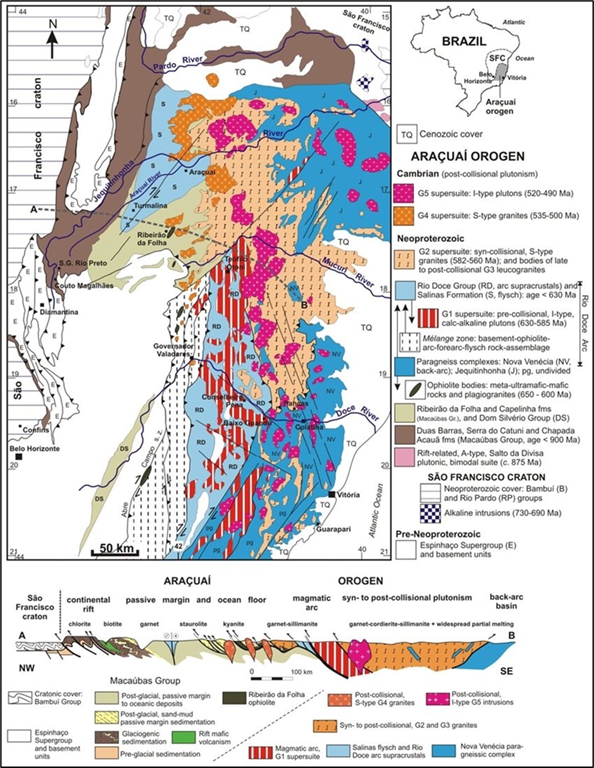
The South American Platform is composed of Archean and Proterozoic metamorphic and igneous complexes, forming the continental core of South America (Almeida, 1984). Its consolidation occurred between the late Proterozoic and early Paleozoic, during the Brasiliano/Pan-African Orogenic Cycle (Trompette, 1994). This platform comprises three main shield areas, represented by cratons and Neoproterozoic fold belts: the Guiana Shield, the Central Brazil Shield, and the Atlantic Shield. The latter includes the São Francisco Craton and its surrounding belts (Almeida, 1984). The Araçuaí Belt borders the São Francisco Craton to the east and is part of the system of mobile belts associated with the amalgamation of the Gondwana supercontinent (Pedrosa-Soares and Wiedmann-Leme, 2000) (Figure 6-1).
The evolution of the Araçuaí Orogen began with the opening of the Macaúbas Basin (~880 Ma) in an advanced continental rift setting, possibly forming a confined oceanic basin with limited development of oceanic crust. During this stage, the Capelinha and Chapada Acauã units were deposited. The closure of the basin led to the collision between the São Francisco and Congo cratons (~580 Ma), causing deformation and metamorphism of the entire Macaúbas Group sequence, including glacial units (Chapada Acauã) and volcano-sedimentary units (Ribeirão da Folha). Following the collision, orogenic collapse occurred, accompanied by the deposition of the Salinas Formation in post-collisional basins (Pedrosa-Soares et al., 2007).
The basement of the Araçuaí Orogen is composed of Archean and Paleoproterozoic complexes such as Guanhães, Gouveia, Porteirinha, Mantiqueira, Juiz de Fora, and Pocrane, all reworked during the Brasiliano orogeny. These complexes include TTG gneisses, migmatites, and granitoids, with isotopic signatures indicating ancient crustal sources. In the western portion of the orogen, the Espinhaço Supergroup crops out, comprising rift-related sequences that were deformed during the Brasiliano event (Noce et al., 2007; Degler et al., 2018).
The Macaúbas Group records the evolution of a Neoproterozoic basin that transitioned from a continental rift to a passive margin, with incipient oceanic crust formation, interpreted from tectonic ophiolites, plagiogranites, and records from the Ribeirão da Folha Formation. It is subdivided into pre-glacial, glacial, and post-glacial successions. The Capelinha Formation (pre-glacial) comprises graphitic metapelites associated with quartzites and amphibolites. The Ribeirão da Folha Formation (post-glacial) includes graphitic schists interlayered with turbidites and calcsilicate rocks in the western portion, and an ophiolitic sequence with graphite in metasedimentary rocks in the eastern portion (Pedrosa-Soares et al., 2007; Castro, 2014; Queiroga et al., 2007).
| |
| SGS Geological Services |
| S-K 1300 Technical Report – Malacacheta Graphite Project – Minas Gerais, Brazil | Page 20 |
Figure 6-1 Geological Map of the Araçuaí Orogen
| |
| SGS Geological Services |
| S-K 1300 Technical Report – Malacacheta Graphite Project – Minas Gerais, Brazil | Page 21 |
| 6.2 | Local Geology |
The project area is located in the central-northern portion of the state of Minas Gerais, where units of the Macaúbas Group predominate—particularly the Capelinha and Ribeirão da Folha formations—which occur as narrow, strongly deformed bands. These units outcrop amidst the gneisses of the Guanhães Group, represented in the region mainly by the Serra Negra Formation, which shows no evidence of graphite mineralization.
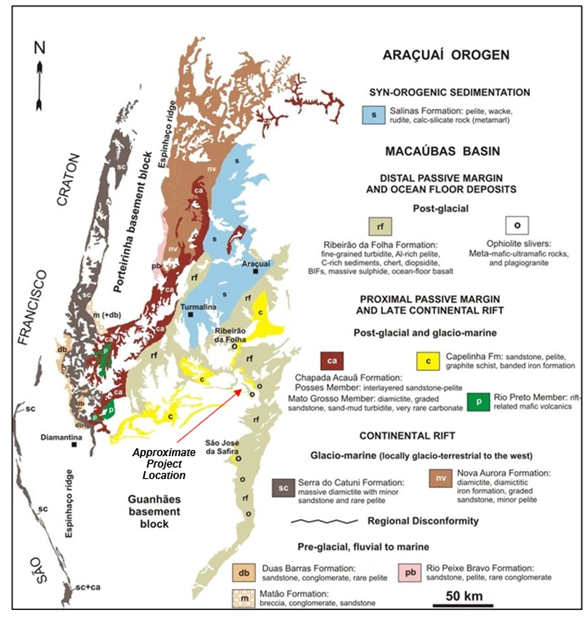
The Capelinha Formation, a pre-glacial unit, is composed of graphitic metapelites, quartzites, and amphibolites. The Ribeirão da Folha Formation, on the other hand, is post-glacial in nature and consists of graphitic schists interlayered with turbidites, calc-silicate rocks, and a well-developed ophiolitic sequence in the eastern portion of the basin (Pedrosa-Soares et al., 2007; Queiroga et al., 2007; Castro, 2014). Metamorphism and deformation resulting from the São Francisco–Congo collision (~580 Ma) facilitated the transformation of these carbon-rich sediments into graphite. Figure 6-2 shows the simplified geology of the Macaúbas Group.
The rocks of the Guanhães Group, consist of banded gneisses interlayered with quartzite and amphibolite. Based on geochronological data from Müller et al. (1986), an Archean age is inferred for the Guanhães rocks, which form the basement to the Neoproterozoic cover of the Macaúbas Group.
The rocks of the Macaúbas Group occur in the northern half of the project area, as well as in narrow bands in the southern portion, and are mainly represented in the area of interest by the Capelinha and Ribeirão da Folha formations, which host the most significant graphite mineralizations. Although other units are part of the Macaúbas Group, these two formations are the most relevant in terms of graphite mineralization (Castro, 2014).
Regional metamorphism in the Araçuaí Belt—particularly affecting the Capelinha and Ribeirão da Folha units—ranges from greenschist to granulite facies, showing a progressive increase in metamorphic grade from NW to SE (Degler et al., 2018; Queiroga et al., 2007). The Capelinha Formation records typical amphibolite facies conditions, while the Ribeirão da Folha Formation presents evidence of medium- to high-grade metamorphism, including the presence of minerals such as sillimanite and garnet, indicating zones near the amphibolite–granulite transition (Castro, 2014).
This entire geological package was later affected by magmatic events associated with the late to post-tectonic granitogenesis of the Araçuaí Orogen, marked by the intrusion of granitoids dated between 560 and 500 Ma. These granites cut across both the basement and the metasedimentary units of the Macaúbas Group, including the Capelinha and Ribeirão da Folha formations, and are associated with the orogenic collapse phase and thermal re-equilibration of the crust (Pedrosa-Soares et al., 2001; Silva et al., 2015).
Recent sedimentary covers of the colluvial-detrital type overlie parts of the Macaúbas Group units in the northern and northwestern portions of the project area. The Malacacheta region and its surroundings—particularly toward Teófilo Otoni—are known for a wide variety of mineral resources. In addition to graphite deposits, notable occurrences include gemstones such as alexandrite, citrine, aquamarine, beryl, tourmaline, quartz, and mica (Bizzi et al.,, 2003; Ferreira et al., 2016).
| |
| SGS Geological Services |
| S-K 1300 Technical Report – Malacacheta Graphite Project – Minas Gerais, Brazil | Page 22 |
Figure 6-2 Simplified Geology of the Macaúbas Group (Pedrosa-Soares et al., 2007)
| 6.3 | Property Geology |
The main geological units mapped at the property are correlated to the gneisses from the Guanhães Group basement and metasedimentary rocks correlated to the Macaúbas group. The contact between the Guanhães and Macaúbas Groups is strongly deformed, with the development of mylonitic zones indicating intense shearing. The regional structural framework is characterized by E-W-trending isoclinal folds, with shear zones and predominantly dextral movement, oriented NW-SE (Pedrosa-Soares and Wiedemann-Leonardos, 2000).
| |
| SGS Geological Services |
| S-K 1300 Technical Report – Malacacheta Graphite Project – Minas Gerais, Brazil | Page 23 |
The gneisses have a mineralogical composition dominated by alkali feldspar, quartz, muscovite, and biotite, forming typical associations of regional metamorphic terrains. A well-developed compositional gneissic banding is observed, characterized by an alternation between leucocratic layers, made up of alkali feldspar + quartz + muscovite, and melanocratic layers enriched in biotite. This banding is interpreted as a primary inheritance from sedimentary deposition, resulting from sedimentation in different environments and compositional variations of the protoliths, reflecting changes in the physical-chemical conditions of the depositional environment. This unit is correlated with the gneisses of the basement of the Guanhães complex.
The quartzites occur as lenses with a more pronounced and continuous shape, essentially made up of quartz, with local presence of micas and feldspars. They correspond to metamorphosed siliciclastic sedimentary protoliths, whose lenticular organization and structural alignment reflect strong tectonic control. The preferential alignment of these bodies in the E–W direction, following the regional deformation, highlights the area’s structural control, where different metamorphic lithotypes are organized in elongated lenses parallel to the regional foliation.
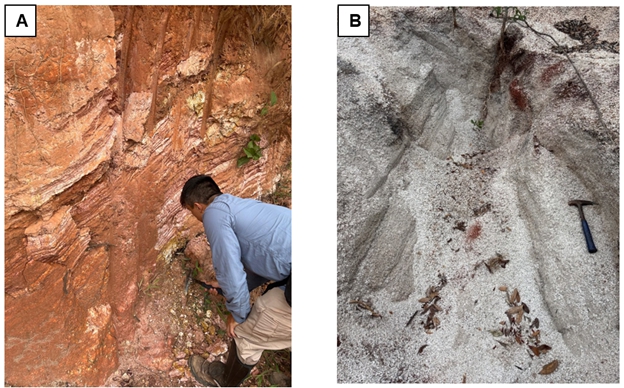
Figure 6-3 shows examples of outcrops of gneiss of the Guanhães Complex and quartzite of the Macaúbas Group.
Figure 6-3 A) Gneisses of Guanhães Complex. B) Quartzites of Macaúbas Group
Amphibolites occur in a limited way in the southwestern part of the area and are mainly made up of amphibole, with subordinate biotite. Their compositional signature and geological context suggest mantle-derived magmatism, possibly related to the formation of oceanic crust. These lithotypes were later subjected to regional metamorphism under amphibolite facies conditions during orogenic events that led to their incorporation into crustal gneiss-metamorphic complexes.
Associated with this framework are sequences of mica schists and graphite schists, which are weathered and generally found in complex shear zones, correlating with the Ribeirão da Folha formation. The mica schists have varied coloration, ranging from grayish, reddish, to yellowish, show moderate to high degrees of weathering, and are mainly composed of muscovite, biotite, and quartz, with subordinate amounts of sillimanite, sericite, and garnet, with varying percentages of these minerals. The schists are foliated, and the minerals follow this foliation. This mineral alignment is especially evident in the micas and sillimanite present in these rocks. This mineral assemblage indicates regional metamorphic conditions of medium to high grade, consistent with the upper amphibolite to lower granulite facies.
| |
| SGS Geological Services |
| S-K 1300 Technical Report – Malacacheta Graphite Project – Minas Gerais, Brazil | Page 24 |
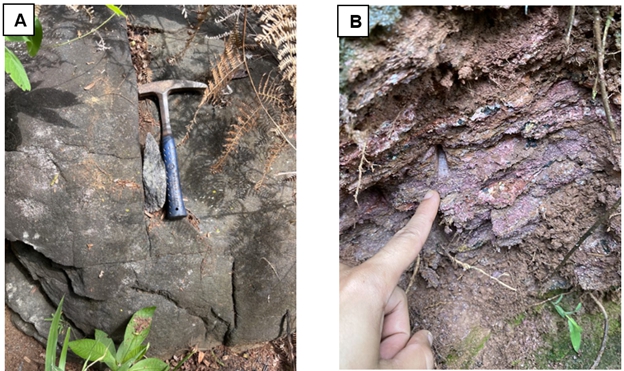
Figure 6-4 shows outcrops of amphibolite and mica schist of the Macaúbas Group.
Figure 6-4 A) Amphibolite of Macaúbas Group. B) Mica Schists of Macaúbas Group
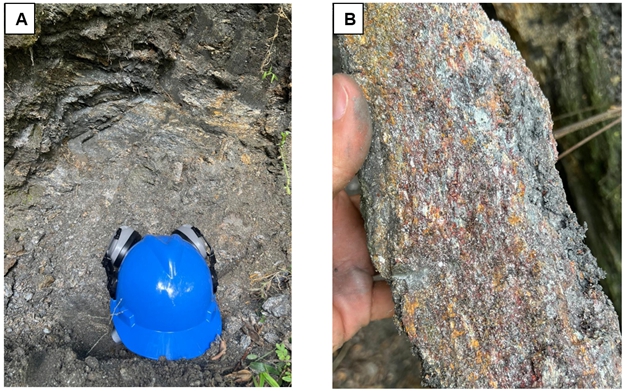
The graphite schists described in the area have lithological, mineralogical, metamorphic, and structural characteristics similar to mica schists, usually differing only in the amount of graphite present in the rock. Graphite schist has a dark gray color due to the graphite, a fine to medium grain size, and typically contains muscovite, biotite, quartz, and sometimes garnet and sillimanite as characteristic paragenesis.
The mapped graphite bodies are arranged along the preferred E-W direction, with an inferred lateral continuity of about 2.5 km. They have lens-shaped, elongated forms and are strongly controlled by regional structures. The occurrence of deformations with a main E–W trend, associated with regional lineaments, shear zones, and thrust faults, indicates strong compressive tectonic control, responsible for the folding, thickening, and structural reconfiguration of these graphite bodies. These structural processes are interpreted as the main factors for the concentration, continuity, and thickening of the mineralized zones.
| |
| SGS Geological Services |
| S-K 1300 Technical Report – Malacacheta Graphite Project – Minas Gerais, Brazil | Page 25 |
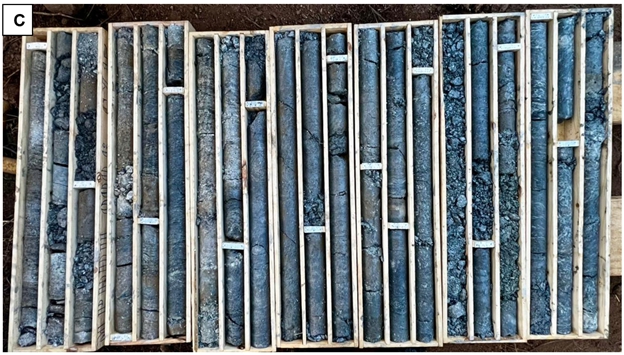
Figure 6-5 shows examples of graphitic schist outcrop, hand specimen and in drill core.
Figure 6-5 A) Graphite Schist outcrop. B) Graphite Schist Sample in Detail. C) Drill Core Samples of Graphite Schists from Tenement 830.954/2021
| |
| SGS Geological Services |
| S-K 1300 Technical Report – Malacacheta Graphite Project – Minas Gerais, Brazil | Page 26 |
| 6.4 | Structural Geology |
Structural data suggested at least two deformation phases at the area, with the first defined by a prominent E-W trend representing the main foliation, and the second represented by a NW-SE-directed reverse fault with tectonic transport to the SW.
The first deformation phase possibly occurred under a ductile regime with N-S compressive stresses. This event impressed on the schists and gneisses the main E-W foliation, dipping 20°-30° to the north. This main foliation is consistent with the possible past compositional banding.
The second phase is interpreted by compressive efforts in a general NE-SW direction, which is regionally marked by the reverse fault that places the Macaúbas Group schists over the sequence Guanhães block. Supporting the interpretation of this event are the gentle folds with a WNW-SSE axis and an NNW dip. This pattern is clearly observed in the graphite schist bodies, especially in the central region of the area.
The presence of sillimanite, garnet, and the graphite mineralization itself support the interpretation of a metamorphic environment ranging from upper amphibolite to lower granulite facies.
| |
| SGS Geological Services |
| S-K 1300 Technical Report – Malacacheta Graphite Project – Minas Gerais, Brazil | Page 27 |
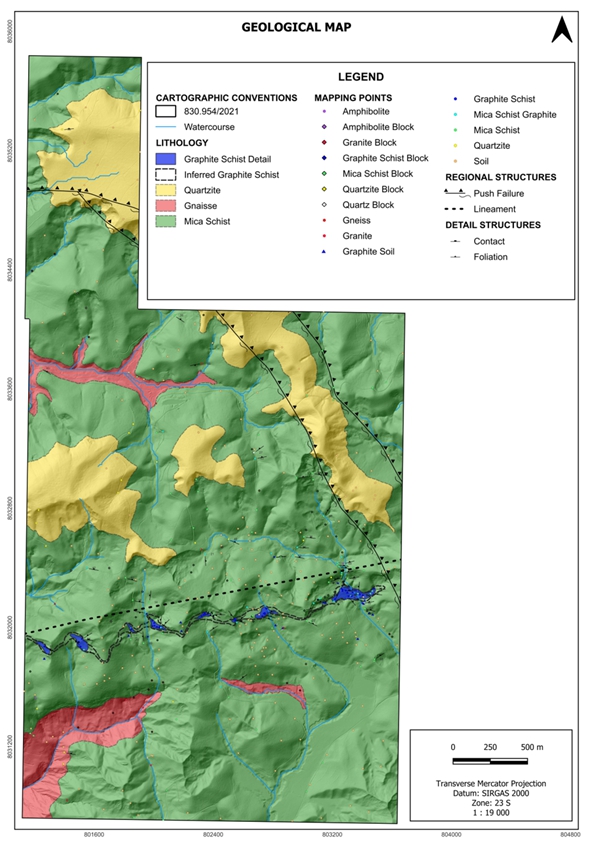
Figure 6-6 Geological Map
| |
| SGS Geological Services |
| S-K 1300 Technical Report – Malacacheta Graphite Project – Minas Gerais, Brazil | Page 28 |
| 6.5 | Deposit Type |
The Malacacheta Project deposit type is defined as Metamorphic type. It is formed by the concentration and crystallization of carbon during regional metamorphic processes. It develops in sedimentary rocks containing anomalously high carbon concentrations, resulting in layers or lenses rich in disseminated graphite crystals in phyllite, schist, quartzite, marble, gneiss, and/or granulite. The deposit originates during regional metamorphism, ranging from the greenschist-amphibolite facies transition (around 480°C) to granulite facies (>800°C).
Graphite occurs as fine-grained and/or microcrystalline (“dust”) in low-grade metamorphic rocks (e.g., phyllite). The formation of lamellar (flake) graphite occurs from the intermediate amphibolite facies (around 650°C). The main known flake graphite deposits are in Sonora, Mexico, and in the Bahia-Minas Graphite Province (Salto da Divisa mine).
| |
| SGS Geological Services |
| S-K 1300 Technical Report – Malacacheta Graphite Project – Minas Gerais, Brazil | Page 29 |
| 7 | EXPLORATION |
Exploration efforts started in 2023 at tenement 830.954/2021. The Company developed an initial geological reconnaissance in which identified surface outcrops with visible graphite, delineated mineralized bodies, and established a primary structural trend. Five grab samples were collected and assayed on the property.
Further exploration was undertaken in 2024. The Company developed a geological mapping, and a next round of sampling program was completed, with 12 samples of graphite schist and mica-schist with graphite.
During the 2025 and 2026 exploration campaign, detailed geological mapping was undertaken on the tenement at a scale of 1:10,000 for outcrops of graphitic schist and 1:25,000 in other parts of the tenement. A total of 505 occurrences of graphite were noted, 41 in-situ graphitic schists, four blocks of graphitic schist, 20 occurrences of micaceous schist with graphite, one micaceous block with graphite and 15 occurrences of graphite within soil samples.
Over the course of the exploration campaigns, the geology team carried out the following activities:
| ● | Compilation of public data: GIS database containing mainly lithologies, geophysics, public mapping data. | |
| ● | Geological reconnaissance and mapping with identification of main lithological assemblage, and graphite schist sampling for assay. | |
| ● | Light Definition and Ranging (LiDAR) topographic survey across the entire tenement. | |
| ● | Ground geophysical survey of Induced Polarization and Resistivity. |
| 7.1 | Compilation of Public Data |
Information from regional geology and aerial geophysical were gathered from Brazilian Geological Survey (CPRM) website. The available geological mapping is on scale of 1: 500.000.
| 7.2 | Geological Reconnaissance and Mapping |
Geological mapping surveys were undertaken and included interpretation of structural features and spectral patterns of multi-source data (SRTM, ASTER GDEM, Landsat 7 ETM plus aero geophysical data, etc.), allowing for better understanding and definition of the existing lithotypes.
Collected data was compiled with a preliminary, simplified regional geological map identifying important occurrences of graphite schists (outcrops and/or floats) that aided future definition and location of subsequent research work.
In 2025, Atlas undertook a detailed mapping campaign across the property. Areas with identified graphitic outcrops were mapped at a scale of 1:10,000, while other areas were mapped at 1:25,000. The work included systematic walks, description of outcrops, structural measurements, photographic records, georeferencing and sampling of lithotypes with the presence of graphite. A total of 492 points were mapped where, of the main lithologies with the presence of graphite, 60 points were in-situ graphite schists.
| 7.3 | Grab Sampling and Geochemistry |
During the mapping, 65 samples were collected for geochemistry, 34 of graphite-schist, 13 of mica-schist with graphite and four of graphitic soil. All samples were sent to the SGS Geosol laboratory in Vespasiano, Minas Gerais.
| |
| SGS Geological Services |
| S-K 1300 Technical Report – Malacacheta Graphite Project – Minas Gerais, Brazil | Page 30 |
Select samples were analyzed by x-ray fluorescence (SGS XRF79C), loss on ignition (SGS PHY01E / sample calcination at 1000 °C) and graphitic carbon (SGS CSA5V). All samples were analyzed only for graphitic carbon.
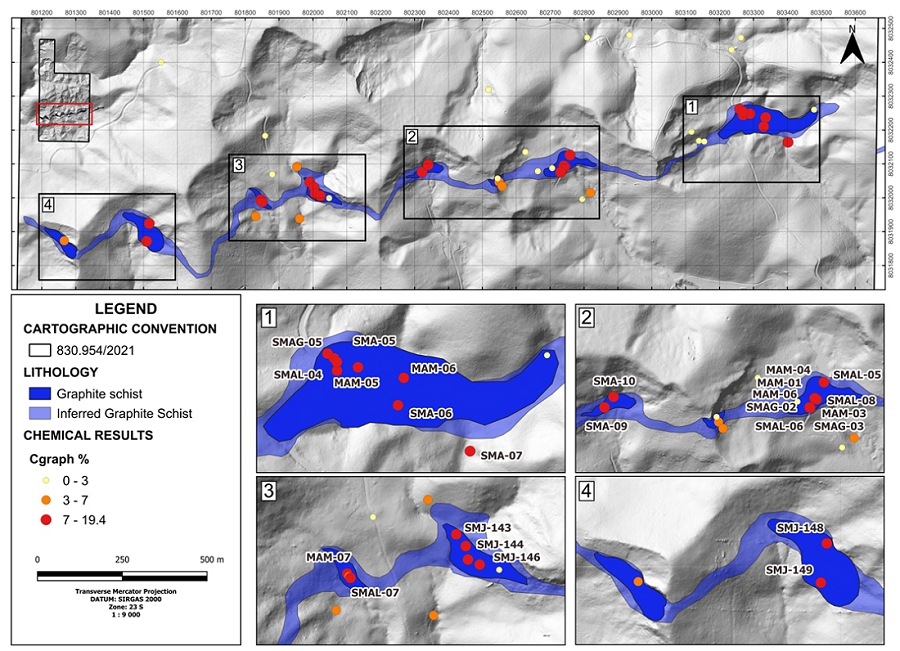
From the 34 graphite-schists analyzed, 22 samples presented contents higher than 7.0% of graphitic carbon (Cg), with maximum values reaching 19.41% Cg.
Table 7-1 shows the results from the 22 high-grade samples, while Figure 7-1 shows the location of the samples.
Table 7-1 Results of High-Grade Outcrop Sampling
| Point Identification |
Sample Identification |
Graphitic Carbon (%) |
Lithology |
| PMJ-00861 | SMJ-000146 | 19.41 | Graphite-schist |
| PMAM-00007 | MAM-07 | 13.76 | Graphite-schist |
| PMAL-00007 | SMAL-00007 | 13.37 | Graphite-schist |
| GMA-00091 | SMA-000009 | 13.22 | Graphite-schist |
| PMJ-00858 | SMJ-000144 | 12.87 | Graphite-schist |
| GMA-00036 | SMA-000005 | 12.84 | Graphite-schist |
| GMA-00039 | SMA-000006 | 12.76 | Graphite-schist |
| PMAL-00006 | SMAL-00006 | 12.23 | Graphite-schist |
| GMA-00046 | SMA-000007 | 12.21 | Graphite-schist |
| PMAG-00002 | SMAG000002 | 12.06 | Graphite-schist |
| PMAL-00005 | SMAL-00005 | 11.46 | Graphite-schist |
| PMAG-00010 | SMAG000005 | 11.43 | Graphite-schist |
| PMAL-00008 | SMAL-00008 | 11.31 | Graphite-schist |
| PMAL-00004 | SMAL-00004 | 11.05 | Graphite-schist |
| PMJ-00857 | SMJ-000143 | 10.98 | Graphite-schist |
| GMA-00094 | SMA-000010 | 10.75 | Graphite-schist |
| PMAM-00003 | MAM-03 | 10.29 | Graphite-schist |
| PMAM-00004 | MAM-04 | 9.10 | Graphite-schist |
| PMAG-00003 | SMAG000003 | 9.04 | Graphite-schist |
| PMAM-00006 | MAM-06 | 8.66 | Graphite-schist |
| PMAM-00001 | MAM-01 | 8.35 | Graphite-schist |
| PMAM-00005 | MAM-05 | 7.46 | Graphite-schist |
| |
| SGS Geological Services |
| S-K 1300 Technical Report – Malacacheta Graphite Project – Minas Gerais, Brazil | Page 31 |
Figure 7-1 Location of Surface Samples
| 7.4 | Topographic Survey (LiDAR) |
The survey was conducted using a combination of three methodologies in order to provide greater reliability to the topography of the area. Conventional surveying was used with GNSS RTK (Real Time Kinematic) receivers, aerial photogrammetry using an RGB (Red, Green, and Blue) camera mounted on an RPA (Remotely Piloted Aircraft), and LiDAR technology with a laser scanner also mounted on an RPA.
The projected planimetric information is in the Universal Transverse Mercator (UTM) projection Zone 23S, using the SIRGAS 2000 horizontal DATUM as a reference and its altimetry referenced in the Brazilian geoidal model hgeoHNOR2020.
As a result, point clouds were generated for building digital elevation models, contour lines, and an orthomosaic of the area with an accuracy of 5 cm
| 7.5 | Geophysics |
Ground Geophysics
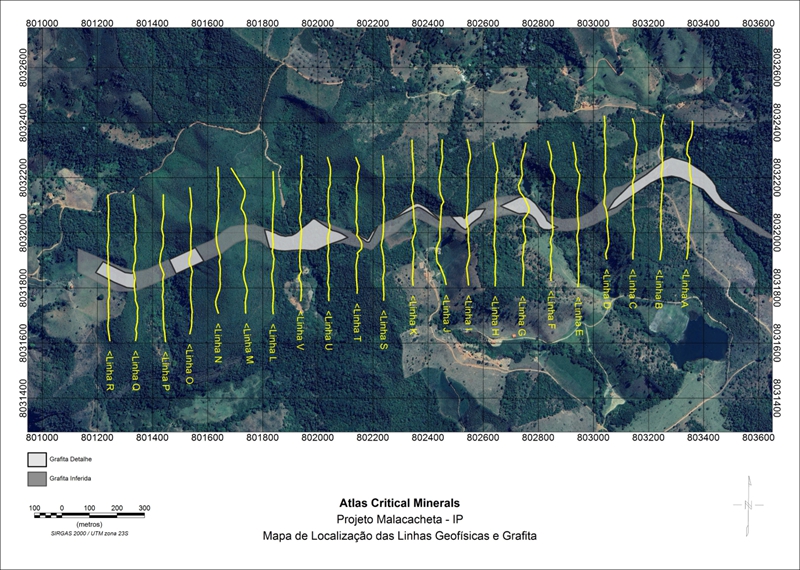
Atlas undertook a detailed time-domain induced polarization (IP) survey between January and February 2026, covering a targeted portion of tenement 830.954/2021 (Figure 7-2).
The geophysical signatures of graphite deposits vary as a function of crystal size, purity, and the geological structuring of the mineralized body. In general, graphite exhibits low electrical resistivity and high chargeability relative to the host lithologies, resulting in a strong geophysical contrast between the ore mineral, of conductive behavior, and the host schist, of resistive behavior. This contrast makes the induced polarization method, responsible for simultaneously measuring chargeability and resistivity, particularly well-suited for investigating graphitic mineralization in the local geological context.
| |
| SGS Geological Services |
| S-K 1300 Technical Report – Malacacheta Graphite Project – Minas Gerais, Brazil | Page 32 |
A total of 22 lines of IP, oriented from south to north were completed. Each line was 500 m in length, for a total 11-line kilometres of survey.
Figure 7-2 Malacacheta IP Grid Lines
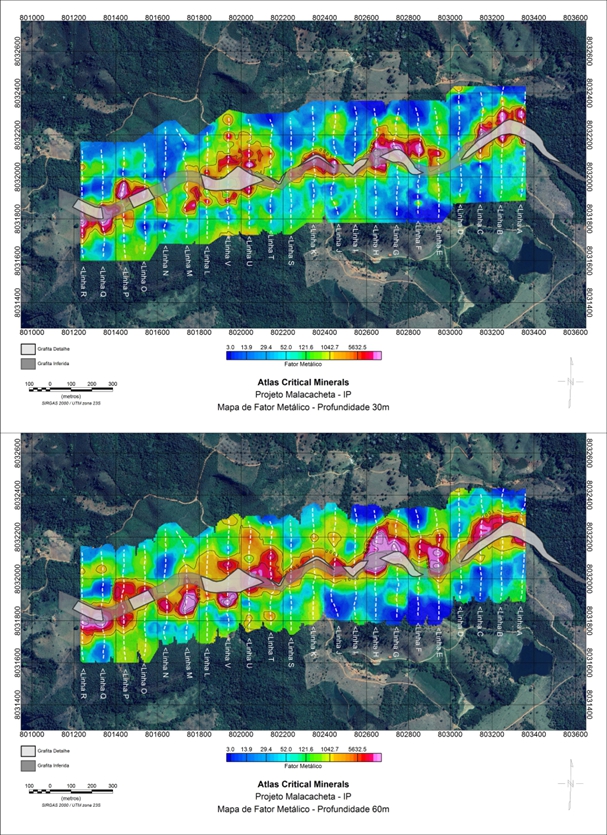
For each line, three sections were generated: resistivity, chargeability, and metal factor (the metal factor is used to highlight high-chargeability anomalies associated with low resistivity, a pattern typically found in graphitic zones).
Several anomalies occur with prominent extensions along the sections, with thicknesses ranging from 50 to 200 metres and depths variations up to 70 metres. Low resistivity values around 200 ohm.m combined with high chargeability values around 30 mV/V representing a geoelectrical signature consistent with high-quality flakes hosted in graphitic schists.
While the chargeability sections become noisy below 40 m due to a decreased signal-to-noise ratio at depth, the calculated Metal Factor and true resistivity models provided robust, continuous mapping of the ore zone down to the 100 m investigation limit.
Chargeability anomalies showed high values down to approximately 40 m, while the thickest and most intense low-resistivity cores were concentrated within the 60–70 m depth interval.
| |
| SGS Geological Services |
| S-K 1300 Technical Report – Malacacheta Graphite Project – Minas Gerais, Brazil | Page 33 |
Figure 7-3 shows the metal factors for 30 metres and 60 metres depth.
Figure 7-3 Metal Factor Map at 30 m and 60 m Depth
| |
| SGS Geological Services |
| S-K 1300 Technical Report – Malacacheta Graphite Project – Minas Gerais, Brazil | Page 34 |
| 7.6 | Drilling |
| 7.6.1 | Introduction |
Diamond core drilling within mineral asset 830.954/2021 was conducted in 2026, with a total of 2,393.90 meters drilled. The drilling program were designed based on mapping, chargeability (IP) and resistivity survey results, aiming to test the targets of high chargeability and low resistivity anomalies, which is generally the signature for graphite mineralization. An initial 50x100m drilling grid was designed, with variations.
| 7.6.2 | Drill Methods |
The drilling was carried out by the contractor Geosol Sondagens with field management provided by Atlas team. The contractor used two portable modular rotary rigs, manually transportable. All cores were HQ (77.8 mm) in diameter. Azimuth was set at 180° and the dip at -60°. The positioning of the drill holes in relation to the azimuth and dip was done using a geologist’s compass, at a declination of by 23°.
| 7.6.3 | Collar Surveys |
The collars were initially set in the field with a handheld GPS, and once the hole was finished, the coordinates were collected using an RTK GPS with an accuracy of 20cm. Table 7-2 shows the collar locations of the completed drillholes.
Table 7-2 Collar Co-Ordinates of Completed Drillholes
| Hole | Easting (m) | Northing (m) | RL (m) | Final Depth (m) | Azimuth (°) | Dip (°) |
| MPDDH-0001 | 802730.02 | 8032098.04 | 984.40 | 69.73 | 180 | -60 |
| MPDDH-0002 | 802722.78 | 8032157.18 | 981.22 | 99.94 | 180 | -60 |
| MPDDH-0003 | 802620.97 | 8032100.33 | 1000.54 | 87.85 | 180 | -60 |
| MPDDH-0004 | 802853.14 | 8032158.59 | 1007.85 | 107.42 | 180 | -60 |
| MPDDH-0005 | 803142.28 | 8032203.93 | 984.16 | 109.16 | 180 | -60 |
| MPDDH-0006 | 802023.52 | 8032120.55 | 1020.63 | 140.78 | 180 | -60 |
| MPDDH-0007 | 803258.16 | 8032321.63 | 929.26 | 96.49 | 180 | -60 |
| MPDDH-0008 | 801838.96 | 8032001.11 | 986.07 | 103.61 | 180 | -60 |
| MPDDH-0009 | 803251.76 | 8032270.15 | 935.49 | 89.56 | 180 | -60 |
| MPDDH-0010 | 801938.76 | 8032119.37 | 985.82 | 141.04 | 180 | -60 |
| MPDDH-0011 | 803329.03 | 8032247.87 | 913.63 | 101.62 | 180 | -60 |
| MPDDH-0012 | 803139.65 | 8032271.12 | 966.94 | 116.67 | 180 | -60 |
| MPDDH-0013 | 801930.27 | 8032057.67 | 990.08 | 118.21 | 180 | -60 |
| MPDDH-0014 | 801841.74 | 8032125.61 | 1006.46 | 173.82 | 180 | -60 |
| MPDDH-0015 | 801739.33 | 8032000.32 | 1028.73 | 120.26 | 180 | -60 |
| MPDDH-0016 | 802119.40 | 8032155.92 | 1019.17 | 150.03 | 180 | -60 |
| MPDDH-0017 | 802114.82 | 8032087.48 | 1022.07 | 139.45 | 180 | -60 |
| MPDDH-0018 | 802024.33 | 8032057.12 | 982.45 | 78.01 | 180 | -60 |
| MPDDH-0019 | 802352.05 | 8032088.70 | 1006.40 | 84.08 | 180 | -60 |
| MPDDH-0020 | 803009.52 | 8032175.59 | 1052.31 | 148.25 | 180 | -60 |
| MPDDH-0021 | 801336.68 | 8031921.88 | 1031.51 | 117.92 | 180 | -60 |
| |
| SGS Geological Services |
| S-K 1300 Technical Report – Malacacheta Graphite Project – Minas Gerais, Brazil | Page 35 |
| 7.6.4 | Downhole Surveys |
All the holes had downhole surveys completed, using a north-seeking gyroscopic survey tool.
| 7.6.5 | Significant Drill Results |
Table 7-3 shows the significant drill results from the 2026 drilling campaign.
Table 7-3 2026 Malacacheta Significant Assays
| Drill Hole | From | To | Metres | Cg % |
| MPDDH-0001 | 6.58 | 17.70 | 11.12 | 5.58 |
| MPDDH-0002 | 10.50 | 21.50 | 11.00 | 8.03 |
| 36.50 | 46.53 | 10.03 | 6.83 | |
| MPDDH-0003 | 10.00 | 22.42 | 12.42 | 4.30 |
| 37.00 | 43.60 | 6.60 | 6.31 | |
| MPDDH-0004 | 22.25 | 38.45 | 16.20 | 5.97 |
| 43.55 | 58.70 | 15.15 | 6.16 | |
| MPDDH-0005 | 21.00 | 35.75 | 14.75 | 6.00 |
| 52.70 | 64.20 | 11.50 | 5.00 | |
| 88.00 | 95.00 | 7.00 | 3.59 | |
| MPDDH-0006 | 8.24 | 17.00 | 8.76 | 5.31 |
| 21.50 | 28.95 | 7.45 | 7.11 | |
| 49.50 | 68.86 | 19.36 | 6.09 | |
| 81.00 | 87.00 | 6.00 | 9.55 | |
| 91.00 | 106.00 | 15.00 | 5.50 | |
| 119.74 | 124.50 | 4.76 | 4.23 | |
| 126.00 | 130.00 | 4.00 | 4.14 | |
| MPDDH-0007 | 26.91 | 39.00 | 12.09 | 4.48 |
| 55.75 | 78.41 | 22.66 | 8.27 | |
| 87.00 | 90.00 | 3.00 | 8.68 | |
| MPDDH-0008 | 4.35 | 17.00 | 12.65 | 5.10 |
| 26.24 | 66.00 | 39.76 | 5.62 | |
| MPDDH-0009 | 23.22 | 57.00 | 33.78 | 7.97 |
| 66.75 | 69.94 | 3.19 | 5.72 | |
| 71.95 | 79.15 | 7.20 | 3.17 | |
| MPDDH-0010 | 8.80 | 33.05 | 24.25 | 6.61 |
| 61.80 | 74.88 | 13.08 | 6.45 | |
| 84.70 | 101.60 | 16.90 | 7.29 | |
| 108.40 | 112.65 | 4.25 | 8.28 | |
| 116.05 | 124.65 | 8.60 | 6.63 | |
| MPDDH-0011 | 0.00 | 14.20 | 14.20 | 9.30 |
| 24.30 | 27.90 | 3.60 | 8.79 | |
| 34.50 | 38.95 | 4.45 | 4.61 | |
| 42.05 | 48.00 | 5.95 | 3.40 | |
| 70.60 | 77.55 | 6.95 | 3.92 |
| |
| SGS Geological Services |
| S-K 1300 Technical Report – Malacacheta Graphite Project – Minas Gerais, Brazil | Page 36 |
| Drill Hole | From | To | Metres | Cg % |
| MPDDH-0012 | 16.50 | 34.20 | 17.70 | 5.15 |
| 43.00 | 86.10 | 43.10 | 6.20 | |
| 91.10 | 104.00 | 12.90 | 6.13 | |
| MPDDH-0013 | 5.85 | 10.50 | 4.65 | 2.31 |
| 28.27 | 38.40 | 10.13 | 5.73 | |
| 48.50 | 65.72 | 17.22 | 7.88 | |
| 78.10 | 88.80 | 10.70 | 5.71 | |
| 113.00 | 116.50 | 3.50 | 2.21 | |
| MPDDH-0014 | 77.20 | 91.00 | 13.80 | 5.04 |
| 102.50 | 111.60 | 9.10 | 5.69 | |
| 117.33 | 138.00 | 20.67 | 8.26 | |
| 146.60 | 157.00 | 10.40 | 8.92 | |
| 159.65 | 173.00 | 13.35 | 6.32 | |
| MPDDH-0015 | 50.00 | 61.00 | 11.00 | 5.24 |
| 71.55 | 81.30 | 9.75 | 8.83 | |
| 103.85 | 111.90 | 8.05 | 7.22 | |
| MPDDH-0016 | 35.12 | 41.55 | 6.43 | 4.59 |
| 58.65 | 78.23 | 19.58 | 6.05 | |
| 85.20 | 102.95 | 17.75 | 7.29 | |
| 126.99 | 134.40 | 7.41 | 2.30 | |
| MPDDH-0017 | 1.00 | 7.95 | 6.95 | 4.82 |
| 22.70 | 32.08 | 9.38 | 7.08 | |
| 32.58 | 39.30 | 6.72 | 4.26 | |
| 44.70 | 62.00 | 17.30 | 10.62 | |
| 85.45 | 90.30 | 4.85 | 3.06 | |
| 102.20 | 107.90 | 5.70 | 4.19 | |
| MPDDH-0018 | 8.50 | 34.70 | 26.20 | 7.51 |
| 39.85 | 42.30 | 2.45 | 7.32 | |
| 45.15 | 49.00 | 3.85 | 6.97 | |
| 51.93 | 57.75 | 5.82 | 5.52 | |
| MPDDH-0019 | 3.00 | 14.85 | 11.85 | 4.86 |
| 24.35 | 26.15 | 1.80 | 6.14 | |
| 31.30 | 52.00 | 20.70 | 6.01 | |
| MPDDH-0020 | 33.64 | 36.30 | 2.66 | 2.05 |
| 55.80 | 69.65 | 13.85 | 3.13 | |
| 76.45 | 80.00 | 3.55 | 4.89 | |
| 84.70 | 95.80 | 11.10 | 5.21 | |
| 126.00 | 128.00 | 2.00 | 2.33 | |
| MPDDH-0021 | 60.76 | 63.00 | 2.24 | 6.84 |
| 66.53 | 69.00 | 2.47 | 7.74 | |
| 80.90 | 89.20 | 8.30 | 8.84 | |
| 99.20 | 102.87 | 3.67 | 7.75 |
| |
| SGS Geological Services |
| S-K 1300 Technical Report – Malacacheta Graphite Project – Minas Gerais, Brazil | Page 37 |
| 8 | SAMPLE PREPARATION, ANALYSES, AND SECURITY |
Samples from the drilling campaign were shipped mostly in a weekly basis from the company shed in Malacacheta – MG directly to SGS Geosol laboratories in Vespasiano – MG by private freight to be prepared and analyzed.
| 8.1 | Core Sampling |
General information such as hole ID, start and end dates, coordinates, final depth, azimuth, inclination, and core diameter are recorded on the logging forms. The drill holes were logged by Atlas trained geologists providing a lithologic description, indicating graphite flakes presence, collecting structural data (when possible), textural and weathering characteristics of the core samples.
The geological description and classification of different lithotypes, structures, mineralogical associations, weathering alteration and mineralization are noted and recorded onto paper log sheets that are later entered into the drillhole database.
After logging, the responsible geologist clearly marks sample intervals for both density testing and assaying. The cores were logged and stored at the company facility, located in Malacacheta city.
The core sample boxes are photographed to preserve the original image of the drilling.
Photos are taken of every three boxes using a fixed stand with a camera mount. The photographs are taken both dry and wet to highlight features not visible when dry, accompanied by a colour chart with standardized RGB values for reference.
When handling saprolitic material, the core is split using a chisel and hammer. The operator splits the core as close as possible to the longitudinal section that contains the core axis.
For compact rocky material, the core was sectioned using a contractor’s diamond-tipped circular saw. The entire process of transporting the core boxes from the warehouse to the contractor and back is handled by the company, ensuring the material is kept secure.
The core samples range from a minimum of 0.5 m to a maximum of 1.5 m length respecting lithological contacts, with the majority of the core sampled at 1 m intervals. Core sample intervals were defined by geologists after logging and recorded in a sample program spreadsheet that was shared with the technician for sample collection. Core samples of intervals were marked and tagged on the core boxes by the technician during the sampling procedure.
Drill core samples were cut with a diamond saw, and saprolite and saprock were split with a hammer and a chisel. One half was retained and the other half (approximately 3 kg) submitted for analyses.
| 8.2 | Analytical and Test Laboratories |
All samples collected by Atlas during the 2023-2025 exploration programs were sent to SGS Geosol in Vespasiano, Brazil.
The SGS Geosol laboratory is ISO 14001 and 17025 accredited by the Standards Council. All laboratories used for the technical report are independent of Atlas and provide services pursuant to service contracts.
| |
| SGS Geological Services |
| S-K 1300 Technical Report – Malacacheta Graphite Project – Minas Gerais, Brazil | Page 38 |
| 8.3 | Sample Preparation and Analysis |
All samples received at SGS Geosol were inventoried and weighted prior to being processed. Drying was done to samples having excess humidity. Sample material was crushed to 75% passing 3 mm using jaw crushers. One kilogram of material was put in a separate bag and reserved for future analysis. Ground material was then split in two using a Jones split riffle to obtain one 2 kg sample reserved for duplicate analysis and one 1 kg sample for primary analysis. One-kilogram sub-samples were then pulverised using a ring and puck mill or a single component ring mill to 95% passing 150 mesh (106 µm) and split into four 250 g samples using a rotative splitter. The balance of the crushed sample (reject) was placed into the original plastic bag. The pulverised samples were finally analyzed by SGS Geosol.
Samples submitted to SGS are analyzed by the following procedures:
| ● | CSA05V (Leco - Graphitic Carbon): a minimum 0.02 g sample is digested in HCl acid and analyzed with the LECO carbon-sulphur analyzer. | |
| ● | CSA17V (Leco – Total Carbon and Total Sulphur): a minimum 0.02 g sample is digested in HCl acid and analyzed with the LECO carbon-sulphur analyzer. | |
| ● | XRF79C (X-ray Fluorescence – Measurement of the 10 major oxides – Al2O3, MgO, SiO2, CaO, MnO, TiO2, Fe2O3, Na2O, K2O, P2O5) fused with lithium tetraborate). |
| 8.4 | Density Determinations |
Atlas has conducted density measurement on drill core for the duration of the exploration program. The density database contains a total of 620 density measurements across the lithological profile. The density was calculated using the water displacement method or Archimedes’ Principle.
Atlas calculated densities for the different mineralized horizons, namely the saprolite zone, transitional zone and the fresh rock zone. A total of 139 density determinations were calculated across these three zones for graphitic schist, with Table 8-1 showing the results.
Table 8-1 Density Values for Graphitic Schist
| Zone | Number of Samples | Average (g/cm3) |
| Saprolite | 34 | 1.8 |
| Transition | 69 | 2.18 |
| Fresh Rock | 36 | 2.3 |
| 8.5 | Quality Assurance and Quality Control |
In addition to the laboratory quality assurance quality control (QA/QC) routinely implemented by SGS Geosol using pulp duplicate analysis, Atlas developed an internal QA/QC protocol for the Malacacheta drilling, which consisted of the insertion of analytical standard reference materials (standards), blanks and duplicate samples, as presented in Table 8-2.
Table 8-2 QA/QC Protocol of Insertion Blank, Core Duplicate and Standards
| Control Sample | Quantity | Insertion Rate |
| Blank (BLK CTRS 0003 BB) | 54 | 2% |
| Twin (TWN) | 137 | 5% |
| Standard (OREAS 722) | 28 | 1% |
| Standard (OREAS 724) | 27 | 1% |
| Standard (OREAS 725) | 27 | 1% |
| |
| SGS Geological Services |
| S-K 1300 Technical Report – Malacacheta Graphite Project – Minas Gerais, Brazil | Page 39 |
| 8.5.1 | Certified Reference Materials (CRMs) |
The company obtained three CRMs certified for both Total Carbon and Graphitic Carbon from OREAS. Certified values and tolerance limits are presented below in Table 8-3, Table 8-4 and Table 8-5.
Table 8-3 Certified Value, SD, 95% Confidence and Tolerance Limits for OREAS 722

Table 8-4 Certified Value, SD, 95% Confidence and Tolerance Limits for OREAS 724

Table 8-5 Certified Value, SD, 95% Confidence and Tolerance Limits for OREAS 725

| 8.5.1.1 | OREAS 722 |
A total of 28 samples were submitted using the OREAS 722 standard for the 2026 drilling. Of the samples, one sample fell outside three standard deviations.
| |
| SGS Geological Services |
| S-K 1300 Technical Report – Malacacheta Graphite Project – Minas Gerais, Brazil | Page 40 |
Figure 8-1 shows the results for OREAS 722.
Figure 8-1 Results for Standard OREAS 722
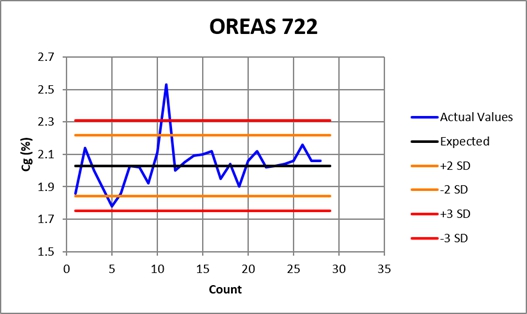
| 8.5.1.2 | OREAS 724 |
Atlas submitted 27 samples of OREAS 724 during the 2026 drilling campaign. Of the samples, five fell outside the limit of three standard deviations, although they fell just outside the limit.
Figure 8-2 shows the results for OREAS 724.
Figure 8-2 Results for Standard OREAS 724
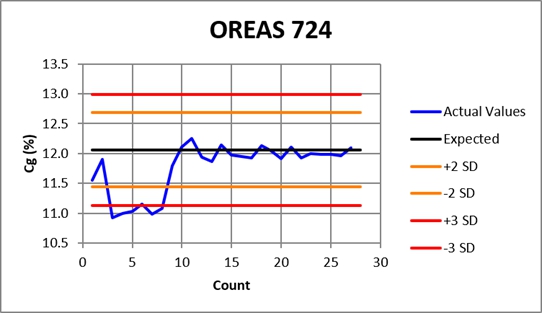
| |
| SGS Geological Services |
| S-K 1300 Technical Report – Malacacheta Graphite Project – Minas Gerais, Brazil | Page 41 |
| 8.5.1.3 | OREAS 725 |
Twenty-seven samples of OREAS 725 were submitted for analysis during the 2026 drilling campaign. Of the samples, one sample fell just outside the limit of three standard deviations.
Figure 8-3 shows the results for OREAS 725.
Figure 8-3 Results for Standard OREAS 725
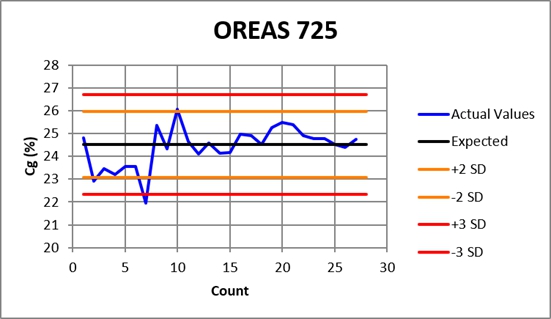
| 8.5.2 | Blanks |
The blank material used was a crushing aggregate supplied by CTRS laboratory (South American Reference Technological Center). The material has a particle size between 20 to 50 mm.
Atlas submitted a total of 54 blanks during the 2026 campaign. All but one sample fell below the limit of detection.
| |
| SGS Geological Services |
| S-K 1300 Technical Report – Malacacheta Graphite Project – Minas Gerais, Brazil | Page 42 |
Figure 8-4 shows the results for the blank assays.
Figure 8-4 Blank sample Results
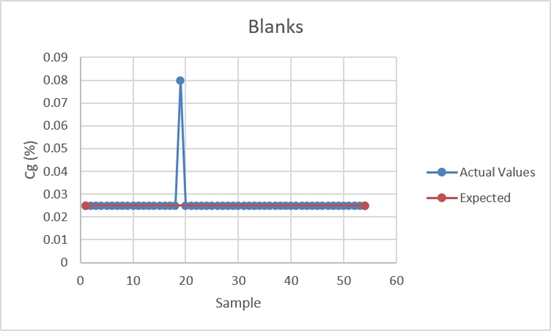
| 8.5.3 | Duplicates |
Atlas submitted a total of 139 duplicate samples in 2026. The results for Cg are shown in Figure 8-5.
From Figure 8-5, it can be seen that the results were consistent, with a coefficient of determination (R2) of 0.9122, which suggests there is little variation between the two samples.
| |
| SGS Geological Services |
| S-K 1300 Technical Report – Malacacheta Graphite Project – Minas Gerais, Brazil | Page 43 |
Figure 8-5 Core Duplicate Sample Results
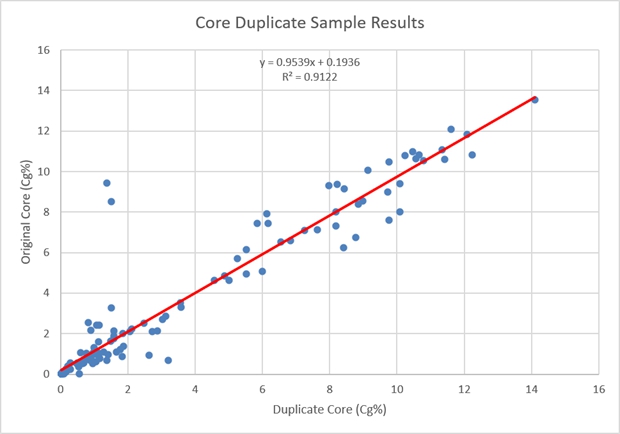
| 8.6 | Sample Security |
Core is stored in a locked logging facility. Split core (samples) was stored in a locked facility until it was sent to the laboratory.
The collected samples were packaged in high-density plastic bags, with each sample identified using a labeling tag, and all bags were sealed with a clamp.
Labels were affixed to the inner right side of the core boxes, specifying the interval corresponding to each sample. In the case of twin samples, they were also labelled with the original sample (SMP) and/or in sequence. Transportation from shed to laboratories was conducted by private freight companies.
| 8.7 | QP Comments |
SGS validated the exploration processes and core sampling procedures used by Atlas in 2026 as part of an independent verification program.
The QP concluded that the drill core handling, logging and sampling protocols are at conventional industry standard and conform to generally acceptable best practices. The chain of custody was followed by Atlas employees, and the sample security procedure showed no flaws.
The QP has reviewed the Atlas QAQC results and considers that they reflect the accuracy of the original assays.
The QP considers that the sample quality is good and that the samples are generally representative.
Finally, the QP is confident that the system is appropriate for the collection of data suitable for a Mineral Resource Estimate.
| |
| SGS Geological Services |
| S-K 1300 Technical Report – Malacacheta Graphite Project – Minas Gerais, Brazil | Page 44 |
| 9 | DATA VERIFICATION |
| 9.1 | Drilling Database |
The database for the Project was first transmitted to SGS by Atlas on the 13th April, 2026, and regularly updated by Atlas geologists. The database contains data for: collar locations; downhole surveys; lithologies and graphitic carbon assays.
Upon importation of the data into the modelling and mineral resources estimation software (Genesis), SGS conducted a second phase of data validation. At this point no major discrepancies were identified in the database.
Lastly, SGS conducted random checks on approximately 5% of the assay certificates, to validate the assay values entered in the database.
| 9.2 | Site Visit |
A site visit was conducted by the Qualified Person (QP), Marc-Antoine Laporte, P.Geo., M.Sc., from SGS, on May 11–12, 2026. The main objective of the visit was to familiarize the QP with the project, ongoing exploration methodologies, field conditions, and existing facilities. The visit included detailed discussions and key observations supporting initial project considerations.
| |
| SGS Geological Services |
| S-K 1300 Technical Report – Malacacheta Graphite Project – Minas Gerais, Brazil | Page 45 |
| 10 | MINERAL PROCESSING AND METALLURGICAL TESTING |
A metallurgical study was undertaken on samples from tenement 831.698/2021. The samples are from the same stratigraphic horizon as the MRE on tenement 830.954/2021 and represent the same mineralization as seen on this tenement. It is the opinion of the QP that this metallurgical test work applies to this MRE.
| 10.1 | Sample Analysis and Initial Flotation Test Work |
| 10.1.1 | Scope |
Atlas submitted nine samples collected from tenement 831.698/2021 to SGS Geosol in Belo Horizonte, Brazil. The test work comprised:
| ● | crushing samples to top size of 1.0 mm |
| ● | determining the head assay of the samples |
| ● | flotation after regrinding and attrition for two of the samples |
| ● | size-by-size analysis of the final flotation concentrates |
Figure 10-1 shows the test work flowsheet.
Figure 10-1 Test Work Flowsheet for Graphite Samples
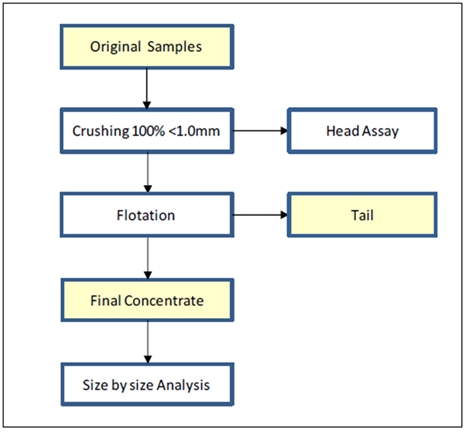
| |
| SGS Geological Services |
| S-K 1300 Technical Report – Malacacheta Graphite Project – Minas Gerais, Brazil | Page 46 |
| 10.1.2 | Methods of Chemical Analysis |
Chemical analysis of the original samples and their products was conducted by the following methods:
| ● | GC_CSA05V: determination of graphitic carbon via LECO |
| ● | XRF82GR: x-ray fluorescence to determine the contaminants |
| ● | PHY01E: lost on ignition |
| ● | PHY00D: ashes determination by gravimetry. |
| ● | GC_ICP40BGR: ICP scan of the ashes |
| 10.1.3 | Flotation |
The flotation test work included rougher flotation, grinding and five stages of cleaning with two attrition stages in between. It is important to note there are no circulating loads in the flowsheet, so that all flotation tailings are final. The flotation test work was performed in an open circuit.
All flotation tests were conducted by means of the Denver D12 mechanism equipped with air filters, air flowmeter and tachometer. Cell volume was 13 litres, impeller speed was 1600 rpm, air flowrate was 4.0 litres per minute were the same for both rougher and cleaner. The reagent scheme, however, was different for each stage:
| ● | rougher: 1000 g/t of dispersant (Sodium silicate), 375 g/t of collector (Kerosene) and 200 g/t of frother (Flotanol D-25); |
| ● | cleaner 1, 2 and 4: 50 g/t of collector (Kerosene) and 25 g/t of frother (Flotanol D-25); |
| ● | no reagents were added to cleaner 3 and 5. |
Grinding of the rougher concentrate was conducted by means of a 12 cm x 20 cm mill, charged with a load of 2.25 kg of 12.5 mm ball load for 10 minutes. The concentrates from cleaner 1 and 3 were submitted to attrition for 10 minutes at 1400 rpm by means of a scrubber which was immersed in zirconia beads of 2.4 mm diameter to form the grinding media. Due to the design of the scrubber, the pulp was forced to flow in opposite directions between the blades, effectively scouring the particle surfaces and removing debris and contaminants.
| |
| SGS Geological Services |
| S-K 1300 Technical Report – Malacacheta Graphite Project – Minas Gerais, Brazil | Page 47 |
Figure 10-2 Flotation Test Work Flowsheet
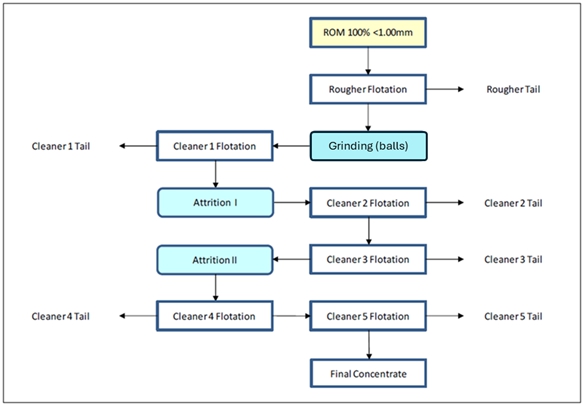
| 10.1.4 | Sample Receiving |
In May 2025, Atlas sent surface outcrop samples to SGS Geosol. The samples were packed in individual plastic sample bags, with the sample ID clearly indicated on the outside of each bag.
Atlas submitted a total of 12 samples for test work, each weighing approximately 25 kg. Some samples were combined to form the final nine samples tested. Table 10-1 shows the final sample designations for test work.
Table 10-1 Sample Identification and Weight
| Sample ID | Number of Units |
Total Mass (kg) |
| SMAL - 00001 | 1 | 21.5 |
| SMAL – 00002 | 1 | 24.2 |
| SMAL – 00003 | 1 | 23.1 |
| SMAL – 00004 | 3 | 71.0 |
| SMAL – 00005 | 2 | 49.2 |
| SMAL – 00006 | 1 | 24.3 |
| SMAL – 00007 | 1 | 24.3 |
| SMAL – 00008 | 1 | 23.6 |
| SMAL - 00009 | 1 | 25.0 |
| |
| SGS Geological Services |
| S-K 1300 Technical Report – Malacacheta Graphite Project – Minas Gerais, Brazil | Page 48 |
| 10.1.5 | Chemical Analysis of The Original Samples |
Results of the chemical analysis of the original samples via LECO, XRF and LOI are summarized in Table 10-2. These results indicate a range of 1.71% to 15.4% for graphitic carbon, with an average of 9.07%. The main contaminants were identified as silicates, ranging from 50% to 69% in terms of SiO2, as well as aluminum, from 12.7% to 21.3% Al2O3 and iron, from 1.53% to 18.1% Fe2O3.
The loss on ignition value (LOI) represents the weight percentage of all volatile substances released at a calcination temperature of 1100 °C, including graphitic carbon, as well as moisture, sulfur, organic matter and hydroxides. In this context, the sum of the content of graphitic carbon and other volatile substances in the ore is equivalent to the LOI, while the sum of the LOI and the oxides shown in Table 10-2 approaches 100 %.
| |
| SGS Geological Services |
| S-K 1300 Technical Report – Malacacheta Graphite Project – Minas Gerais, Brazil | Page 49 |
Table 10-2 Analysis Results for LECO, XRF and LOI
| Chemical Composition of the Original Samples | ||||||||||||||
| Sample |
C-Graph (%) |
LOI (%) |
Al2O3 (%) |
BaO (%) |
Cr2O3 (%) |
Fe2O3 (%) |
K2O (%) |
MgO (%) |
MnO (%) |
P2O5 (%) |
SiO2 (%) |
SrO (%) |
TiO2 (%) |
V2O5 (%) |
| SMAL-00001 | 15.4 | 19.4 | 13.1 | 0.04 | 0.03 | 3.24 | 1.31 | 0.35 | 0.01 | 0.05 | 62.3 | 0.02 | 0.72 | 0.09 |
| SMAL-00002 | 3.24 | 13.5 | 21.3 | 0.07 | 0.02 | 6.65 | 0.64 | <0.1 | 0.02 | 0.14 | 56.9 | 0.02 | 1.32 | 0.06 |
| SMAL-00003 | 1.71 | 10.3 | 13.6 | 0.04 | <0.01 | 5.43 | 0.34 | <0.1 | 0.05 | 0.12 | 69.3 | 0.02 | 1.22 | 0.04 |
| SMAL-00004 | 11.1 | 15.2 | 16.1 | 0.11 | 0.05 | 3.56 | 2.12 | 0.28 | <0.01 | 0.06 | 26.4 | 0.02 | 0.85 | 0.09 |
| SMAL-00005 | 11.5 | 14.2 | 13.7 | 0.11 | 0.03 | 1.78 | 2.26 | 0.31 | <0.01 | 0.09 | 68.1 | 0.02 | 0.67 | 0.11 |
| SMAL-00006 | 12.2 | 15.1 | 12.7 | 0.13 | 0.02 | 1.53 | 2.09 | 0.24 | 0.01 | 0.08 | 68.5 | 0.04 | 0.70 | 0.09 |
| SMAL-00007 | 13.4 | 17.4 | 14.5 | 0.15 | 0.02 | 4.76 | 2.01 | 0.28 | 0.02 | 0.11 | 61.1 | 0.02 | 0.93 | 0.06 |
| SMAL-00008 | 11.3 | 14.8 | 15.4 | 0.09 | 0.02 | 1.93 | 2.30 | 0.32 | 0.01 | 0.07 | 65.1 | 0.02 | 0.72 | 0.09 |
| SMAL-00009 | 1.89 | 10.7 | 19.9 | 0.04 | 0.03 | 18.1 | 0.48 | 0.28 | 0.04 | 0.26 | 50.1 | 0.02 | 1.20 | 0.05 |
Results of PHY00D are summarized in Table 10-3, representing the weight percent of the remnants from calcination, that is, 100 – LOI.
Table 10-3 Analysis Results for PHY00D on Ashes
| Chemical Composition of the Original Samples | ||||||||||||||
| Sample |
Ashes (%) |
Al_C (%) |
Ca_C (%) |
Fe_C (%) |
K_C (%) |
Mg_C (%) |
Na_C (%) |
P_C (%) |
Ti_C (%) |
Ba_C (%) |
Cu_C (%) |
La_C (%) |
Sr_C (%) |
V_C (%) |
| SMAL-00001 | 80.6 | 3.11 | 0.02 | 1.82 | 0.98 | 0.17 | 0.05 | 0.02 | 0.17 | 392 | 26.0 | 61.0 | 30.0 | 462 |
| SMAL-00002 | 86.5 | 6.61 | 0.02 | 3.71 | 0.45 | 0.04 | 0.09 | 0.05 | 0.50 | 503 | 54.0 | 52.0 | 62.0 | 290 |
| SMAL-00003 | 89.5 | 5.17 | 0.03 | 3.39 | 0.27 | 0.04 | 0.02 | 0.05 | 0.44 | 341 | 44.0 | 63.0 | 58.0 | 174 |
| SMAL-00004 | 84.5 | 5.36 | 0.01 | 2.14 | 1.61 | 0.14 | 0.09 | 0.03 | 0.29 | 948 | 21.0 | 49.0 | 41.0 | 436 |
| SMAL-00005 | 85.6 | 4.94 | 0.02 | 1.09 | 1.79 | 0.15 | 0.11 | 0.03 | 0.25 | 959 | 13.0 | 53.0 | 130 | 490 |
| SMAL-00006 | 84.6 | 4.63 | 0.02 | 0.94 | 1.64 | 0.15 | 0.09 | 0.03 | 0.25 | 890 | 18.0 | 56.0 | 117 | 487 |
| SMAL-00007 | 82.9 | 4.88 | 0.01 | 2.84 | 1.57 | 0.15 | 0.09 | 0.04 | 0.32 | 1155 | 30.0 | 57.0 | 122 | 273 |
| SMAL-00008 | 83.8 | 4.63 | 0.01 | 1.11 | 1.80 | 0.15 | 0.11 | 0.03 | 0.26 | 867 | 35.0 | 46.0 | 84.0 | 456 |
| SMAL-00009 | 89.1 | 6.52 | 0.02 | 11.4 | 0.35 | 0.14 | 0.02 | 0.10 | 0.53 | 345 | 71.0 | 52.0 | 23.0 | 258 |
| |
| SGS Geological Services |
| S-K 1300 Technical Report – Malacacheta Graphite Project – Minas Gerais, Brazil | Page 50 |
| 10.1.6 | Flotation Results |
The samples with the highest and second lowest head grade respectively, SMAL - 00001 and SMAL - 00009 of 15.4% and 1.89% graphitic carbon, were submitted to flotation as per the flowsheet in Figure 10-2. The main objective of testing these two samples was to ensure the experimental conditions were suitable for the Malacacheta mineralization, in order to produce a final concentrate of high grade. The flotation results summarized in Table 10-4 and Table 10-5 indicated that:
| ● | sample SMAL - 00001 generated a final concentrate of high grade and recovery, namely, 91.9% graphitic carbon and 95.1% metallurgical recovery |
| ● | the final concentrate generated by sample SMAL - 00009 was also high in grade, at 96.5% graphitic carbon, but the metallurgical recovery dropped to 73.6%. |
Table 10-4 Flotation Results for SMAL-00001
| Flotation: SMAL-00001 | ||||
| Stage | Mass | Graphitic Carbon (%) | ||
| (g) | (%) | Assay | Distribution | |
| ROM EXPERIMENTAL | 2000 | - | 15.4 | - |
| ROM CALCULATED | 1966 | 100 | 15.4 | 100 |
| ROUGHER TAIL | 1112 | 56.6 | 0.48 | 1.76 |
| ROUGHER CONC | 854 | 43.4 | 34.9 | 98.2 |
| CLEANER 1 TAIL | 324 | 16.5 | 0.47 | 0.50 |
| CLEANER I CONC | 530 | 27.0 | 56.0 | 97.7 |
| CLEANER II TAIL | 158 | 8.04 | 0.50 | 0.26 |
| CLEANER II CONC | 372 | 18.9 | 79.5 | 97.5 |
| CLEANER III TAIL | 25.0 | 1.27 | 4.87 | 0.40 |
| CLEANER III CONC | 347 | 17.7 | 84.9 | 97.1 |
| CLEANER IV TAIL | 25.0 | 1.27 | 9.28 | 0.76 |
| CLEANER IV CONC | 322 | 16.4 | 90.8 | 96.3 |
| CLEANER V TAIL | 8.00 | 0.41 | 44.7 | 1.18 |
| CLEANER V CONC | 314 | 16.0 | 91.9 | 95.1 |
| |
| SGS Geological Services |
| S-K 1300 Technical Report – Malacacheta Graphite Project – Minas Gerais, Brazil | Page 51 |
Table 10-5 Flotation Results for SMAL-00009
| Flotation: SMAL-00009 | ||||
| Stage | Mass | Graphitic Carbon (%) | ||
| (g) | (%) | Assay | Distribution | |
| ROM EXPERIMENTAL | 2000 | - | 1.89 | - |
| ROM CALCULATED | 1909 | 100 | 2.09 | 100 |
| ROUGHER TAIL | 1603 | 84.0 | 0.40 | 16.0 |
| ROUGHER CONC | 306 | 16.0 | 11.0 | 84.0 |
| CLEANER 1 TAIL | 202 | 10.6 | 1.22 | 6.15 |
| CLEANER I CONC | 105 | 5.47 | 29.8 | 77.8 |
| CLEANER II TAIL | 64.5 | 3.38 | 1.07 | 1.73 |
| CLEANER II CONC | 40.0 | 2.10 | 76.0 | 76.1 |
| CLEANER III TAIL | 5.50 | 0.29 | 10.5 | 1.45 |
| CLEANER III CONC | 34.5 | 1.81 | 86.4 | 74.6 |
| CLEANER IV TAIL | 3.50 | 0.18 | 6.09 | 0.53 |
| CLEANER IV CONC | 31.0 | 1.62 | 95.5 | 74.1 |
| CLEANER V TAIL | 0.50 | 0.03 | 37.0 | 0.46 |
| CLEANER V CONC | 30.5 | 1.60 | 96.5 | 73.6 |
| 10.1.7 | Size by Size Analysis |
The main objective of the tests was to evaluate whether the samples can be concentrated. It should be noted that in all particle size ranges, grades higher than 91% were obtained for sample SMAL-00001, and grades higher than 93% for sample SMAL-00009. The flotation concentrates generated by samples SMAL - 00001 and SMAL - 00009 were analyzed on a size-size basis. The results summarized in Table 10-6 and Table 10-7 indicate that:
| ● | for sample SMAL - 00001, the flakes in the -300 to +180 microns interval represent 9.23% of the sample mass, with the assay of graphitic carbon at 96.6%. The material in the minus 75-micron range accounted for 36.4% of total mass. |
| ● | for sample SMAL - 00009, the flakes in the -300 to +180 microns interval represent 2.56% of the sample mass, with an assay value of 93.8% graphitic carbon, however, the material in the minus 75-micron range accounted for 69.2% of total mass. |
Table 10-6 Flotation Concentrate for SMAL-00001
| SMAL-00001 – Final Concentrate | ||
|
Size Interval (µm) |
weight (%) |
C-Graph (%) |
| +300 | 1.03 | 93,0 |
| -300+180 | 9.23 | 96.6 |
| -180+150 | 9.74 | 94.5 |
| -150+75 | 43.6 | 93.1 |
| -75 | 36.4 | 91.3 |
| CONC CLN V CALC | 100 | 92.9 |
| CONC CLN V EXP | 100 | 91.9 |
| |
| SGS Geological Services |
| S-K 1300 Technical Report – Malacacheta Graphite Project – Minas Gerais, Brazil | Page 52 |
Table 10-7 Flotation Concentrate for SMAL-00009
| SMAL-00009 – Final Concentrate | ||
|
Size Interval (µm) |
weight (%) |
C-Graph (%) |
| +300 | 0.00 | - |
| -300+180 | 2.56 | 93.8 |
| -180+150 | 5.13 | 95.3 |
| -150+75 | 23.1 | 97.7 |
| -75 | 69.2 | 93.0 |
| CONC CLN V CALC | 100 | 94.2 |
| CONC CLN V EXP | 100 | 96.5 |
| 10.1.8 | Results and Conclusion |
The results summarized in Table 10-8 indicate that the two samples used for flotation test work achieved grades between 91.3% and 97.7% graphitic carbon.
Using conventional flotation, regrinding and attrition techniques, the final graphite concentrates achieved grades of 91.9% and 96.5% total graphite carbon, demonstrating the amenability of the Malacacheta Project to flotation.
Table 10-8 Final Size Intervals and Grades for Flotation Test Work
|
Size Interval (µm) |
C-Graph (%) SMAL-00001 |
C-Graph (%) SMAL-00009 |
| +300 | 93.0 | - |
| -300+180 | 96.6 | 93.8 |
| -180+150 | 94.5 | 95.3 |
| -150+75 | 93.1 | 97.7 |
| -75 | 91.3 | 93.0 |
| CONC CLN V EXP | 91.9 | 96.5 |
Note: All carbon analyses are reported as graphite carbon (“C-graph”). The analytical methods that were used to determine the metallurgical results included total carbon analysis by Leco on the final concentrates.
Main conclusions arising from the test work are:
| ● | The content of graphitic carbon averaged 9.07% among the original samples, ranging from 1.71% for SMAL - 00003 to 15.4% for SMAL - 00001 |
| ● | Flotation of both the highest and second lowest grade samples generated final concentrates of 96.5% graphitic carbon for SMAL - 00009 and 91.9% for SMAL - 00001 |
| ● | Metallurgical recovery was 96.5% for SMAL - 00001 and 73.6% for SMAL - 00009 |
| ● | The flakes in the -300+180 microns interval of the flotation concentrate generated by sample SMAL - 00001 represented 9.23% of the sample, with 96.6% graphitic carbon assay. For sample SMAL - 00009, the flakes represent only 2.56% of the sample mass and the material below 75 microns was up to 69.2%. |
| |
| SGS Geological Services |
| S-K 1300 Technical Report – Malacacheta Graphite Project – Minas Gerais, Brazil | Page 53 |
| 10.1.9 | Suggestion For Further Work |
In view of the results to date, it is strongly recommended that the work with the Atlas graphite mineralization be extended as follows:
| ● | Technological characterization tests |
| ● | Tests with variations in process routes |
| ● | Tests for grinding and flotation optimization, including LCT |
| ● | Tests considering desliming |
| ● | Tests to determine the optimal dosage and types of reagents |
| ● | Conduct further flotation work using samples SMAL - 00009 and SMAL - 00001 to optimize the flotation conditions and apply those conditions to the other samples |
| ● | Include total sulfur by LECO and exclude ICP in the chemical analysis of the original samples and flotation products |
| ● | Test a larger number of samples to determine the variability of the deposit with geometallurgy studies |
| 10.2 | Graphite Processing and Characterization |
| 10.2.1 | Scope |
Atlas submitted a 1.09kg sample of the floated graphite concentrate produced by SGS Geosol to American Energy Technologies Co. (AETC) for graphite processing and characterization. The sample supplied by SGS Geosol contained 93.95% graphitic carbon.
The test work by AETC comprised:
| ● | Characterization of “as received” material |
| ● | Downstream drying, calcination and thermal purification |
| ● | Characterization of purified material |
| ● | Screening and associated analysis of purified material to produce commercially viable “graphite industry standard” sample cuts |
| ● | Characterization of screened purified material to generate Product Information Bulletins, which can be presented to the market |
| ● | The development of process block diagram from the point of receipt of the concentrate to the point of release of screened thermally purified precursors either directly to the market (where applicable) or to further downstream processors |
The test work was performed between the 3rd September 2025 and the 10th October 2025.
| |
| SGS Geological Services |
| S-K 1300 Technical Report – Malacacheta Graphite Project – Minas Gerais, Brazil | Page 54 |
Figure 10- shows the block diagram flowsheet of the test work.
Figure 10-3 Block Diagram Flowsheet of Graphite Processing and Characterization
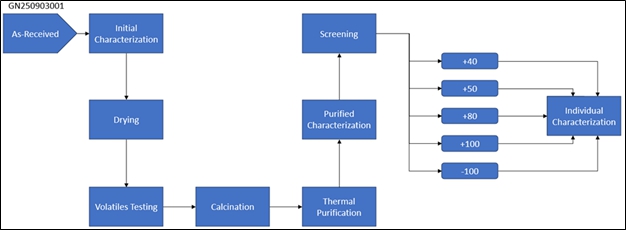
| 10.2.2 | Methods of Analysis and Characterization |
AETC carried out the following tests on the supplied sample:
| ● | Moisture content of the “as received” material was undertaken to determine the amount of residual water in the supplied sample. |
| ● | The volatile content of contaminants was determined by heating the residual mass to 600°C, 950°C and 1450°C for 20 minutes at each temperature to determine the volatile content at each of the temperature reactivity stages. |
| ● | The apparent density or Scott Volume was calculated using ATSM B 329 |
| ● | The tap density of the sample was determined using B 527 e1 – “Standard Test Method for Determination of Tap Density of Metallic Powders and Compounds.” |
| ● | Loss on Ignition was determined in accordance with ASTM C561. |
| ● | The rough elemental composition of the contaminant ash was determined via Ash Spectrophotometry. |
| ● | The particle sizes of the materials tested were measured utilizing a Microtrac S3500 Series Light Scattering Particle Size Analyzer and a Horiba LA-910 Light Scattering Particle Size Analyzer, both of which meet ISO 13320-1 Standard: “Particle size analysis - Laser Diffraction methods.” |
| ● | The Sample Image Analyzer (SIA) attachment on the Microtrac S3500 series laser particle size analyzer adds the capability of imaging particles flowing through the system in real time. SIA measures the morphological properties, such as the particle aspect ratios of the sample particles analyzed. |
| ● | For screening the graphite material into different cuts based on particle size, AETC employed a W.S. TYLER®, RX-29 Ro-Tap Sieve Shaker machine. |
| ● | To determine the surface area of a material sample, AETC employed a Quantachrome NOVA 2200e, 2-station, multi-gas (i.e. N2 / Ar / CO2 / CH4 / C4H10) surface area analyzer. This instrument is outfitted with a built-in microprocessor guided calibration feature, which adheres to the ISO-9000 requirements. |
| |
| SGS Geological Services |
| S-K 1300 Technical Report – Malacacheta Graphite Project – Minas Gerais, Brazil | Page 55 |
| ● | A JEOL JCM-7000 Scanning Electron Microscope (SEM) was used to produce images of selected samples. An electron beam in the range of 1-10 keV was used for imaging. The Secondary Electron Imaging mode (SE) was employed for samples used in this study to generate micrographs with high magnification. Certain samples presented in this report were additionally analyzed by EDS (energy dispersive scan) function of an SEM to give a rough elemental composition of the area analyzed. |
| ● | An AmScope MU2003 Optical Microscope Camera was used to capture images of the selected samples. These more sparsely populated sections of the slide were investigated at 40x, 50x, 100x and 400x magnification, where appropriate, to obtain detailed images of the particles. After each image was captured, a scale bar was added and the diameters of 2 to 3 particles within the image were measured and displayed on the image to give an idea of the particle sizes being viewed. |
| 10.2.3 | Incoming Raw Materials Analysis (IRMA) |
The SEM analysis determined that the “as received” sample was comprised of natural crystalline flake graphite with a fully-formed, robust particle structure.
The SEM images show that the flake graphite is predominantly thin, although images from the 90x and 1000x magnifications show some particles that are thicker, up to 5 µm in size, which is consistent with flake graphite from Qingdao province, China. Overall, the majority of the flakes represent thin particle morphologies.
| |
| SGS Geological Services |
| S-K 1300 Technical Report – Malacacheta Graphite Project – Minas Gerais, Brazil | Page 56 |
Figure 10-4 shows SEM images at magnifications of 90x, 230x, 430x and 1,000x.
Figure 10-4 SEM Imagery of the “As Received” Sample
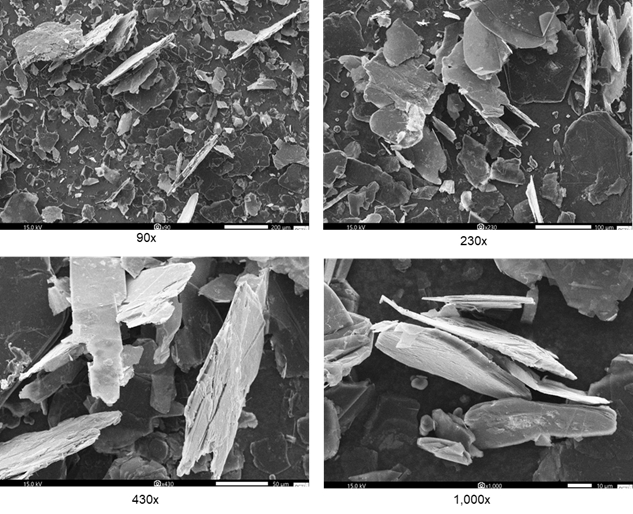
SEM images taken at magnification of 230, 430, and 1000x, reveal the presence of mineral impurities that are represented by fine dust that comes in aggregates as well as occasionally in fibers and these were seen to measure less than 1 mm in particle diameter.
Table 10-9 shows IRMA results for “as-received” material. It was observed that the sample had a high moisture content, namely 23.82 wt.% H2O. High moisture content is likely due to water residue and insufficient drying of the sample incurred during upstream processing of this natural flake graphite at the lab which produced the concentrate. It is recommended that upstream processing for the drying step be put on site at the concentrator plant so that Atlas does not need to ship material with excessive amounts of moisture. Material having 23.82 wt.% H2O won’t pass industry specifications which for concentrate materials on the market amounts to less than 0.1 wt.% H2O.
Table 10-9 IRMA Results for the “As Received” Sample
| Sample | Moisture Content (wt.%) | Volatile Content (wt.%) | TGC (wt.%) | Ash (%) | Tap Density (g/cm3) | Scott Volume (g/cm3) | Surface Area (m2/g) | ||
| 600⁰C | 950⁰C | 1450⁰C | |||||||
| GN250903001 | 23.82 | 0.69 | 0.26 | 2.21 | 93.95 | 6.05 | 0.53 | 0.29 | 15.32 |
| |
| SGS Geological Services |
| S-K 1300 Technical Report – Malacacheta Graphite Project – Minas Gerais, Brazil | Page 57 |
While moisture is a derivative of upstream processing and is not necessarily tied to properties of graphite itself, its volatile content reflects an intrinsic feature of graphite flake found in Malacacheta resource. AETC conducted volatile tests at 3 temperatures that are listed in Table 10-9. Volatiles expressed at 600°C amount to 0.69 wt.% of dried sample weight and is associated with the removal of carbonates, as well as potential organic frother’s residue from flotation. Volatiles expressed at 900°C amounted to 0.26 wt.% of dried, de-carbonized sample weight. The weight loss at these temperatures is associated with the removal of volatile organic residue, low molecular weight hydrocarbons, and any PAH residue which may be present in the structure of this flake. Lastly, volatiles expressed at 1450°C amount to 2.21 wt.% and can be associated with the start of decomposition of aluminum oxide, iron oxide, as well as the removal of sulfur (main component) in the form SO2 from within the structure of graphite. The overall volatile matter amounts to 3.16 wt.%, not counting moisture. For reference, the best materials on the market feature volatiles of less than 0.1 wt.%. The condition can be achieved by placing a high temperature calciner at the tail end of the process for making concentrate grade graphite.
The amount of total graphitic carbon (TGC) measured for this sample was determined at 93.95 wt.% TGC. We compared this measured value to TGC measured by SGS Geosol, which reported a value of 93.75 wt.% TGC. The two values are extremely close to each other. We conclude that graphite concentrate supplied to AETC is just a little bit shy of meeting one of the standard industry specifications of 94 wt.% TGC. The condition can be improved through optimization of the flotation circuit.
The values of tap density and Scott volume are in line with industry standard expectations. The BET surface area value of 15.32 m2/g is very high, however, most of the BET surface area is due to mineral impurities located on the surface of graphite flakes and not flake itself.
After the LOI testing was conducted to determine the purity of the “as-received” material, the resulting ash was analyzed to determine the rough composition of the contaminants. The colour of the ash is determined by the compounds present within it and can be used as a signature “fingerprint” for the graphite ore as the ash color will change from formation to formation and even between different locations within a formation.
The ash is red/orange in colour with higher light reflectance in the 600-700 nm range. High red colour content of the ash suggests the presence of iron within the graphite, while the high yellow content suggests the presence of potassium. The lighter colour of the ash could be attributed to silicon, aluminum and calcium impurities present in the “as-received” graphite material. These elemental impurity estimations match the results of XRF analysis conducted by SGS Geosol.
Particle size distribution was determined by laser diffraction. The sonicated material is seen to be notably finer than its non-sonicated counterpart, specifically D50 differs by almost a factor of 2 for the same samples, falling from 98.34 to 54.47 µm as a result of sonification treatment of the sample. This represents indirect evidence that the material is prone to breaking, effectively turning thin sheet-like flakey particles into pulverized dust. Materials that have higher thickness do not suffer from this phenomenon nearly as much. Table 10-10 shows the results of particle size analysis for sonicated and non-sonicated materials.
Table 10-10 Particle Size Analysis for the “As Received” Sample
| Sample | Particle Size (µm) | |||
| MV | D10 | D50 | D90 | |
| GN250903001 - Sonicated | 74.88 | 17.73 | 54.47 | 160.3 |
| GN250903001 - Non-Sonicated | 108.5 | 37.24 | 98.34 | 193.2 |
Sample Image Analysis (SIA) was completed with the high-speed camera attachment on the laser particle size analyser. The SIA analyzer of sonicated material shows a statistically significant, large population of particles, some of which have naturally occurring sphericity that approaches 100% and some completely non-spherical particles whose aspect ratio is less than 30% of spherical. The majority of the material falls under the degree of sphericity of 90% assuming two-dimensional particle morphology. Some of the shapes seen by the high-speed camera during the analysis show flakey particles mostly non-spherical in nature and rather thin if considered as three-dimensional particles.
| |
| SGS Geological Services |
| S-K 1300 Technical Report – Malacacheta Graphite Project – Minas Gerais, Brazil | Page 58 |
The “as-received” material has a rather broad particle size distribution with trace appearances of 40 mesh particles (0.03 wt.%), 0.67 wt.% of 50 mesh material, and notable concentration of 8.62 wt.% of +80 mesh material, 9.6 wt.% of +100 mesh material and the rest accounting for -100 battery precursor. The peak of particle size occurrences falls under -100 and up to +200 mesh particles which is consistent with laser diffraction data reported earlier. Figure 10-5 and Table 10-11 summarize the results of the particle size analysis.
Figure 10-5 Screen Analysis Results for the “As Received” Sample
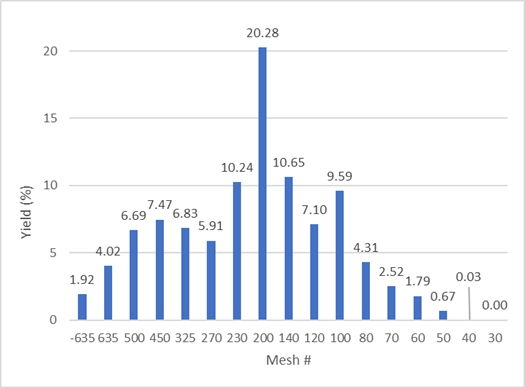
| |
| SGS Geological Services |
| S-K 1300 Technical Report – Malacacheta Graphite Project – Minas Gerais, Brazil | Page 59 |
Table 10-11 Screen Analysis Results for the “As Received” Sample
|
GN250903001 – “As Received” | |
| Mesh Size | Weight (%) |
| 30 | 0.00 |
| 40 | 0.03 |
| 50 | 0.67 |
| 60 | 1.79 |
| 70 | 2.52 |
| 80 | 4.31 |
| 100 | 9.59 |
| 120 | 7.10 |
| 140 | 10.64 |
| 200 | 20.28 |
| 230 | 10.24 |
| 270 | 5.91 |
| 325 | 6.83 |
| 450 | 7.46 |
| 500 | 6.69 |
| 635 | 4.02 |
| -635 | 1.92 |
| 10.2.4 | Thermal Purification |
The graphite concentrate was purified in a pilot-scale arcing reactor operated by AETC.
The key result of the analysis of material purity is that the graphite has a nuclear grade loss on ignition (LOI) of 99.9995 wt.%C, which is very significant. That leaves .0005 wt.% for ash which can be considered as trace. The Scott volume of material did not change as a result of purification. The tap density fell slightly from the concentrate state to a value of 0.546 g/cm3. There was a large change in surface area which reduced to 0.89 m2/g. This is a significant reduction from the “as received” measured BET surface area value of 15.32 m2/g. Surface areas of less than 1 m2/g are expected for purified bulk materials prior to their subsequent downstream processing.
Table 10-12 shows the characterization results for the thermally purified material.
Table 10-12 Characterization Results for Thermally Purified Material
| Sample | LOI (wt.%) | Ash (wt.%) | Tap Density (g/cm3) | Scott Volume (g/cm3) | Surface Area (m2/g) |
| GN250903001P - Bulk | 99.9995 | 0.0005 | 0.456 | 0.291 | 0.89 |
The particle size analysis of the thermally purified material indicated that there were few changes as a result of the thermal purification. The sonicated material increased its particle size from D50 = 54.5µm in concentrate state to D50 = 77.5µm in the purified state, suggesting that some particles may have fused into each other as a result of processing at 2700°C to form more sturdy aggregates. Alternately, it could also mean that there is a significant variability of particle sizes within the bulk distribution and the variation seen is normal for this sample and not necessarily tied to particle fusing. In non-sonicated sample testing D50 amounted to 89.83 µm versus 98.34 µm for non-sonicated purified vs concentrate grade graphite which is essentially similar range of values considering variability of particle sizes within the same sample. Somewhat expectedly, the degree of sphericity did not change for the thermally purified sample v. concentrate grade purity flake.
| |
| SGS Geological Services |
| S-K 1300 Technical Report – Malacacheta Graphite Project – Minas Gerais, Brazil | Page 60 |
Table 10-13 shows the particle size analysis for the thermally purified material.
Table 10-13 Particle Size Analysis Results for Thermally Purified Material
| Sample | Particle Size (µm) | |||
| MV | D10 | D50 | D90 | |
| GN250903001P - Sonicated | 93.33 | 27.98 | 77.53 | 177.5 |
| GN250903001P – Non-Sonicated | 104.2 | 34.71 | 89.83 | 192.4 |
The final stage of the test work was to screen the thermally purified material. Five different screens were used for the screening, namely 40 mesh, 50 mesh, 80 mesh, 100 mesh and -110 mesh. Each of the mesh sizes used represents a different grade of commercially viable graphite.
Figure 10-6 and Table 10-14 show the yield data for thermally purified material for the different screen sizes.
Figure 10-6 Screen Analysis Results for Purified Material
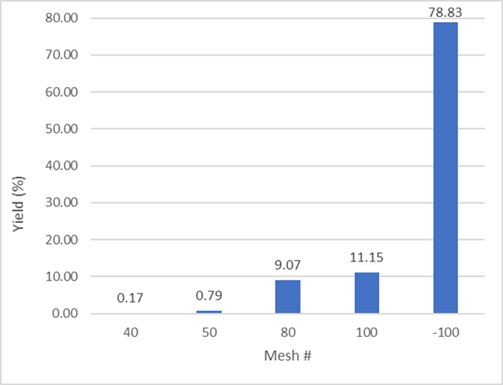
| |
| SGS Geological Services |
| S-K 1300 Technical Report – Malacacheta Graphite Project – Minas Gerais, Brazil | Page 61 |
Table 10-14 Screen Analysis Results for Purified Material
| GN250903001 - Purified | |
| Mesh Size | Weight (%) |
| 40 | 0.17 |
| 50 | 0.79 |
| 80 | 9.07 |
| 100 | 11.15 |
| -100 | 78.82 |
| 10.2.4.1 | +40 Mesh Material |
The +40 mesh (P40) material approaches the definition of jumbo flake of graphite. SEM images of the +40 mesh flakes show very large, robust flakes with rounded and irregular edge-planes. There are some occasional imprints or holes in flakes’ surface. This is where mineral impurities used to sit but as a result of purification they got sublimed from the surface, leaving the cavity behind. Laser particle size analysis of this material shows bimodal particle size distribution with individual particle sizes reaching up to 1000 µm, but a D50 still measuring 83.2 µm with population mean value of 147.23 µm.
Table 10-15 shows the characterization results for the +40 mesh material and Figure 10-7 shows the SEM images.
Table 10-15 Characterization Results for +40 Mesh Purified Material
| Sample | LOI (wt.%) | Ash (wt.%) | Particle Size, mm | |||
| MV | D10 | D50 | D90 | |||
| GN250903001 +40 Mesh | 99.9995 | 0.0005 | 147.23 | 29.74 | 83.20 | 416.14 |
Figure 10-7 SEM Images of +40 Mesh Purified Material
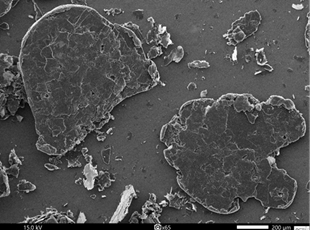 |
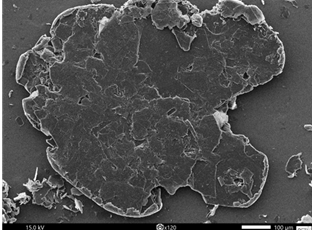 |
| (65x) | (120x) |
| |
| SGS Geological Services |
| S-K 1300 Technical Report – Malacacheta Graphite Project – Minas Gerais, Brazil | Page 62 |
| 10.2.4.2 | +50 Mesh Material |
The SEM images of the +50 mesh material show thick, robust flakes with a number of visible cavities on the surface. These cavities used to hold mineral impurities on the surface before they evaporated from the graphite’s surface during high temperature refinement of this material. Laser particle size analysis of this material shows bimodal particle size distribution whose mean particle size is defined as 134.5 µm and D50=80.5 µm.
Table 10-16 shows the characterization results for the +50 mesh material and Figure 10-8 shows the SEM images.
Table 10-16 Characterization Results for +50 Mesh Purified Material
| Sample | LOI (wt.%) | Ash (wt.%) | Surface Area (m2/g) | Particle Size, mm | |||
| MV | D10 | D50 | D90 | ||||
| GN250903001 +50 Mesh | 99.9995 | 0.0005 | 0.61 | 134.46 | 27.18 | 80.48 | 134.46 |
Figure 10-8 SEM Images of +50 Mesh Purified Material
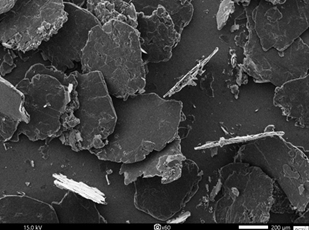 |
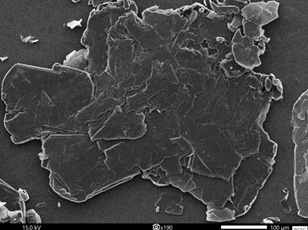 |
| (60x) | (190x) |
| 10.2.4.3 | +80 Mesh Material |
The +80 mesh material can be used in the nuclear industry application and a variety of other markets and typically consists of slightly smaller, but hardy crystals. The SEM images of the +80 mesh material shows flakey morphology with some residue of imprints that used to house grains of mineral impurities that were sublimed from the surface as a result of high temperature heat treatment. The flake graphite is no longer bimodal, but has a skewed peak that stretches in the direction of finer particle sizes revealing that in addition to large +80 mesh particles, the distribution contains some residual broken off particle edges that stay adhered to the surface of larger coarse particles by Van der Waals forces. The D50 of the +80 mesh material measured at 111.5 µm with mean particle size of 130 µm.
| |
| SGS Geological Services |
| S-K 1300 Technical Report – Malacacheta Graphite Project – Minas Gerais, Brazil | Page 63 |
Table 10-17 shows the characterization results for the +80 mesh material and Figure 10-9 shows the SEM images.
Table 10-17 Characterization Results for +80 Mesh Purified Material
| Sample | LOI (wt.%) | Ash (wt.%) | Tap Density (g/cm3) | Scott Volume (g/cm3) | Surface Area (m2/g) |
| GN250903001 +80 Mesh | 99.9995 | 0.0005 | 0.517 | 0.378 | 0.54 |
Figure 10-9 SEM Images of +80 Mesh Purified Material
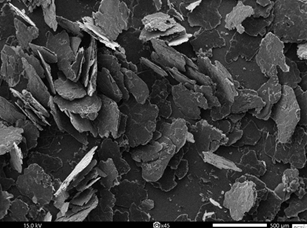 |
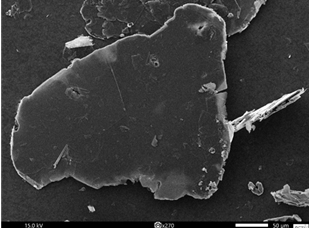 |
| (45x) | (270x) |
| 10.2.4.4 | +100 Mesh Material |
The +100 mesh screened particles of this material were thinner, although 50% of particles in the bulk distribution are made of thick flakes of 5+ mm in the z-direction (others are less than 5 mm in thickness and appear to be rather friable). The SEM images show very robust particulate flakey morphology. LOI test shows high purity for this material with a surface area of 0.68 m2/g, apparent density of 0.34 g/cm3 and tap density of 0.5 g/cm3. The particle size distribution of this flake which shows a bell-shaped curve and not a bimodal distribution as in some of the coarser cuts. The mean particle size of this distribution is 92 µm and D50 is 83 µm.
Table 10-18 shows the characterization results for the +100 mesh material and Figure 10-10 shows the SEM images.
Table 10-18 Characterization Results for +100 Mesh Purified Graphite Flake
| Sample | LOI (wt.%) | Ash (wt.%) | Tap Density (g/cm3) | Scott Volume (g/cm3) | Surface Area (m2/g) |
| GN250903001 +100 Mesh | 99.9995 | 0.0005 | 0.495 | 0.342 | 0.68 |
| |
| SGS Geological Services |
| S-K 1300 Technical Report – Malacacheta Graphite Project – Minas Gerais, Brazil | Page 64 |
Figure 10-10 SEM Images of +100 Mesh Purified Material
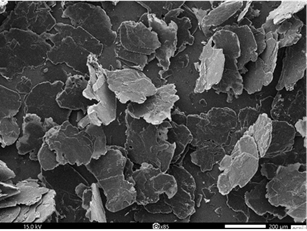 |
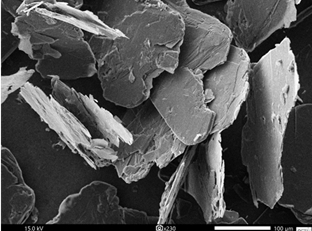 |
| (85x) | (230x) |
| 10.2.4.5 | -100 Mesh Material |
The SEM images of the -100 mesh particles portray flakes that vary in size and shape. The LOI tests indicate a high purity of the screen samples. Surface area for this material is 0.79 m2/g which is slightly higher than that of the coarser counterparts and which is due to material being finer and having more open edges available for the gas absorbent while running the BET test. The laser particle size distribution of -100 mesh purified material displays a bell curve. The mean particle size of this distribution is 71.5 µm and D50 is 83.5 µm.
Table 10-19 shows the characterization results for the -100 mesh material and Figure 10-11 shows the SEM images.
Table 10-19 Characterization Results for -100 Mesh Purified Material
| Sample | LOI (wt.%) | Ash (wt.%) | Tap Density (g/cm3) | Scott Volume (g/cm3) | Surface Area (m2/g) |
| GN250903001 -100 Mesh | 99.9995 | 0.0005 | 0.457 | 0.272 | 0.79 |
| |
| SGS Geological Services |
| S-K 1300 Technical Report – Malacacheta Graphite Project – Minas Gerais, Brazil | Page 65 |
Figure 10-11 SEM Images of -100 Mesh Purified Material
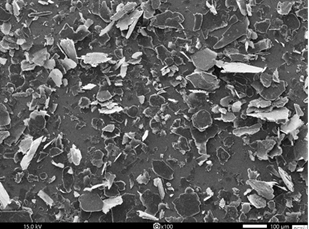 |
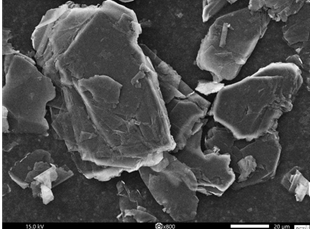 |
| 10.2.5 | Results and Conclusions |
Thermal purification at AETC was successful, yielding 99.9995 wt.%C purity at 2800°C in nitrogen, without the use of halogen gas. The success of the thermal purification was helped by two factors:
| 1) | The flakes were very thin |
| 2) | Mineral impurities were located on the flakes’ surfaces as opposed to being intercalated as gangue within the mineral structure. |
The tests conducted with material from the Malacacheta project have demonstrated the technical and commercial viability of producing five distinct mesh size cuts (+40, +50, +80, +100, and -100 mesh), all of which have applications in high-value markets
The distribution generated for “as received” sample shows presence of +40 and +50 mesh flakes, whose presence will open a number of alternative markets to Atlas Critical Minerals.
Atlas is encouraged to perform downstream test work which would prove viability of these materials in target market segments.
| |
| SGS Geological Services |
| S-K 1300 Technical Report – Malacacheta Graphite Project – Minas Gerais, Brazil | Page 66 |
| 11 | MINERAL RESOURCE ESTIMATES |
| 11.1 | Exploratory Data Analysis |
Atlas first transmitted the Malacacheta drill hole database to SGS on the 13th April, 2026, with the data available in Microsoft Excel .xlsx and .CSV format. The database has been regularly updated, typically on a weekly basis by Atlas. The database used for the MRE was updated on the 10th September, 2026 and comprises 21 drill holes with entries for:
| ● | Down hole surveys (n = 21) |
| ● | Assays (n = 2,452) |
| ● | Lithologies (n = 922) |
The database was validated upon importation in Genesis software, which enabled the correction of minor discrepancies between the table entries, surveys, and lithologies.
Vertical sections were generated oriented perpendicular to the interpreted strike of the schists, following the drilling pattern and the general trend of the lithologic unit. In general, the sections are spaced at 100 m intervals. Figure 11-1 is a drill collar location plan.
Figure 11-1 Malacacheta Drillhole Locations
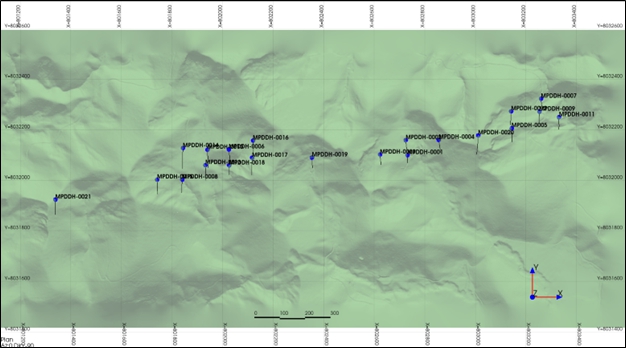
| 11.2 | Analytical Data |
There is a total of 2,452 graphitic carbon assay intervals in the database used for the Mineral Resource Estimates; 1,108 graphitic carbon assays are contained inside the interpreted mineralized solids.
| |
| SGS Geological Services |
| S-K 1300 Technical Report – Malacacheta Graphite Project – Minas Gerais, Brazil | Page 67 |
Table 11-1 shows the range of assay values from the analytical data, while Figure 11-2 is a histogram of graphitic carbon grade frequency.
Table 11-1 Malacacheta Assay Statistics Inside Mineralized Solid
|
Graphitic carbon (%) |
Carbon (%) |
Fe2O3 (%) |
S (%) | |
| Count | 1,108 | 1,107 | 889 | 1,108 |
| Mean | 5.29 | 5.61 | 6.55 | 1.48 |
| Std. Dev. | 3.82 | 3.99 | 3.93 | 1.15 |
| Min | 0.025 | 0.05 | 0.78 | 0.005 |
| Median | 4.77 | 4.96 | 5.81 | 1.67 |
| Max | 16.8 | 15.0 | 50.2 | 8.05 |
Figure 11-2 Graphitic Carbon Grade Frequency Plot
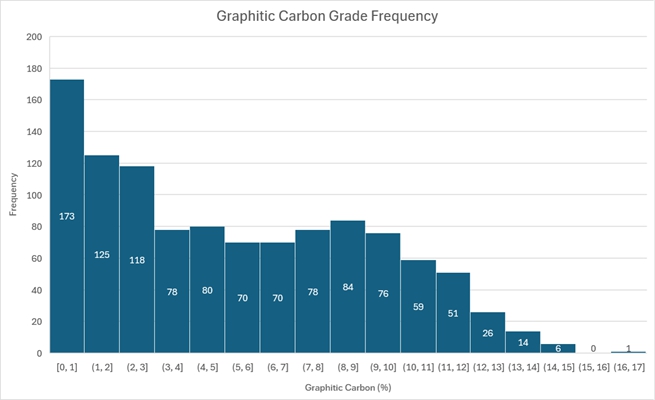
| 11.3 | Composite Data |
Block model grade interpolation was conducted on composited analytical data. A 1 m composite length was selected based on the average length of core sampling. Compositing began at the top of the mineralized wireframe and continued to the end of the mineralized wireframe. No capping was applied on the analytical composite data. Figure 11-3 is a frequency histogram of the sample lengths with the mineralized wireframes.
| |
| SGS Geological Services |
| S-K 1300 Technical Report – Malacacheta Graphite Project – Minas Gerais, Brazil | Page 68 |
Table 11-2 shows the grade statistics of the analytical composites used for the interpolation of the resource block model.
Table 11-2 Malacacheta 1 m Composite Statistics
|
graphitic carbon (%) |
Carbon (%) |
Fe2O3 (%) |
S (%) | |
| Count | 1,068 | 1,068 | 866 | 1,068 |
| Mean | 5.39 | 5.71 | 5.62 | 1.48 |
| Std. Dev. | 3.50 | 3.65 | 3.69 | 1.12 |
| Min | 0.025 | 0.05 | 0.78 | 0.005 |
| Median | 5.01 | 5.21 | 5.77 | 1.70 |
| Max | 15.56 | 15.0 | 31.62 | 6.55 |
Figure 11-3 Sample Length Frequency Histogram
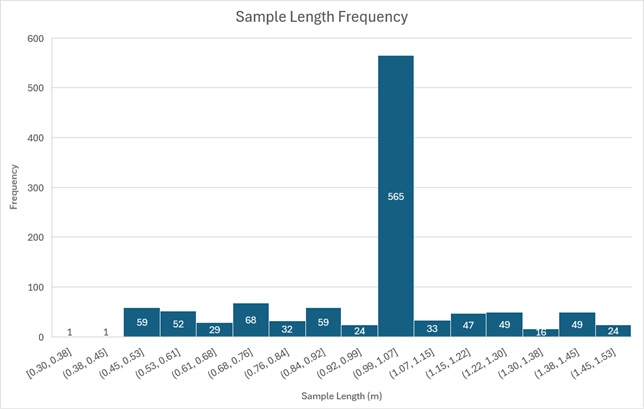
| 11.4 | High Grade Capping |
A statistical analysis of the composited data was undertaken to determine if there were any high-grade outlier assays which may affect the resource calculation. In certain situations, high grade assays left uncapped may introduce a local high-grade bias into the block model and disproportionately increase the average grade of the deposit.
| |
| SGS Geological Services |
| S-K 1300 Technical Report – Malacacheta Graphite Project – Minas Gerais, Brazil | Page 69 |
The composite data was investigated using statistical tables, histogram plots and log probability plots. The graphitic carbon grades were investigated in the analysis, which was conducted in Genesis and Excel.
After review, it was the QP’s opinion that capping of the graphitic carbon values was not required.
| 11.5 | Density |
Atlas has conducted density measurement on drill core for the duration of the exploration program. The density database contains a total of 620 density measurements across the lithological profile. The density was calculated using the water displacement method or Archimedes’ Principle.
Atlas calculated densities for the different mineralized horizons, namely the saprolite zone, transitional zone and the fresh rock zone. A total of 139 density determinations were calculated for graphitic schists across these three zones, with Table 11-3 showing the results.
Table 11-3 Density Values for Graphitic Schist
| Zone | Number of Samples | Average (g/cm3) |
| Saprolite | 34 | 1.8 |
| Transition | 69 | 2.18 |
| Fresh Rock | 36 | 2.3 |
| 11.6 | Geologic Interpretation |
SGS conducted the interpretation of the 3D wireframe solids of the mineralization based on the drill hole data. For the purpose of modelling, sections looking east for Blocks 1, 2 and 3 were generated every 100 m. The modelling was first completed on sections to define mineralized shapes using the lithology and graphite analytical data. A minimum grade of 1.0% graphitic carbon over a minimum drill hole interval length of 1.0 m was generally used as a guideline to define the width of the mineralized shapes, together with the lithological logs. The final 3D wireframe model (solid) was constructed by linking the defined mineralized shapes based on the geological interpretation.
Three weathering surfaces were constructed from drillhole logging data to define the weathering profile and subdivide the geological model into Saprolite, Transition, and Fresh Rock domains. The mineralized solids were clipped directly on the LiDAR topographic surface.
| |
| SGS Geological Services |
| S-K 1300 Technical Report – Malacacheta Graphite Project – Minas Gerais, Brazil | Page 70 |
Figure 11-4 shows the geological interpretation of the mineralization, with the individual lenses shown in different colours and Figure 11-5 is a cross-section through Block 3 showing the individual lenses.
Figure 11-4 Malacacheta Graphitic Schist Solids
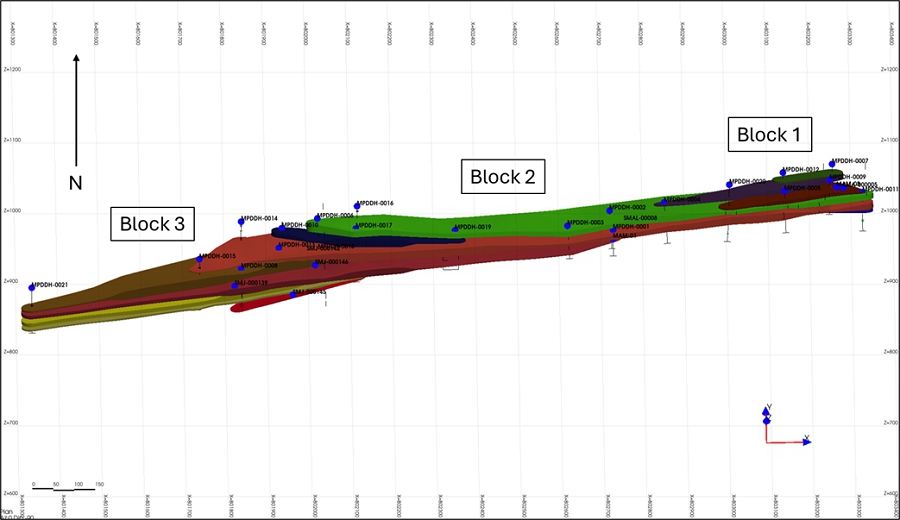
Figure 11-5 Cross-Section through Block 3 Looking East
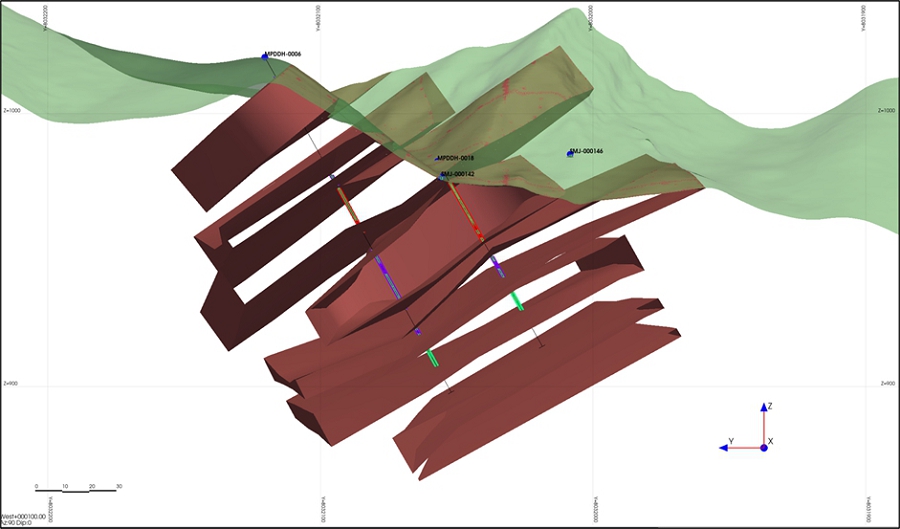
| |
| SGS Geological Services |
| S-K 1300 Technical Report – Malacacheta Graphite Project – Minas Gerais, Brazil | Page 71 |
| 11.7 | Resource Block Modelling |
A block size of 5 m (north–south) by 5 m (west–east) by 2.5 m (vertical) was selected for all the block models. This was based on drill hole spacing, width and general geometry of the modelled mineralization. No rotation was applied to the block models. Separate block models with identical origins were created for each of the mineralized zones.
Table 11-4 summarizes the block model limit parameters.
Table 11-4 Block Model Parameters for Blocks 1, 2 and 3
| Origin | 800901 | 8031751 | 794 |
| Corner Origin | 800898.5 | 8031748.5 | 792.75 |
| Block Size | 5 | 5 | 2.5 |
| Discretization | 4 | 4 | 4 |
| Starting Coordinate | 800901 | 8031751 | 794 |
| Ending Coordinate | 803766 | 8032431 | 1074 |
| Starting Index | 1 | 1 | 1 |
| Ending Index | 574 | 137 | 113 |
| 11.8 | Block Model Interpretation |
The composite data was analysed using variography, but the variograms created were not of sufficient quality for geostatistical analysis.
In place of the variographic analysis, search ellipse ranges were determined based on the drill hole spacing and the size and orientation of the deposit. The search ranges are summarised in Table 11-5 and shown in Figure 11-6.
The grade interpolation for the Malacacheta resource block model was completed using an inverse distance weighting to the second power (ID2) methodology. The inverse distance squared weighting method assigns a grade to each block in the block model, without the necessity of a sample being within the block volume. With the ID2 method, the grade, thickness, or any other value for the sample is adjusted by the inverse of the distance to the sample, squared. All adjusted sample weights are summed, then divided by the sum of the inverse distances. Closer samples are given greater weight than samples farther away.
Variable search ellipse orientations were used to interpolate the blocks. The general dip of the mineralized outline was modelled on each section and then interpolated in each block. During the interpolation process, the search ellipse was orientated based on the interpolation direction of each block, hence better representing the local dip and orientation of the mineralization.
Grades were interpolated into blocks using criteria determined for the deposit, using two interpolation passes. For the first pass, an ellipse of radius 150 m (x) x 150 m (y) by 50 m (z) was used, with a minimum of 5 composites and a maximum of 15 composites used to inform any block. A maximum of 2 composites per drill hole was allowed in the first pass, with a minimum of 3 holes necessary to calculate the grade. Pass 2 used an ellipse with a radius of 300 m (x) x 300 m (y) x 100 m (z), with a minimum of 2 composites from any drill hole.
Each weathering domain was assigned a distinct bulk density based on Table 8-1 values.
Once complete, the block models were cut to the topographic surface and the tenement boundaries.
| |
| SGS Geological Services |
| S-K 1300 Technical Report – Malacacheta Graphite Project – Minas Gerais, Brazil | Page 72 |
Figure 11-7 shows the results of the block model interpolations for Block 1, Block 2 and Block 3.
Table 11-5 Search Ellipse Ranges
| Name | Azimuth (Degrees) | Dip (Degrees) |
Ellipsoid X-Y-Z (m) |
Minimum Composites | Maximum Composites | Maximum composites / DDH | Minimum DDH |
| Pass 1 Block 1 & 2 | 180 | -45 | 150 x 150 x 50 | 5 | 15 | 2 | 3 |
| Pass 1 Block 3 | 160 | -30 | 150 x 150 x 50 | 5 | 15 | 2 | 3 |
| Pass 2 Blocks 1, 2 & 3 | 160 | -30 | 300 x 300 x 100 | 2 | 15 | - | 1 |
Figure 11-6 Search Ellipse Orientations
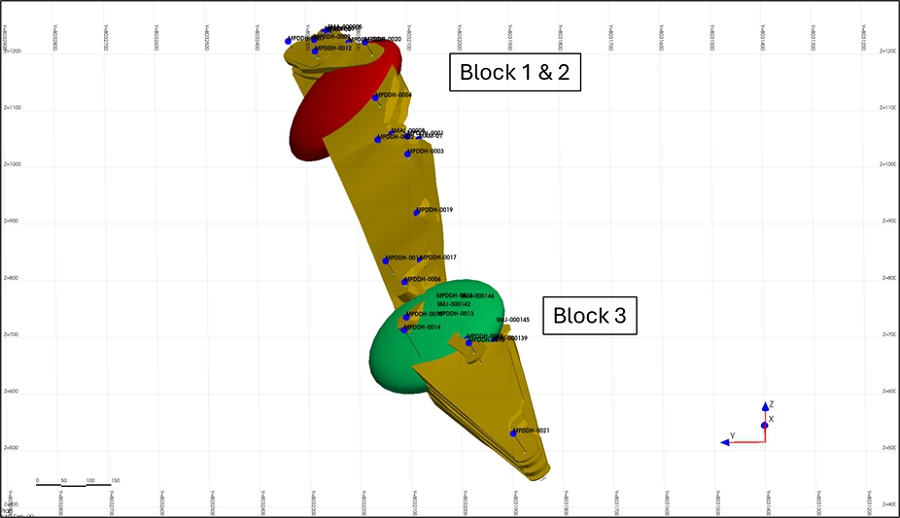
| |
| SGS Geological Services |
| S-K 1300 Technical Report – Malacacheta Graphite Project – Minas Gerais, Brazil | Page 73 |
Figure 11-7 Malacacheta Interpolated Block Model showing Graphitic Carbon Grades
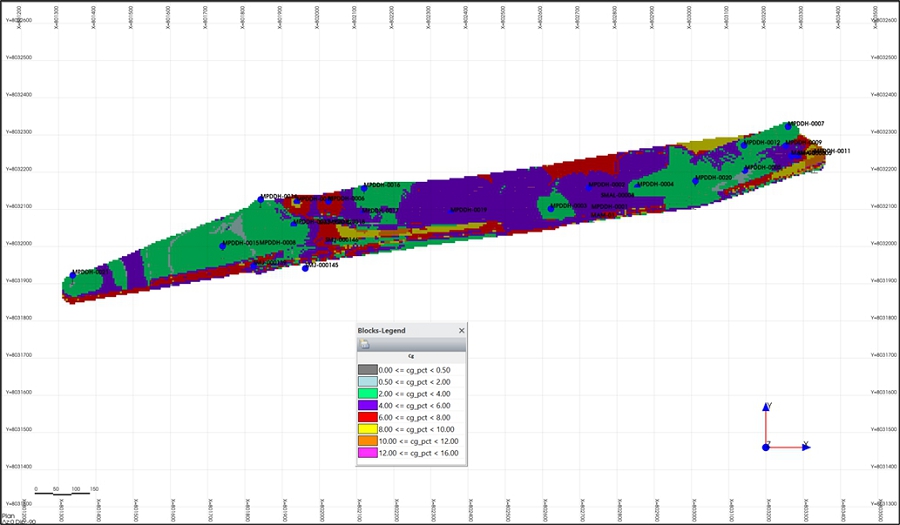
| 11.9 | Block Model Validation |
To validate the interpolation process, the block model grades were compared statistically to the assay and composite grades. The distribution of the assays, composites and blocks are normal (gaussian) and show similar average values with decreasing levels of variance (Table 11-6 and Figure 11-8). The assays and composites have average values of 5.22 Cg% and 5.32 Cg% with variances of 14.66 and 12.43 respectively. The interpolated blocks have an average value of 5.34 Cg% with a variance of 4.75. The decrease in variance from assays through composites to interpolated blocks is indicative of smoothing of grade and is expected in the block modelling process.
The scatterplot of composite grades versus block model grades (Figure 11-9) has an R2 value of 0.6139411, suggesting a good correlation between the composite and block model grades.
Table 11-6 Comparison of Assays, Composites and Block Model for Malacacheta
| Malacacheta Assays | Malacacheta Composites | Malacacheta Block Model | |
| Min Value | 0.03 | 0.03 | 0.06 |
| Max Value | 16.80 | 15.56 | 15.06 |
| Average | 5.22 | 5.32 | 5.34 |
| Variance | 14.66 | 12.43 | 4.75 |
| Standard Deviation | 3.83 | 3.53 | 2.18 |
| % Variation | 73.3% | 66.2% | 40.8% |
| Median | 4.68 | 4.92 | 5.28 |
| Count | 1,12 | 1,08 | 269,998 |
| |
| SGS Geological Services |
| S-K 1300 Technical Report – Malacacheta Graphite Project – Minas Gerais, Brazil | Page 74 |
Figure 11-8 Graphitic Carbon Frequency Histogram
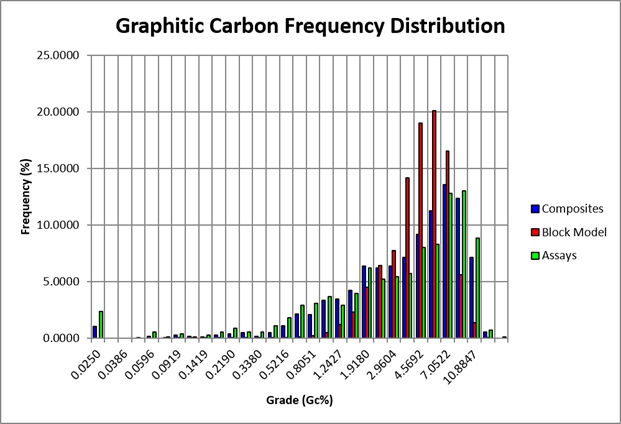
| |
| SGS Geological Services |
| S-K 1300 Technical Report – Malacacheta Graphite Project – Minas Gerais, Brazil | Page 75 |
Figure 11-9 Graphitic Carbon Block Model versus Composites
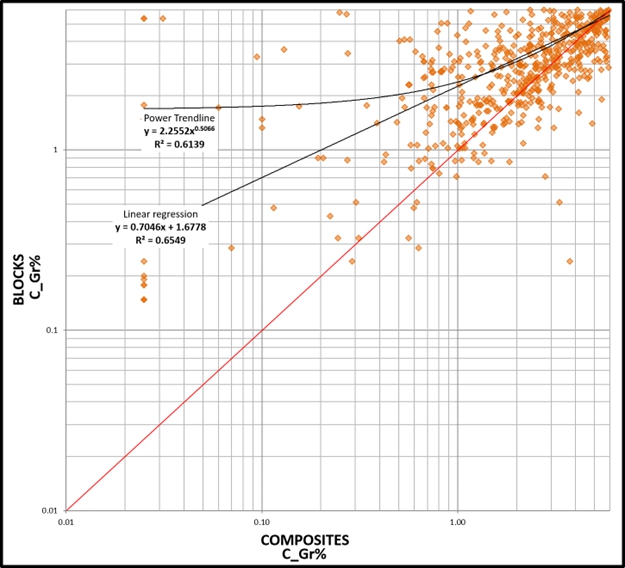
| Line | Purpose | Explanations |
| 1:1 Line (Equality Line) | Reference line where block grades equal sample grades. | Measures agreement between the model and the data. |
| Linear Regression Line | Best-fit straight line through the points. | Measures overall correlation, bias, and smoothing. |
| Power Regression Line | Best-fit curved line through the points. | Measures non-linear relationships and smoothing effects over a wide range of grades. |
The linear and power regressions both show that the block model reproduces the overall grade trend reasonably well but exhibits moderate smoothing of grade variability.
| |
| SGS Geological Services |
| S-K 1300 Technical Report – Malacacheta Graphite Project – Minas Gerais, Brazil | Page 76 |
Figure 11-10 Swath Plot X Direction
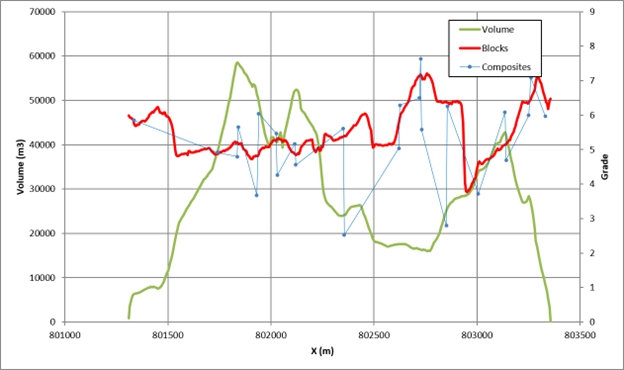
Figure 11-11 Swath Plot Y Direction
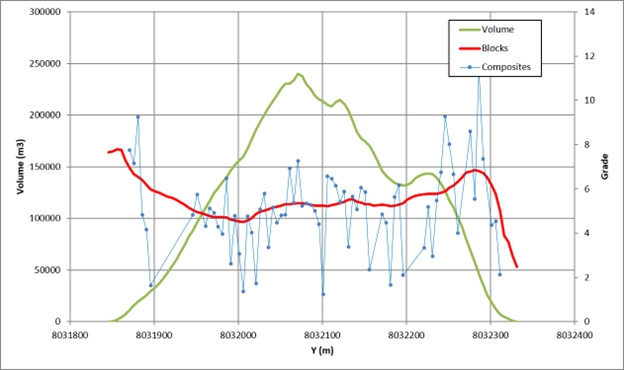
| |
| SGS Geological Services |
| S-K 1300 Technical Report – Malacacheta Graphite Project – Minas Gerais, Brazil | Page 77 |
Figure 11-12 Swath Plot Z Direction
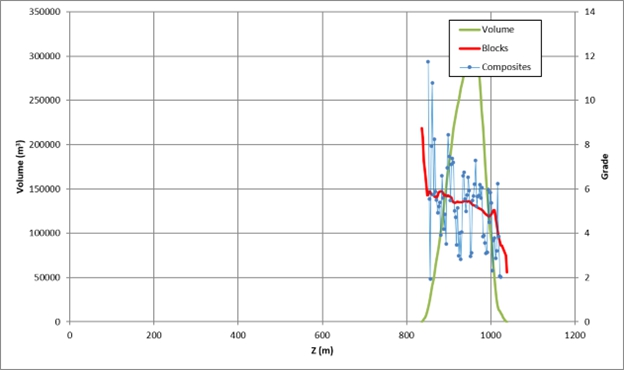
Swath plots are local validation tools used to assess the quality and reliability of a spatial estimation or block model. It slices a 3D project area into directional bands (“swaths”) along specific geographical axes (usually Easting, Northing, and Elevation). Point density is determined by the quantity of block
| 11.10 | Mineral Resource Classification |
The MRE for the Malacacheta deposit is prepared and disclosed in compliance with all current disclosure requirements for mineral resources set out in the US Securities and Exchange Commission Regulation S-K, 17 CFR Part 229, Item 1300, otherwise known as S-K 1300. The classification of the current MRE is consistent with the definitions defined in Regulation S-K, 17 CFR 229.1300 (Item 1300) Definitions.
Mineral Resources are sub-divided, in order of increasing geological confidence, into Inferred, Indicated and Measured categories. An Inferred Mineral Resource has a lower level of confidence than that applied to an Indicated Mineral Resource. An Indicated Mineral Resource has a higher level of confidence than an Inferred Mineral Resource but has a lower level of confidence than a Measured Mineral Resource.
A Mineral Resource is a concentration or occurrence of solid material of economic interest in or on the Earth’s crust in such form, grade or quality and quantity that there are reasonable prospects for eventual economic extraction.
Interpretation of the word ‘eventual’ in this context may vary depending on the commodity or mineral involved. For example, for some coal, iron, potash deposits, and other bulk minerals or commodities, it may be reasonable to envisage ‘eventual economic extraction’ as covering time periods in excess of 50 years. However, for many graphite deposits, application of the concept would normally be restricted to perhaps 10 to 15 years, and frequently to much shorter periods of time.
The location, quantity, grade or quality, continuity and other geological characteristics of a Mineral Resource are known, estimated or interpreted from specific geological evidence and knowledge, including sampling.
| |
| SGS Geological Services |
| S-K 1300 Technical Report – Malacacheta Graphite Project – Minas Gerais, Brazil | Page 78 |
Inferred Mineral Resource
In Inferred Mineral Resource is that part of a Mineral Resource for which quantity and grade or quality are estimated on the basis of limited geological evidence and sampling. Geological evidence is sufficient to imply but not verify geological and grade or quality continuity.
An Inferred Mineral Resource has a lower level of confidence than that applying to an Indicated Mineral Resource and must not be converted to a Mineral Reserve. It is reasonably expected that the majority of Inferred Mineral Resources could be upgraded to Indicated Mineral Resources with continued exploration.
An Inferred Mineral Resource is based on limited information and sampling gathered through appropriate sampling techniques from locations such as outcrops, trenches, pits, workings and drill holes. Inferred Mineral Resources must not be included in the economic analysis, production schedules, or estimated mine life in publicly disclosed Pre-Feasibility or Feasibility Studies, or in the Life of Mine plans and cash flow models of developed mines. Inferred Mineral Resources can only be used in economic studies as provided under S-K 1300.
Indicated Mineral Resource
An ‘Indicated Mineral Resource’ is that part of a Mineral Resource for which quantity, grade or quality, densities, shape and physical characteristics can be estimated with a level of confidence sufficient to allow the appropriate application of technical and economic parameters, to support mine planning and evaluation of the economic viability of the deposit.
Geological evidence is derived from adequately detailed and reliable exploration, sampling and testing and is sufficient to assume geological and grade or quality continuity between points of observation.
An Indicated Mineral Resource has a lower level of confidence than that applying to a Measured Mineral Resource and may only be converted to a Probable Mineral Reserve.
Mineralization may be classified as an Indicated Mineral Resource by the QP when the nature, quality, quantity and distribution of data are such as to allow confident interpretation of the geological framework and to reasonably assume the continuity of mineralization. The QP must recognise the importance of the Indicated Mineral Resource category to the advancement of the feasibility of the project. An Indicated Mineral Resource Estimate is of sufficient quality to support a Preliminary Feasibility Study which can serve as the basis for major development decisions.
Measured Mineral Resource
A Measured Mineral Resource is that part of a Mineral Resource for which quantity, grade or quality, densities, shape, and physical characteristics are estimated with confidence sufficient to allow the application of Modifying Factors to support detailed mine planning and final evaluation of the economic viability of the deposit.
Geological evidence is derived from detailed and reliable exploration, sampling, and testing and is sufficient to confirm geological and grade or quality continuity between points of observation.
A Measured Mineral Resource has a higher level of confidence than that applying to either an Indicated Mineral Resource or an Inferred Mineral Resource.
It may be converted to a Proven Mineral Reserve or to a Probable Mineral Reserve. Mineralization or other natural material of economic interest may be classified as a Measured Mineral Resource by the QP when the nature, quality, quantity, and distribution of data are such that the tonnage and grade or quality of the mineralization can be estimated to within close limits and that variation from the estimate would not significantly affect potential economic viability of the deposit. This category requires a high level of confidence in, and understanding of, the geology and controls of the mineral deposit.
| |
| SGS Geological Services |
| S-K 1300 Technical Report – Malacacheta Graphite Project – Minas Gerais, Brazil | Page 79 |
There may be circumstances, where appropriate sampling, testing, and other measurements are sufficient to demonstrate data integrity, geological and grade/quality continuity of a Measured or Indicated Mineral Resource, however, quality assurance and quality control, or other information may not meet all industry norms for the disclosure of an Indicated or Measured Mineral Resource. Under these circumstances, it may be reasonable for the QP to report an Inferred Mineral Resource if the QP has taken steps to verify the information meets the requirements of an Inferred Mineral Resource.
For the resource classification for Malacacheta, a block was classified as Indicated if the block was estimated on the first pass of the search ellipse, namely using a minimum of three drillholes and five samples follow by a manual classification adjustment. All other blocks were classified as Inferred.
Figure 11-13 shows the classified block model.
Figure 11-13 Malacacheta Classified Block Model
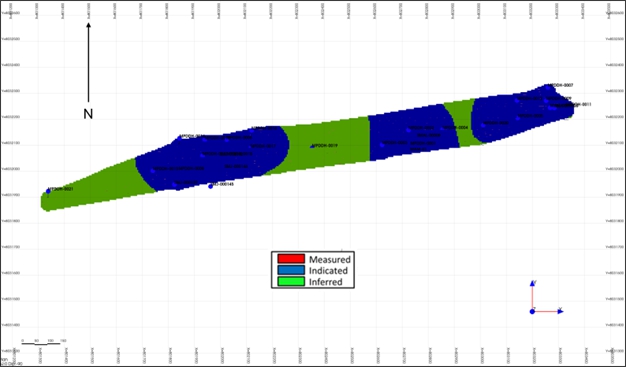
| 11.11 | Reasonable Prospects for Eventual Economic Extraction |
The general requirement that all mineral resources have “reasonable prospects for eventual economic extraction” implies that the quantity and grade estimates meet certain economic thresholds and that the mineral resources are reported at an appropriate cut-off grade taking into account extraction scenarios and processing recoveries. In order to meet this requirement, the mineralization at the Malacacheta deposit is considered amenable to open pit extraction mining.
To determine the quantity of material representing “reasonable prospects for eventual economic extraction” by an open pit mining method, a pit optimization was run on the model. The pit optimization parameters used are summarized in Table 11-7. A conservative and balanced approach was applied when optimizing the open pit scenario. A pit shell at a revenue factor of 1.0 was selected as the ultimate pit shell for the purposes of the MRE for the Malacacheta deposit.
| |
| SGS Geological Services |
| S-K 1300 Technical Report – Malacacheta Graphite Project – Minas Gerais, Brazil | Page 80 |
Figure 11-14 shows the optimized pit with the full block model.
The reader is cautioned that the results from the pit optimization are used solely for the purpose of testing the “reasonable prospects for economic extraction” by an open pit and do not represent an attempt to estimate mineral reserves. The results are used as a guide to assist in the preparation of a mineral resource statement and to select an appropriate resource reporting cut-off grade.
Table 11-7 Malacacheta Open Pit Optimization Cut-Off Parameters
| Parameter | Unit | Value |
| Average Graphite Concentrate Price | US$ per tonne | $1,300 |
| Pit Slope | Degrees | 60 |
| Mining Cost (Pit) | US$ per tonne mined | $2.60 |
| Processing Cost (incl. Trucking & G&A) | US$ per tonne milled | $18.00 |
| Recovery | Percent (%) | 90 |
| Mining loss / Dilution | Percent (%) / Percent (%) | 5/5 |
| Cut-off Grade (Pit) | Cg% | 2.0 |
Figure 11-14 Malacacheta Deposit Open Pit
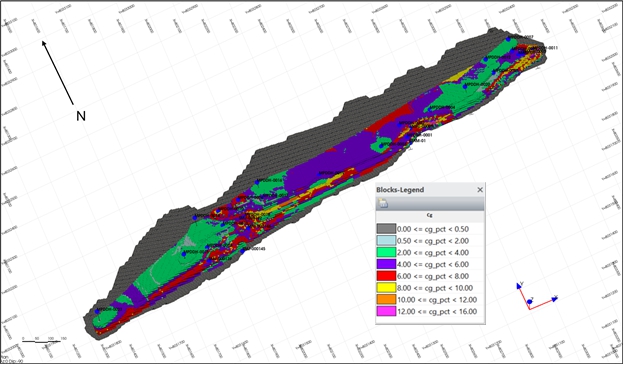
| 11.12 | Mineral Resource Estimate |
The combined Mineral Resource Estimate for Malacacheta is reported in Table 11-8 using a 2.0% graphitic carbon cut-off and is reported exclusive of Mineral Reserves. The Mineral Resources are constrained by the topography. The estimate has an effective date of the 14th September 2026.
| |
| SGS Geological Services |
| S-K 1300 Technical Report – Malacacheta Graphite Project – Minas Gerais, Brazil | Page 81 |
Table 11-8 Combined Malacacheta Mineral Resource Estimate at 2.0% Graphitic Carbon
|
Cut-off Grade Graphitic carbon (%) |
Category | Tonnage (Mt) |
Average Grade Graphitic carbon (%) |
| 2.0 | Indicated | 17.2 | 5.73 |
| 2.0 | Inferred | 7.0 | 5.40 |
Notes to accompany Mineral Resource tables:
| 1. | The effective date of the Malacacheta Mineral Resource Estimate is the September 14, 2026. | |
| 2. | The mineral resource was estimated by Marc-Antoine Laporte, P.Geo. of SGS Geological Services and is an independent Qualified Person as defined in Item 1300 of regulation S-K. | |
| 3. | The classification of the current Mineral Resource Estimate into Indicated and Inferred mineral resources is consistent with the definitions set forth in Item 1300 of Regulation S-K and Subpart 1300 of Regulation S-K. | |
| 4. | Figures are rounded to reflect the relative accuracy of the estimate and numbers may not add due to rounding. | |
| 5. | The mineral resources are presented undiluted and in situ, constrained by continuous 3D wireframe models, and is considered to have reasonable prospects for eventual economic extraction. | |
| 6. | Mineral resources which are not mineral reserves do not have demonstrated economic viability. An Inferred Mineral Resource has a lower level of confidence than that applying to an Indicated Mineral Resource and must not be converted to a Mineral Reserve. It is reasonably expected that most Inferred Mineral Resources could be upgraded to Indicated Mineral Resources with continued exploration. | |
| 7. | The Malacacheta mineral resource estimate is based on a validated database which includes data from surface diamond drilling completed in 2026. | |
| 8. | Grades for graphitic carbon were estimated using 1.0 metre composites. To generate grade within the blocks, the inverse distance squared (ID2) interpolation method was used. The SG of the deposit was classified as either saprolite, transition or fresh rock zones. | |
| 9. | Based on the location, surface exposure, size, shape, general true thickness, and orientation, it is envisioned that the Malacacheta deposit may be mined using open-pit mining methods. In-pit mineral resources are reported at a base case cut-off grade of 2% graphitic carbon (Cg) The in-pit resource grade blocks are quantified above the base case cut-off grade, above the constraining pit shell, below topography and within the constraining mineralized domain (the constraining volume). | |
| 10. | The pit optimization and base-case cut-off grade consider a Cg concentrate price of $1,300/t and considers a Cg recovery of 90%. The pit optimization and base case cut-off grade also considers a mining cost of US$2.60/t mined, pit slope of 60⁰ degrees, and processing, treatment, refining, G&A and transportation cost of USD$18.00/t of mineralized material. | |
| 11. | The results from the pit optimization are used solely for the purpose of testing the “reasonable prospects for economic extraction” by an open pit and do not represent an attempt to estimate mineral reserves. There are no mineral reserves on the Property. The results are used simply as a guide to assist in the preparation of a mineral resource statement and to select an appropriate resource reporting cut-off grade. A pit shell at a revenue factor of 1.00 was selected as the ultimate pit shell for the purposes of the current MRE. | |
| 12. | The estimate of Mineral Resources may be materially affected by environmental, permitting, legal, title, taxation, socio-political, marketing, or other relevant issues. |
| |
| SGS Geological Services |
| S-K 1300 Technical Report – Malacacheta Graphite Project – Minas Gerais, Brazil | Page 82 |
| 12 | MINERAL RESERVE ESTIMATES |
There are no Mineral Reserve Estimates on this Project.
| |
| SGS Geological Services |
| S-K 1300 Technical Report – Malacacheta Graphite Project – Minas Gerais, Brazil | Page 83 |
| 13 | MINING METHODS |
This section is not relevant to this Report.
| |
| SGS Geological Services |
| S-K 1300 Technical Report – Malacacheta Graphite Project – Minas Gerais, Brazil | Page 84 |
| 14 | PROCESSING AND RECOVERY METHODS |
This section is not relevant to this Report.
| |
| SGS Geological Services |
| S-K 1300 Technical Report – Malacacheta Graphite Project – Minas Gerais, Brazil | Page 85 |
| 15 | INFRASTRUCTURE |
This section is not relevant to this Report.
| |
| SGS Geological Services |
| S-K 1300 Technical Report – Malacacheta Graphite Project – Minas Gerais, Brazil | Page 86 |
| 16 | MARKET STUDIES |
This section is not relevant to this Report.
| |
| SGS Geological Services |
| S-K 1300 Technical Report – Malacacheta Graphite Project – Minas Gerais, Brazil | Page 87 |
| 17 | ENVIRONMENTAL STUDIES, PERMITTING, AND PLANS, NEGOTIATIONS, OR AGREEMENTS WITH LOCAL INDIVIDUALS OR GROUPS |
This section is not relevant to this Report.
| |
| SGS Geological Services |
| S-K 1300 Technical Report – Malacacheta Graphite Project – Minas Gerais, Brazil | Page 88 |
| 18 | CAPITAL AND OPERATING COSTS |
This section is not relevant to this Report.
| |
| SGS Geological Services |
| S-K 1300 Technical Report – Malacacheta Graphite Project – Minas Gerais, Brazil | Page 89 |
| 19 | ECONOMIC ANALYSIS |
This section is not relevant to this Report.
| |
| SGS Geological Services |
| S-K 1300 Technical Report – Malacacheta Graphite Project – Minas Gerais, Brazil | Page 90 |
| 20 | ADJACENT PROPERTIES |
There is no information on properties adjacent to the Project necessary to make the TRS understandable and not misleading.
| |
| SGS Geological Services |
| S-K 1300 Technical Report – Malacacheta Graphite Project – Minas Gerais, Brazil | Page 91 |
| 21 | OTHER RELEVANT DATA AND INFORMATION |
No other information or explanation is necessary to make this TRS understandable and not misleading.
| |
| SGS Geological Services |
| S-K 1300 Technical Report – Malacacheta Graphite Project – Minas Gerais, Brazil | Page 92 |
| 22 | INTERPRETATION AND CONCLUSIONS |
SGS Geological Services Inc. (“SGS”) was contracted by Atlas Critical Minerals Corporation to complete a Mineral Resource Estimate (MRE) for tenement 830.954/2021 of the Malacacheta Graphite Project near the city of Teófilo Otoni, Brazil, and to prepare a Public Report in accordance with the §§ 229.601(b)(96) Technical report (subpart 229.1300 of Regulation S-K) written in support of the MRE on the Malacacheta Project.
This TRS conforms to the United States Securities and Exchange Commission’s (SEC) Modernized Property Disclosure Requirements for Mining Registrants as described in Subpart 229.1300 of Regulation S-K, Disclosure by Registrants Engaged in Mining Operations (S-K 1300) and Item 601 (b)(96) Technical Report Summary.
Initial exploration started in 2023, and Atlas Critical Minerals identified surface outcrops with visible graphite, delineated mineralized bodies, and established a primary structural trend. Rock samples were collected (nine samples) providing strong indications of the project’s potential.
Further exploration was undertaken in 2024, which expanded the understanding of the Malacacheta Project’s mineral potential. Atlas Critical Minerals systematically mapped and described 43 new points, paying close attention to surface exposures and sub-surface features. A comprehensive sampling program was completed, with 17 samples of graphite schist and mica-schist with graphite collected from the two exploration permit areas.
Detailed mapping and surface sampling was conducted in 2025, while an induced polarization (IP) survey and diamond drilling was undertaken in 2026.
| 22.1 | Mineral Resource Estimates |
Mineral resources have been estimated for three blocks of graphitic carbon in the Malacacheta deposit.
Mineral Resources for Malacacheta were estimated using a computerized resource block model. Three-dimensional wireframe solids of the mineralization were defined using drill hole graphitic carbon analytical data.
A 1 m composite length was selected based on the average length of core sampling. Compositing starts at the identified mineralized contact. No capping was applied on the analytical composite data.
The Mineral Resource Estimates (MREs) were calculated using an inverse distance weighting to the second power (ID2) methodology.
The combined Mineral Resource Estimate for Malacacheta is reported in Table 22-1. The Mineral Resource Estimates are constrained by the topography.
Mineral Resources are reported exclusive of Mineral Reserves.
The estimate has an effective date of the 14th September 2026.
| |
| SGS Geological Services |
| S-K 1300 Technical Report – Malacacheta Graphite Project – Minas Gerais, Brazil | Page 93 |
Table 22-1 Combined Malacacheta Mineral Resource Estimate at 2.0% Graphitic Carbon
|
Cut-off Grade Graphitic carbon (%) |
Category | Tonnage (Mt) |
Average Grade Graphitic carbon (%) |
| 2.0 | Indicated | 17.2 | 5.73 |
| 2.0 | Inferred | 7.0 | 5.40 |
Notes to accompany Mineral Resource tables:
| 1. | The effective date of the Malacacheta Mineral Resource Estimate is the September 14, 2026. | |
| 2. | The mineral resource was estimated by Marc-Antoine Laporte, P.Geo. of SGS Geological Services and is an independent Qualified Person as defined in Item 1300 of regulation S-K. | |
| 3. | The classification of the current Mineral Resource Estimate into Indicated and Inferred mineral resources is consistent with the definitions set forth in Item 1300 of Regulation S-K and Subpart 1300 of Regulation S-K. | |
| 4. | Figures are rounded to reflect the relative accuracy of the estimate and numbers may not add due to rounding. | |
| 5. | The mineral resources are presented undiluted and in situ, constrained by continuous 3D wireframe models, and is considered to have reasonable prospects for eventual economic extraction. | |
| 6. | Mineral resources which are not mineral reserves do not have demonstrated economic viability. An Inferred Mineral Resource has a lower level of confidence than that applying to an Indicated Mineral Resource and must not be converted to a Mineral Reserve. It is reasonably expected that most Inferred Mineral Resources could be upgraded to Indicated Mineral Resources with continued exploration. | |
| 7. | The Malacacheta mineral resource estimate is based on a validated database which includes data from surface diamond drilling completed in 2026. | |
| 8. | Grades for graphitic carbon were estimated using 1.0 metre composites. To generate grade within the blocks, the inverse distance squared (ID2) interpolation method was used. The SG of the deposit was classified as either saprolite, transition or fresh rock zones. | |
| 9. | Based on the location, surface exposure, size, shape, general true thickness, and orientation, it is envisioned that the Malacacheta deposit may be mined using open-pit mining methods. In-pit mineral resources are reported at a base case cut-off grade of 2% graphitic carbon (Cg) The in-pit resource grade blocks are quantified above the base case cut-off grade, above the constraining pit shell, below topography and within the constraining mineralized domain (the constraining volume). | |
| 10. | The pit optimization and base-case cut-off grade consider a Cg concentrate price of $1,300/t and considers a Cg recovery of 90%. The pit optimization and base case cut-off grade also considers a mining cost of US$2.60/t mined, pit slope of 60⁰ degrees, and processing, treatment, refining, G&A and transportation cost of USD$18.00/t of mineralized material. | |
| 11. | The results from the pit optimization are used solely for the purpose of testing the “reasonable prospects for economic extraction” by an open pit and do not represent an attempt to estimate mineral reserves. There are no mineral reserves on the Property. The results are used simply as a guide to assist in the preparation of a mineral resource statement and to select an appropriate resource reporting cut-off grade. A pit shell at a revenue factor of 1.00 was selected as the ultimate pit shell for the purposes of the current MRE. | |
| 12. | The estimate of Mineral Resources may be materially affected by environmental, permitting, legal, title, taxation, socio-political, marketing, or other relevant issues. |
| |
| SGS Geological Services |
| S-K 1300 Technical Report – Malacacheta Graphite Project – Minas Gerais, Brazil | Page 94 |
| 23 | RECOMMENDATIONS |
Atlas Critical Minerals identified significant graphite schist bodies within tenement 830.954/2021 and have completed a diamond drill campaign to better define the extents of the graphite mineralization. At this stage, the deposit remains open along strike and at depth.
Given the prospective nature of the Malacacheta Deposit, it is the QP’s opinion that the Project merits further exploration. The QP is recommending Atlas continue further drilling, subject to funding and any other matters which may cause the proposed exploration program to be altered in the normal course of its business activities or alterations which may affect the program as a result of exploration activities themselves. This drilling would extend the limits of the deposit and upgrade the resource classification of the deposit.
The QP further recommends that Atlas undertake a metallurgical study on the graphitic schist to better understand the nature of the mineralization and the potential recoveries of graphitic material from the deposit.
| |
| SGS Geological Services |
| S-K 1300 Technical Report – Malacacheta Graphite Project – Minas Gerais, Brazil | Page 95 |
| 24 | REFERENCES |
Almeida, F. F. M., 1984. Fundamentos geológicos do Brasil. São Paulo: Instituto de Geociências da USP. 422 p.
Bizzi LA, Schobbenhaus C., Vidotti RM, Goncalves JH (eds.), 2003. Geology, Tectonics and Mineral Resources of Brazil. Geological Survey of Brazil – CPRM, Brasília.
Brazilian Institute of Geography and Statistics (IBGE). (2022). 2022 Demographic Census. https://www.ibge.gov.br/estatisticas/sociais/populacao/22827-censo-demografico-2022.html
Castro, N. A., 2014. Evolução geotectônica da Formação Capelinha, Grupo Macaúbas, na região de Capelinha-MG: implicações para a margem leste do Orógeno Araçuaí. 2014. Tese (Doutorado) – Universidade Federal de Minas Gerais, Belo Horizonte.
Degler, R., Pedrosa-Soares, A., Novo, T., Tedeschi, M., Silva, L.C., Dussin, I., Lana, C., 2018. Rhyacian-Orosirian isotopic records from the basement of the Araçuaí-Ribeira orogenic system (SE Brazil): links in the Congo-São Francisco palaeocontinent. Precambrian Res. 317, 179–195.
Ferreira, F., Lagoeiro, L., Morales, L.F.G., de Oliveira, C.G., Barbosa, P., Avila, C. And Cavacante, G.C.G., 2016. Texture development during progressive deformation of hematite aggregates: Constraints from VPSC models and naturally deformed iron oxides from Minas Gerais, Brazil. Journal of Structural Geology, 90, Pp 111-127.
Fundação SOS Mata Atlântica, & Instituto Nacional de Pesquisas Espaciais (INPE). (2024). Atlas of the remaining forests of the Atlantic Forest: 2022–2023 period. http://mtc-m21d.sid.inpe.br/col/sid.inpe.br/mtc-m21d/2024/09.09.13.41/doc/Atlas_Mata_Atlantica_2022-2023.pdf
Koeppen, W., 1936. Das geographische System der Klimate, Handbuch der Klimatologie [The Geographical System of the Climate, Handbook of Climatology]. Borntraeger, Berlin, Bd. 1, Teil. C.
Muller, G., Hohndorf, A., Lauenstein, H.J. and Lenz, H., 1986. Petrological and Geochemical data on a high-metamporphic Archaen BIF-bearing rock sequence near Guanhaes, Minas Gerais, Brazil. Geol. Jb., 3-20.
Noce, C.M., Pedrosa-Soares, A.C., da Silva, L.C., Armstrong, R. and Piuzana, D., 2007. Evolution of polycyclic basement complexes in the Araçuaí Orogen, based on U–Pb SHRIMP data: Implications for Brazil–Africa links in Paleoproterozoic time.
Pedrosa-Soares, A. C.; Wiedmann-Leme, M. R., 2000. The Araçuaí-West Congo Orogen in Brazil and Africa: opposite sides of the same orogen. Revista Brasileira de Geociências, v. 30, n. 1, p. 192–195.
Pedrosa-Soares, A.C., Noce, C.M., Wiedemann, C.M. and Pinto, C.P., 2001. The Aracuaí - West-Congo Orogen in Brazil: an overview of a confined orogen formed during Gondwanaland assembly. Precambrian Research 110, Pp 307-323.
Pedrosa-Soares, A. C. and Wiedemann-Leonardos C. M., 2000. Evolution of the Araçuaí Belt and its connection to the Ribeira Belt, Eastern Brazil. In: CORDANI UG, MILANI EJ, THOMAZ FşA AND CAMPOS DA (ed.) Tectonic Evolution of South America. Rio de Janeiro: SBG, p. 265-285.
Pedrosa-Soares, A. C., Noce, C.M., Alkmim, F. F., Silva, L. C., Babinski, M., Cordani, U., Castañeda, C. 2007. Orógeno Araçuaí: síntese do conhecimento 30 anos após Almeida 1977. Geonomos, 15 (1): 1-16.
Queiroga, G. N.; et al., 2007. Geochemistry and geochronology of an ophiolitic complex in the Ribeirão da Folha Formation, Araçuaí Belt, Brazil: implications for the Neoproterozoic tectonic evolution of the Western Gondwana margin. Precambrian Research, v. 156, p. 125–152.
Silva J, Rodrigues C, Pereira D (2015) Mapping and analysis of geodiversity indices in the Xingu River Basin, Amazônia, Brazil. Geoheritage 7:337–350.
Trompette, R., 1994. Neoproterozoic (Brazilian) orogenic belts of Africa and South America and their bearing on the Pan-African orogenic system. In: DALY, M. C. et al. (ed.). Africa geology and resources. Geological Society, London, Special Publications, v. 95, p. 67–92.
| 25 | RELIANCE ON INFORMATION PROVIDED BY THE REGISTRANT |
There is no other relevant data or information available that is necessary to make the technical report understandable and not misleading.
| |
| SGS Geological Services |