2026 Investor Day | September 29, 2026
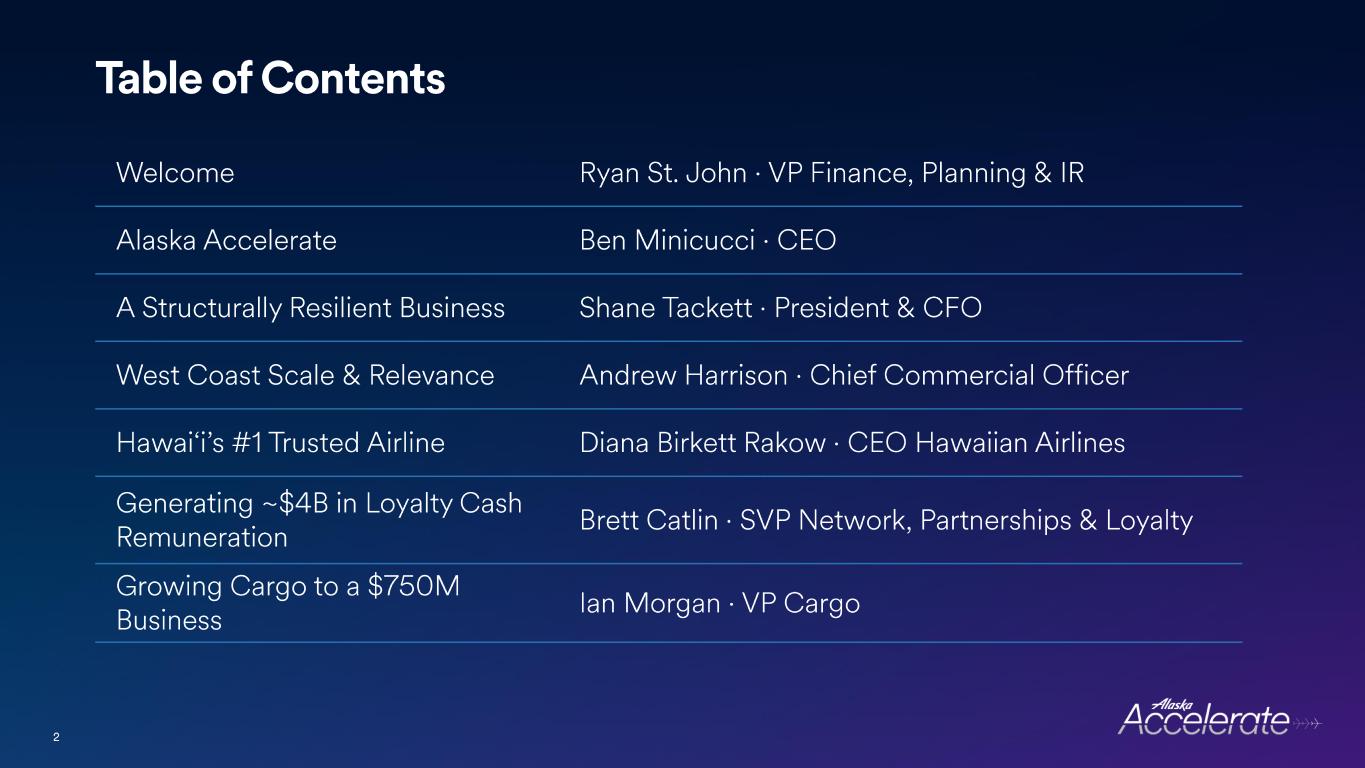
2 Welcome Ryan St. John · VP Finance, Planning & IR Alaska Accelerate Ben Minicucci · CEO A Structurally Resilient Business Shane Tackett · President & CFO West Coast Scale & Relevance Andrew Harrison · Chief Commercial Officer Hawai‘i’s #1 Trusted Airline Diana Birkett Rakow · CEO Hawaiian Airlines Generating ~$4B in Loyalty Cash Remuneration Brett Catlin · SVP Network, Partnerships & Loyalty Growing Cargo to a $750M Business Ian Morgan · VP Cargo Table of Contents

3 Ryan St. John VP Finance, Planning & Investor Relations Welcome
4 Safe Harbor This presentation may contain forward - looking statements subject to the safe harbor protection provided by Section 27A of the Securities Act of 1933 , Section 21E of the Securities Exchange Act of 1934 , and the Private Securities Litigation Reform Act of 1995 . These statements relate to future events and involve known and unknown risks and uncertainties that may cause actual outcomes to be materially different from those indicated by our forward - looking statements, assumptions or beliefs . For a discussion of risks and uncertainties that may cause our forward - looking statements to differ materially, see Item 1A of the Company's Annual Report on Form 10-K for the year ended December 31, 2025 . Some of these risks include competition, labor costs, relations and availability, general economic conditions, increases in operating costs including fuel, uncertainties regarding the ability to successfully integrate operations following the acquisition of Hawaiian Holdings, Inc . and the ability to realize anticipated cost savings, synergies, or growth from the acquisition, inability to meet cost reduction and other strategic goals, seasonal fluctuations in demand and financial results, supply chain risks, events that negatively impact aviation safety and security, cybersecurity risks, and changes in laws and regulations that impact our business . All of the forward -looking statements are qualified in their entirety by reference to the risk factors discussed in our most recent Form 10-K and in our subsequent SEC filings . We operate in a continually changing business environment, and new risk factors emerge from time to time. Management cannot predict such new risk factors, nor can it assess the impact, if any, of such new risk factors on our business or events described in any forward - looking statements . We expressly disclaim any obligation to publicly update or revise any forward - looking statements made today to conform them to actual results . Over time, our actual results, performance or achievements may differ from the anticipated results, performance or achievements that are expressed or implied by our forward - looking statements, assumptions or beliefs and such differences might be significant and materially adverse .

5 Ben Minicucci Chief Executive Officer Alaska Accelerate
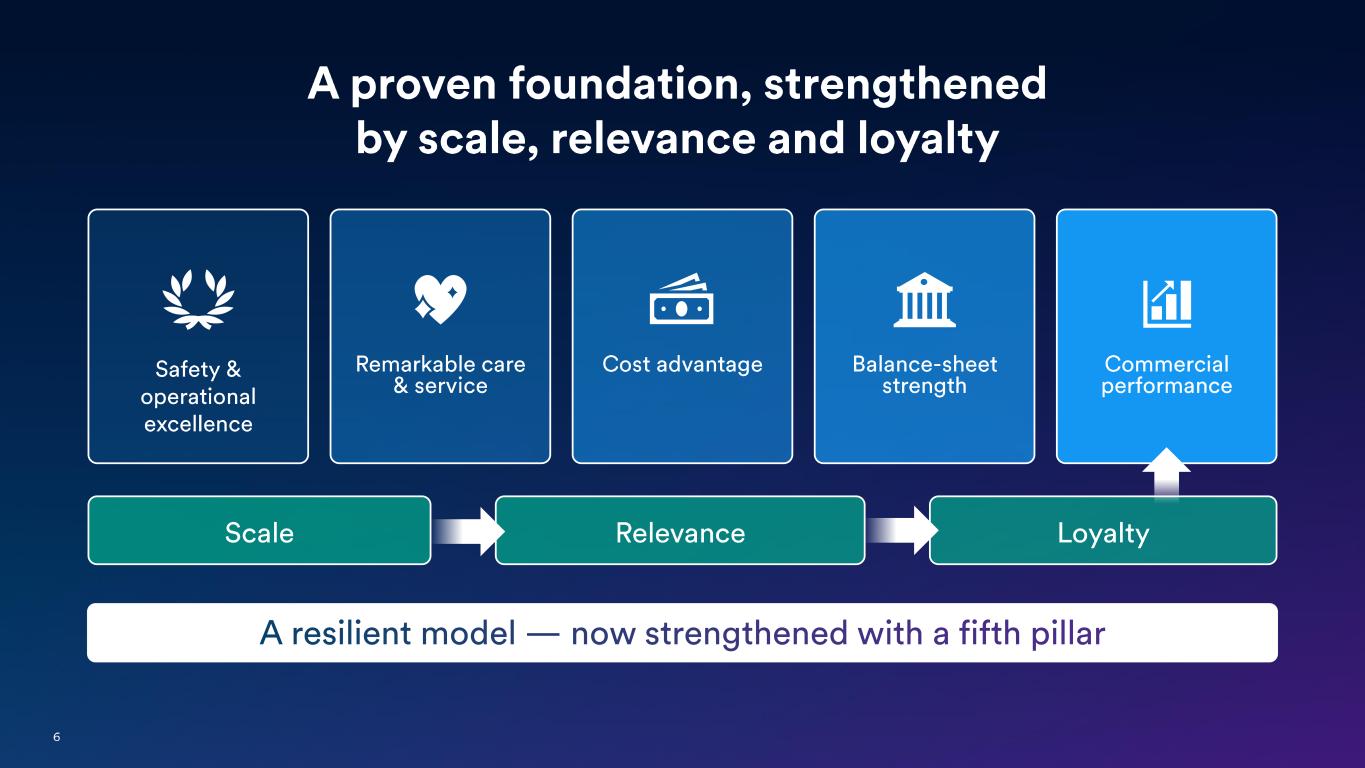
6 A proven foundation, strengthened by scale, relevance and loyalty Safety & operational excellence Remarkable care & service Cost advantage Balance -sheet strength Commercial performance LoyaltyRelevanceScale A resilient model — now strengthened with a fifth pillar
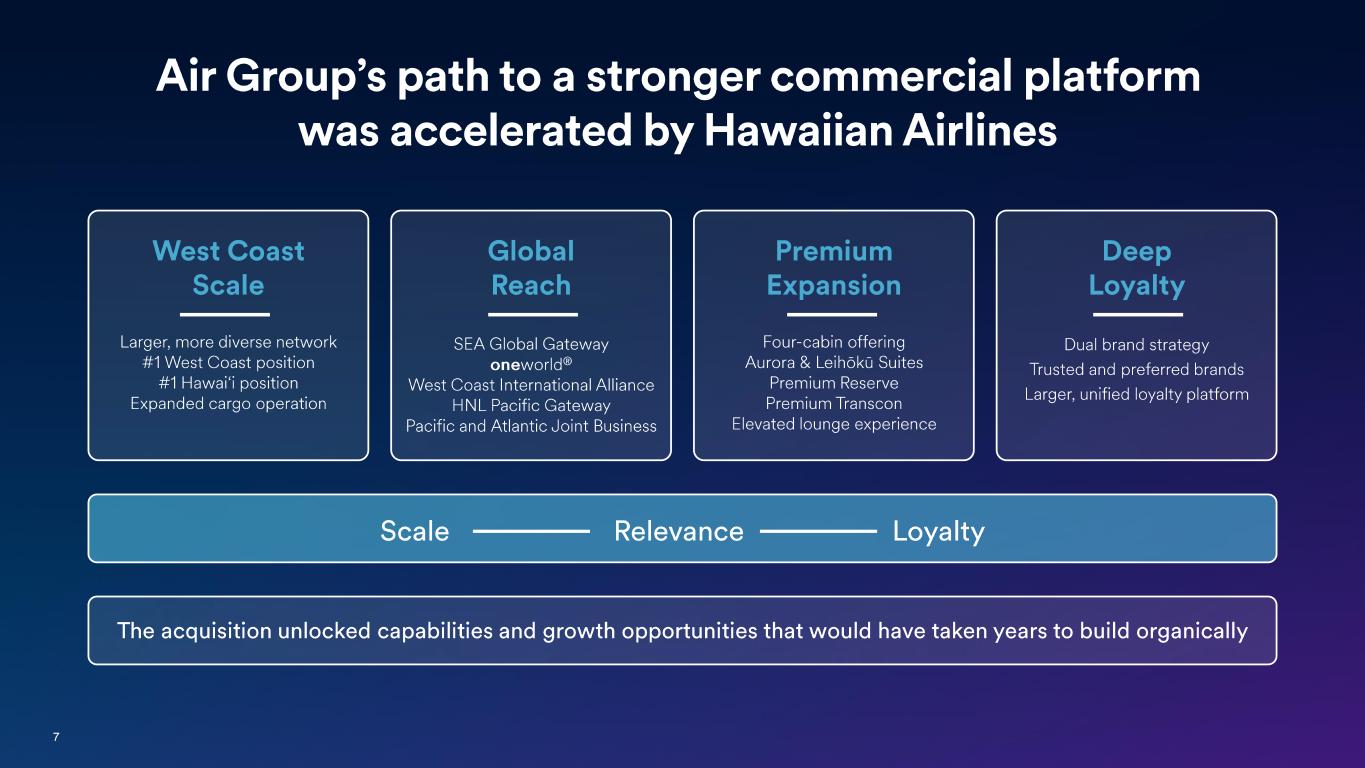
7 Air Group’s path to a stronger commercial platform was accelerated by Hawaiian Airlines The acquisition unlocked capabilities and growth opportunities that would have taken years to build organically West Coast Scale Deep Loyalty Premium Expansion Global Reach Scale Relevance Loyalty Dual brand strategy Trusted and preferred brands Larger, unified loyalty platform Four-cabin offering Aurora & Leihōkū Suites Premium Reserve Premium Transcon Elevated lounge experience SEA Global Gateway one world ® West Coast International Alliance HNL Pacific Gateway Pacific and Atlantic Joint Business Larger, more diverse network #1 West Coast position #1 Hawai‘i position Expanded cargo operation
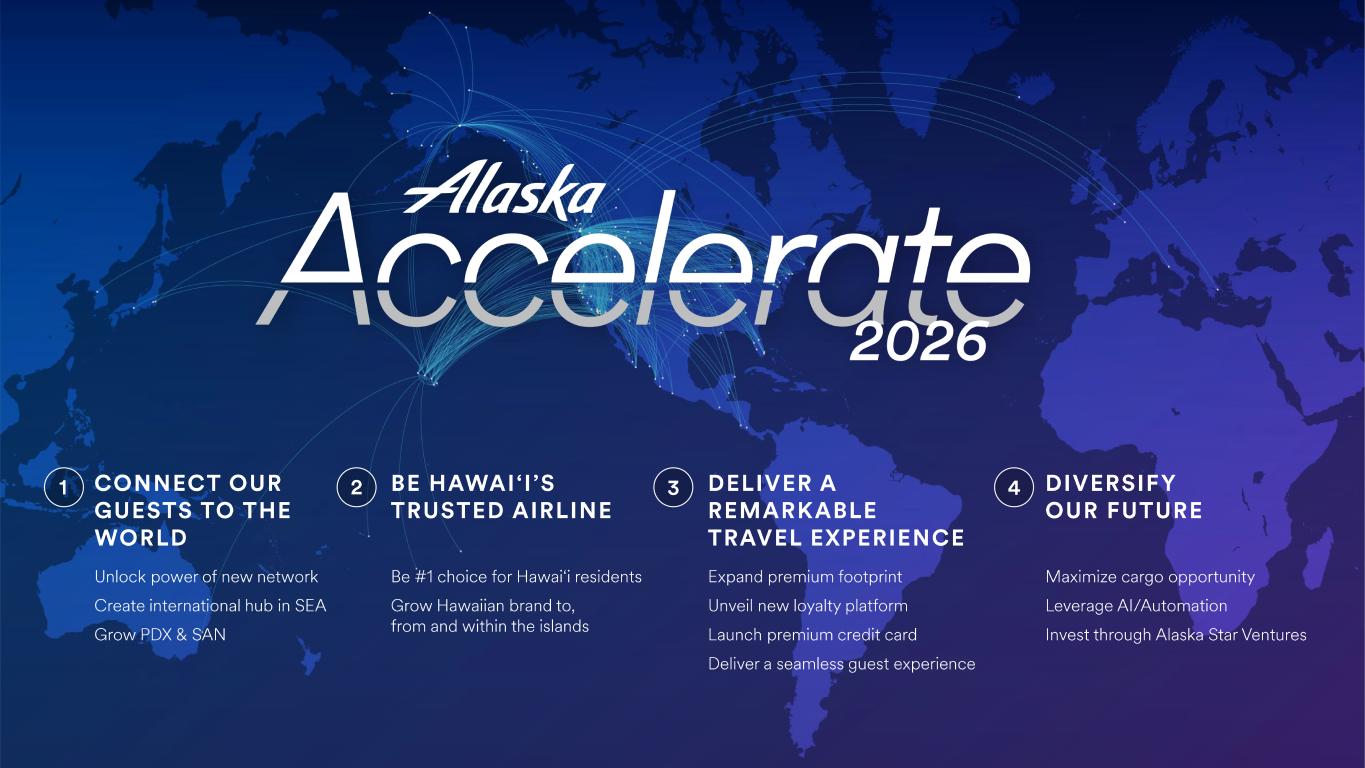
CONNECT OUR GUESTS TO THE WORLD BE HAWAI‘I’S TRUSTED AIRLINE DELIVER A REMARKABLE TRAVEL EXPERIENCE DIVERSIFY OUR FUTURE Unlock power of new network Create international hub in SEA Grow PDX & SAN Be #1 choice for Hawai‘i residents Grow Hawaiian brand to, from and within the islands Expand premium footprint Unveil new loyalty platform Launch premium credit card Deliver a seamless guest experience Maximize cargo opportunity Leverage AI/Automation Invest through Alaska Star Ventures 41 2 3
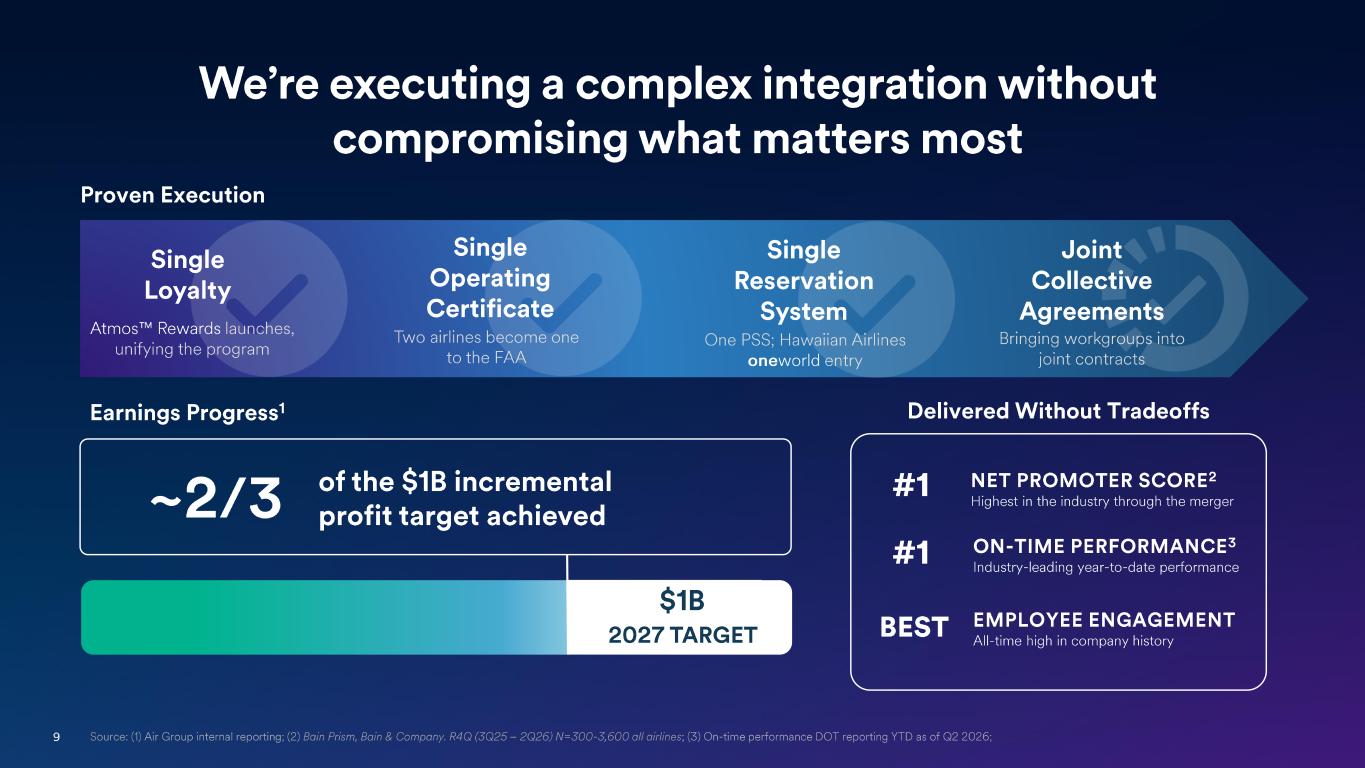
9 Source : (1) Air Group internal reporting; (2) Bain Prism, Bain & Company. R4Q (3Q25 – 2Q26) N=300 -3,600 all airlines ; (3) On -time performance DOT reporting YTD as of Q2 2026; We’re executing a complex integration without compromising what matters most Single Loyalty Atmos Rewards launches, unifying the program Single Operating Certificate Two airlines become one to the FAA Single Reservation System One PSS; Hawaiian Airlines one world entry Joint Collective Agreements Bringing workgroups into joint contracts 3 of 4 milestones complete , including the most complex operational integration work. Proven Execution Earnings Progress 1 ~2/3 of the $1B incremental profit target achieved Delivered Without Tradeoffs #1 NET PROMOTER SCORE 2 Highest in the industry through the merger #1 ON - TIME PERFORMANCE 3 Industry - leading year -to-date performance BEST EMPLOYEE ENGAGEMENT All -time high in company history2027 TARGET $1B
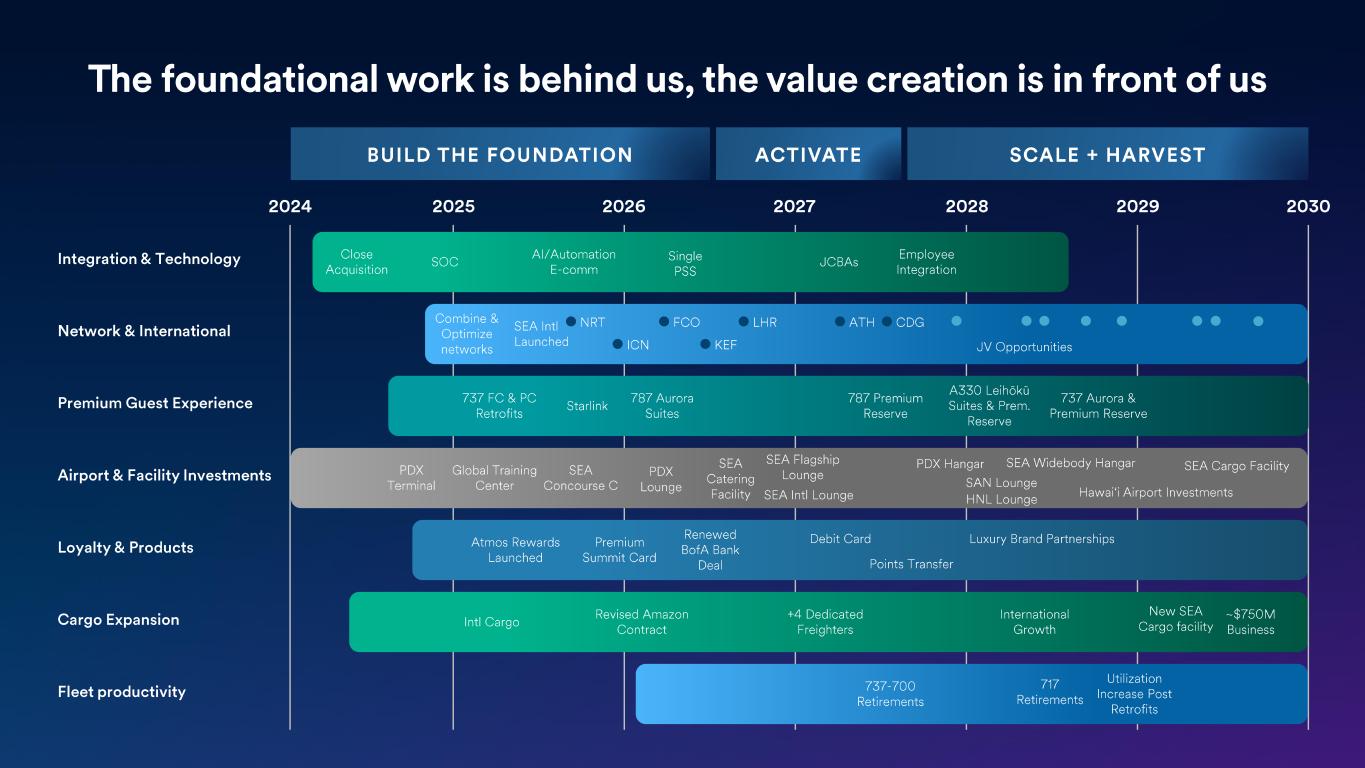
Integration & Technology Network & International Premium Guest Experience Airport & Facility Investments Loyalty & Products Cargo Expansion Fleet productivity 20252024 2026 2027 2028 2029 2030 717 Retirements 737 -700 Retirements Utilization Increase Post Retrofits Debit Card Luxury Brand PartnershipsPremium Summit Card Atmos Rewards Launched Renewed BofA Bank Deal Points Transfer SEA Flagship Lounge PDX Hangar SEA Concourse C PDX Terminal PDX Lounge SAN Lounge Global Training Center SEA Catering Facility SEA Intl Lounge Hawai‘i Airport Investments HNL Lounge 737 FC & PC Retrofits Starlink A330 Leihōkū Suites & Prem. Reserve 737 Aurora & Premium Reserve 787 Aurora Suites 787 Premium Reserve JV Opportunities Combine & Optimize networks SEA Intl Launched NRT ICN FCO KEF LHR ATH CDG JCBAs Employee Integration SOC Close Acquisition Single PSS AI/Automation E-comm ~$750M Business +4 Dedicated Freighters International Growth Revised Amazon Contract Intl Cargo New SEA Cargo facility ACTIVATEBUILD THE FOUNDATION SCALE + HARVEST The foundational work is behind us, the value creation is in front of us SEA Widebody Hangar SEA Cargo Facility
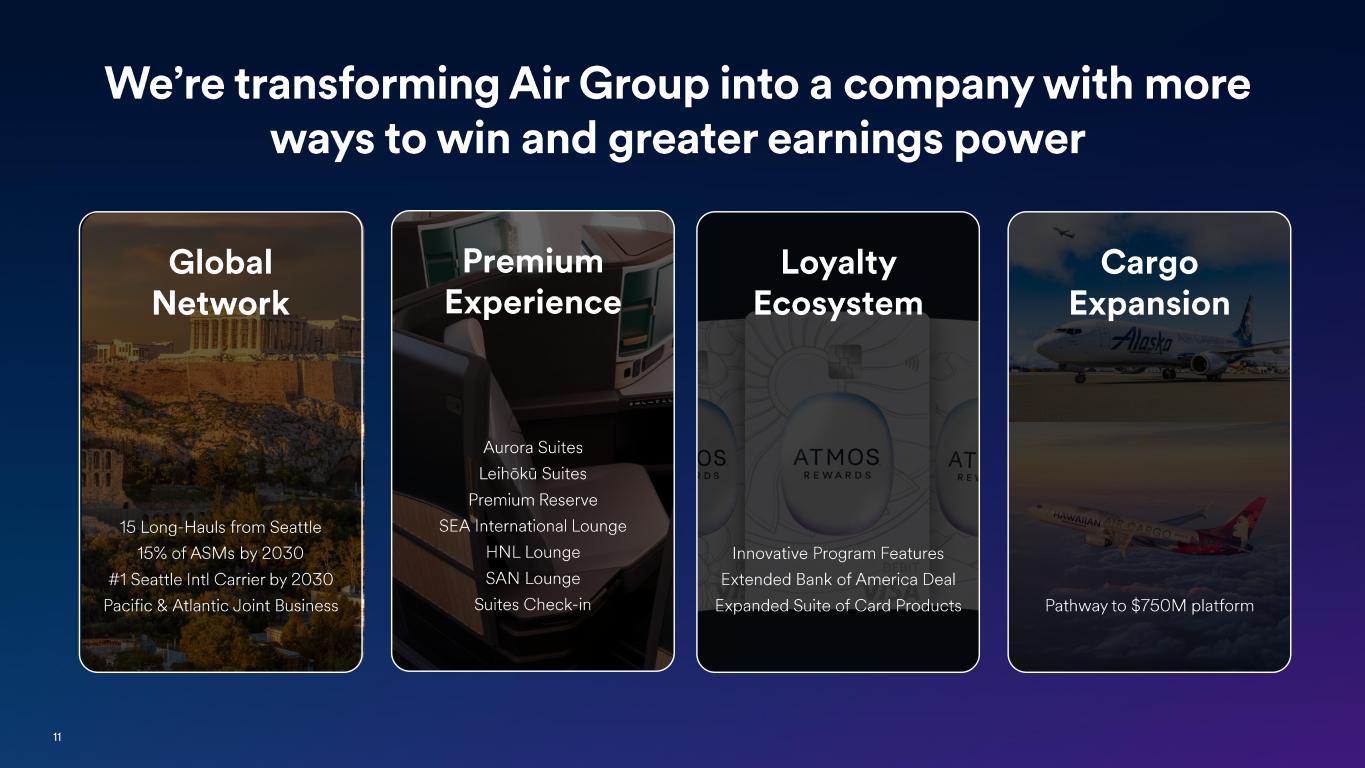
11 We’re transforming Air Group into a company with more ways to win and greater earnings power 15 Long -Hauls from Seattle 15% of ASMs by 2030 #1 Seattle Intl Carrier by 2030 Pacific & Atlantic Joint Business Global Network Innovative Program Features Extended Bank of America Deal Expanded Suite of Card Products Loyalty Ecosystem Pathway to $750M platform Cargo Expansion Aurora Suites Leihōkū Suites Premium Reserve SEA International Lounge HNL Lounge SAN Lounge Suites Check - in Premium Experience

12 Shane Tackett President and Chief Financial Officer A Structurally Resilient Business
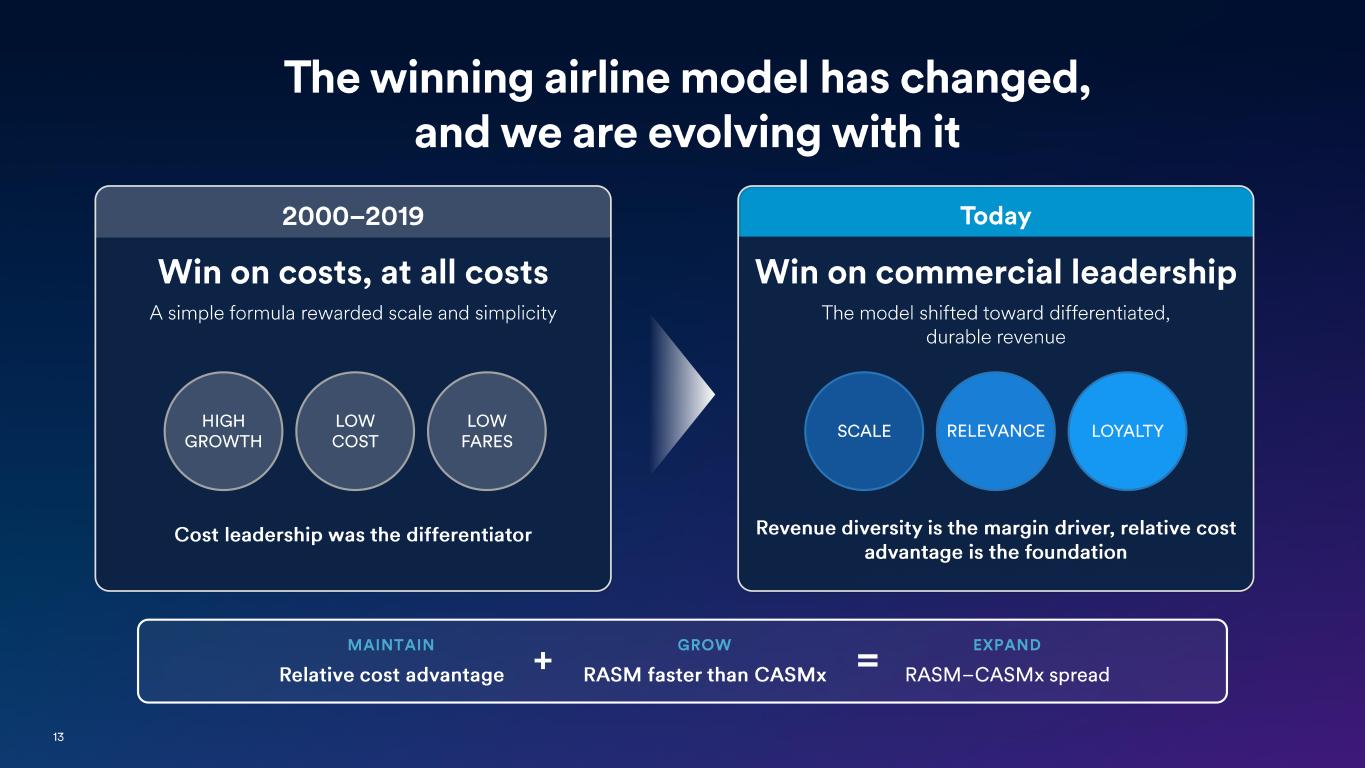
13 The winning airline model has changed, and we are evolving with it MAINTAIN Relative cost advantage + GROW RASM faster than CASMx = EXPAND RASM – CASMx spread Win on costs, at all costs A simple formula rewarded scale and simplicity Cost leadership was the differentiator 2000 – 2019 HIGH GROWTH LOW COST LOW FARES Win on commercial leadership The model shifted toward differentiated, durable revenue Revenue diversity is the margin driver, relative cost advantage is the foundation Today SCALE LOYALTYRELEVANCE
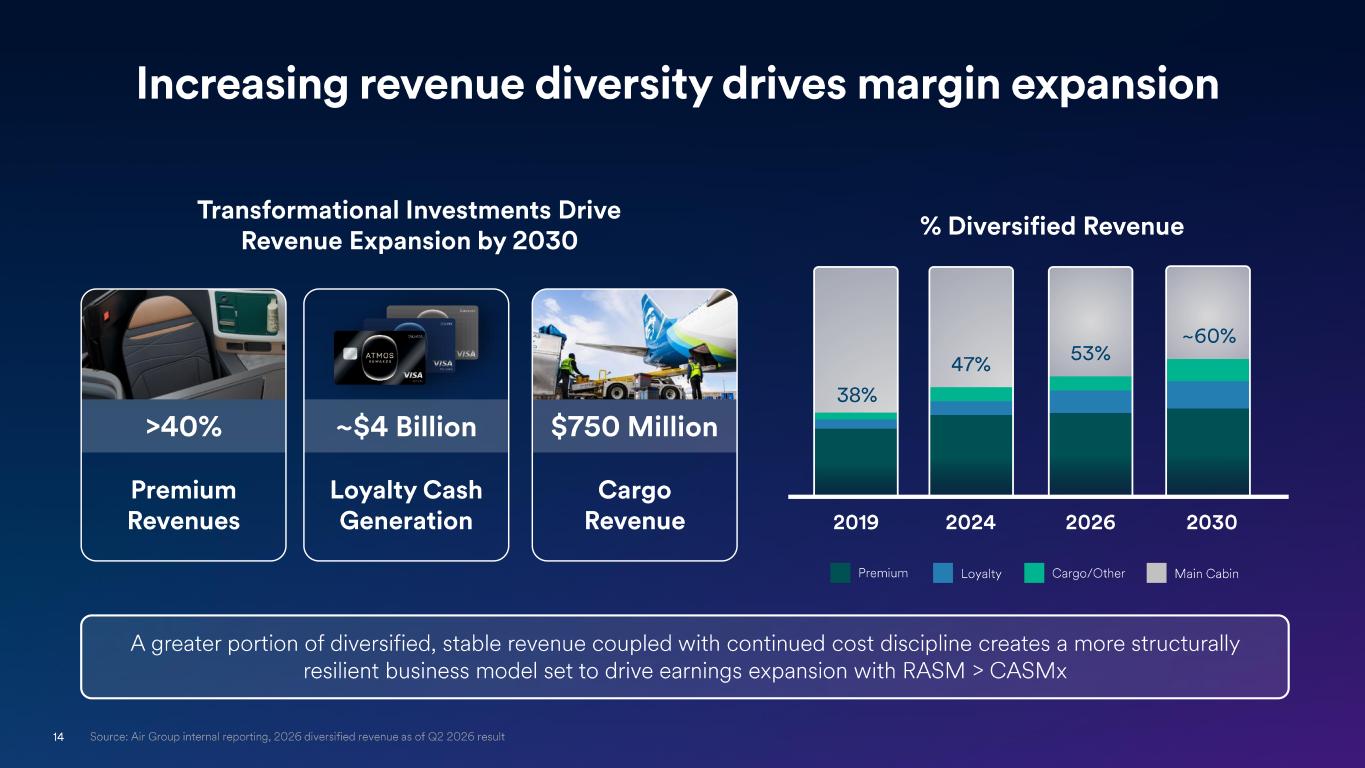
14 A greater portion of diversified, stable revenue coupled with continued cost discipline creates a more structurally resilient business model set to drive earnings expansion with RASM > CASMx Transformational Investments Drive Revenue Expansion by 2030 % Diversified Revenue Main CabinCargo/OtherPremium Loyalty 2019 38% 2030 ~60% 2026 53% 2024 47% Increasing revenue diversity drives margin expansion Premium Revenues >40% Loyalty Cash Generation ~$4 Billion Cargo Revenue $750 Million Source: Air Group internal reporting, 2026 diversified revenue as of Q2 2026 result
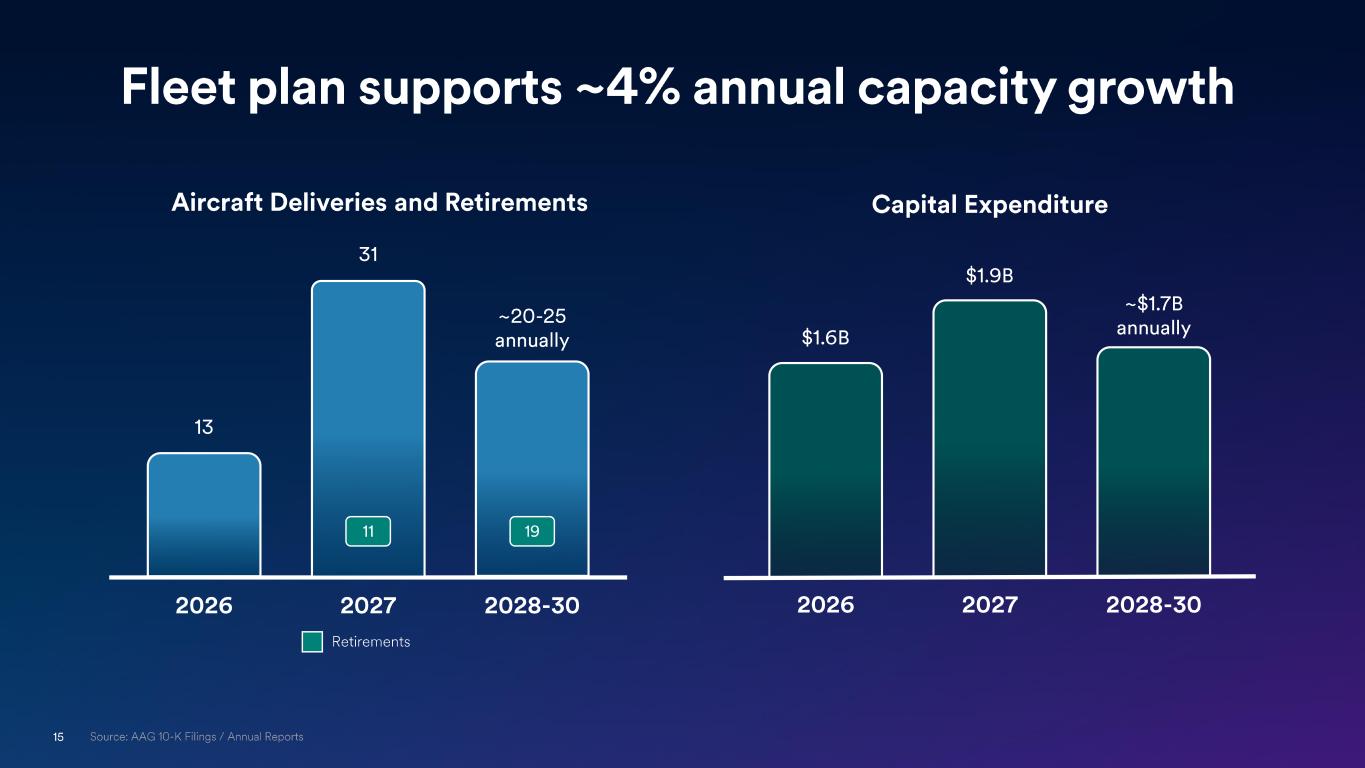
15 Source: AAG 10 -K Filings / Annual Reports Fleet plan supports ~4% annual capacity growth Aircraft Deliveries and Retirements Retirements 2026 13 2028 -30 ~20 -25 annually 19 2027 31 11 Capital Expenditure $1.6B 2026 ~$1.7B annually 2028 -30 $1.9B 2027
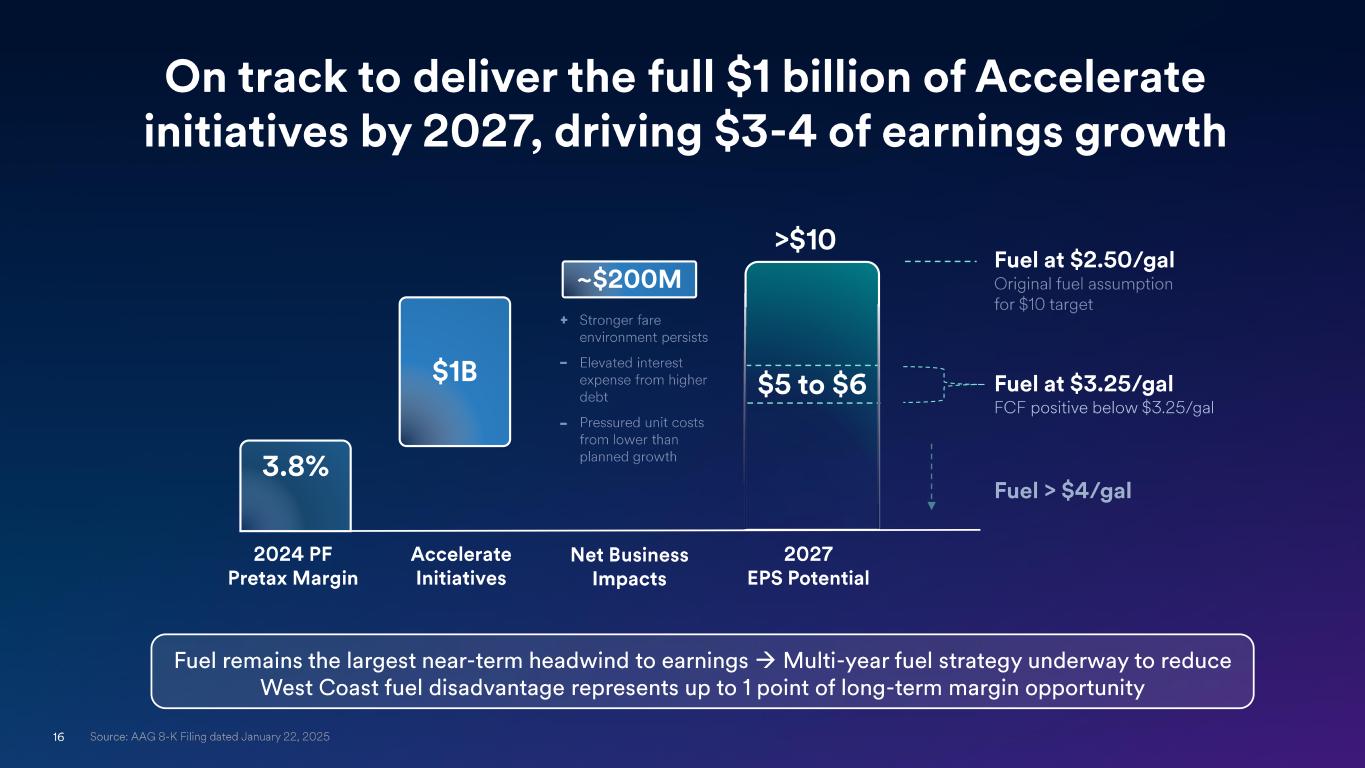
16 On track to deliver the full $1 billion of Accelerate initiatives by 2027, driving $3 -4 of earnings growth 2024 PF Pretax Margin Accelerate Initiatives Net Business Impacts 2027 EPS Potential Fuel at $2.50/gal Original fuel assumption for $10 target $1B ~$200M 3.8% >$10 Fuel at $3.25/gal - Stronger fare environment persists - Elevated interest expense from higher debt - Pressured unit costs from lower than planned growth $5 to $6 Fuel > $4/gal Fuel remains the largest near -term headwind to earnings → Multi -year fuel strategy underway to reduce West Coast fuel disadvantage represents up to 1 point of long -term margin opportunity FCF positive below $3.25/gal Source: AAG 8 -K Filing dated January 22, 2025
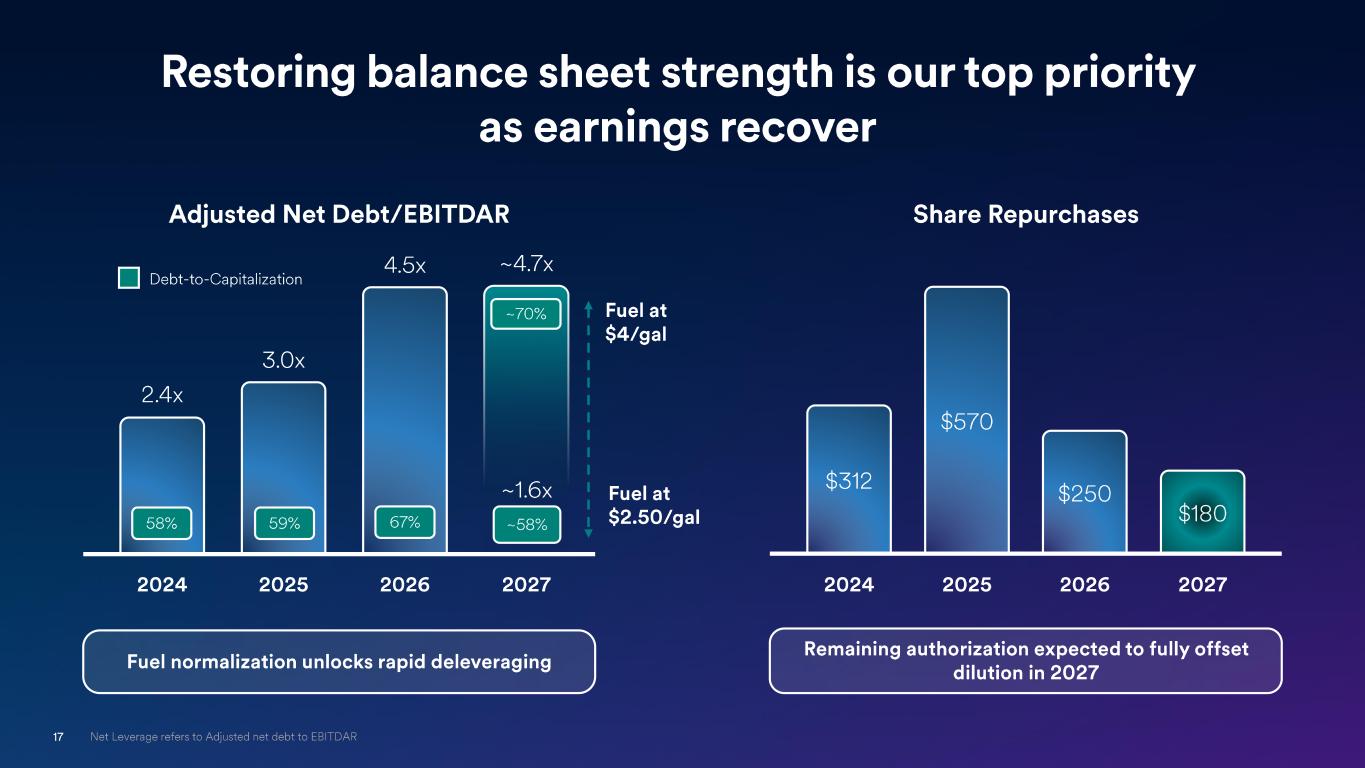
17 Restoring balance sheet strength is our top priority as earnings recover Share Repurchases Remaining authorization expected to fully offset dilution in 2027 2024 $312 2025 $570 2026 $250 2027 $180 Fuel normalization unlocks rapid deleveraging Adjusted Net Debt/EBITDAR 2024 2.4x 2025 3.0 x 2026 4.5x 2027 ~4.7x ~1.6x Fuel at $4/gal Fuel at $2.50/gal Debt -to-Capitalization 58% 59% 67% ~58% ~70% Net Leverage refers to Adjusted net debt to EBITDAR
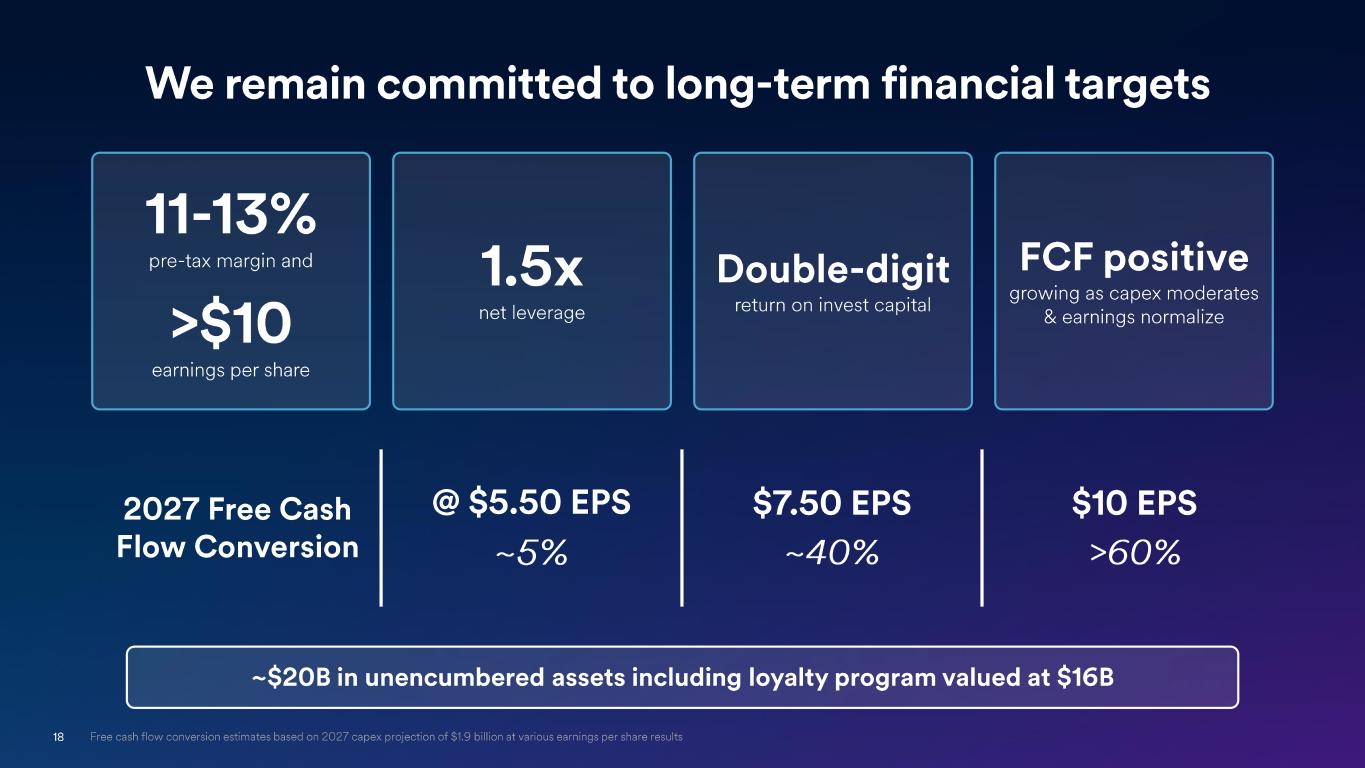
18 11-13% pre-tax margin and >$10 earnings per share 1.5x net leverage Double -digit return on invest capital FCF positive growing as capex moderates & earnings normalize 2027 Free Cash Flow Conversion @ $5.50 EPS ~5% $7.50 EPS ~40% $10 EPS >60% ~ $20B in unencumbered assets including loyalty program valued at $16B We remain committed to long -term financial targets Free cash flow conversion estimates based on 2027 capex projection of $1.9 billion at various earnings per share results
19 Andrew Harrison Chief Commercial Officer West Coast Scale and Relevance
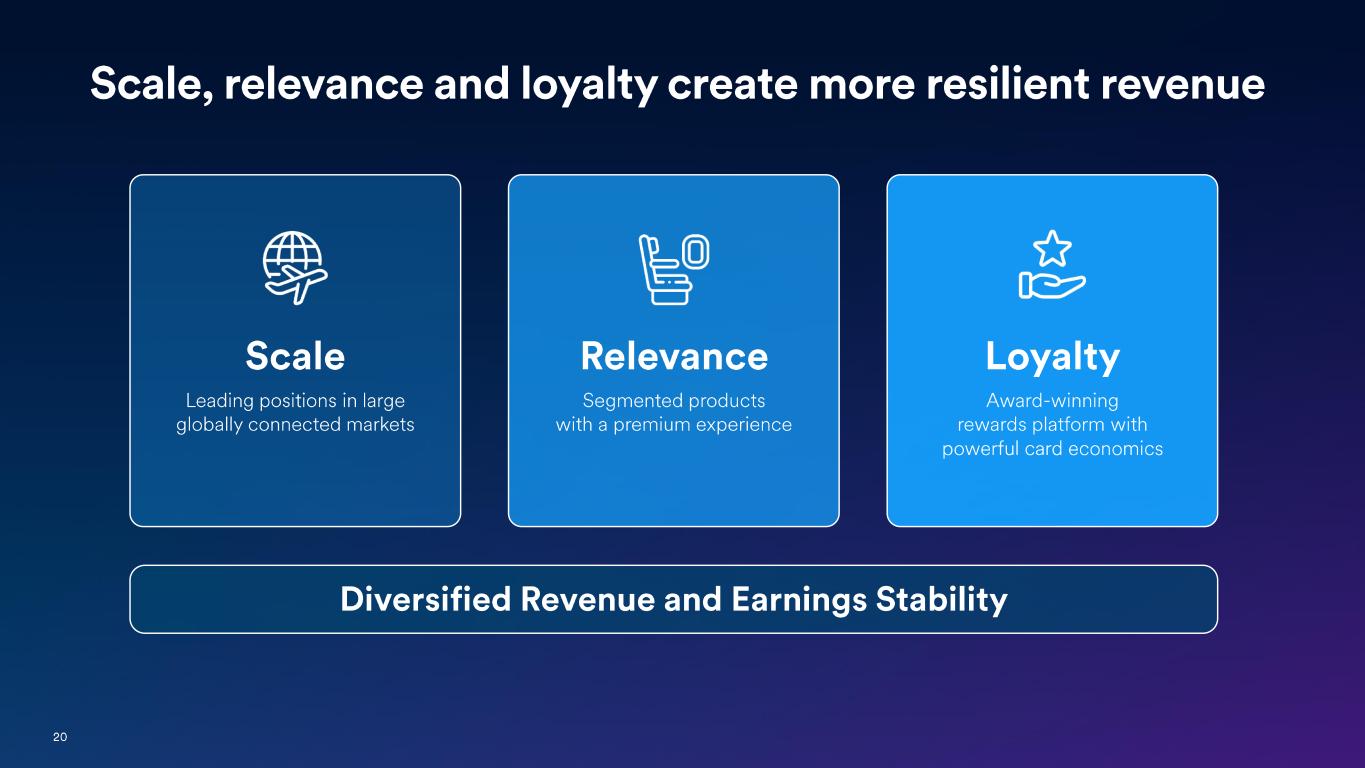
20 Scale, relevance and loyalty create more resilient revenue Diversified Revenue and Earnings Stability Scale Leading positions in large globally connected markets Relevance Segmented products with a premium experience Loyalty Award -winning rewards platform with powerful card economics

21 West Coast Scale
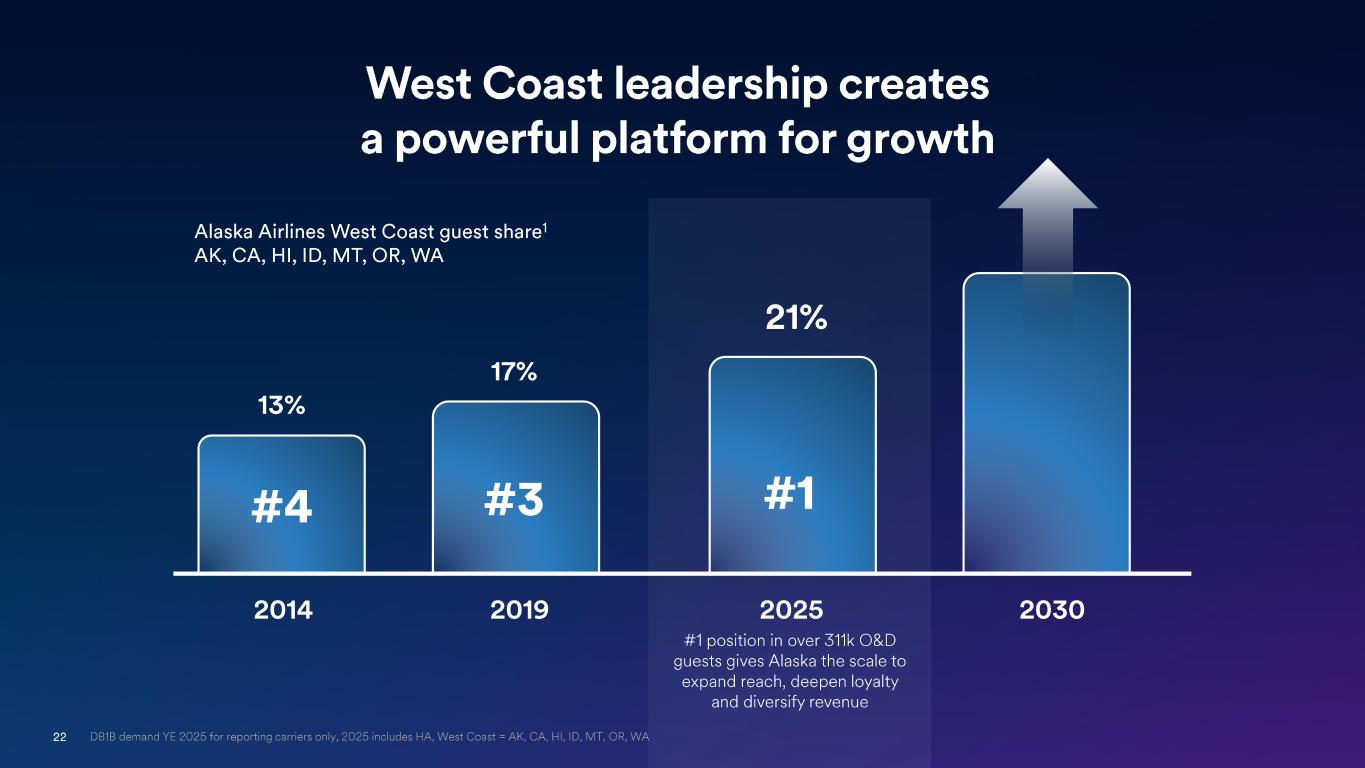
22 DB1B demand YE 2025 for reporting carriers only, 2025 includes HA, West Coast = AK, CA, HI, ID, MT, OR, WA West Coast leadership creates a powerful platform for growth #1 position in over 311 k O&D guests gives Alaska the scale to expand reach, deepen loyalty and diversify revenue 2024 2.3x 2025 2.9x 2026 4.5x 2027E <2x ~4.5x Alaska Airlines West Coast guest share 1 AK, CA, HI, ID, MT, OR, WA 2014 2019 2025 2030 13% 17% 21% #4 #3 #1
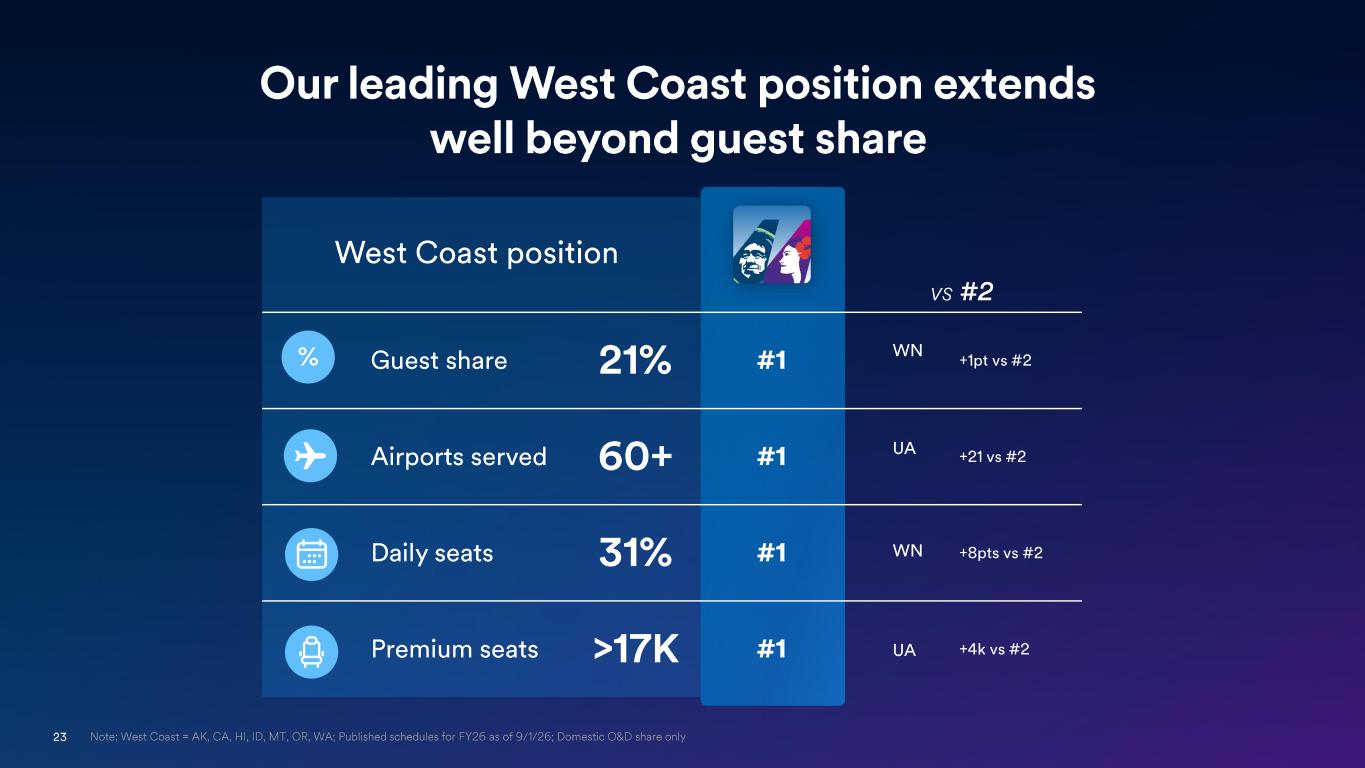
23 Note: West Coast = AK, CA, HI, ID, MT, OR, WA; Published schedules for FY26 as of 9/1/26; Domestic O&D share only Our leading West Coast position extends well beyond guest share vs #2 Guest share 21% #1 +1pt vs #2 Airports served 60+ #1 +21 vs #2 Daily seats 31% #1 +8pts vs #2 Premium seats >17K #1 +4k vs #2 % West Coast position UA UA WN WN

24 Pacific Northwest
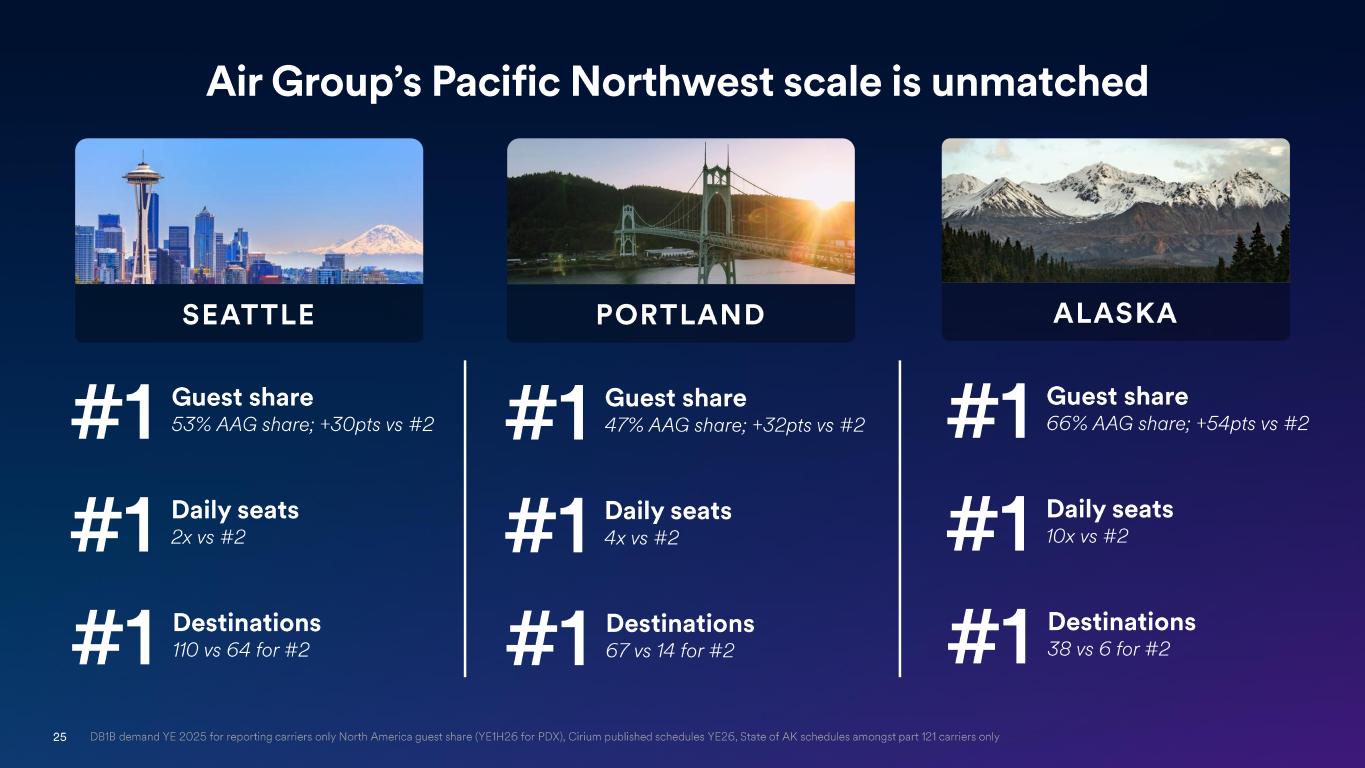
25 Guest share 47% AAG share; +32pts vs #2#1 Daily seats 4x vs #2#1 Destinations 67 vs 14 for #2#1 PORTLAND DB1B demand YE 2025 for reporting carriers only North America guest share (YE1H26 for PDX), Cirium published schedules YE26, Sta te of AK schedules amongst part 121 carriers only Air Group’s Pacific Northwest scale is unmatched Guest share 66% AAG share; +54pts vs #2#1 Daily seats 10x vs #2#1 Destinations 38 vs 6 for #2#1 ALASKA Guest share 53% AAG share; +30pts vs #2#1 Daily seats 2x vs #2#1 Destinations 110 vs 64 for #2#1 SEATTLE

26 Seattle
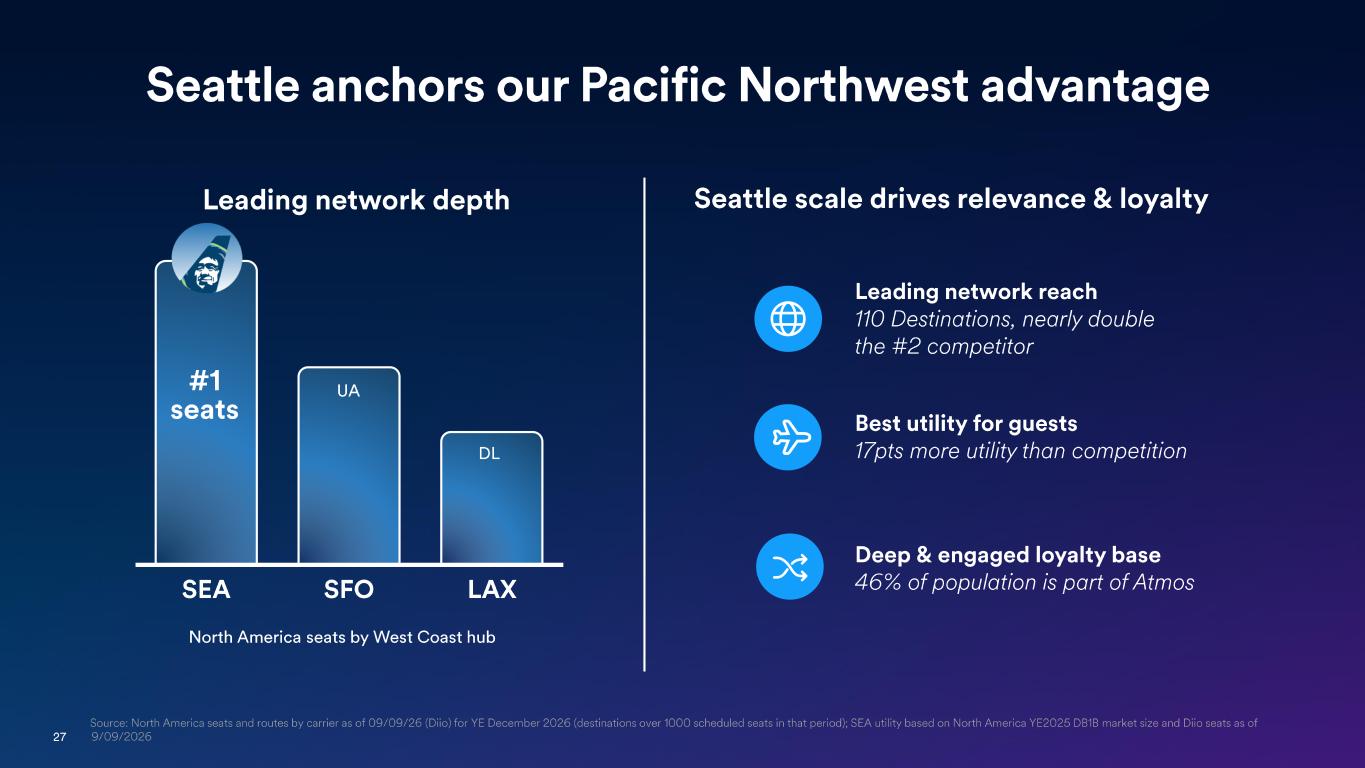
27 Source: North America seats and routes by carrier as of 09/09/26 ( Diio ) for YE December 2026 (destinations over 1000 scheduled seats in that period); SEA utility based on North America YE2025 DB1 B m arket size and Diio seats as of 9/09/2026 Best utility for guests 17pts more utility than competition Leading network reach 110 Destinations, nearly double the #2 competitor Deep & engaged loyalty base 46% of population is part of Atmos North America seats by West Coast hub SEA SFO LAX #1 seats Seattle scale drives relevance & loyaltyLeading network depth Seattle anchors our Pacific Northwest advantage UA DL
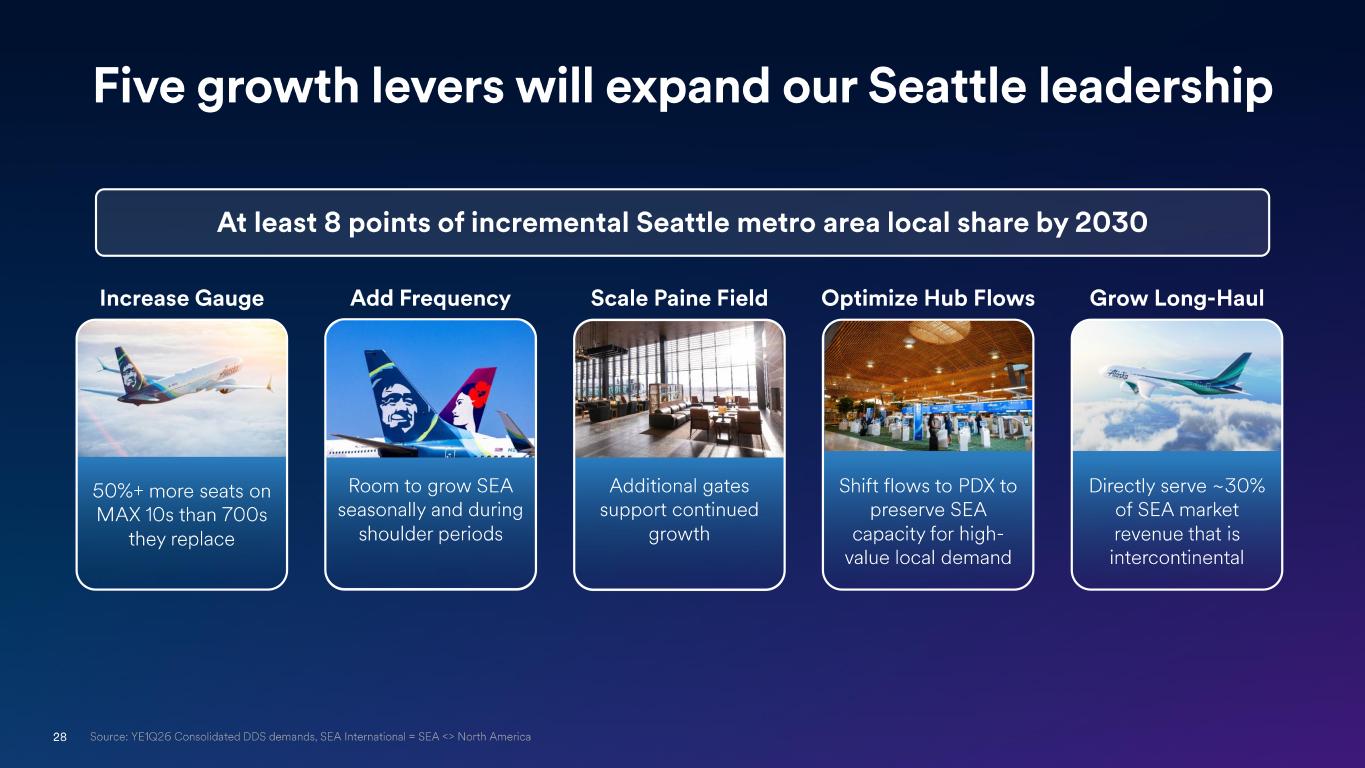
28 Source: YE1Q26 Consolidated DDS demands, SEA International = SEA <> North America Five growth levers will expand our Seattle leadership At least 8 points of incremental Seattle metro area local share by 2030 Increase Gauge 50%+ more seats on MAX 10s than 700s they replace Shift flows to PDX to preserve SEA capacity for high - value local demand Optimize Hub Flows Additional gates support continued growth Scale Paine Field Room to grow SEA seasonally and during shoulder periods Add Frequency Directly serve ~30% of SEA market revenue that is intercontinental Grow Long -Haul

29 Seattle Long -Haul
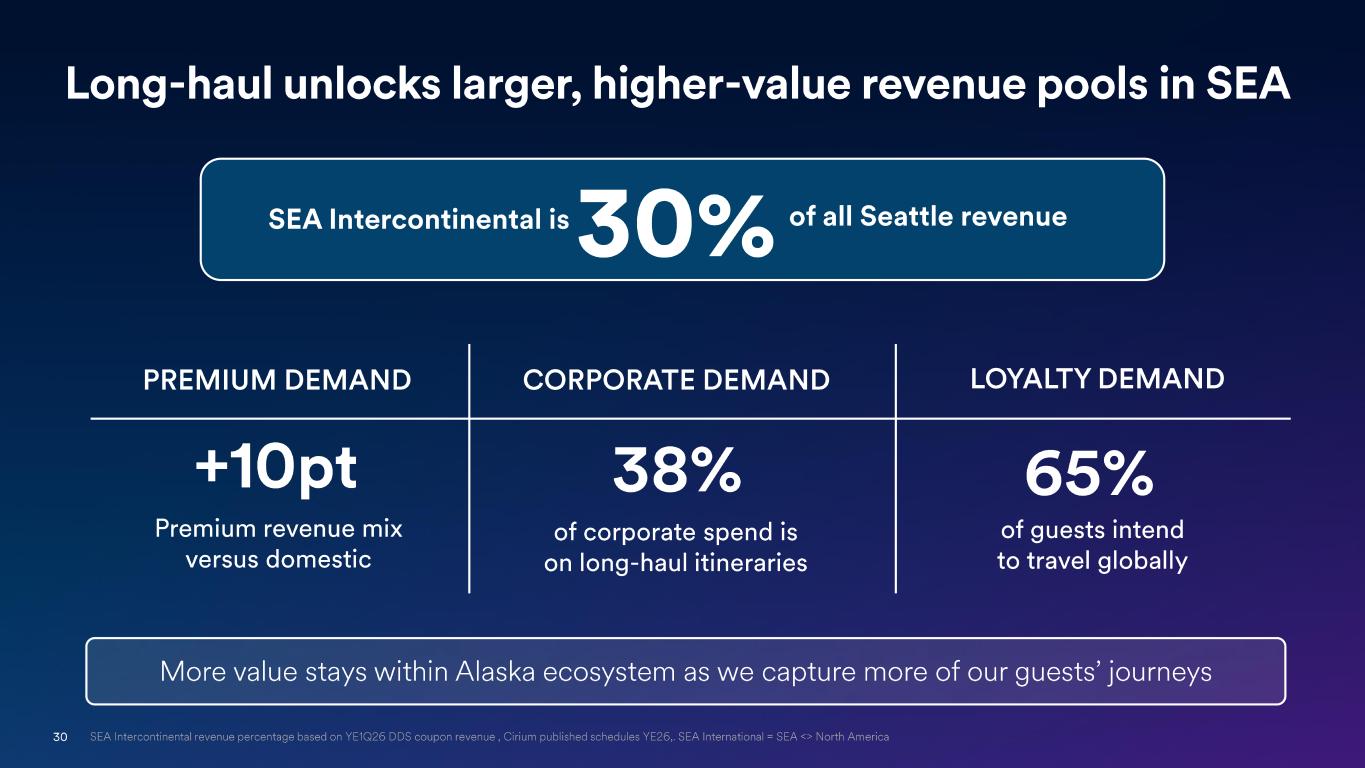
30 SEA Intercontinental is 30% of all Seattle revenue Long -haul unlocks larger, higher -value revenue pools in SEA PREMIUM DEMAND CORPORATE DEMAND LOYALTY DEMAND +10pt 38% 65% Premium revenue mix versus domestic of corporate spend is on long -haul itineraries of guests intend to travel globally More value stays within Alaska ecosystem as we capture more of our guests’ journeys SEA Intercontinental revenue percentage based on YE1Q26 DDS coupon revenue , Cirium published schedules YE26,. SEA Internatio nal = SEA <> North America
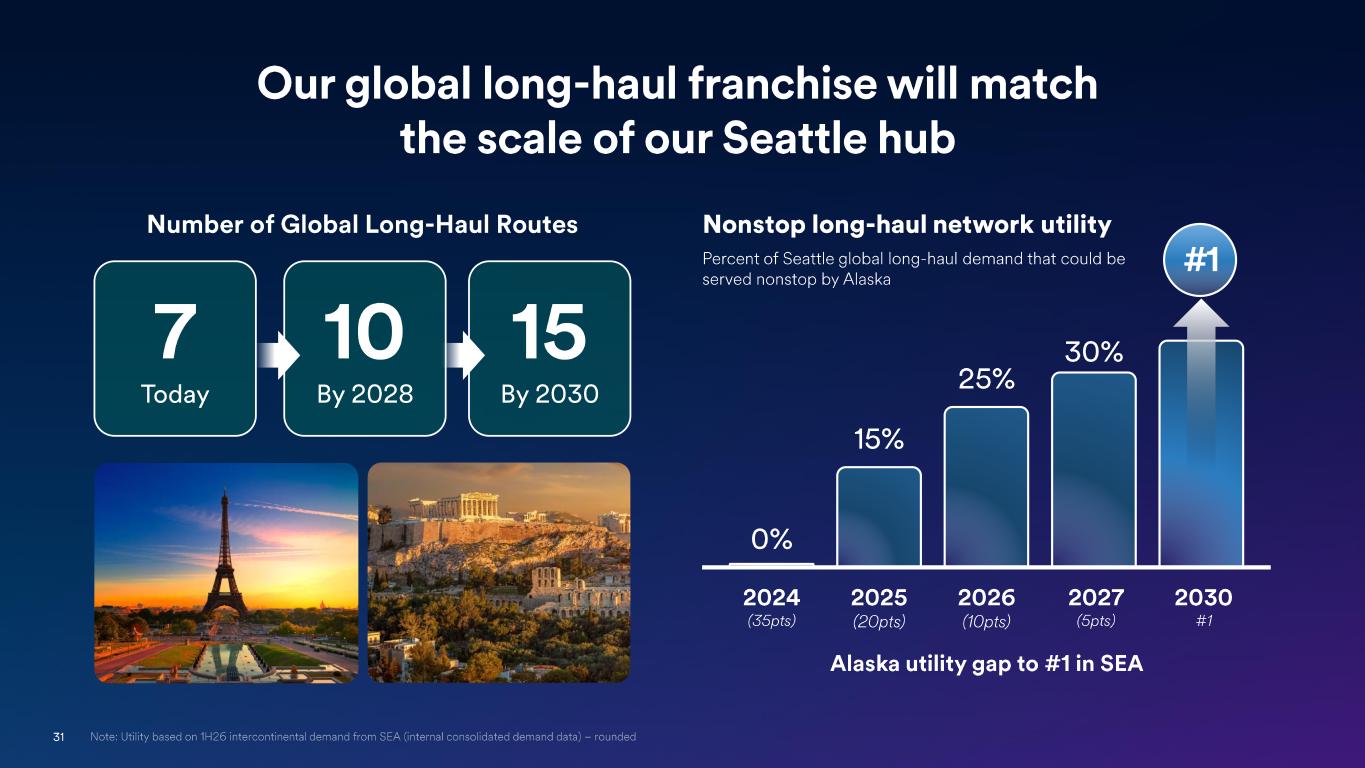
31 Note: Utility based on 1H26 intercontinental demand from SEA (internal consolidated demand data) – rounded Our global long -haul franchise will match the scale of our Seattle hub 15 By 2030 7 Today 10 By 2028 Number of Global Long -Haul Routes Alaska utility gap to #1 in SEA Nonstop long - haul network utility Percent of Seattle global long -haul demand that could be served nonstop by Alaska 0% 2024 (35pts) 15% 2025 (20pts) 25% 2026 (10pts) 30 % 2027 (5pts) #1 2030 #1
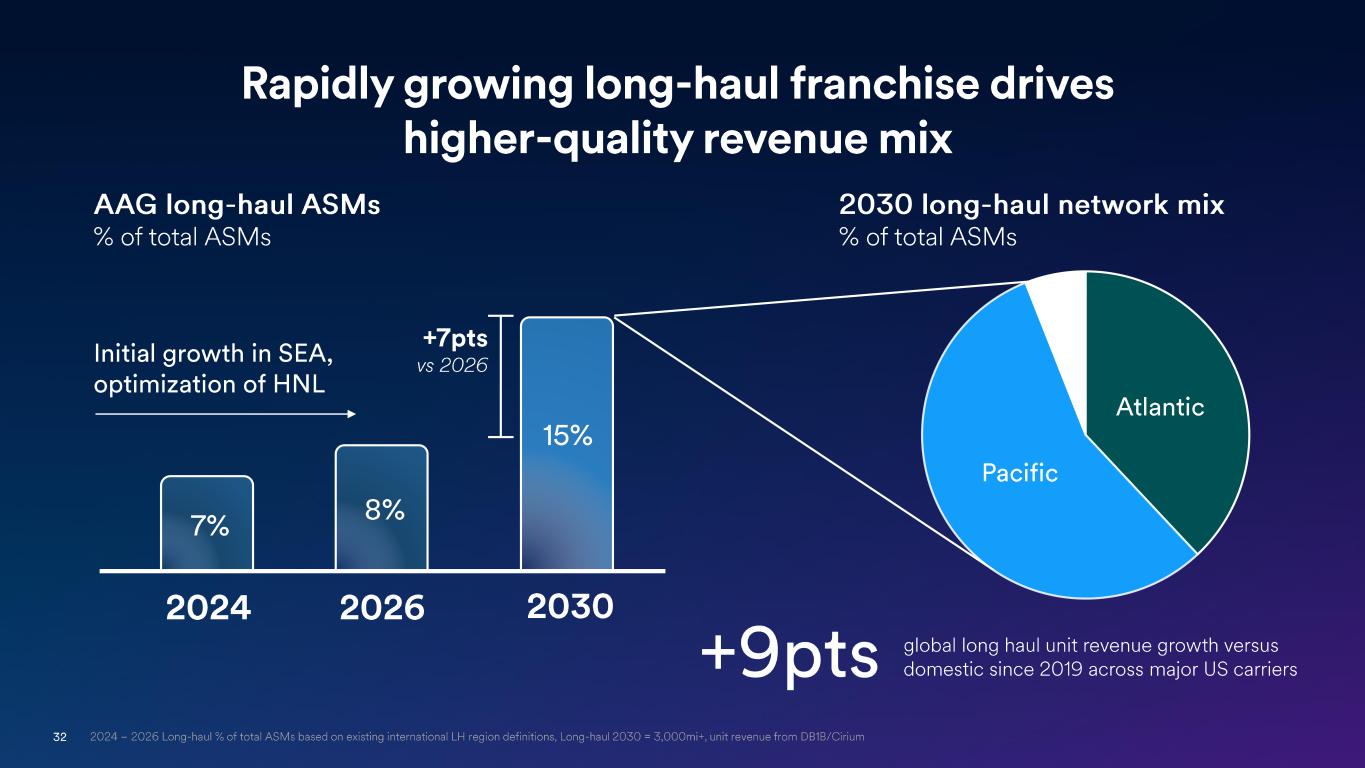
32 2024 2025 2026 2027 2030 2024 – 2026 Long -haul % of total ASMs based on existing international LH region definitions, Long -haul 2030 = 3,000mi+, unit rev enue from DB1B/Cirium AAG long - haul ASMs % of total ASMs Initial growth in SEA, optimization of HNL Atlantic Pacific +7pts vs 2026 2030 long - haul network mix % of total ASMs +9pts global long haul unit revenue growth versus domestic since 2019 across major US carriers 2024 2026 2030 7% 8% 15% Rapidly growing long -haul franchise drives higher -quality revenue mix
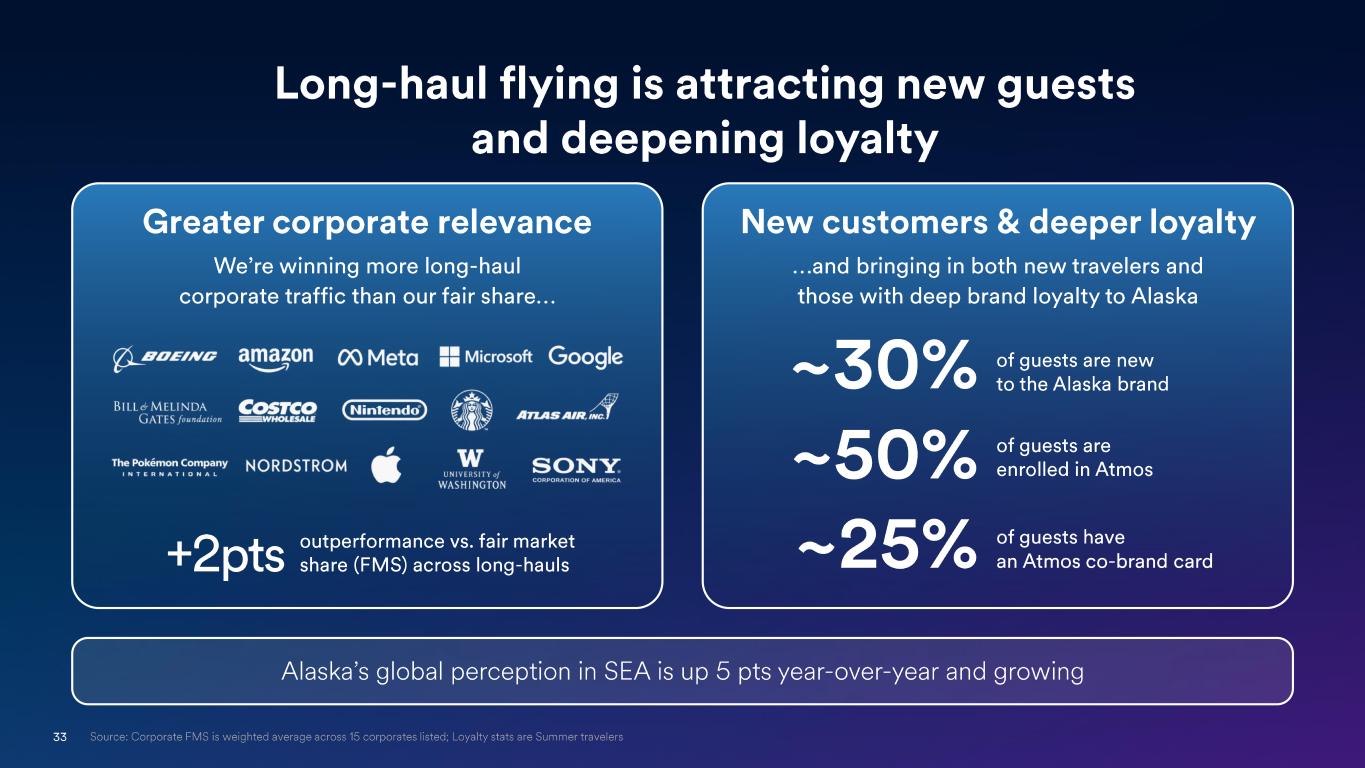
33 Long -haul flying is attracting new guests and deepening loyalty Source: Corporate FMS is weighted average across 15 corporates listed; Loyalty stats are Summer travelers New customers & deeper loyalty …and bringing in both new travelers and those with deep brand loyalty to Alaska ~30% of guests are new to the Alaska brand of guests are enrolled in Atmos~50% of guests have an Atmos co -brand card~25% Greater corporate relevance We’re winning more long -haul corporate traffic than our fair share… +2pts outperformance vs. fair market share (FMS) across long -hauls Alaska’s global perception in SEA is up 5 pts year -over-year and growing
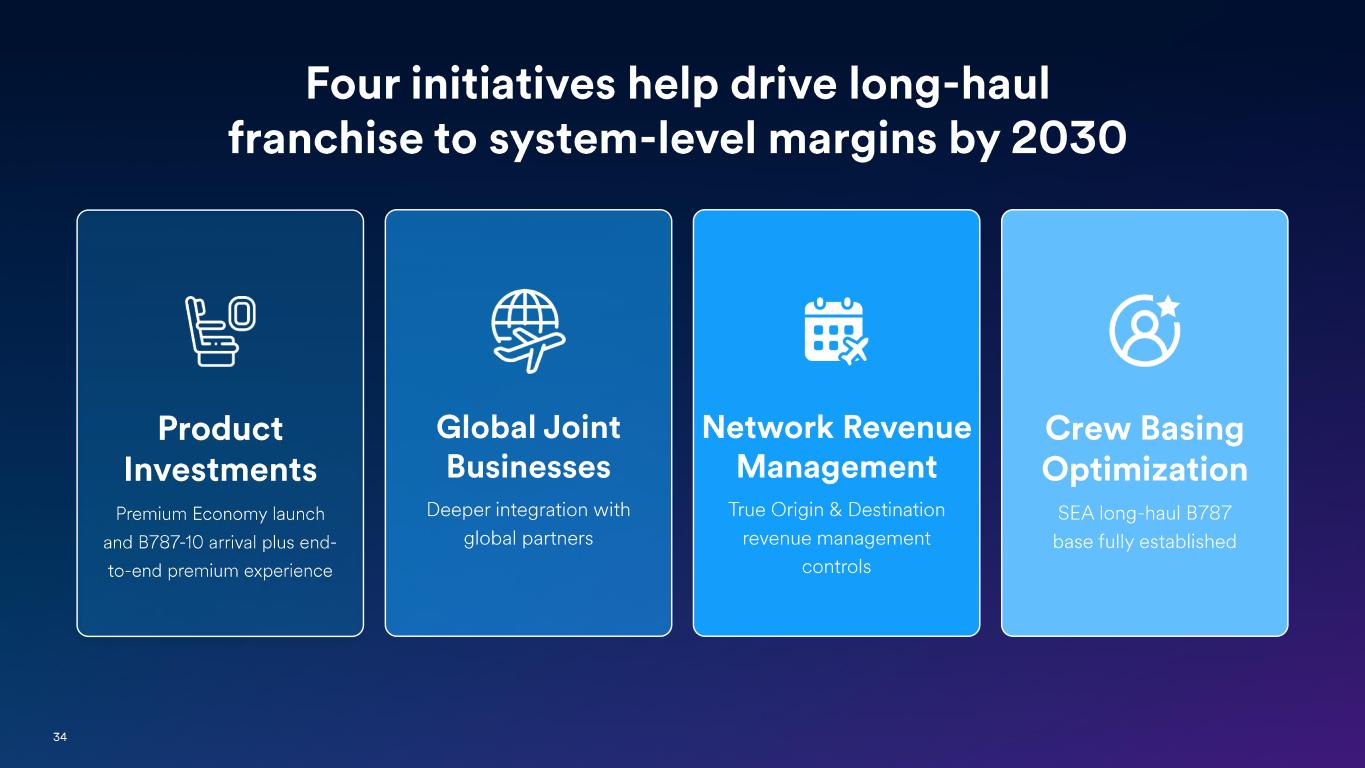
34 Four initiatives help drive long -haul franchise to system - level margins by 2030 Network Revenue Management True Origin & Destination revenue management controls Crew Basing Optimization SEA long -haul B787 base fully established Product Investments Premium Economy launch and B787 -10 arrival plus end - to-end premium experience Global Joint Businesses Deeper integration with global partners
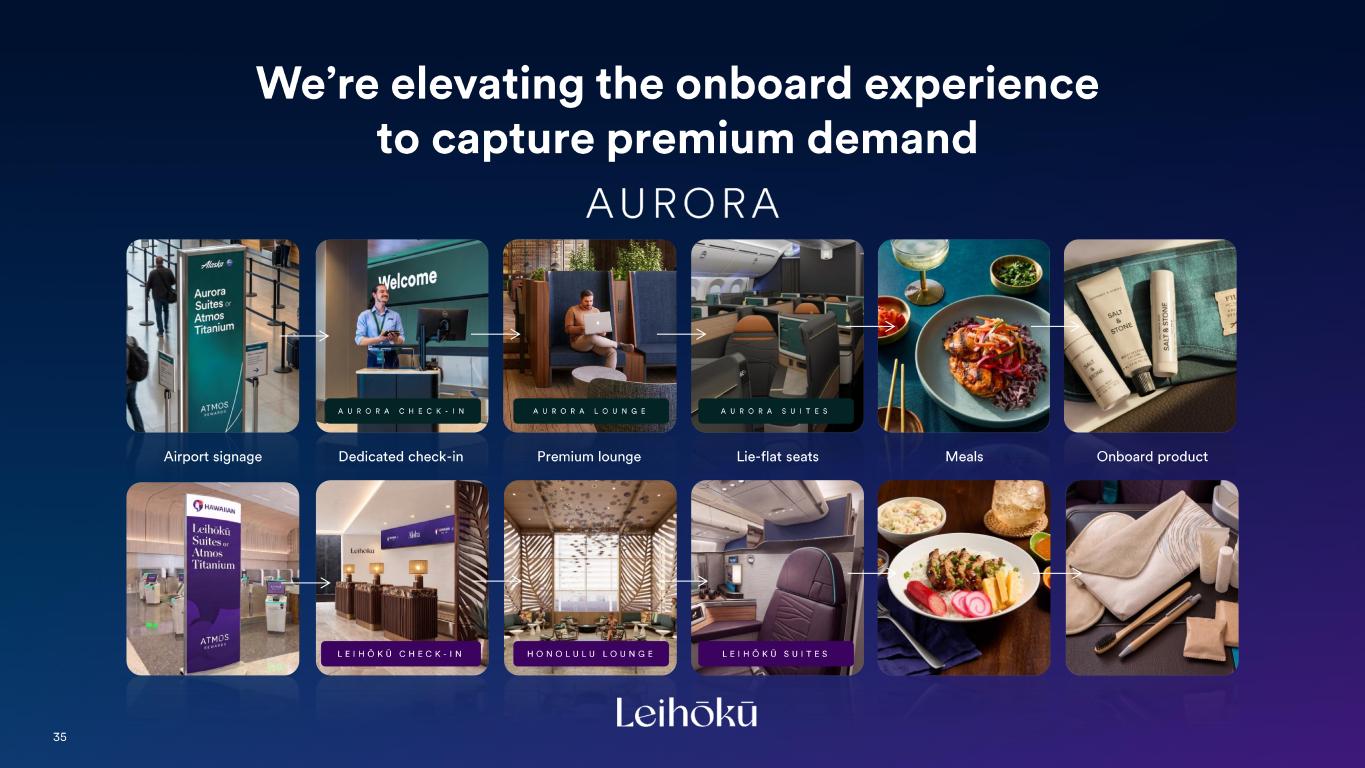
35 Airport signage Dedicated check - in Premium lounge Lie - flat seats Meals Onboard product AURORA LOUNGEAURORA CHECK - IN AURORA SUITES We’re elevating the onboard experience to capture premium demand HONOLULU LOUNGELEIHŌKŪ CHECK - IN LEIHŌKŪ SUITES
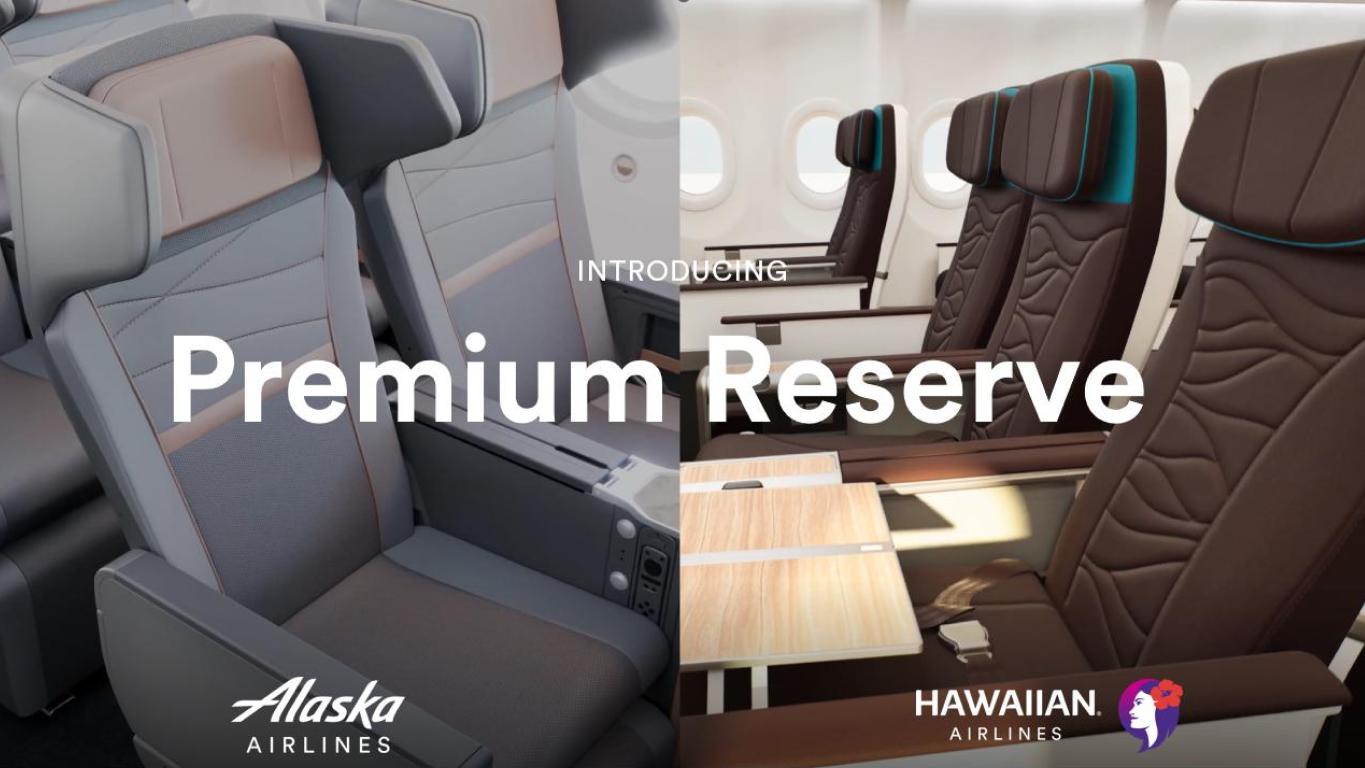
36 Premium Reserve INTRODUCING
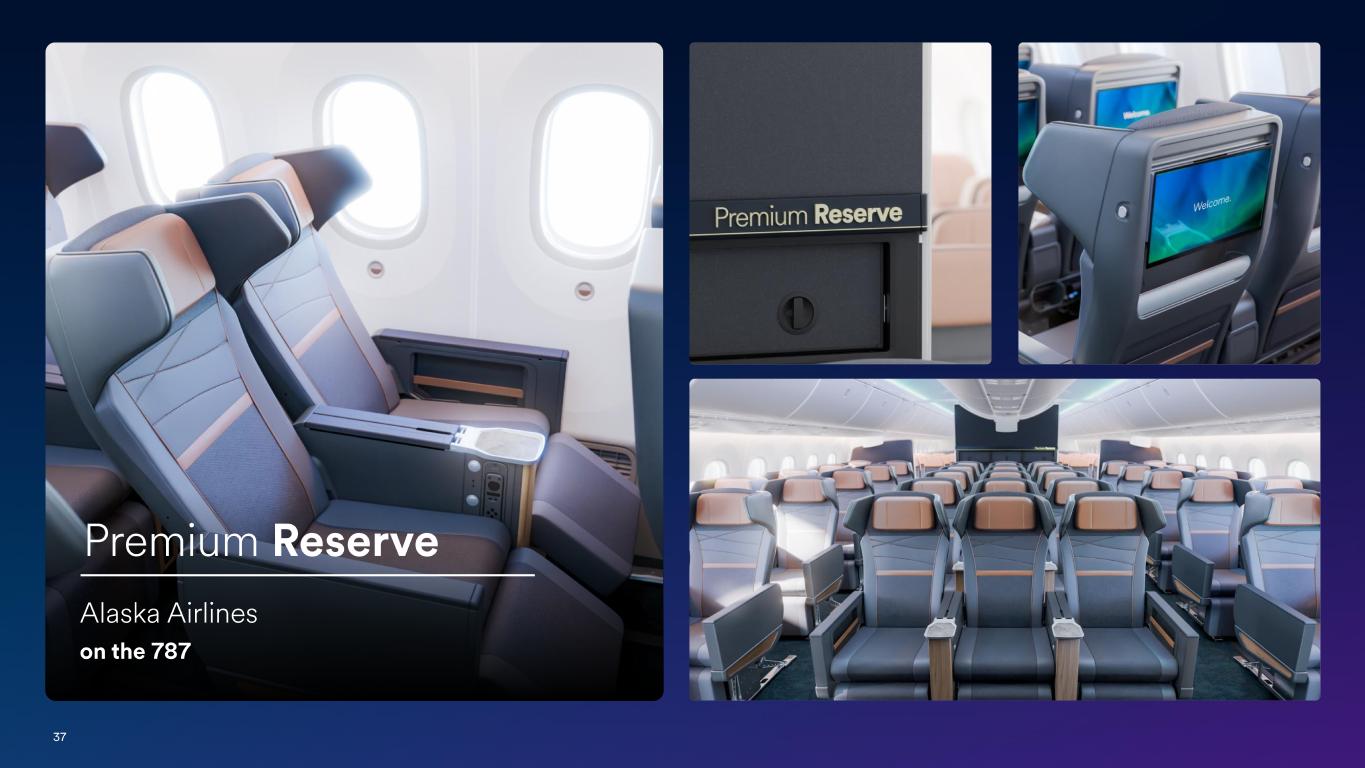
37 Alaska Airlines on the 787 Premium Reserve
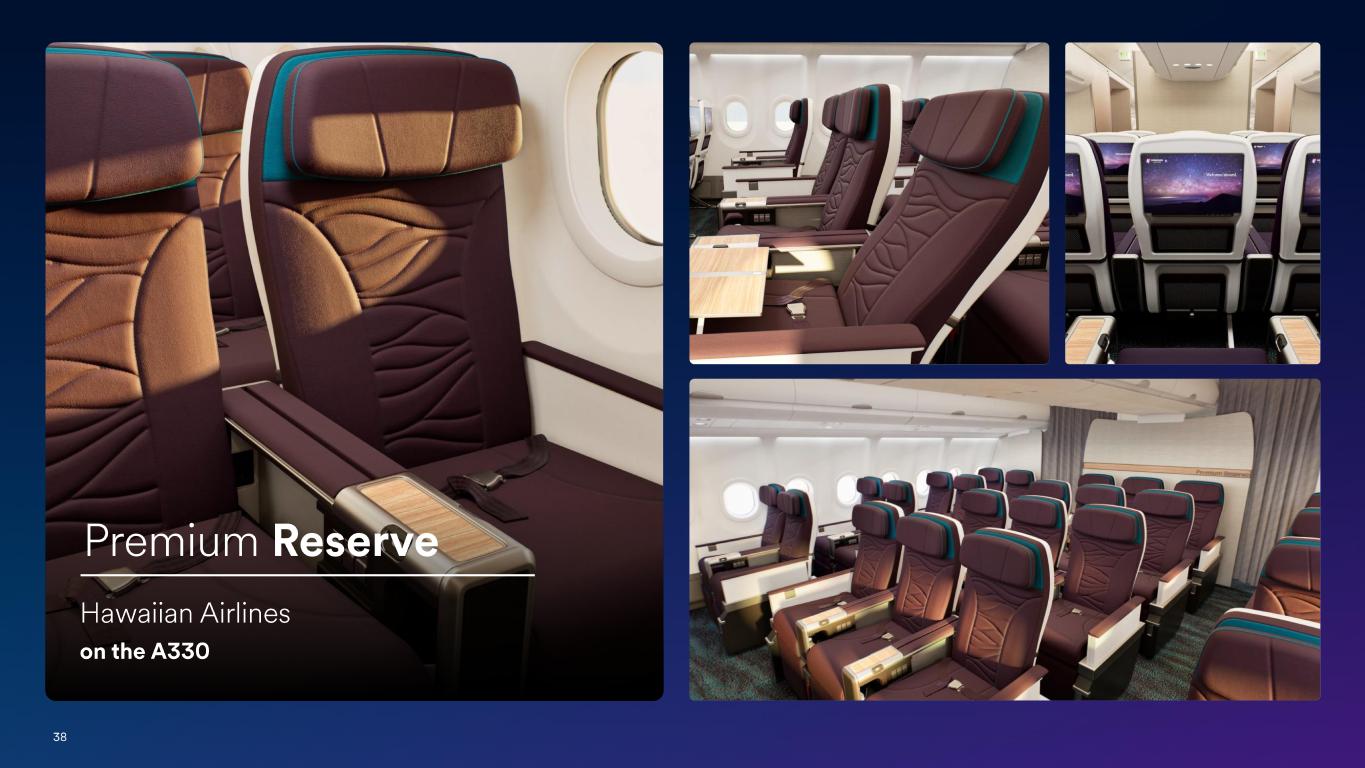
38 Hawaiian Airlines on the A330 Premium Reserve
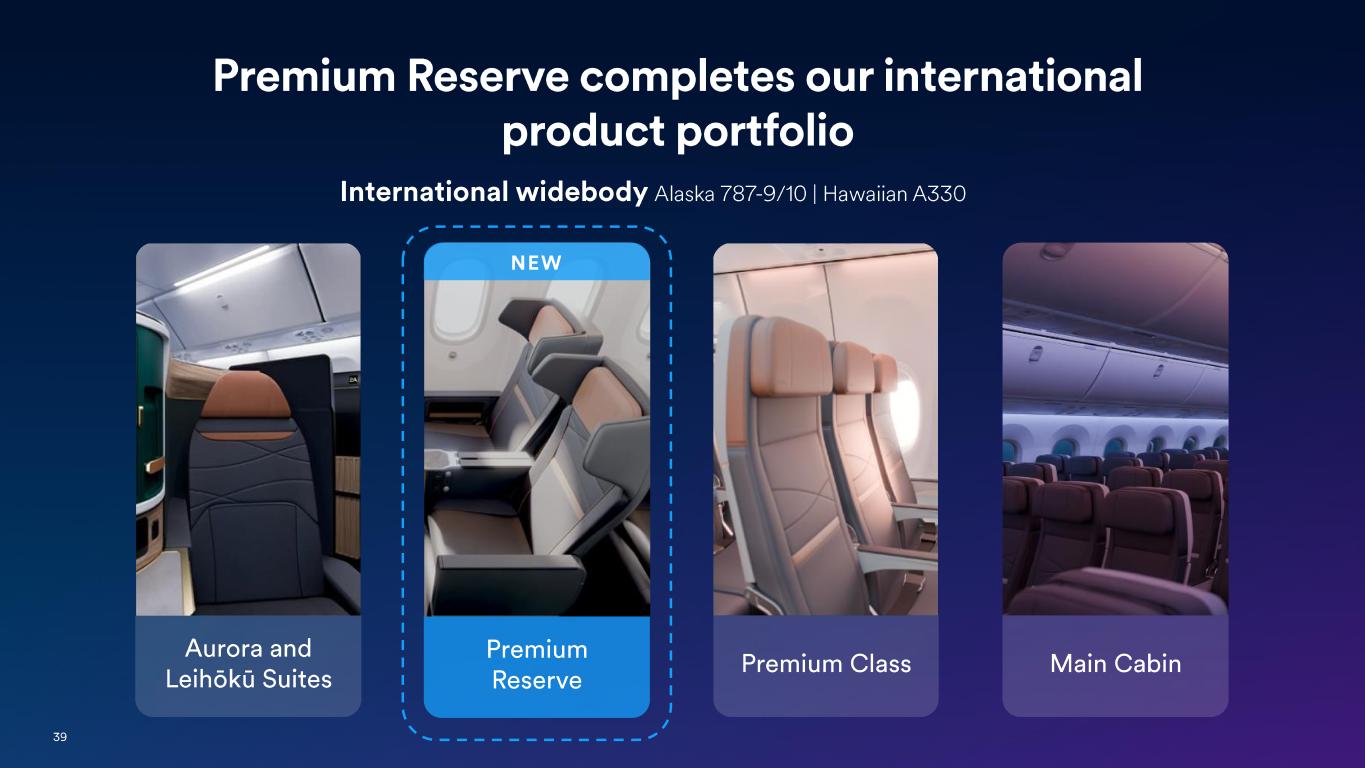
39 Premium Reserve completes our international product portfolio International widebody Alaska 787 -9/10 | Hawaiian A330 Aurora and Leihōkū Suites Premium Class Main Cabin Premium Reserve NEW
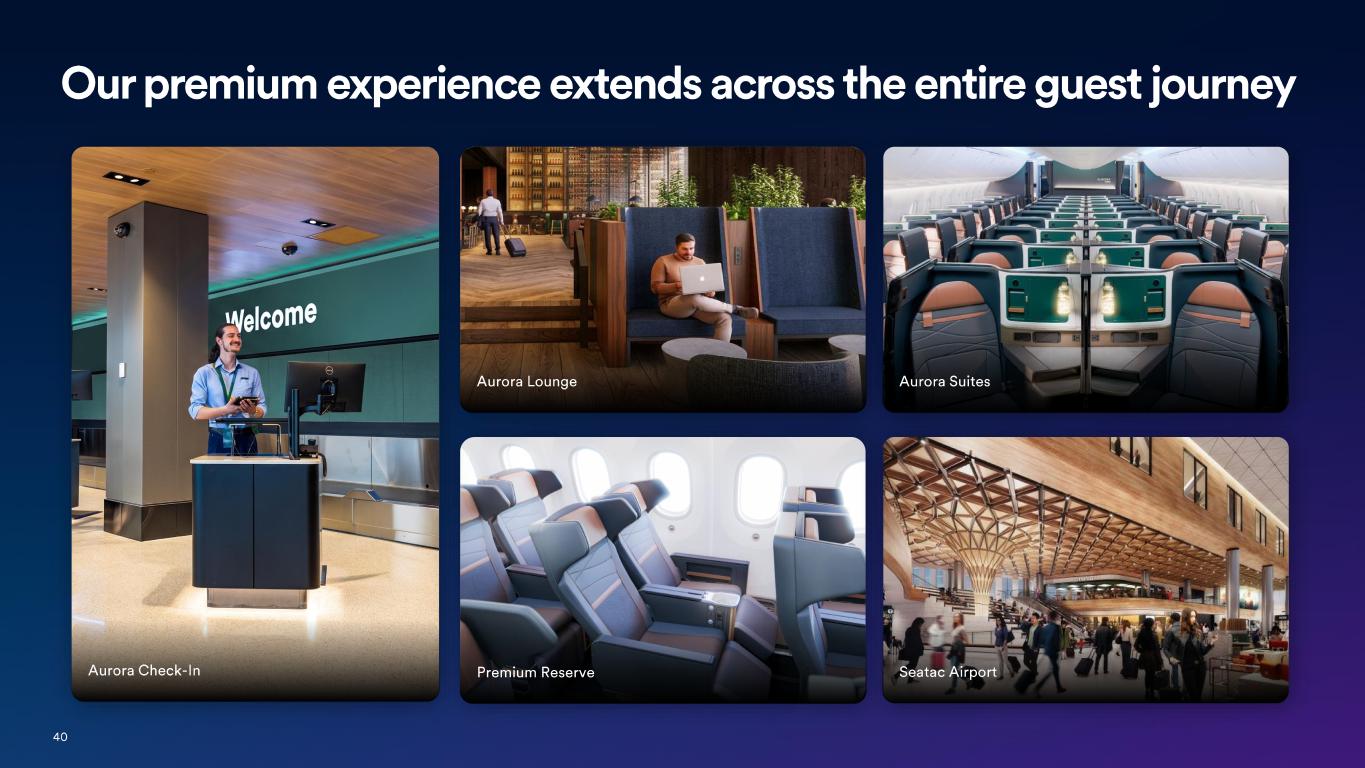
40 Our premium experience extends across the entire guest journey Aurora Check - In Aurora Lounge Premium Reserve Aurora Suites Seatac Airport
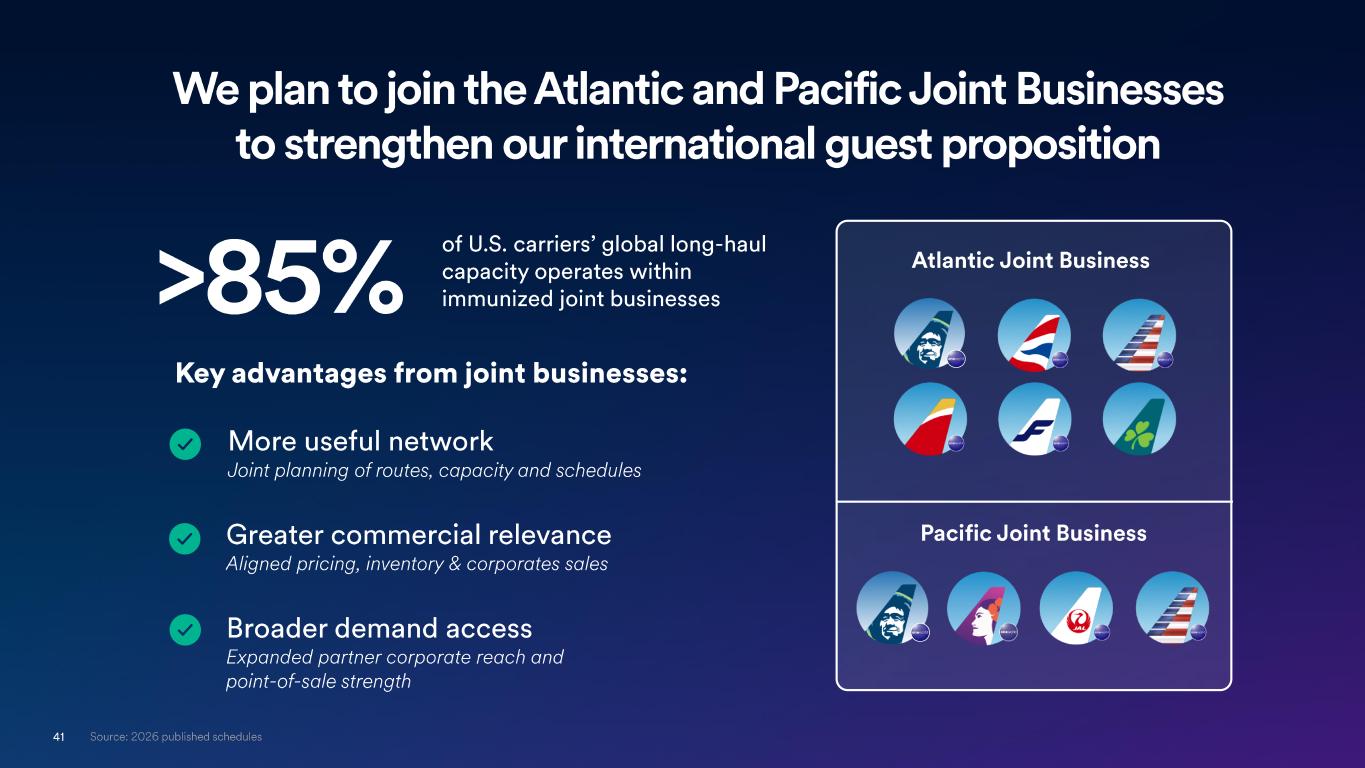
41 We plan to join the Atlantic and Pacific Joint Businesses to strengthen our international guest proposition Atlantic Joint Business Pacific Joint Business >85% of U.S. carriers’ global long -haul capacity operates within immunized joint businesses More useful network Joint planning of r outes , capacity and schedules Greater commercial relevance Aligned p ricing, inventory & corporates sales Broader demand access Expanded partner corporate reach and point-of-sale strength Key advantages from joint businesses: Submitted DOT filings for: Pacific Joint Business Source: 2026 published schedules
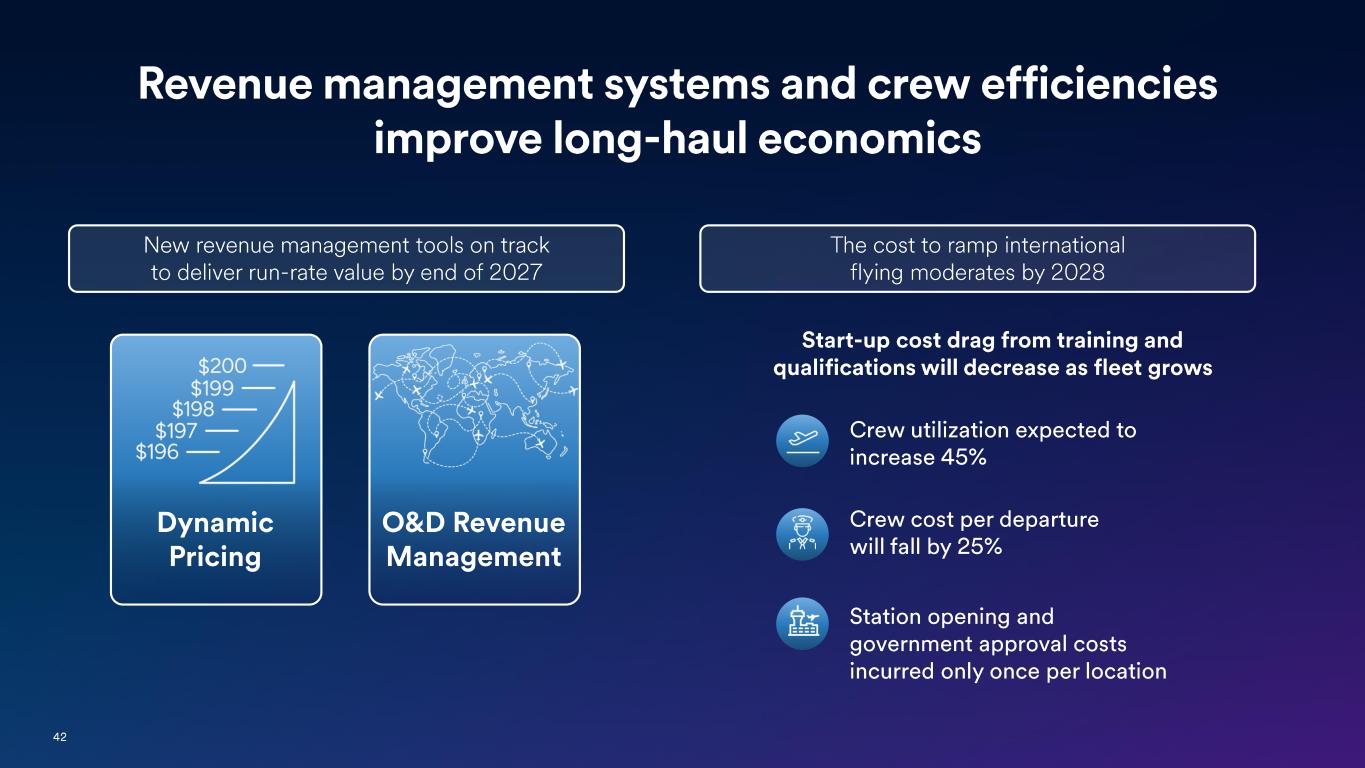
42 New revenue management tools on track to deliver run -rate value by end of 2027 The cost to ramp international flying moderates by 2028 O&D Revenue Management Dynamic Pricing Crew cost per departure will fall by 25% Start -up cost drag from training and qualifications will decrease as fleet grows Crew utilization expected to increase 45% Station opening and government approval costs incurred only once per location Revenue management systems and crew efficiencies improve long -haul economics

43 Portland
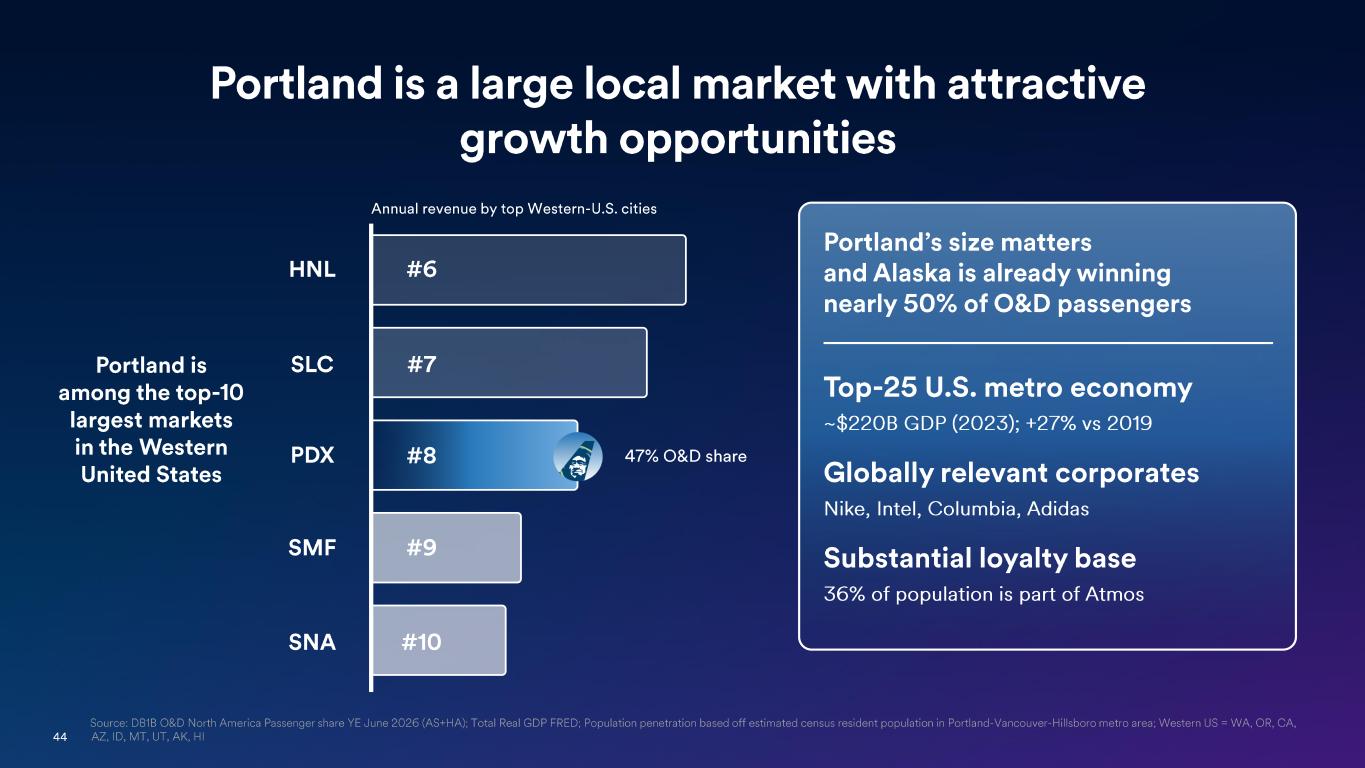
44 Portland’s size matters and Alaska is already winning nearly 50% of O&D passengers Top -25 U.S. metro economy ~$220B GDP (2023); +27% vs 2019 Globally relevant corporates Nike, Intel, Columbia, Adidas Substantial loyalty base 36% of population is part of Atmos Source: DB1B O&D North America Passenger share YE June 2026 (AS+HA); Total Real GDP FRED; Population penetration based off es timated census resident population in Portland -Vancouver -Hillsboro metro area; Western US = WA, OR, CA, AZ, ID, MT, UT, AK, HI Annual revenue by top Western -U.S. cities Portland is among the top -10 largest markets in the Western United States SNA #10 SMF #9 SLC #7 HNL #6 PDX #8 47% O&D share Portland is a large local market with attractive growth opportunities
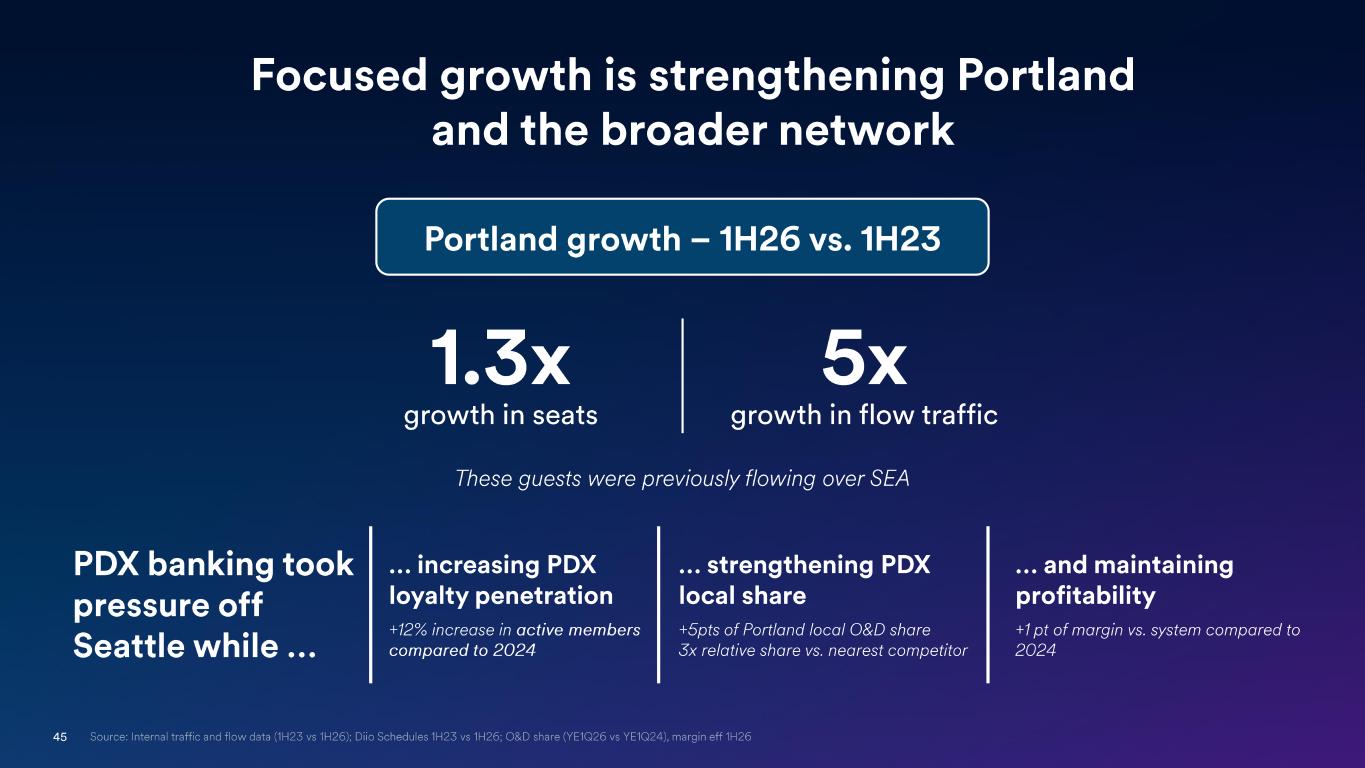
45 Source: Internal traffic and flow data (1H23 vs 1H26); Diio Schedules 1H23 vs 1H26; O&D share (YE1Q26 vs YE1Q24), margin eff 1H26 Focused growth is strengthening Portland and the broader network These guests were previously flowing over SEA Portland growth – 1H26 vs. 1H23 1.3x growth in seats 5x growth in flow traffic PDX banking took pressure off Seattle while … … increasing PDX loyalty penetration +12% increase in active members compared to 2024 … strengthening PDX local share +5pts of Portland local O&D share 3x relative share vs. nearest competitor … and maintaining profitability +1 pt of margin vs. system compared to 2024
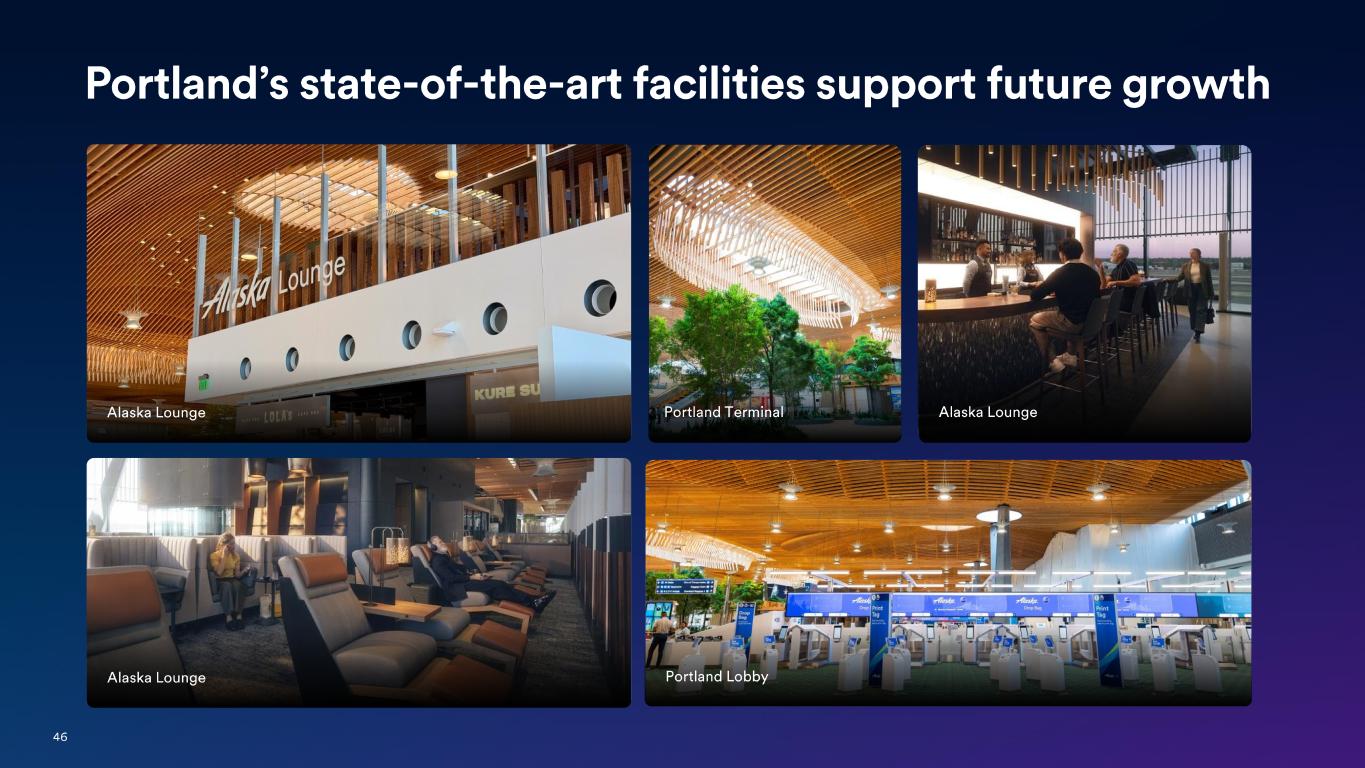
46 Alaska Lounge Portland LobbyAlaska Lounge Alaska Lounge Portland’s state -of-the-art facilities support future growth Portland Terminal
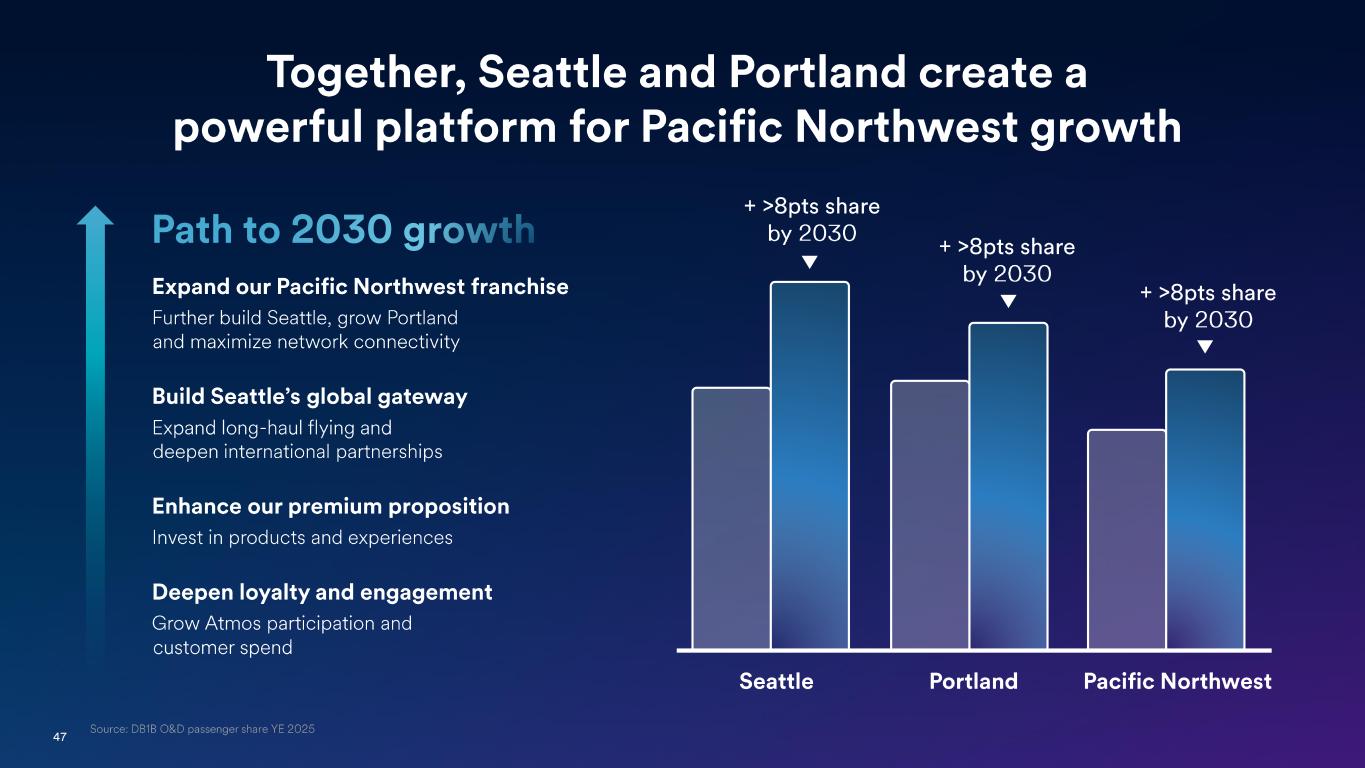
47 Path to 2030 growth + >8 pts share by 2030 Pacific NorthwestSeattle Portland Together, Seattle and Portland create a powerful platform for Pacific Northwest growth Expand our Pacific Northwest franchise Further build Seattle, grow Portland and maximize network connectivity Build Seattle’s global gateway Expand long -haul flying and deepen international partnerships Enhance our premium proposition Invest in products and experiences Deepen loyalty and engagement Grow Atmos participation and customer spend + >8pts share by 2030 + >8pts share by 2030 Source: DB1B O&D passenger share YE 2025
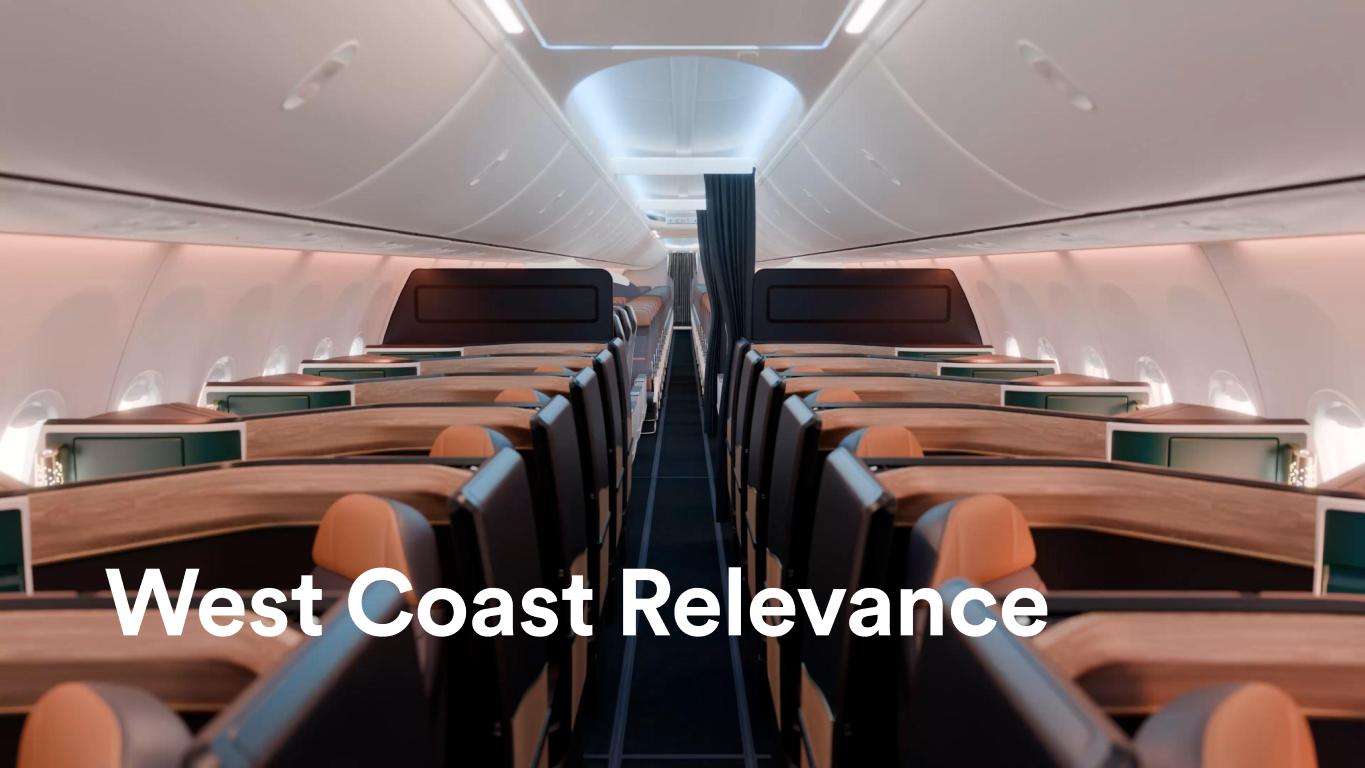
West Coast Relevance
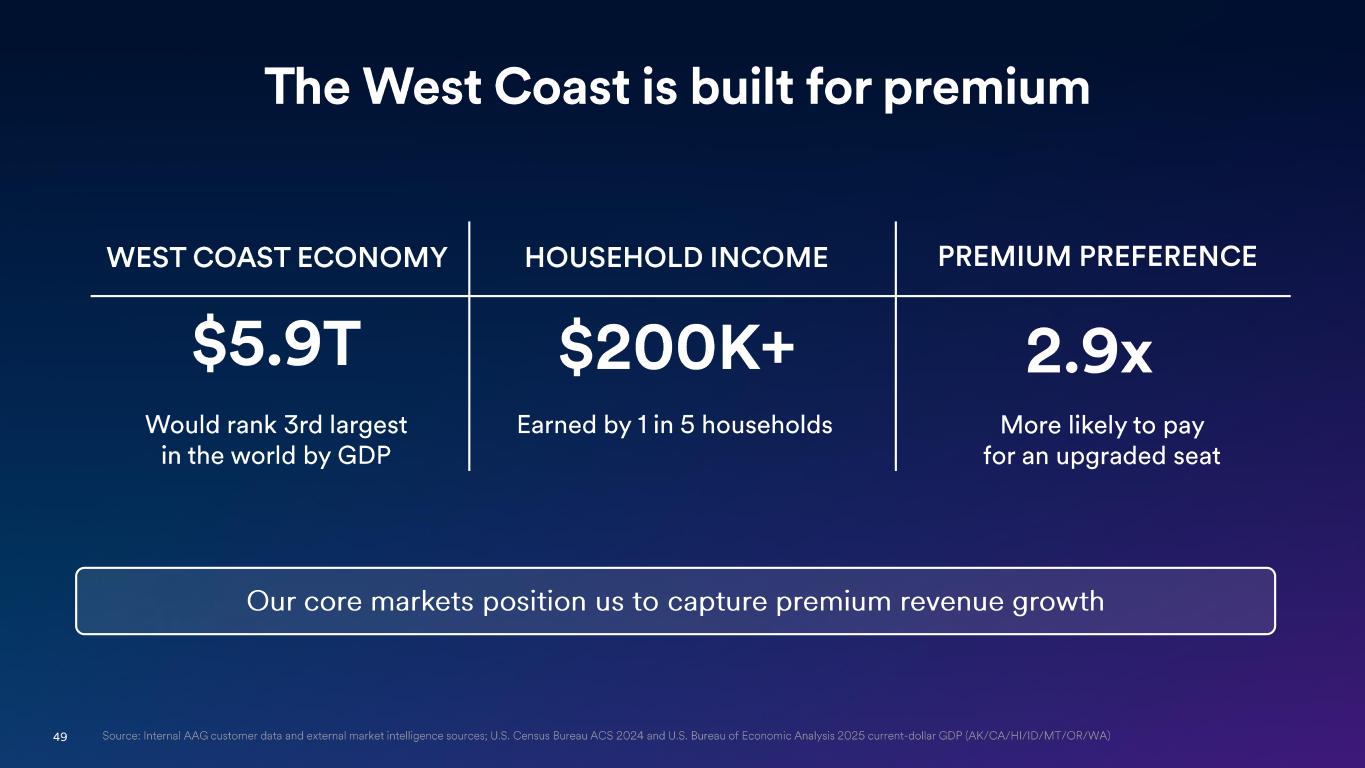
49 The West Coast is built for premium WEST COAST ECONOMY HOUSEHOLD INCOME PREMIUM PREFERENCE $5.9T $200K+ 2.9x Would rank 3rd largest in the world by GDP Earned by 1 in 5 households More likely to pay for an upgraded seat Our c ore markets position us to capture premium revenue growth Source: Internal AAG customer data and external market intelligence sources; U.S. Census Bureau ACS 2024 and U.S. Bureau of E con omic Analysis 2025 current -dollar GDP (AK/CA/HI/ID/MT/OR/WA)
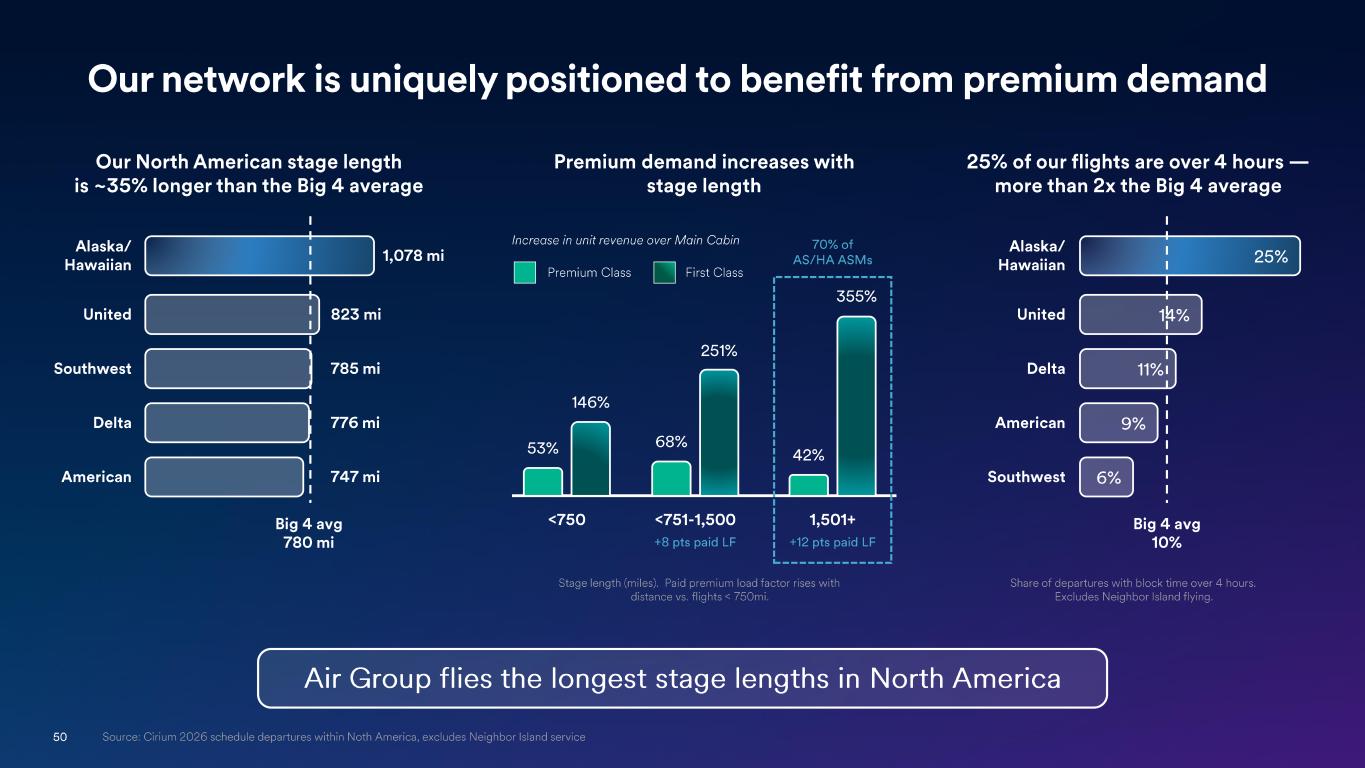
50 Our network is uniquely positioned to benefit from premium demand Air Group flies the longest stage lengths in North America 25% of our flights are over 4 hours — more than 2x the Big 4 average Alaska/ Hawaiian 25% United 14% Delta 11% American 9% Southwest 6% Big 4 avg 10% Share of departures with block time over 4 hours. Excludes Neighbor Island flying. Our North American stage length is ~35% longer than the Big 4 average Alaska/ Hawaiian 1,078 mi United 823 mi Southwest 785 mi Delta 776 mi American 747 mi Big 4 avg 780 mi Premium demand increases with stage length Stage length (miles). Paid premium load factor rises with distance vs. flights < 750mi. Increase in unit revenue over Main Cabin Premium Class First Class 53% 146% <750 68% 251% <751-1,500 +8 pts paid LF 42% 355% 1,501+ +12 pts paid LF 70% of AS/HA ASMs Source: Cirium 2026 schedule departures within Noth America, excludes Neighbor Island service

51 PREMIUM DOMESTIC TRANSCON on the 737 -10 MAX
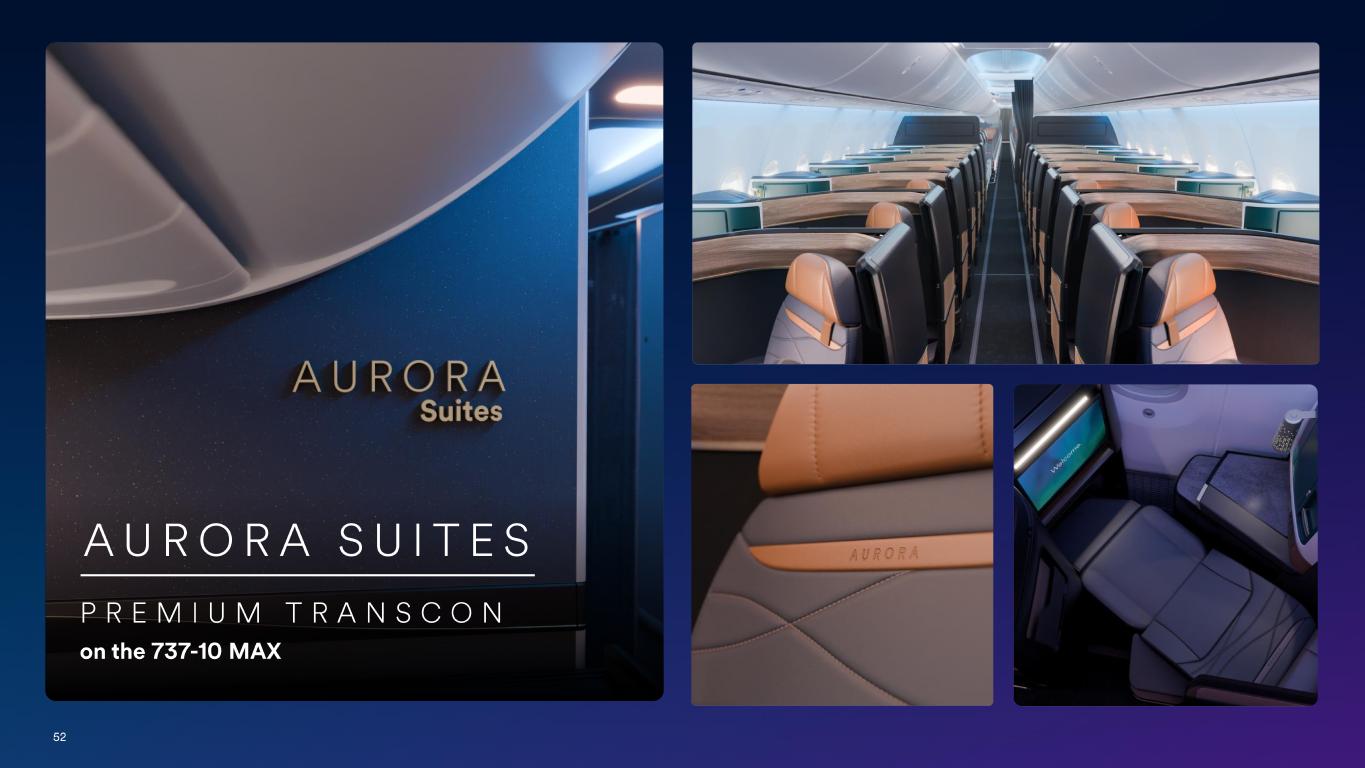
52 PREMIUM TRANSCON on the 737 -10 MAX AURORA SUITES
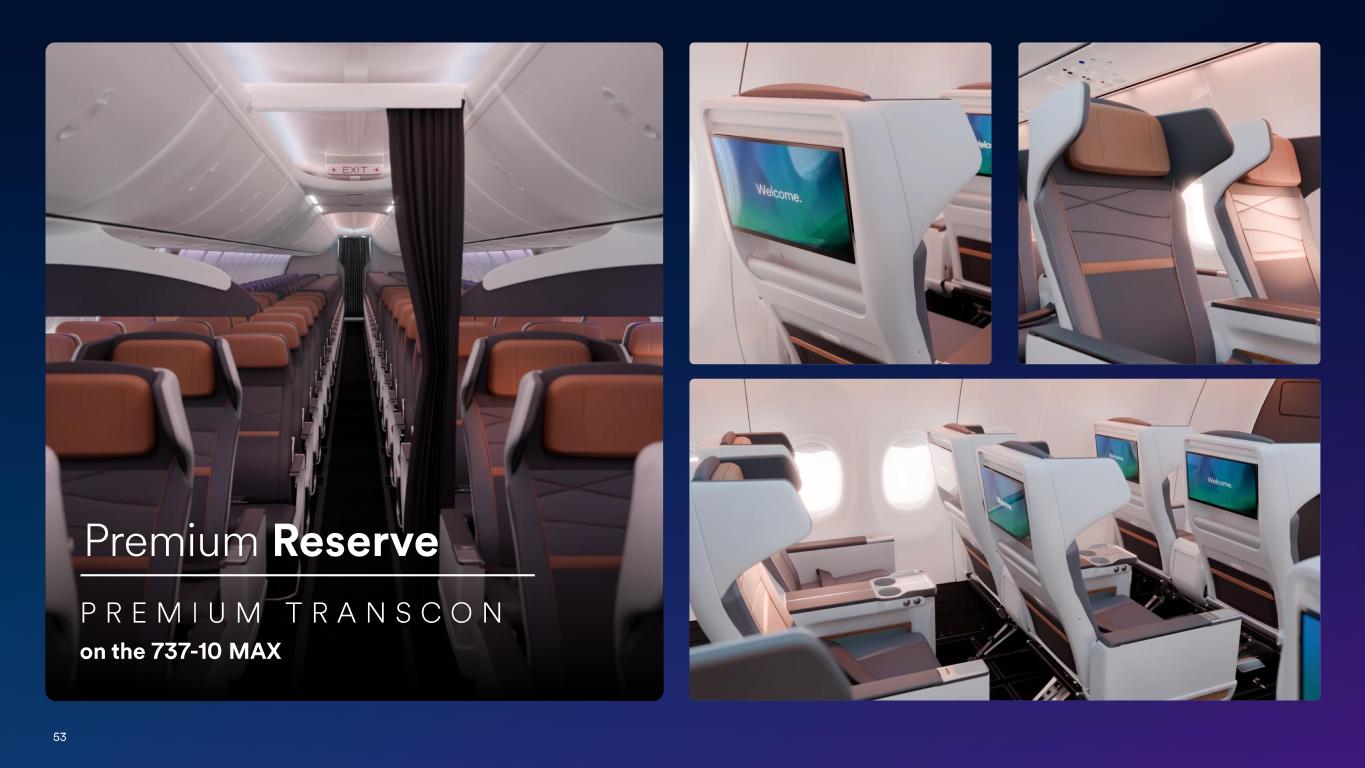
53 PREMIUM TRANSCON on the 737 -10 MAX Premium Reserve
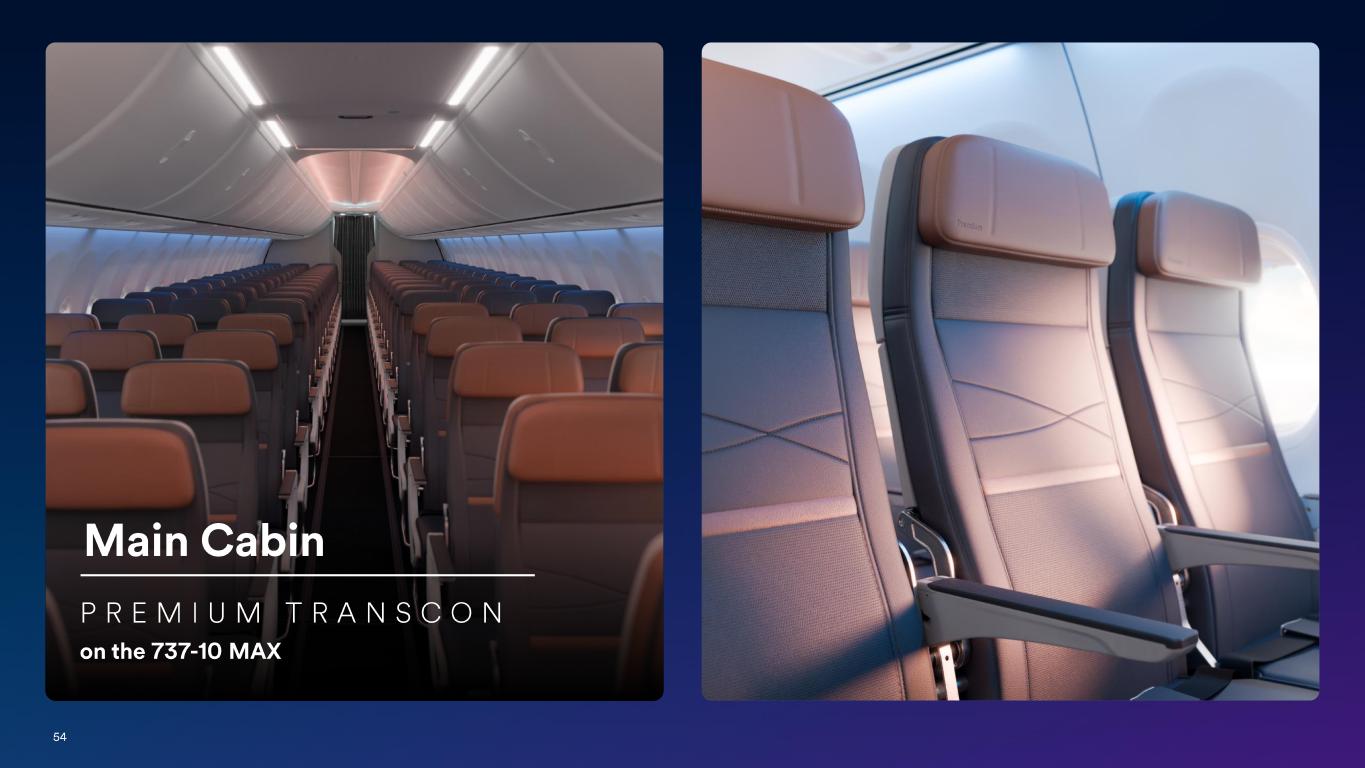
54 PREMIUM TRANSCON on the 737 -10 MAX Main Cabin
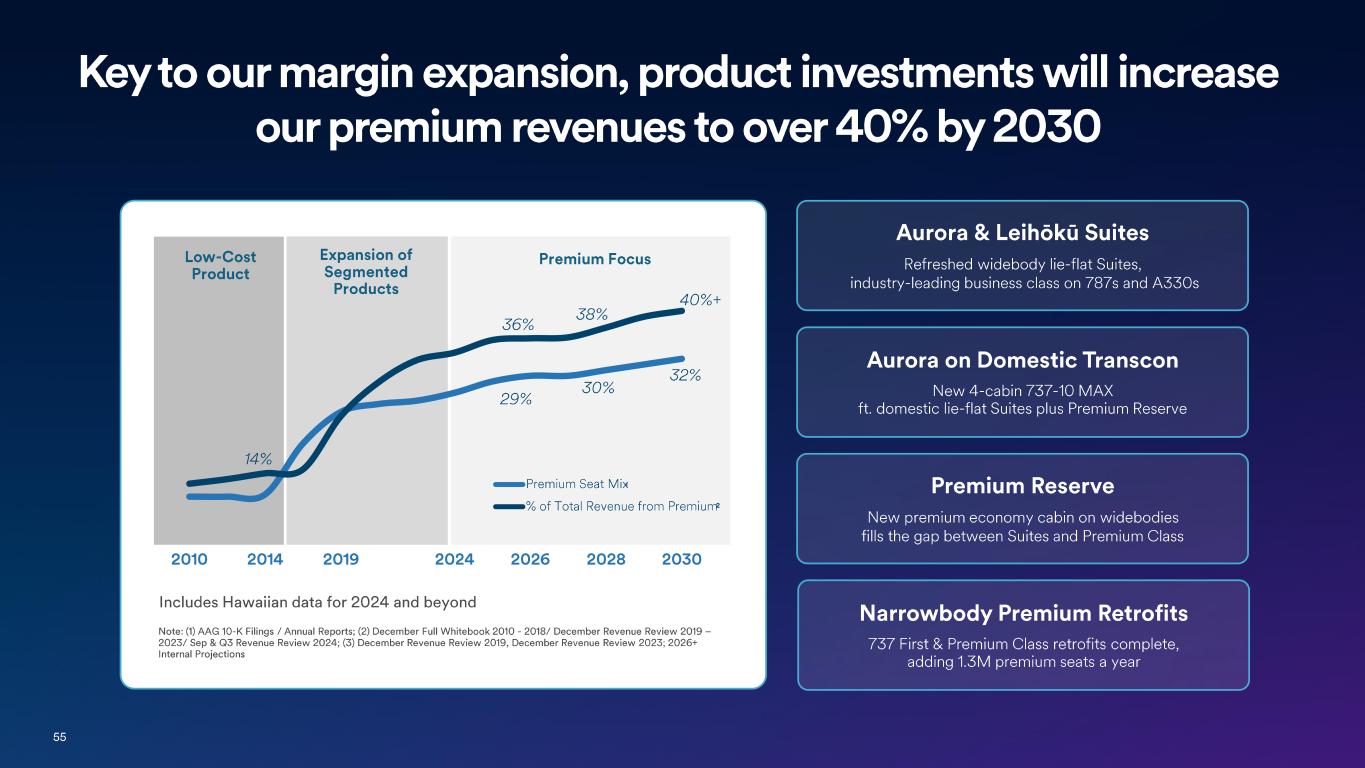
55 Key to our margin expansion, product investments will increase our premium revenues to over 40% by 2030 Low -Cost Product Expansion of Segmented Products 40%+ 38% 36% 29% 14% 30% Premium Focus 2010 2014 2019 2024 2026 2028 2030 Premium Seat Mix % of Total Revenue from Premium 32% 1 2 Note: (1) AAG 10 -K Filings / Annual Reports; (2) December Full Whitebook 2010 - 2018/ December Revenue Review 2019 – 2023/ Sep & Q3 Revenue Review 2024; (3) December Revenue Review 2019, December Revenue Review 2023; 2026+ Internal Projections Includes Hawaiian data for 2024 and beyond Aurora & Leihōkū Suites Refreshed widebody lie -flat Suites, industry - leading business class on 787s and A330s Aurora on Domestic Transcon New 4 -cabin 737 -10 MAX ft. domestic lie -flat Suites plus Premium Reserve Premium Reserve New premium economy cabin on widebodies fills the gap between Suites and Premium Class Narrowbody Premium Retrofits 737 First & Premium Class retrofits complete, adding 1.3M premium seats a year
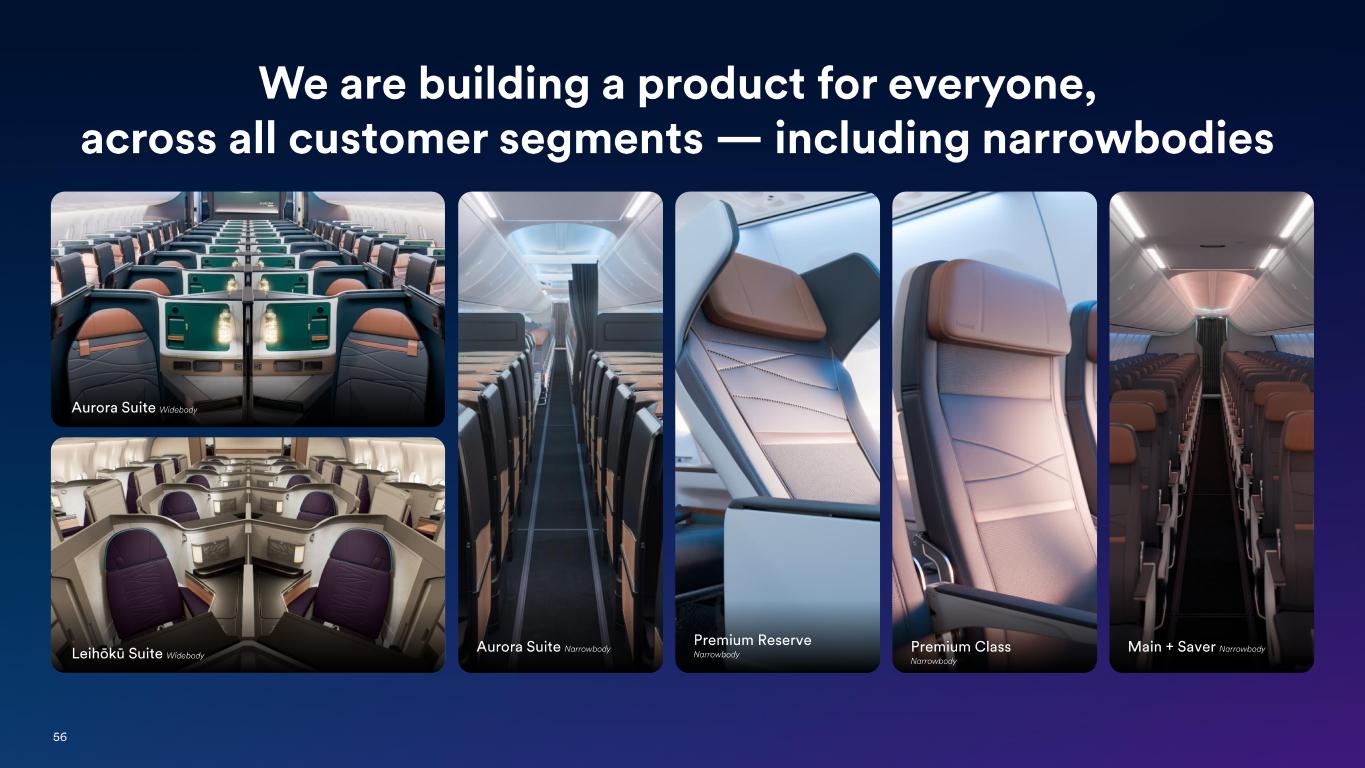
56 We are building a product for everyone, across all customer segments — including narrowbodies Main + Saver Narrowbody Premium Reserve Narrowbody Aurora Suite Narrowbody Aurora Suite Widebody Leihōkū Suite Widebody Premium Class Narrowbody

California
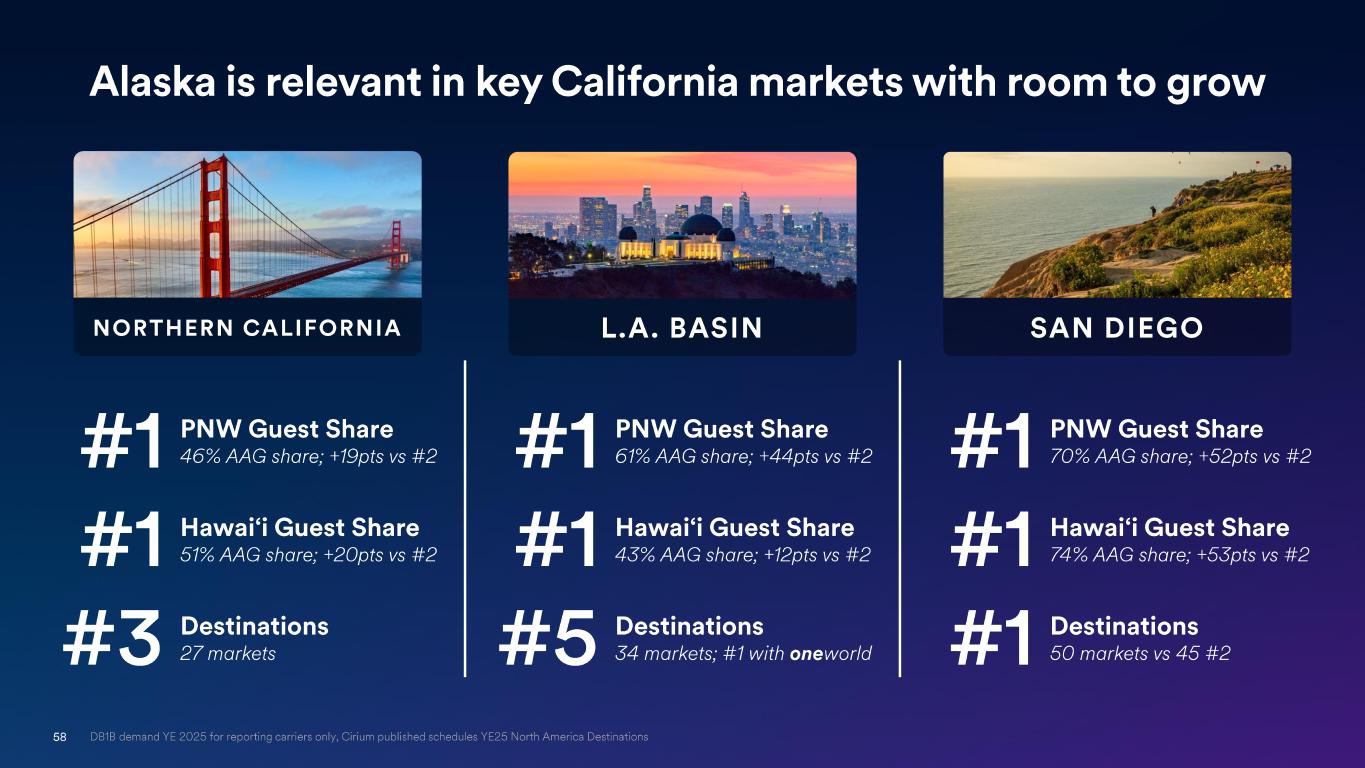
58 DB1B demand YE 2025 for reporting carriers only, Cirium published schedules YE25 North America Destinations NORTHERN CALIFORNIA PNW Guest Share 46% AAG share; +19pts vs #2#1 Hawai‘i Guest Share 51% AAG share; +20pts vs #2#1 Destinations 27 markets#3 L.A. BASIN PNW Guest Share 61% AAG share; +44pts vs #2#1 Hawai‘i Guest Share 43% AAG share; +12pts vs #2#1 Destinations 34 markets; #1 with one world#5 SAN DIEGO PNW Guest Share 70% AAG share; +52pts vs #2#1 Hawai‘i Guest Share 74% AAG share; +53pts vs #2#1 Destinations 50 markets vs 45 #2#1 Alaska is relevant in key California markets with room to grow
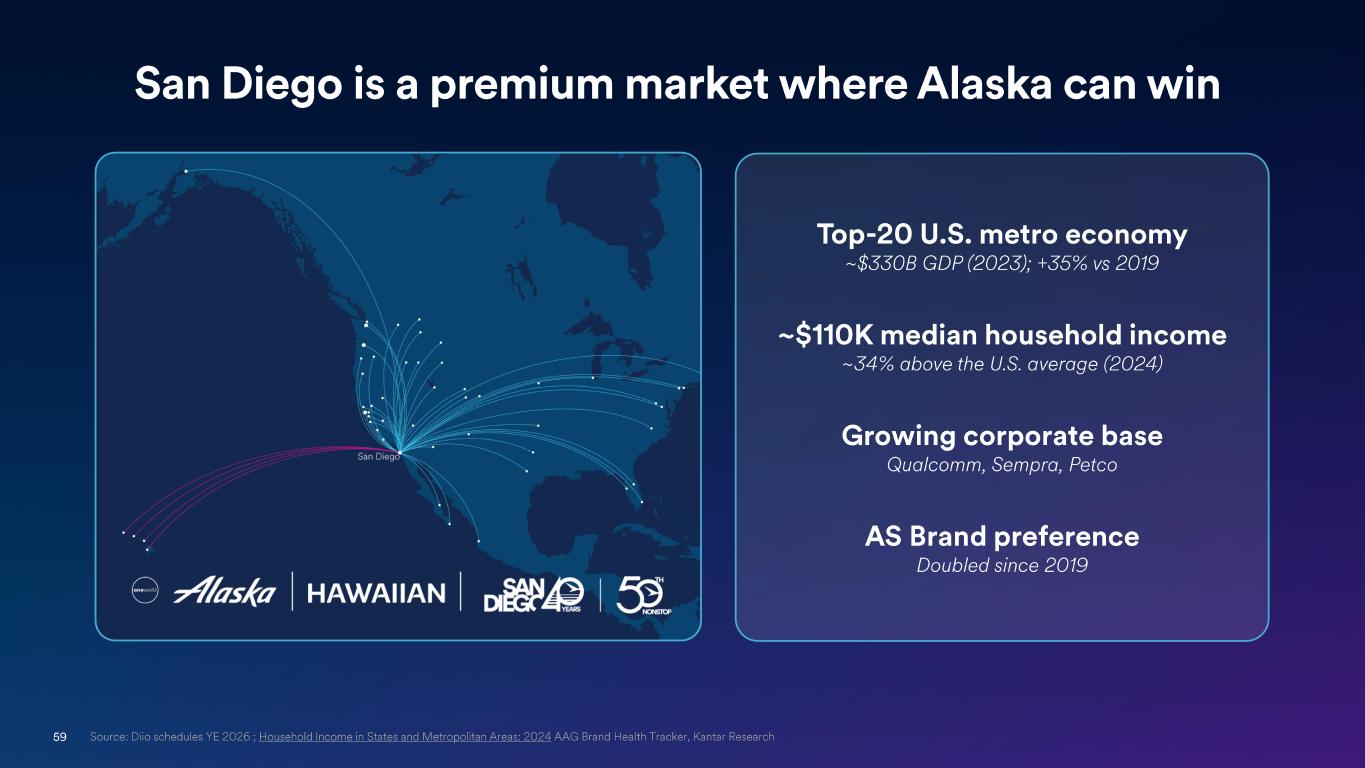
59 Source: Diio schedules YE 2026 ; Household Income in States and Metropolitan Areas: 2024 AAG Brand Health Tracker, Kantar Research San Diego is a premium market where Alaska can win Top -20 U.S. metro economy ~$330B GDP (2023); +35% vs 2019 ~$110K median household income ~34% above the U.S. average (2024) Growing corporate base Qualcomm, Sempra, Petco AS Brand preference Doubled since 2019
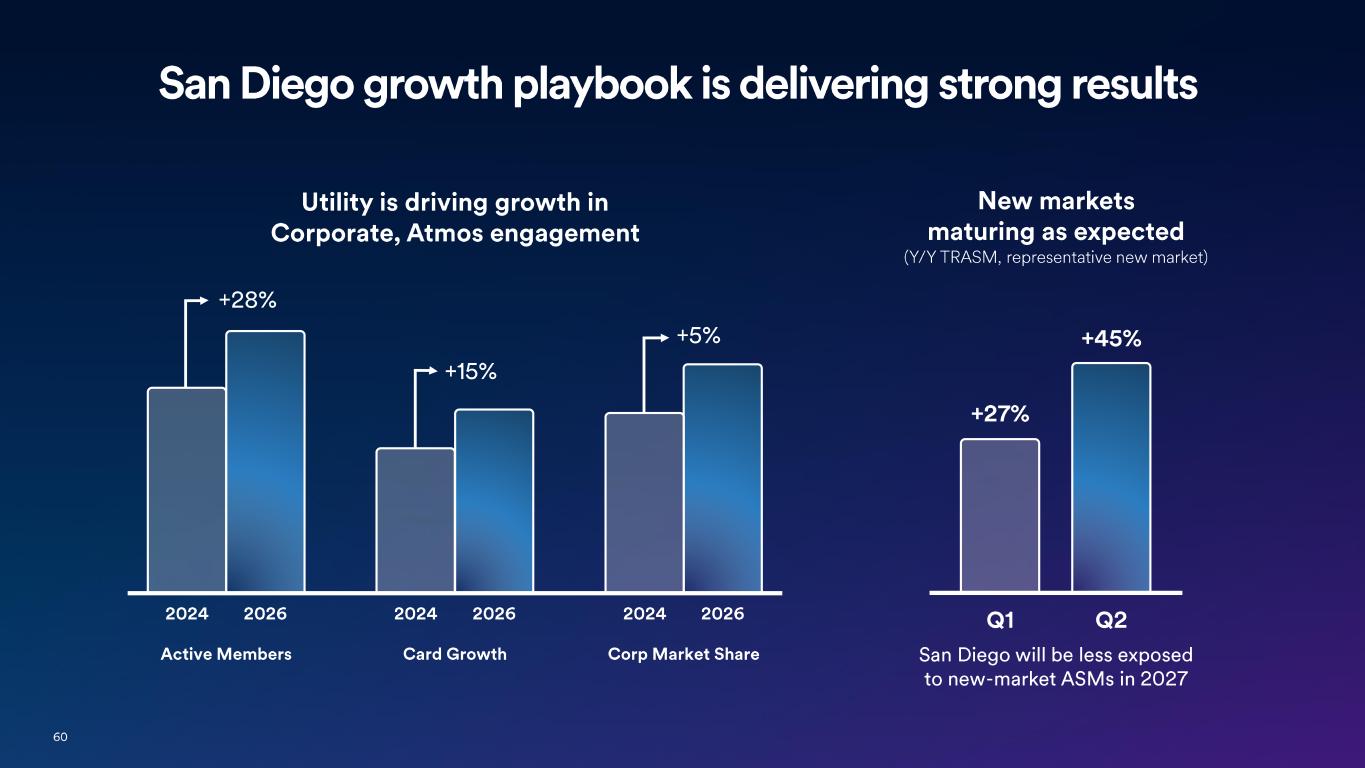
60 San Diego growth playbook is delivering strong results New markets maturing as expected (Y/Y TRASM, representative new market) San Diego will be less exposed to new -market ASMs in 2027 +27% Q1 +45% Q2 Utility is driving growth in Corporate, Atmos engagement Corp Market Share +5% 20262024 Card Growth +15% 20262024 Active Members +28% 20262024
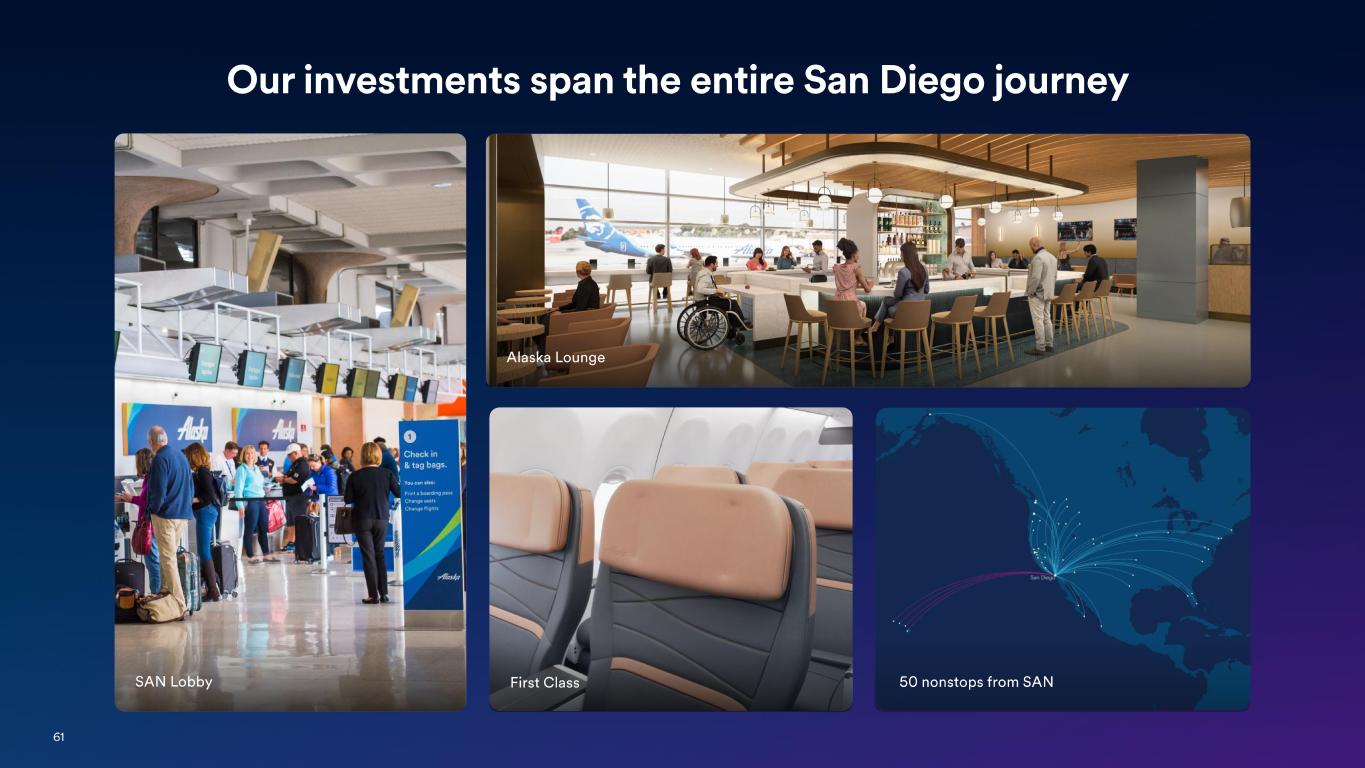
61 SAN Lobby First Class 50 nonstops from SAN Alaska Lounge Our investments span the entire San Diego journey
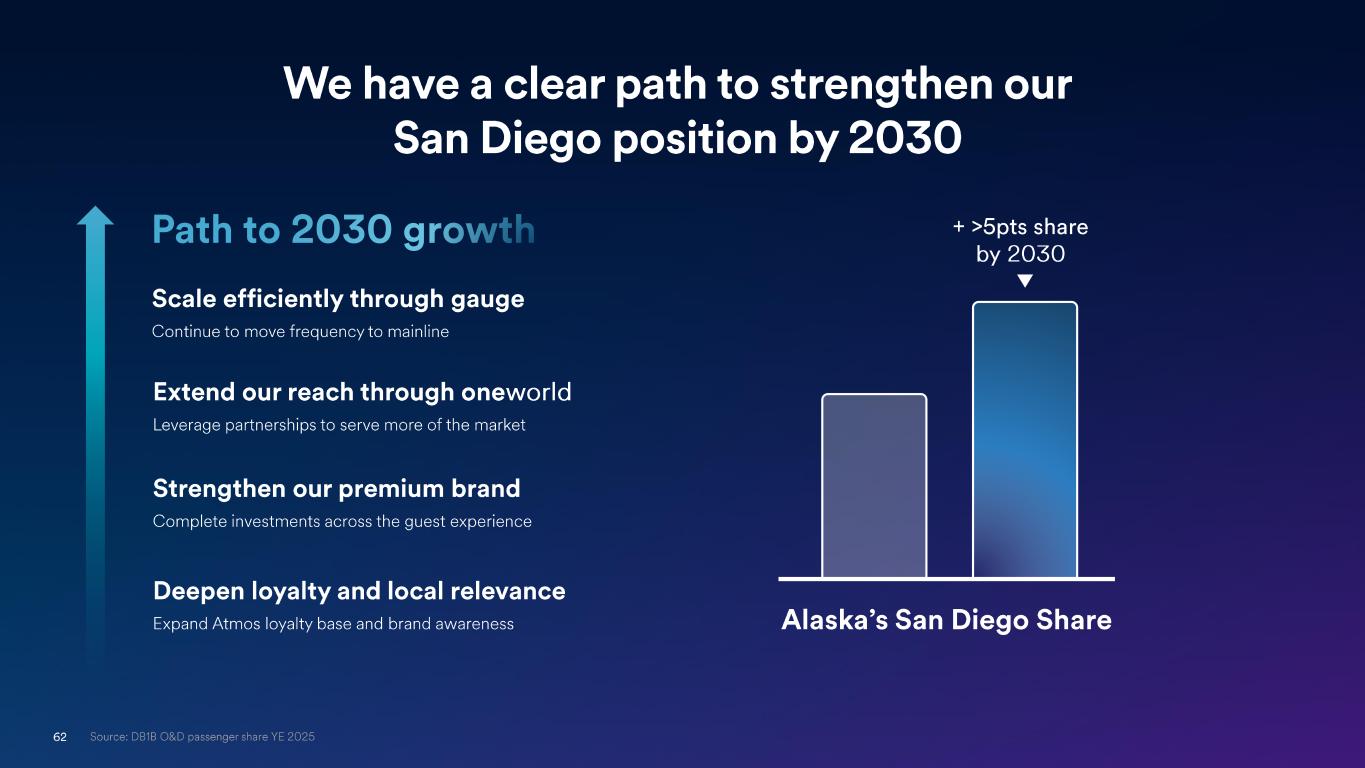
62 Path to 2030 growth Alaska’s San Diego Share Scale efficiently through gauge Continue to move frequency to mainline Strengthen our premium brand Complete investments across the guest experience Deepen loyalty and local relevance Expand Atmos loyalty base and brand awareness Extend our reach through one world Leverage partnerships to serve more of the market Source: DB1B O&D passenger share YE 2025 We have a clear path to strengthen our San Diego position by 2030 + >5pts share by 2030
63 Diana Birkett Rakow CEO, Hawaiian Airlines Hawai‘i’s #1 Trusted Airline

Hawai‘i
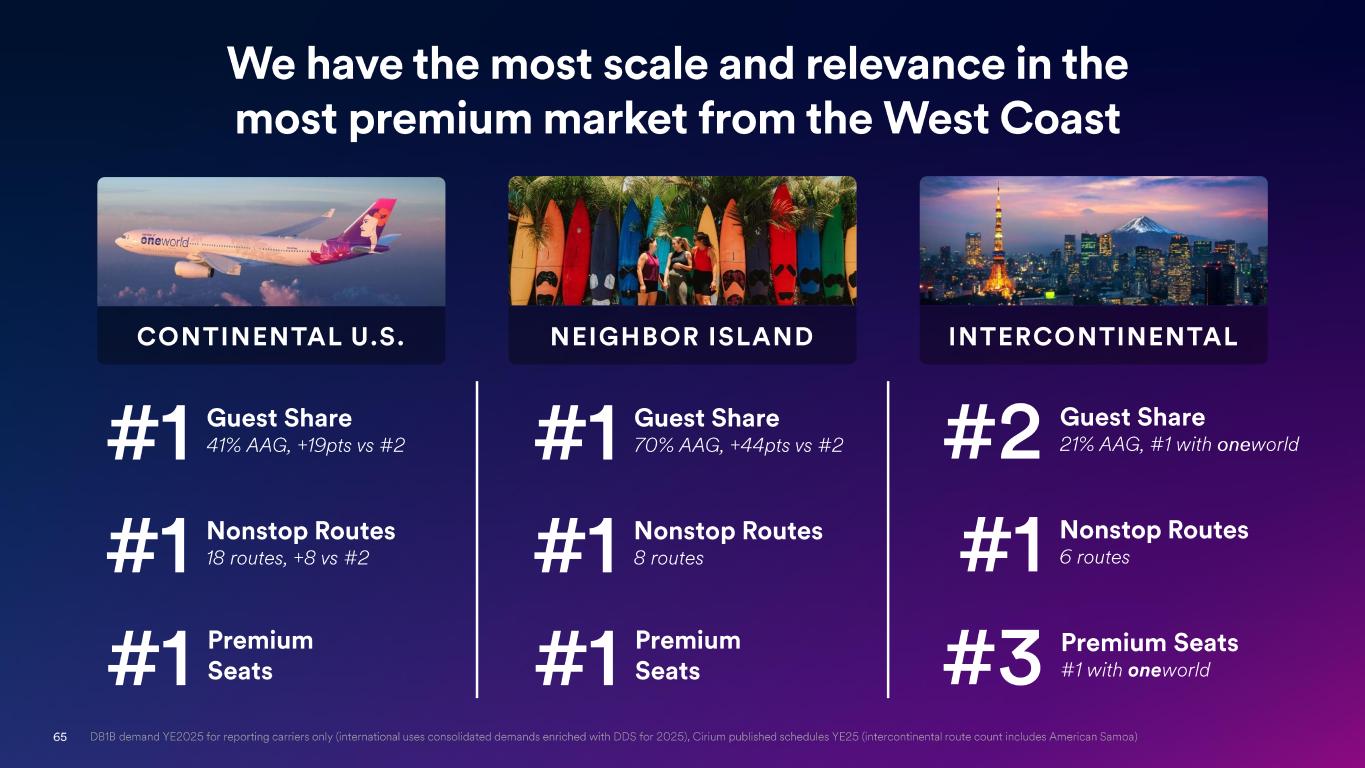
65 DB1B demand YE2025 for reporting carriers only (international uses consolidated demands enriched with DDS for 2025), Cirium p ublished schedules YE25 (intercontinental route count includes American Samoa) We have the most scale and relevance in the most premium market from the West Coast Guest Share 41% AAG, +19pts vs #2#1 Nonstop Routes 18 routes, +8 vs #2#1 Premium Seats#1 CONTINENTAL U.S. Guest Share 21% AAG, #1 with one world#2 Nonstop Routes 6 routes#1 Premium Seats #1 with one world#3 INTERCONTINENTALNEIGHBOR ISLAND Guest Share 70% AAG, +44pts vs #2#1 Nonstop Routes 8 routes#1 Premium Seats#1
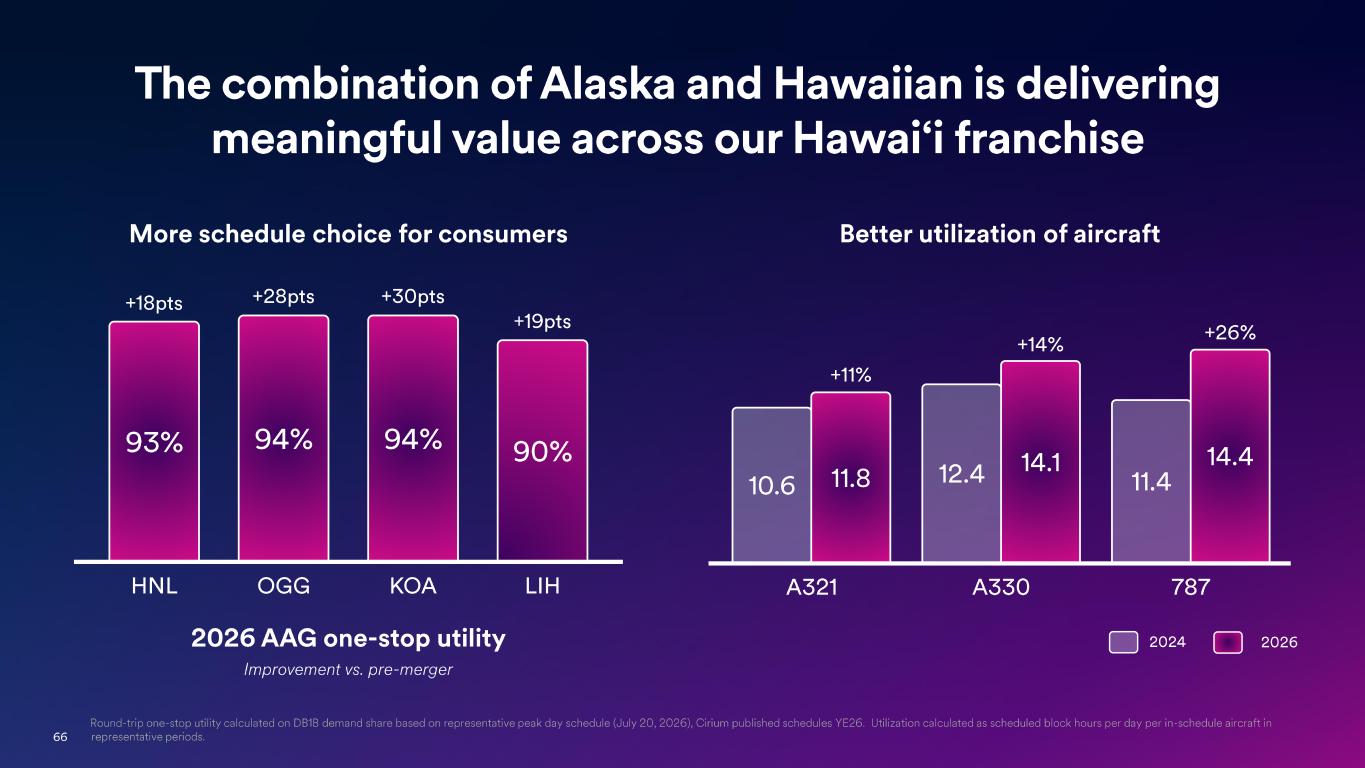
66 2026 AAG one -stop utility Improvement vs. pre -merger More schedule choice for consumers 93% HNL +18pts 94% OGG +28pts 94% KOA +30pts 90% LIH +19pts Better utilization of aircraft 2024 2026 A321 10.6 11.8 +11% A330 12.4 14.1 +14% 787 11.4 14.4 +26% The combination of Alaska and Hawaiian is delivering meaningful value across our Hawai ‘i franchise Round -trip one -stop utility calculated on DB1B demand share based on representative peak day schedule (July 20, 2026), Cirium pu blished schedules YE26. Utilization calculated as scheduled block hours per day per in -schedule aircraft in representative periods.
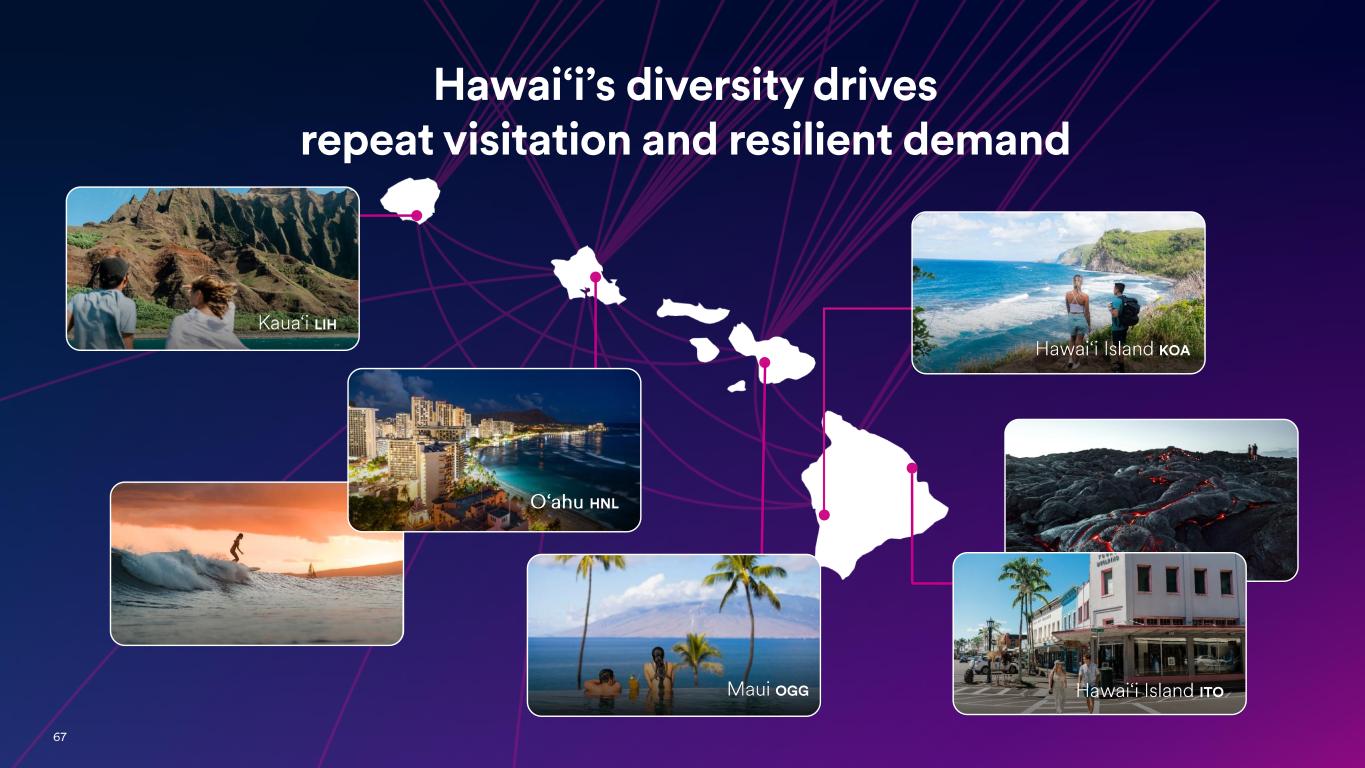
67 Hawai‘i’s diversity drives repeat visitation and resilient demand Hawai‘i Island KOA Maui OGG O‘ahu HNL Hawai‘i Island ITO Kaua‘i LIH
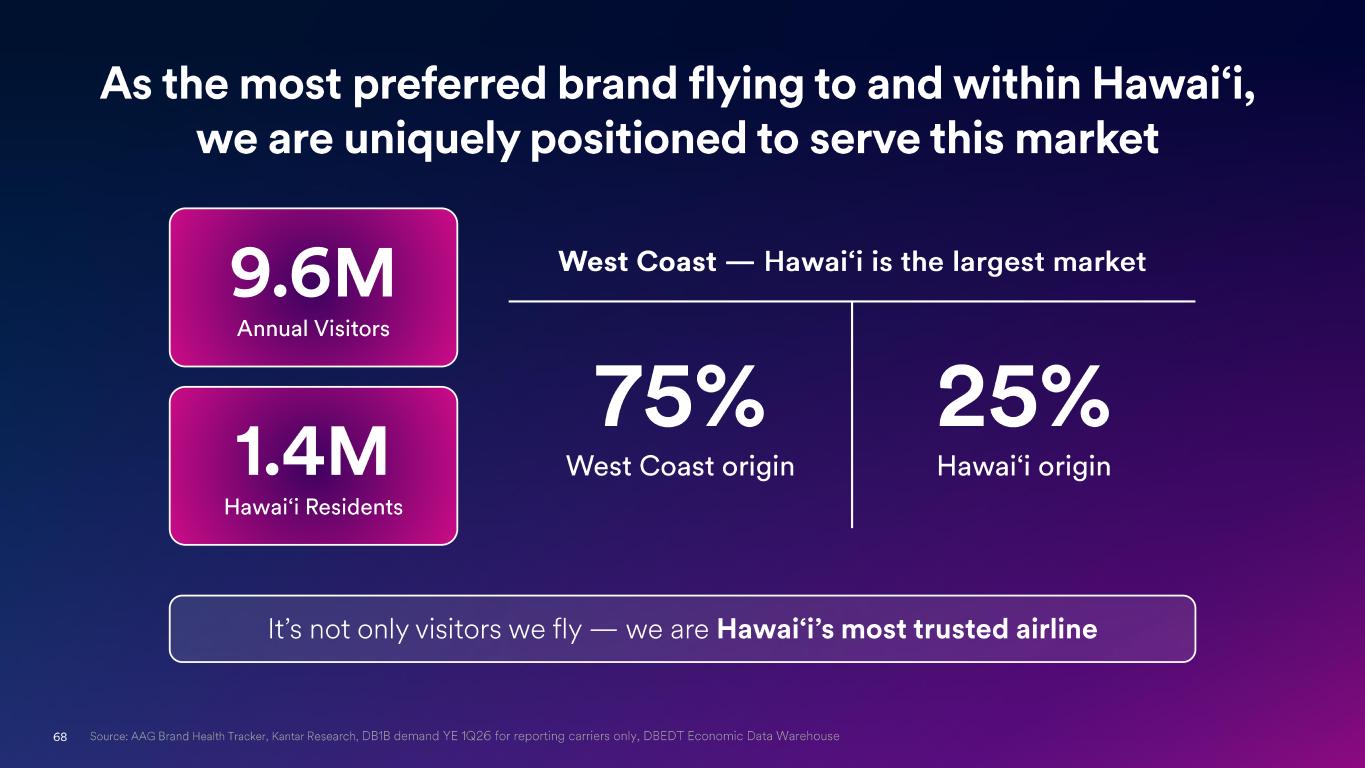
68 Source: AAG Brand Health Tracker, Kantar Research, DB1B demand YE 1Q26 for reporting carriers only, DBEDT Economic Data Warehouse As the most preferred brand flying to and within Hawai‘i, we are uniquely positioned to serve this market West Coast — Hawai‘i is the largest market 75% West Coast origin 25% Hawai‘i origin It’s not only visitors we fly — we are Hawai‘i’s most trusted airline 9.6M Annual Visitors 1.4M Hawai‘i Residents
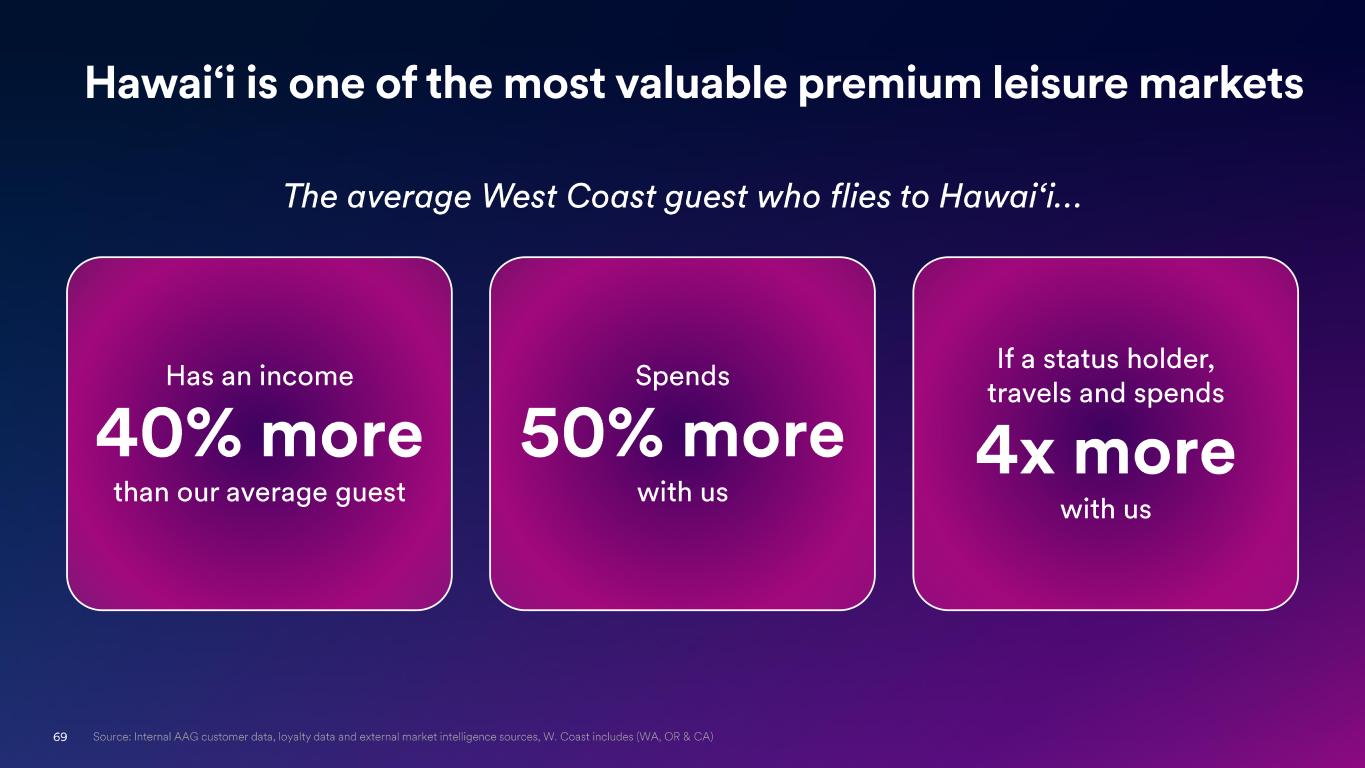
69 Source: Internal AAG customer data, loyalty data and external market intelligence sources, W. Coast includes (WA, OR & CA) Hawai‘i is one of the most valuable premium leisure markets The average West Coast guest who flies to Hawai‘i… Has an income 40% more than our average guest Spends 50% more with us If a status holder, travels and spends 4x more with us
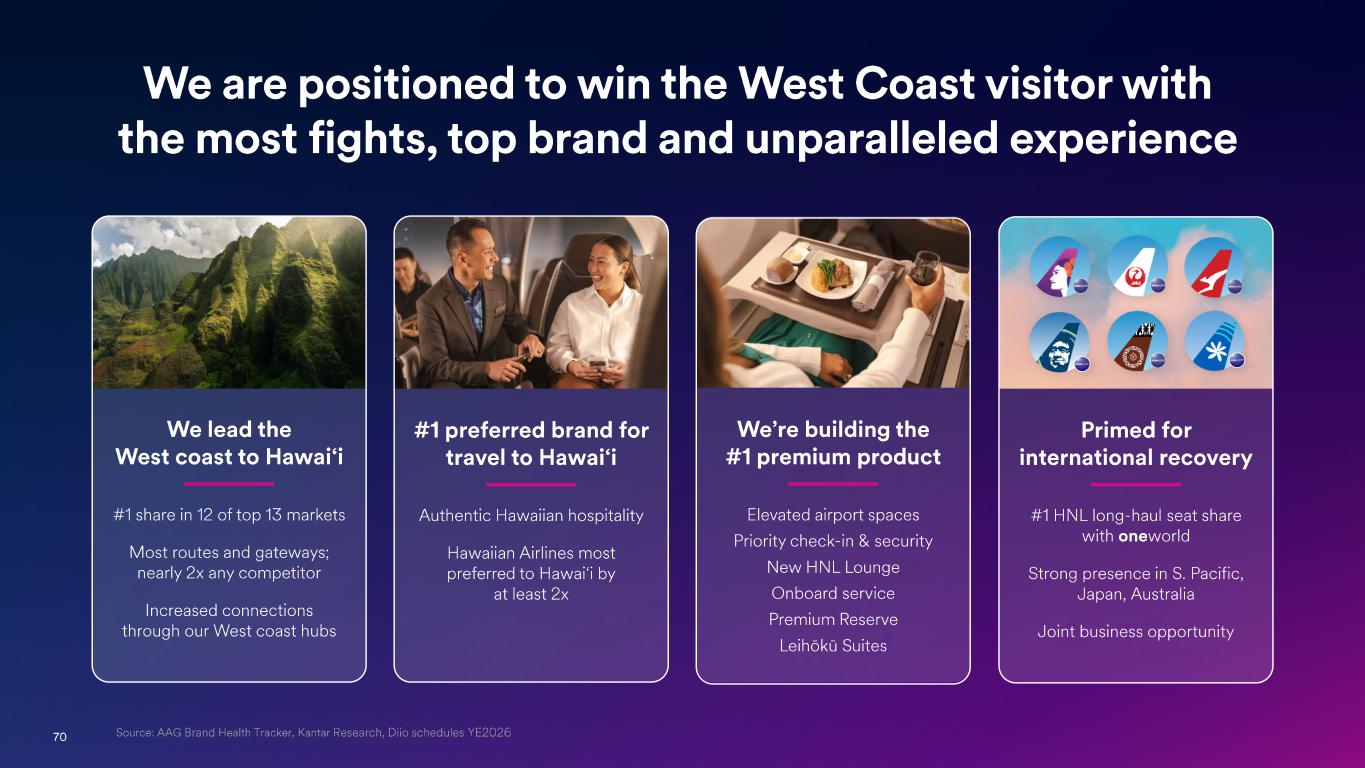
70 We are positioned to win the West Coast visitor with the most fights, top brand and unparalleled experience We lead the West coast to Hawai‘i #1 share in 12 of top 13 markets Most routes and gateways; nearly 2x any competitor Increased connections through our West coast hubs #1 preferred brand for travel to Hawai‘i Authentic Hawaiian hospitality Hawaiian Airlines most preferred to Hawai‘i by at least 2x We’re building the #1 premium product Elevated airport spaces Priority check - in & security New HNL Lounge Onboard service Premium Reserve Leihōkū Suites Source: AAG Brand Health Tracker, Kantar Research, Diio schedules YE2026 Primed for international recovery #1 HNL long -haul seat share with one world Strong presence in S. Pacific, Japan, Australia Joint business opportunity
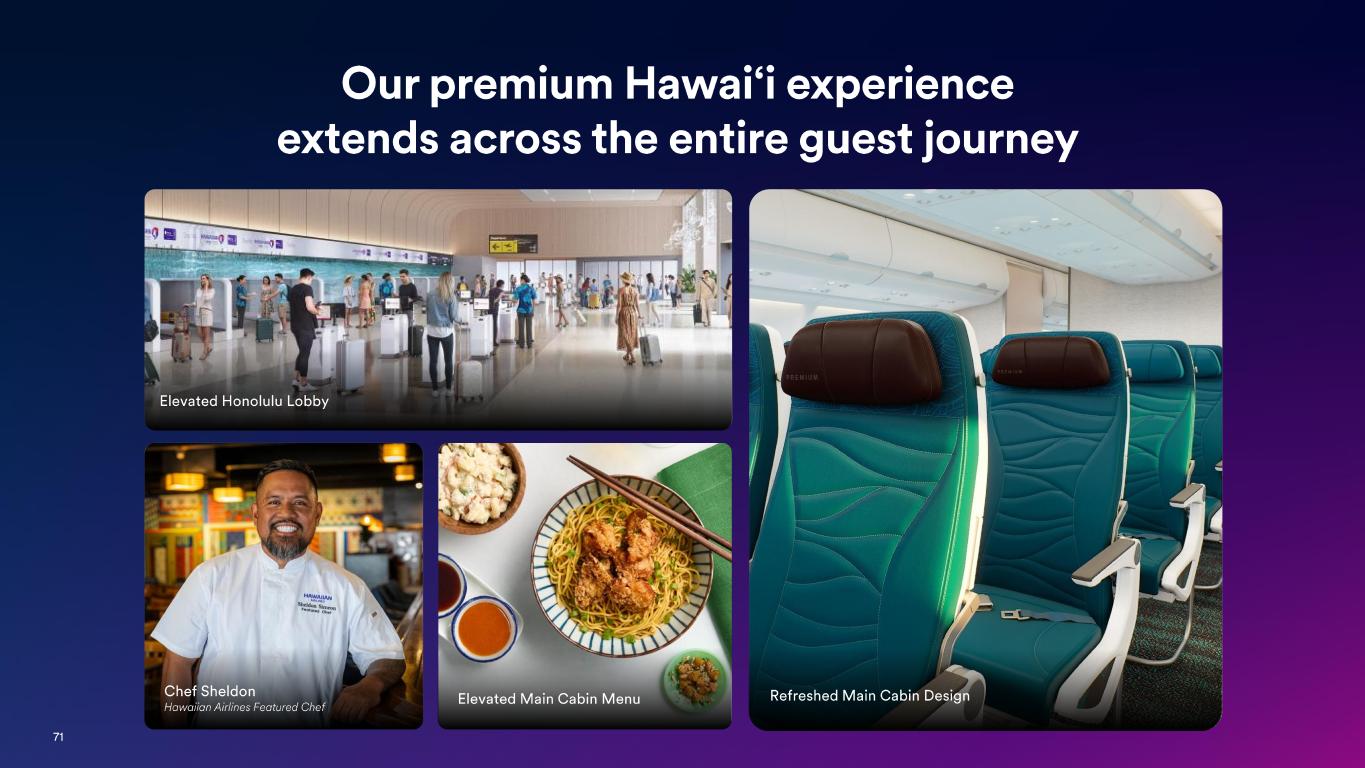
71 Elevated Honolulu Lobby Chef Sheldon Hawaiian Airlines Featured Chef Refreshed Main Cabin Design Our premium Hawai‘i experience extends across the entire guest journey Elevated Main Cabin Menu
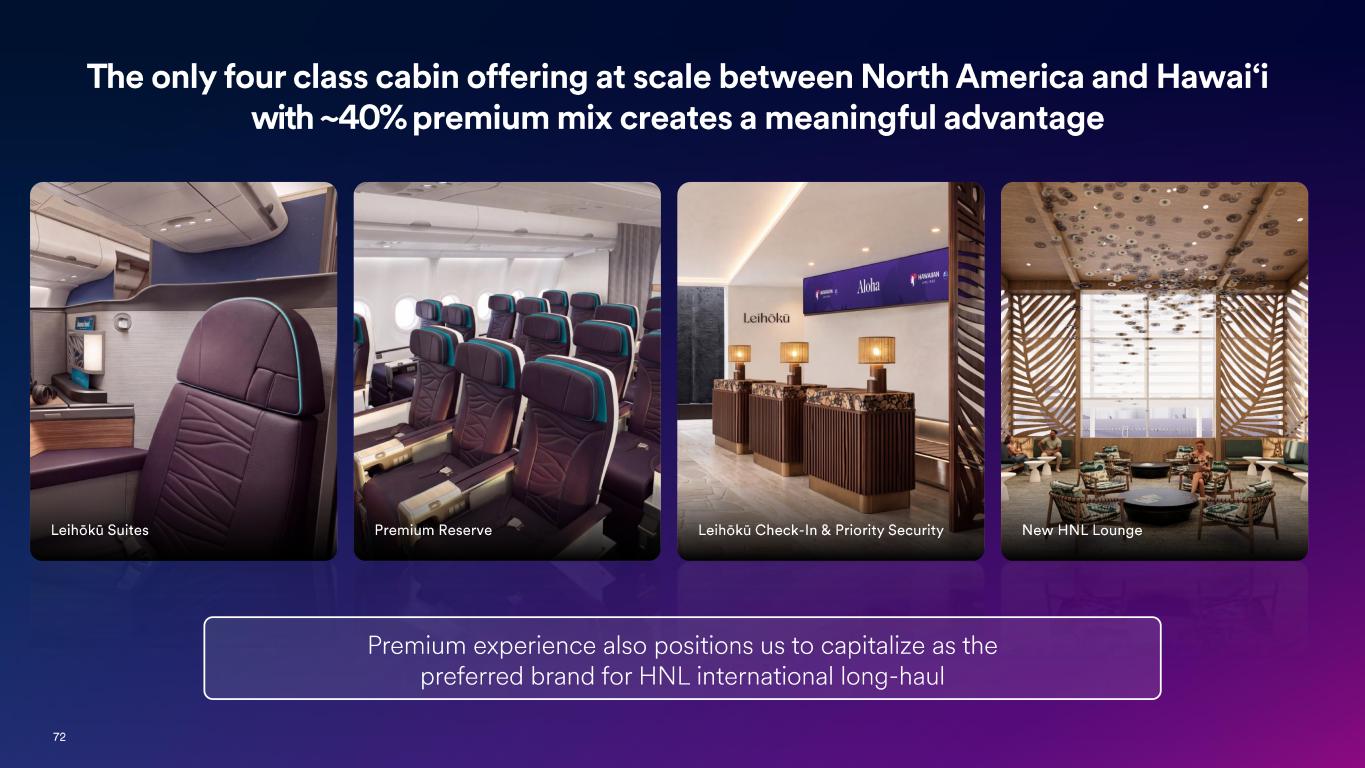
72 Leihōkū Check - In & Priority Security New HNL LoungePremium ReserveLeihōkū Suites The only four class cabin offering at scale between North America and Hawai‘i with ~40% premium mix creates a meaningful advantage Premium experience also positions us to capitalize as the preferred brand for HNL international long -haul
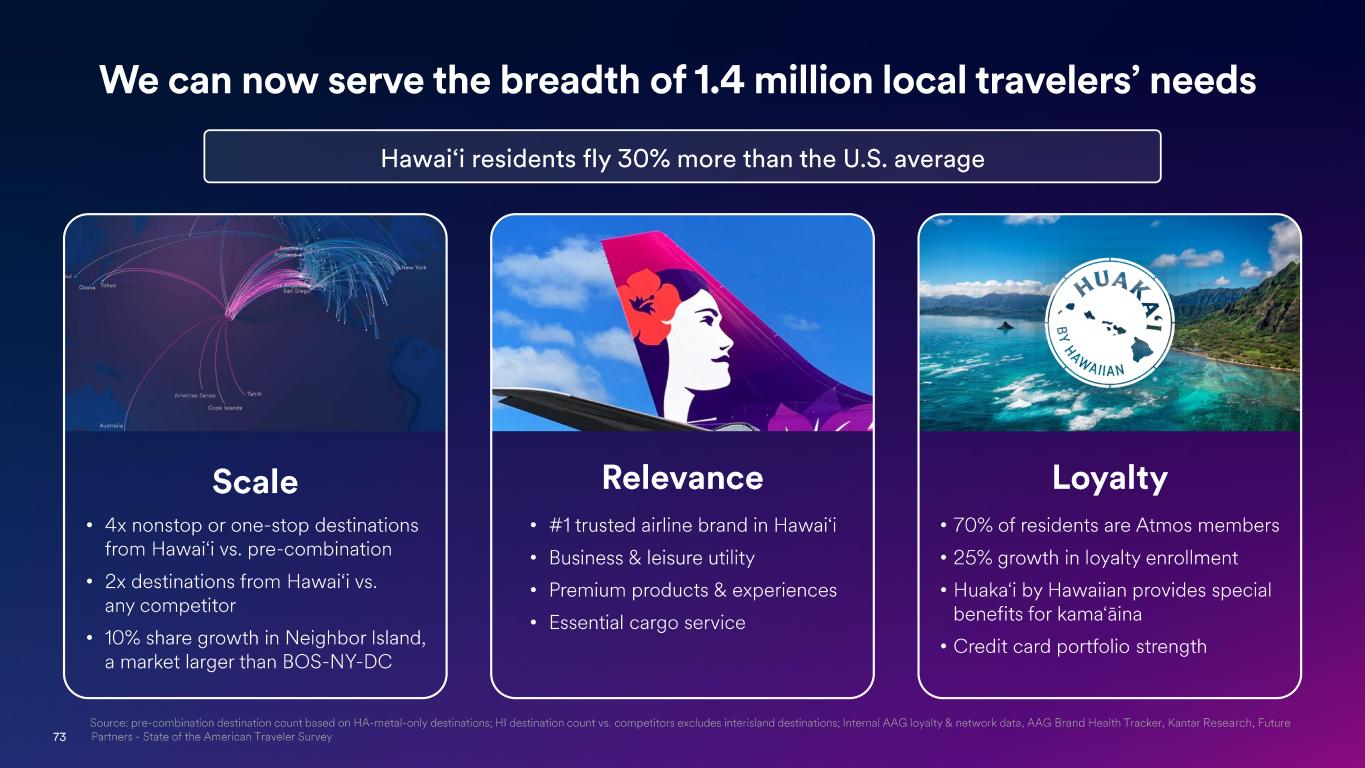
73 We can now serve the breadth of 1.4 million local travelers’ needs Source: pre -combination destination count based on HA -metal -only destinations; HI destination count vs. competitors excludes int erisland destinations; Internal AAG loyalty & network data, AAG Brand Health Tracker, Kantar Research, Future Partners - State of the American Traveler Survey Hawai‘i residents fly 30% more than the U.S. average • #1 trusted airline brand in Hawai‘i • Business & leisure utility • Premium products & experiences • Essential cargo service Relevance • 70% of residents are Atmos members • 25% growth in loyalty enrollment • Huaka‘i by Hawaiian provides special benefits for kama‘āina • Credit card portfolio strength Loyalty • 4x nonstop or one -stop destinations from Hawai‘i vs. pre -combination • 2x destinations from Hawai‘i vs. any competitor • 10% share growth in Neighbor Island, a market larger than BOS -NY -DC Scale
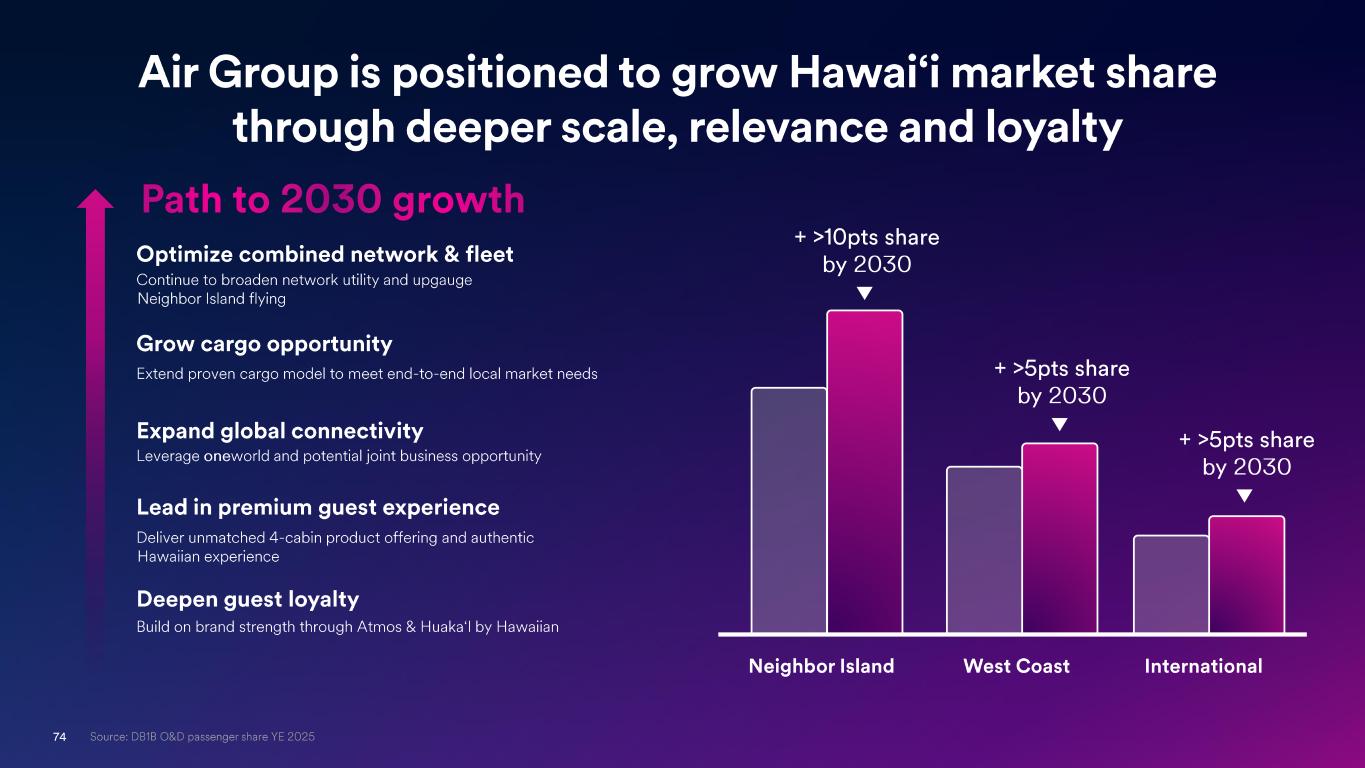
74 Path to 2030 growth Neighbor Island West Coast International Air Group is positioned to grow Hawai‘i market share through deeper scale, relevance and loyalty Source: DB1B O&D passenger share YE 2025 Optimize combined network & fleet Extend proven cargo model to meet end -to-end local market needs Expand global connectivity Lead in premium guest experience Deliver unmatched 4 -cabin product offering and authentic Hawaiian experience Deepen guest loyalty Build on brand strength through Atmos & Huaka‘I by Hawaiian Leverage one world and potential joint business opportunity Grow cargo opportunity Continue to broaden network utility and upgauge Neighbor Island flying + >10pts share by 2030 + >5pts share by 2030 + >5pts share by 2030

75 Brett Catlin SVP, Network, Partnerships and Loyalty Generating ~$4 Billion in Cash Remuneration by 2030
76 Loyalty
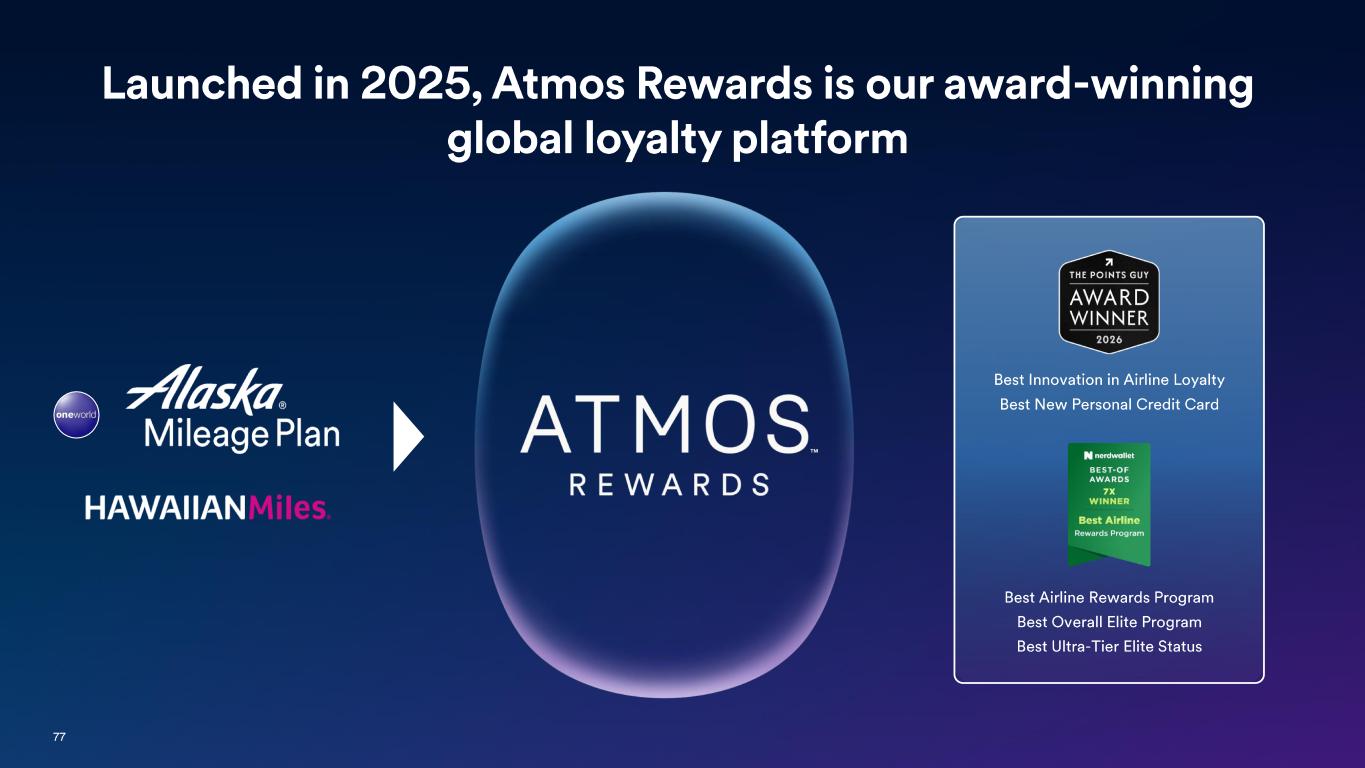
77 Launched in 2025, Atmos Rewards is our award -winning global loyalty platform Best Airline Rewards Program Best Overall Elite Program Best Ultra -Tier Elite Status Best Innovation in Airline Loyalty Best New Personal Credit Card
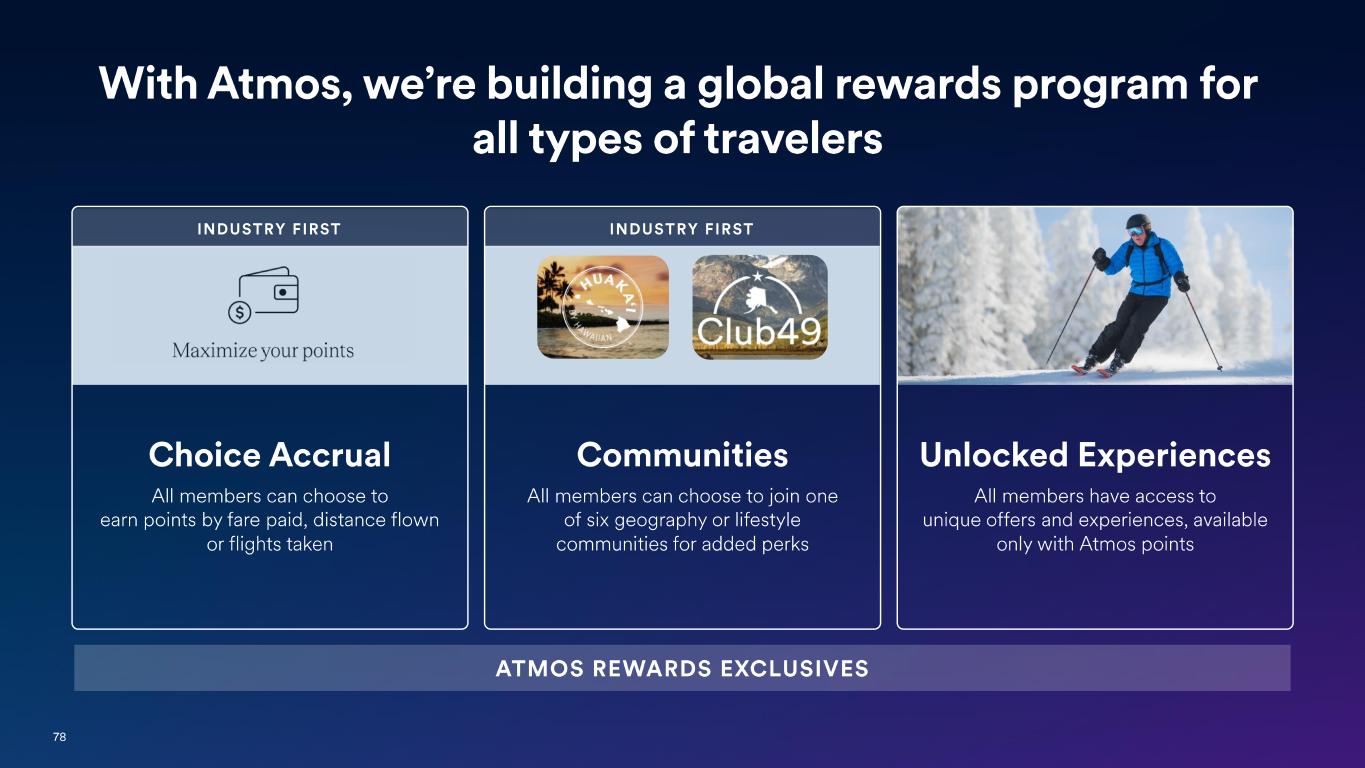
78 Choice Accrual All members can choose to earn points by fare paid, distance flown or flights taken Communities All members can choose to join one of six geography or lifestyle communities for added perks INDUSTRY FIRST Unlocked Experiences All members have access to unique offers and experiences, available only with Atmos points INDUSTRY FIRST With Atmos, we’re building a global rewards program for all types of travelers ATMOS REWARDS EXCLUSIVES
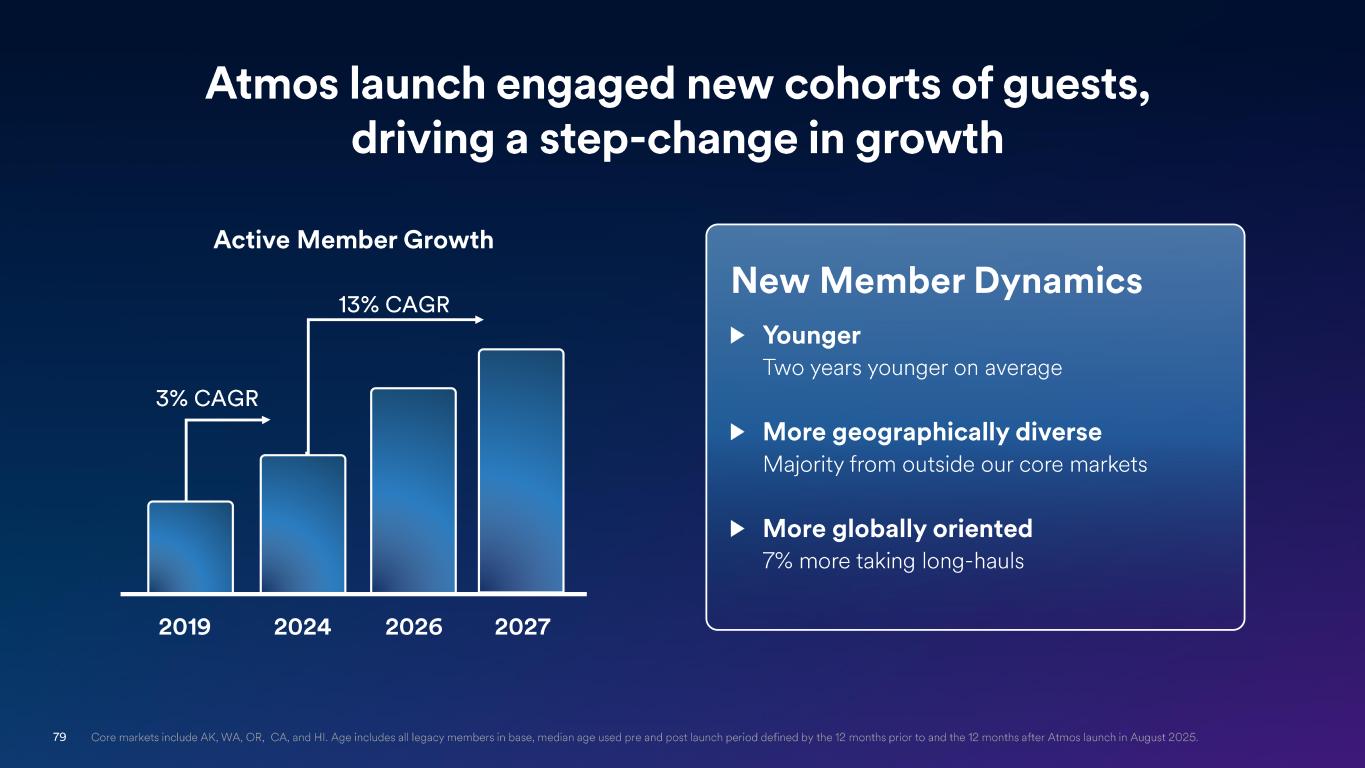
79 2019 2024 2026 2027 3% CAGR 13% CAGR Active Member Growth Core markets include AK, WA, OR, CA, and HI. Age includes all legacy members in base, median age used pre and post launch pe riod defined by the 12 months prior to and the 12 months after Atmos launch in August 2025. Atmos launch engaged new cohorts of guests, driving a step -change in growth Active Member Growth 2019 2024 2026 2027 3% CAGR 13% CAGR New Member Dynamics Younger Two years younger on average More geographically diverse Majority from outside our core markets More globally oriented 7% more taking long -hauls
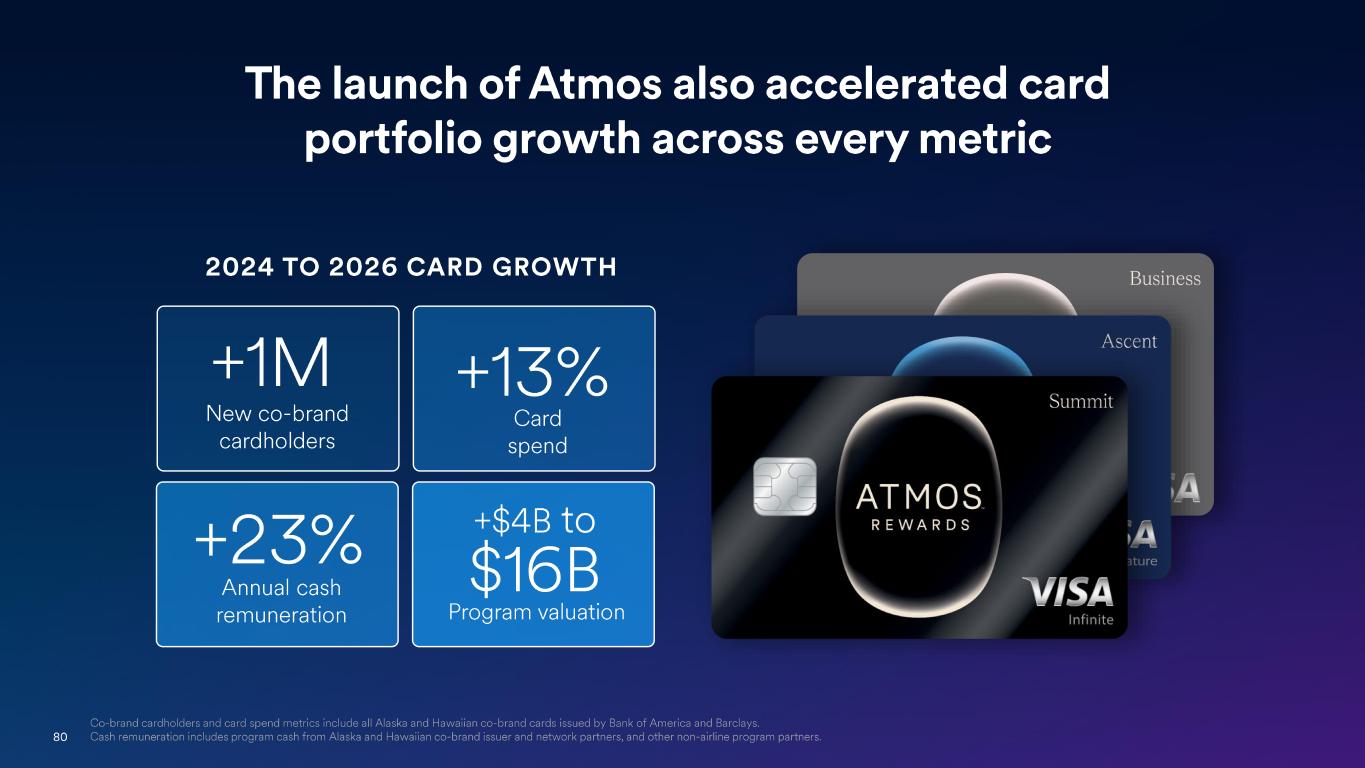
80 The launch of Atmos also accelerated card portfolio growth across every metric 2024 TO 2026 CARD GROWTH New co -brand cardholders +1M Annual cash remuneration +23% Card spend +13% Program valuation +$4B to $16B Co -brand cardholders and card spend metrics include all Alaska and Hawaiian co -brand cards issued by Bank of America and Barclay s. Cash remuneration includes program cash from Alaska and Hawaiian co -brand issuer and network partners, and other non -airline pro gram partners.
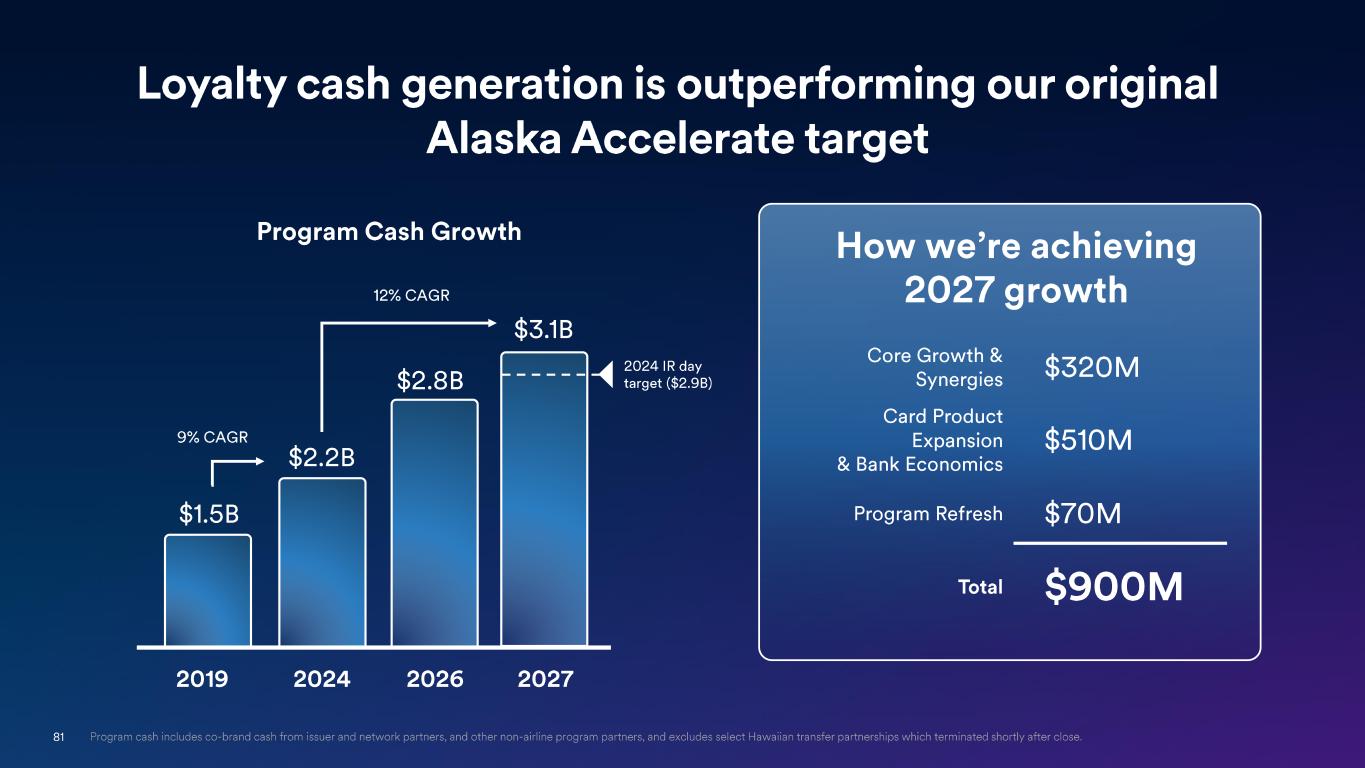
81 2019 2024 2026 2027 9% CAGR 12% CAGR Program cash includes co -brand cash from issuer and network partners, and other non -airline program partners, and excludes selec t Hawaiian transfer partnerships which terminated shortly after close. 2024 IR day target ($2.9B) How we’re achieving 2027 growth Program Cash Growth $1.5B $2.2B $3.1B $2.8B Loyalty cash generation is outperforming our original Alaska Accelerate target Core Growth & Synergies $320M Card Product Expansion & Bank Economics $510M Program Refresh $70M Total $900M
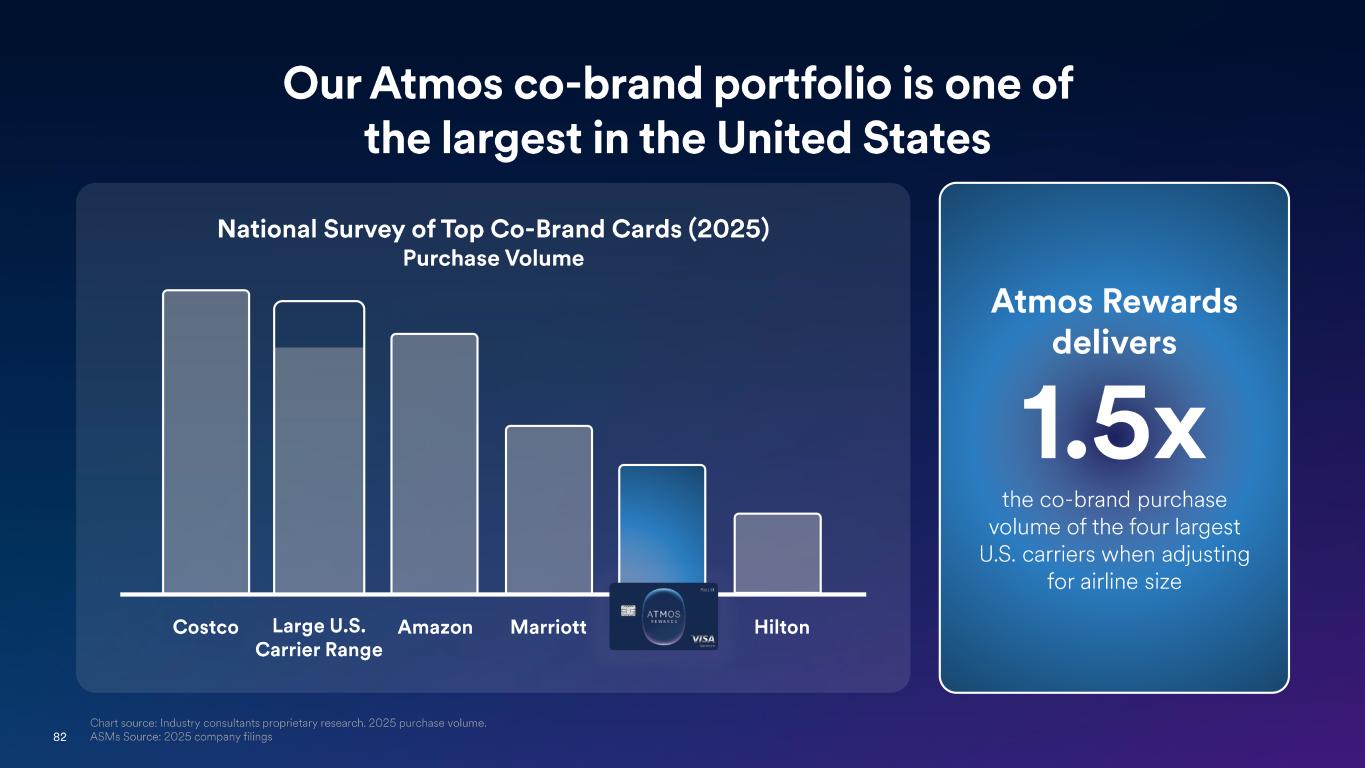
82 Chart source: Industry consultants proprietary research. 2025 purchase volume. ASMs Source: 2025 company filings Costco Large US Carrier Range Amazon Marriot Hilton Our Atmos co -brand portfolio is one of the largest in the United States National Survey of Top Co -Brand Cards (2025) Purchase Volume Large U.S. Carrier Range Amazon MarriottCostco Hilton Atmos Rewards delivers 1.5x the co -brand purchase volume of the four largest U.S. carriers when adjusting for airline size
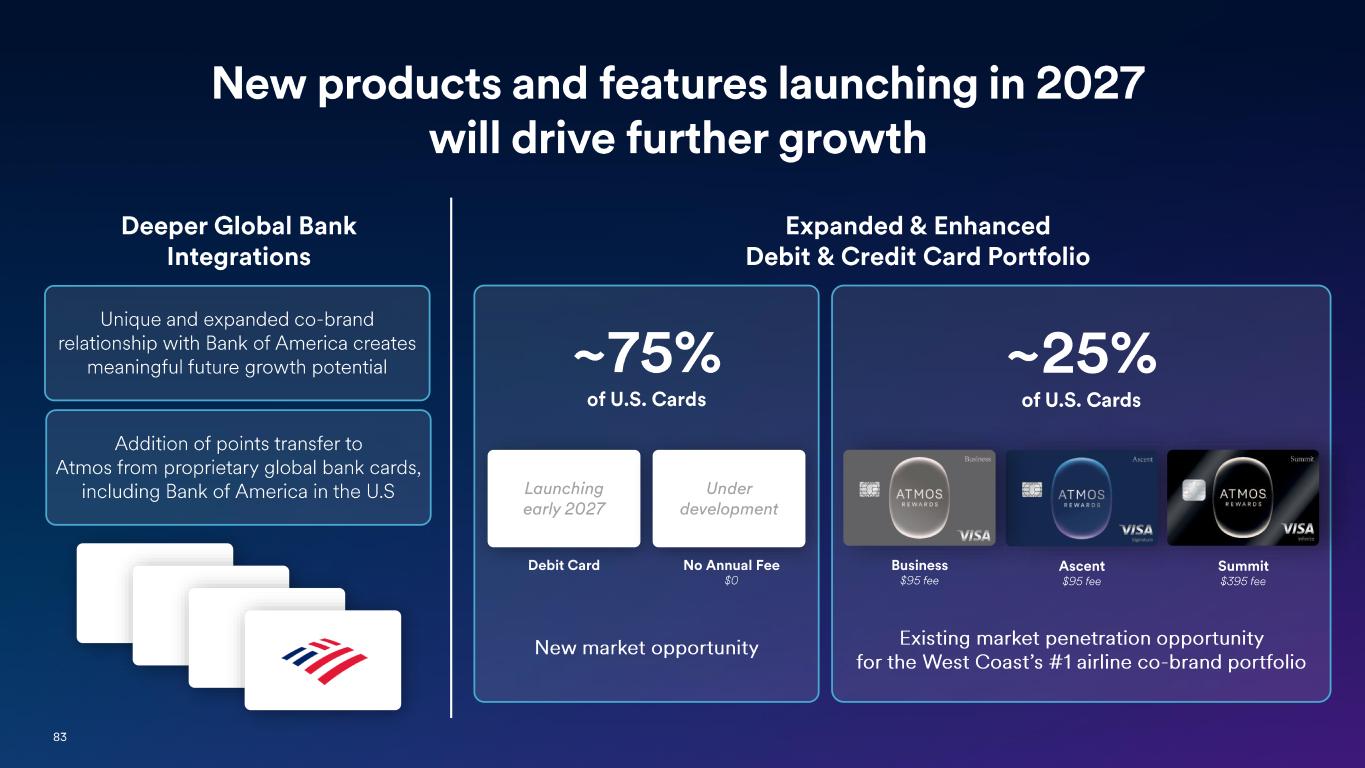
83 New products and features launching in 2027 will drive further growth Unique and expanded co -brand relationship with Bank of America creates meaningful future growth potential Addition of points transfer to Atmos from proprietary global bank cards, including Bank of America in the U.S Deeper Global Bank Integrations Expanded & Enhanced Debit & Credit Card Portfolio ~75% of U.S. Cards New market opportunity Debit Card Launching early 2027 Under development No Annual Fee $0 ~25% of U.S. Cards Existing m arket penetration opportunity for the West Coast’s #1 airline co - brand portfolio Ascent $95 fee Business $95 fee Summit $395 fee
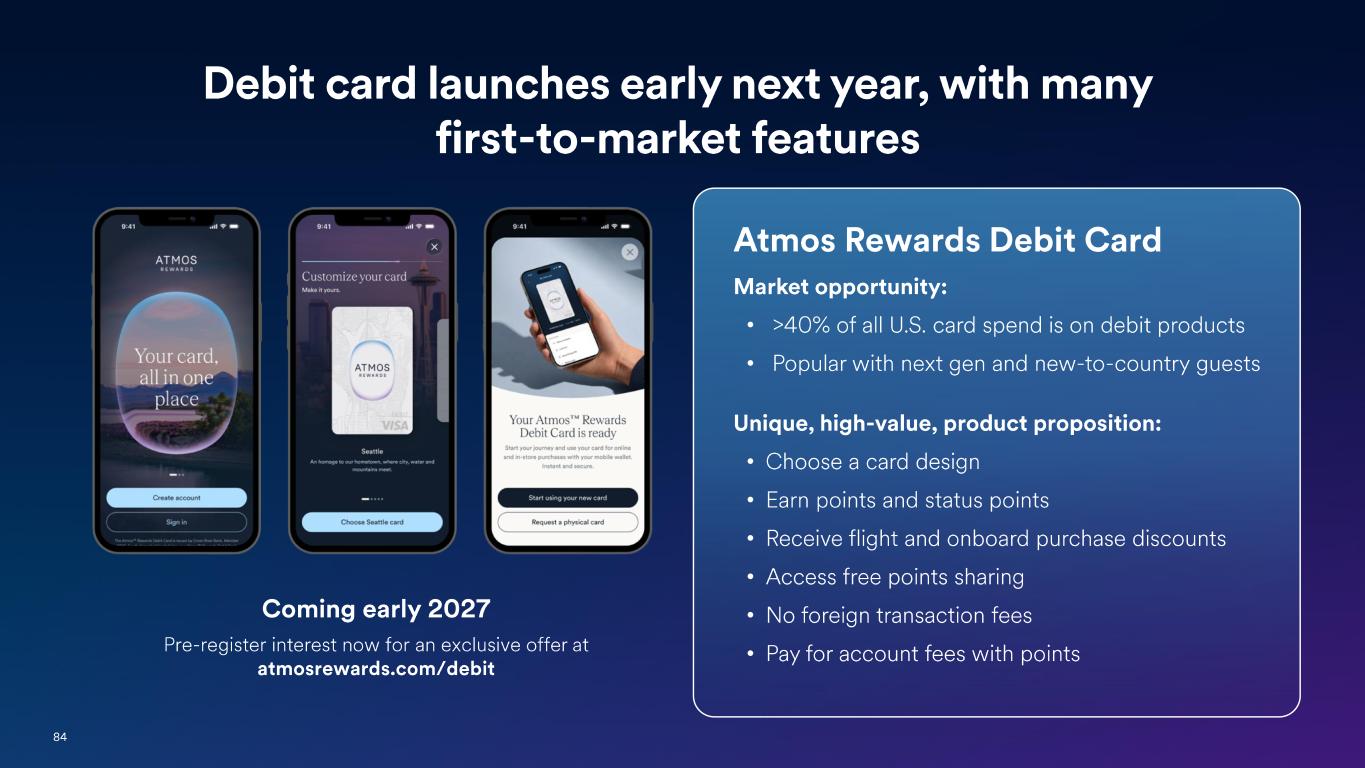
84 Coming early 2027 Pre-register interest now for an exclusive offer at atmosrewards.com /debit Atmos Rewards Debit Card Market opportunity: • >40% of all U.S. card spend is on debit products • Popular with next gen and new -to-country guests Unique, high -value, product proposition: • Choose a card design • Earn points and status points • Receive flight and onboard purchase discounts • Access free points sharing • No foreign transaction fees • Pay for account fees with points Debit card launches early next year, with many first -to-market features
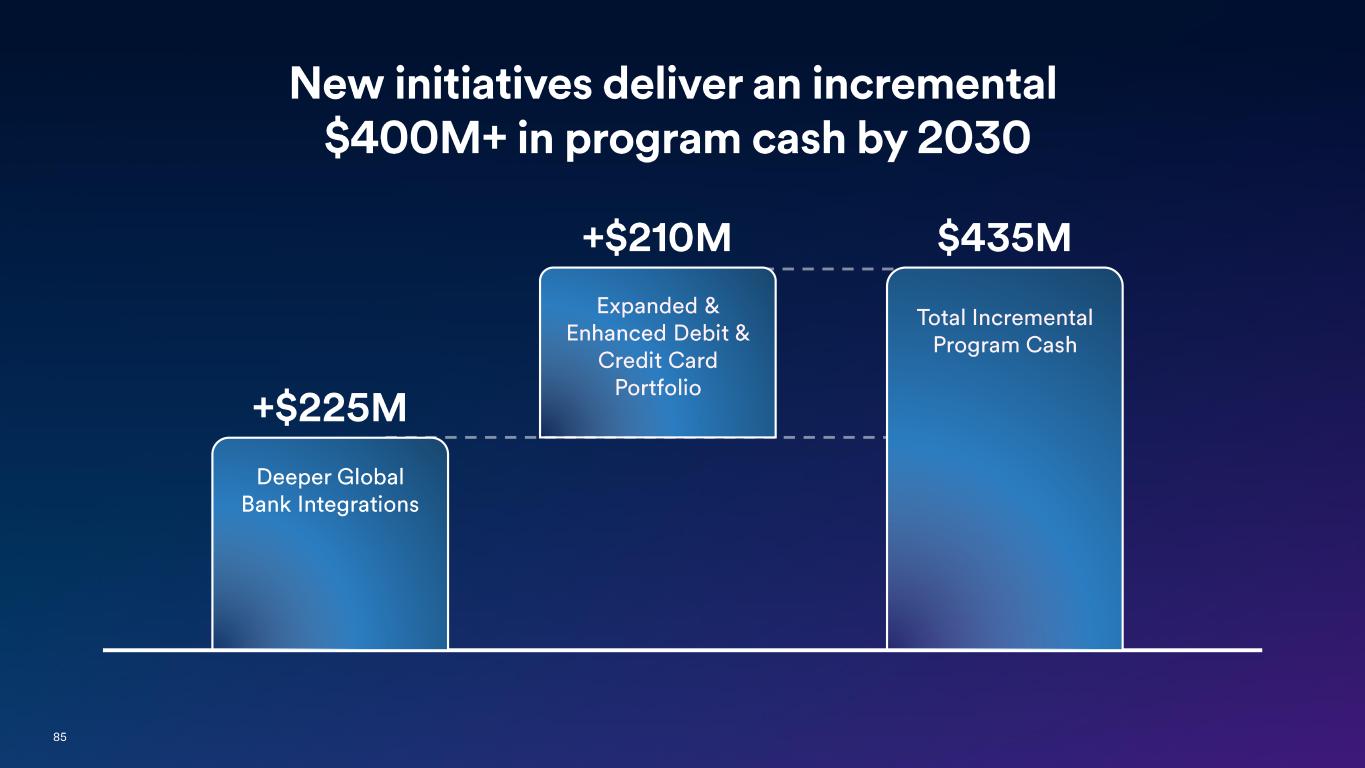
85 New initiatives deliver an incremental $400M+ in program cash by 2030 +$225M Deeper Global Bank Integrations +$210M Expanded & Enhanced Debit & Credit Card Portfolio Total Incremental Program Cash $435M
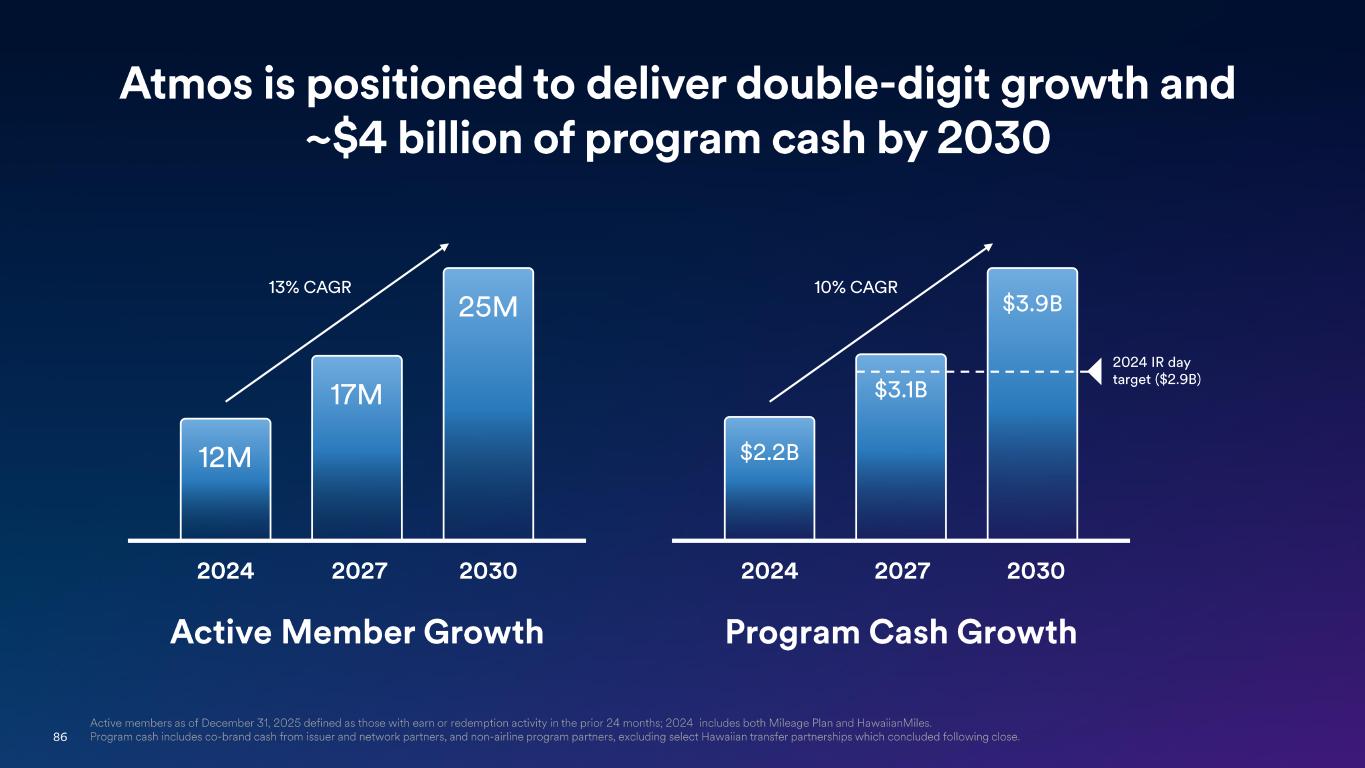
86 Active members as of December 31, 2025 defined as those with earn or redemption activity in the prior 24 months; 2024 includ es both Mileage Plan and HawaiianMiles. Program cash includes co -brand cash from issuer and network partners, and non -airline program partners, excluding select Hawaiia n transfer partnerships which concluded following close. Active Member Growth 12M 2024 17M 2027 25M 2030 13% CAGR Program Cash Growth $2.2B 2024 $3.1B 2027 $3.9B 2030 10% CAGR 2024 IR day target ($2.9B) Atmos is positioned to deliver double -digit growth and ~$4 billion of program cash by 2030
87 Ian Morgan VP Cargo Growing Cargo to a $750M Business
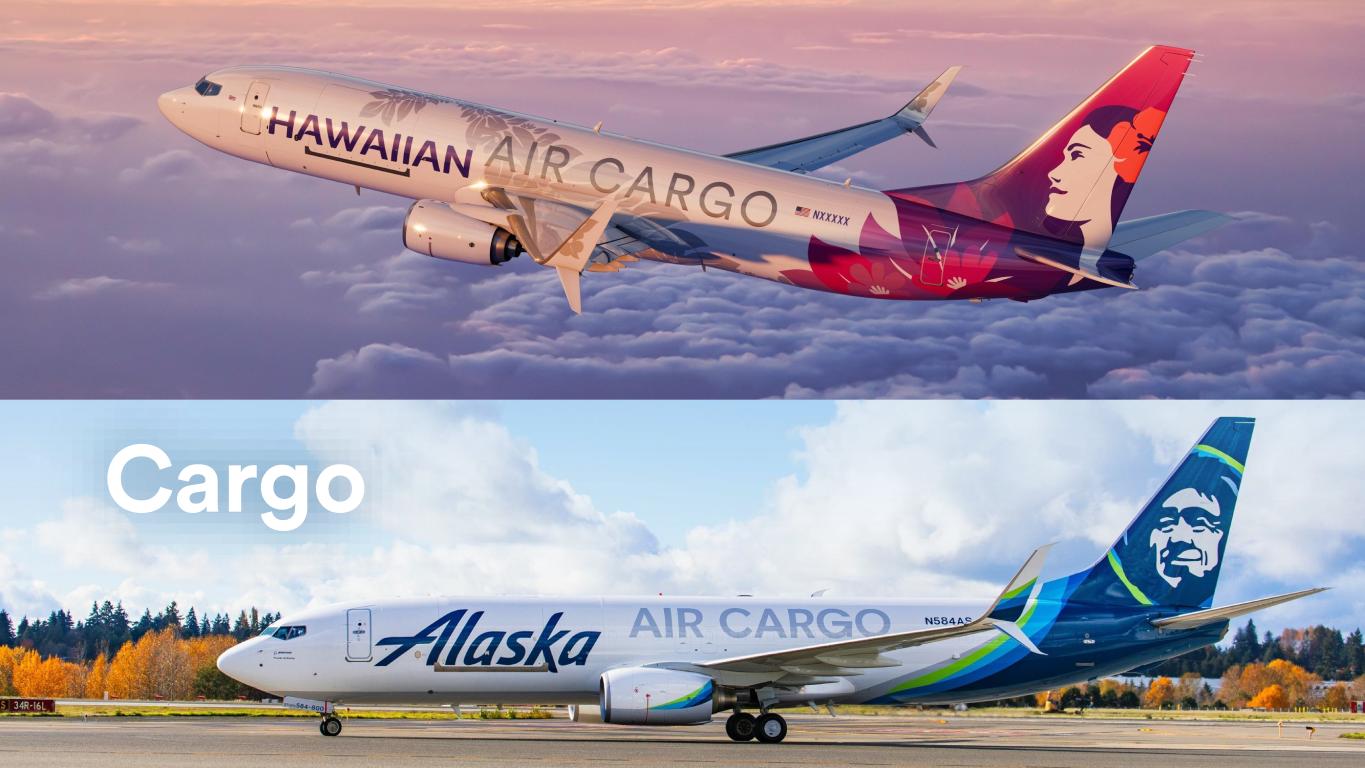
Cargo
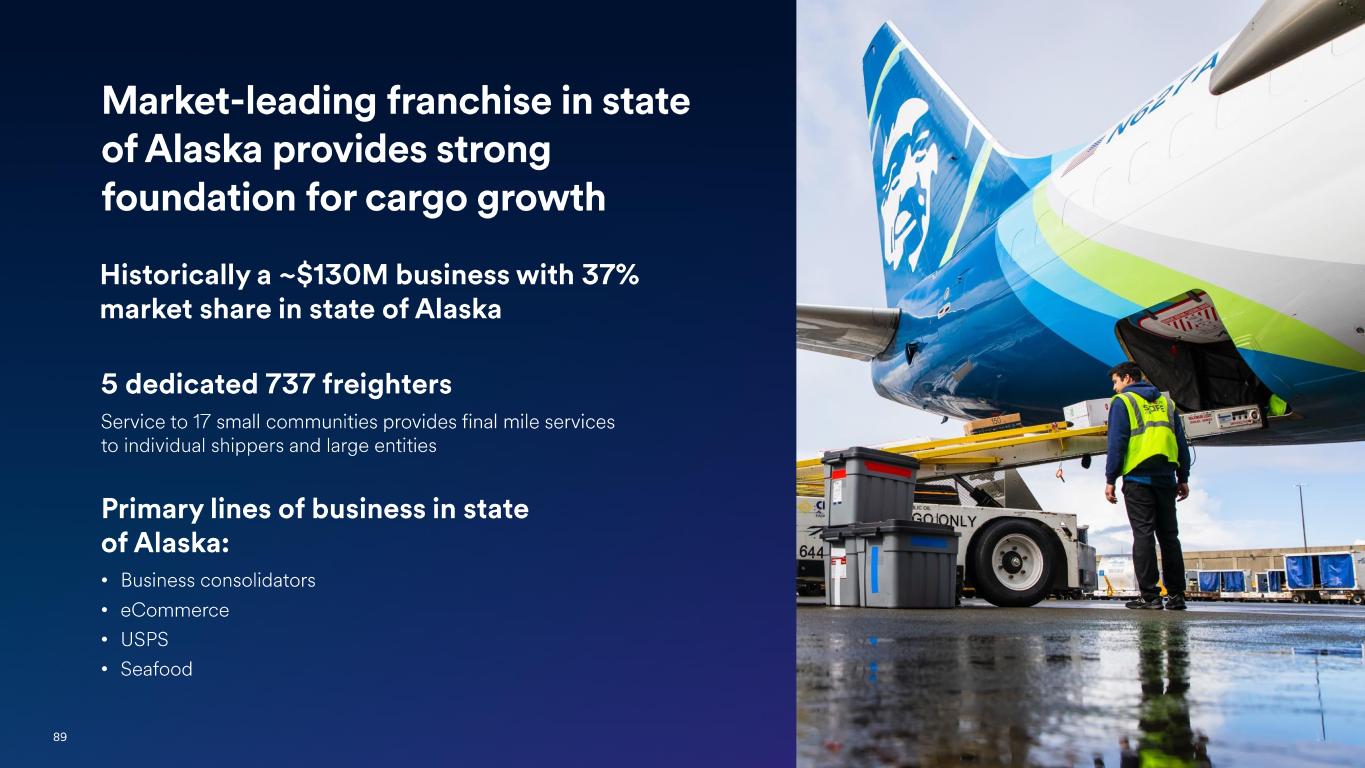
89 Market -leading franchise in state of Alaska provides strong foundation for cargo growth Historically a ~$130M business with 37% market share in state of Alaska 5 dedicated 737 freighters Service to 17 small communities provides final mile services to individual shippers and large entities Primary lines of business in state of Alaska: • Business consolidators • eCommerce • USPS • Seafood
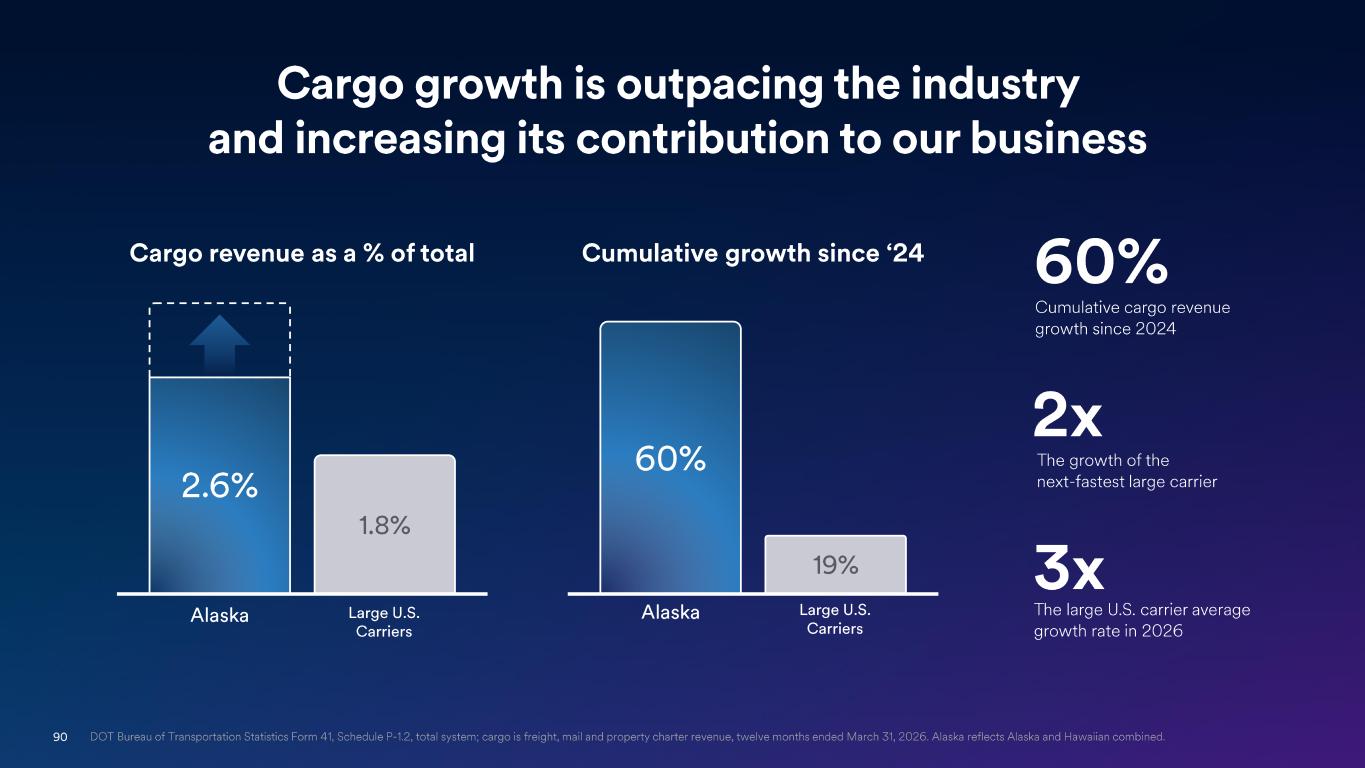
90 DOT Bureau of Transportation Statistics Form 41, Schedule P -1.2, total system; cargo is freight, mail and property charter reven ue, twelve months ended March 31, 2026. Alaska reflects Alaska and Hawaiian combined. Cargo growth is outpacing the industry and increasing its contribution to our business Cumulative cargo revenue growth since 2024 60% The growth of the next-fastest large carrier 2x The large U.S. carrier average growth rate in 2026 3x Cargo revenue as a % of total 1.8% Large U.S. Carriers 2.6% Alaska 19% Large U.S. Carriers 60% Alaska Cumulative growth since ‘24
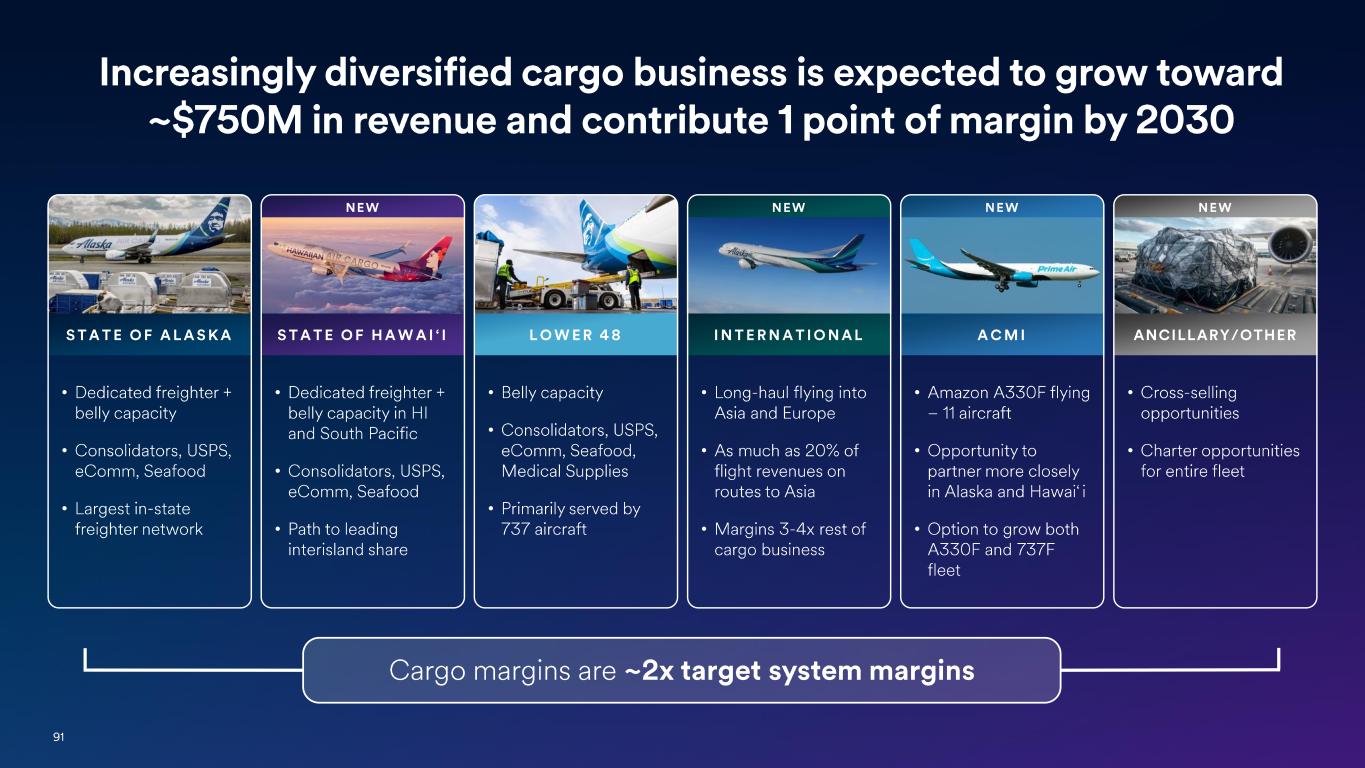
91 Increasingly diversified cargo business is expected to grow toward ~$750M in revenue and contribute 1 point of margin by 2030 Cargo margins are ~ 2x target system margins ANCILLARY/OTHER NEW • Cross -selling opportunities • Charter opportunities for entire fleet ACMI NEW • Amazon A330F flying – 11 aircraft • Opportunity to partner more closely in Alaska and Hawai ‘ i • Option to grow both A330F and 737F fleet INTERNATIONAL NEW • Long -haul flying into Asia and Europe • As much as 20% of flight revenues on routes to Asia • Margins 3 -4x rest of cargo business LOWER 48 • Belly capacity • Consolidators, USPS, eComm , Seafood, Medical Supplies • Primarily served by 737 aircraft STATE OF HAWAI‘I NEW • Dedicated freighter + belly capacity in HI and South Pacific • Consolidators, USPS, eComm , Seafood • Path to leading interisland share STATE OF ALASKA • Dedicated freighter + belly capacity • Consolidators, USPS, eComm , Seafood • Largest in -state freighter network
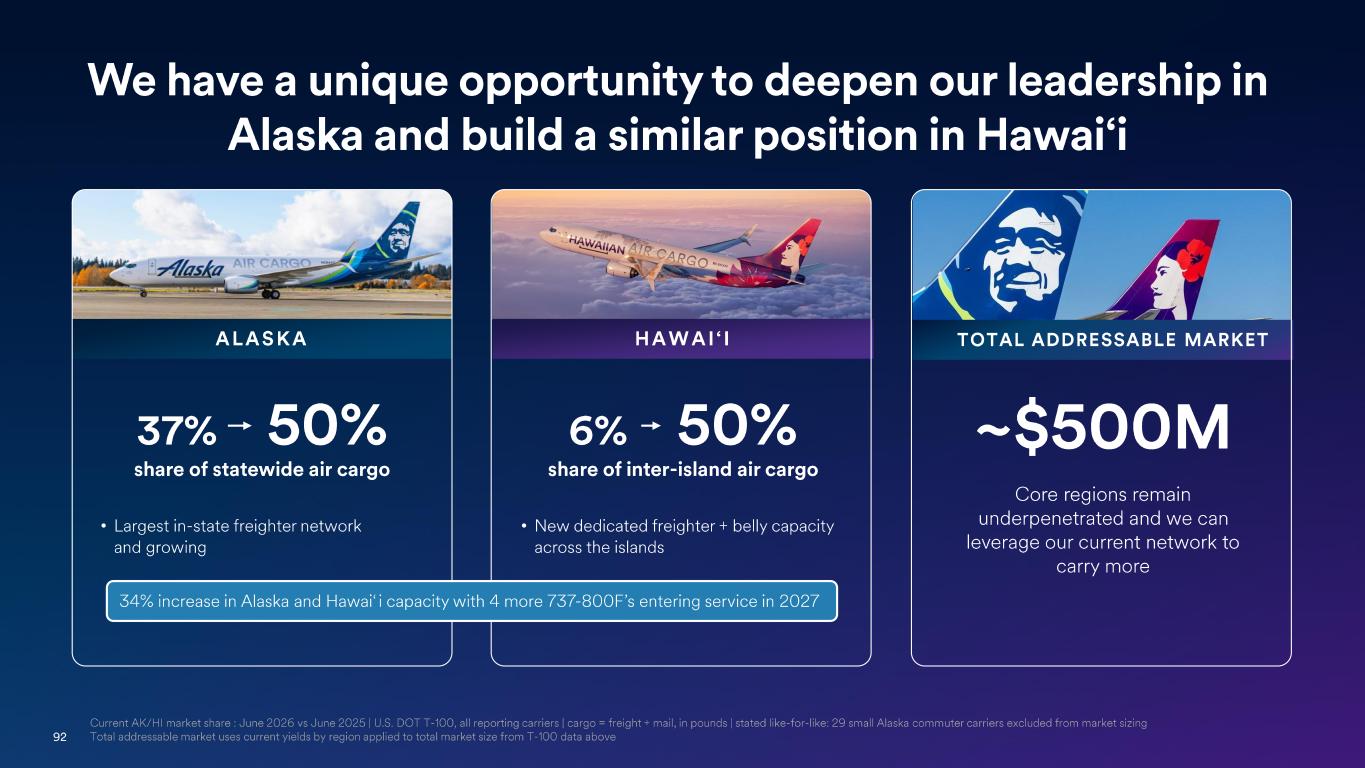
92 We have a unique opportunity to deepen our leadership in Alaska and build a similar position in Hawai‘i share of statewide air cargo 37% 50% • Largest in -state freighter network and growing ALASKA share of inter - island air cargo • New dedicated freighter + belly capacity across the islands 6% 50% HAWAI‘I ~$500M Core regions remain underpenetrated and we can leverage our current network to carry more TOTAL ADDRESSABLE MARKET Current AK/HI market share : June 2026 vs June 2025 | U.S. DOT T -100, all reporting carriers | cargo = freight + mail, in pounds | stated like-for- like: 29 small Alaska commuter carriers excluded from market sizing Total addressable market uses current yields by region applied to total market size from T -100 data above 34% increase in Alaska and Hawai ‘ i capacity with 4 more 737 -800F’s entering service in 2027
93 Shane Tackett President & Chief Financial Officer Closing
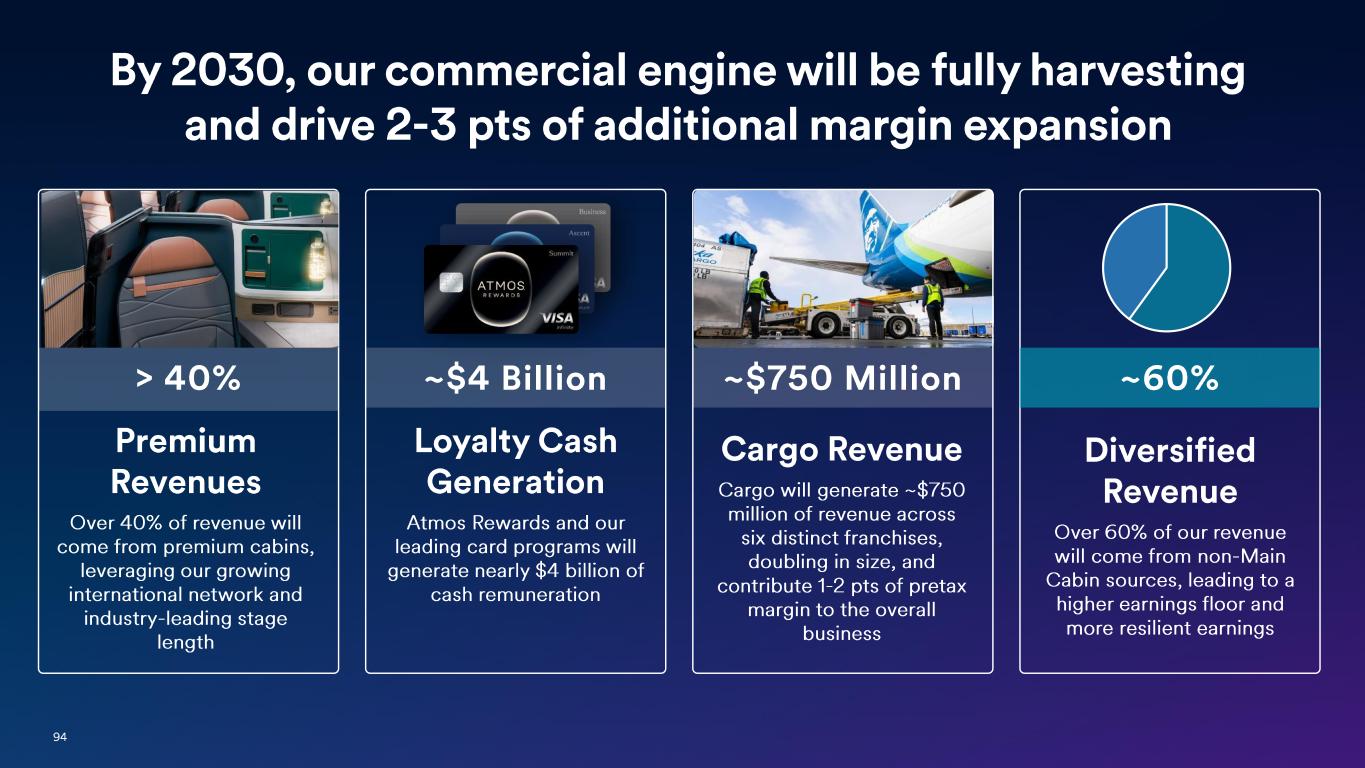
94 > 40% Premium Revenues Over 40% of revenue will come from premium cabins, leveraging our growing international network and industry - leading stage length ~$4 Billion Loyalty Cash Generation Atmos Rewards and our leading card programs will generate nearly $4 billion of cash remuneration Cargo Revenue Cargo will generate ~$750 million of revenue across six distinct franchises, doubling in size, and contribute 1 -2 pts of pretax margin to the overall business ~$750 Million By 2030, our commercial engine will be fully harvesting and drive 2 -3 pts of additional margin expansion ~60% Diversified Revenue Over 60% of our revenue will come from non -Main Cabin sources, leading to a higher earnings floor and more resilient earnings
2026 Investor Day | September 29, 2026