
14 40 65 29 68 107 111 154 187 88 89 91 200 183 138 116 67 45 232 232 232 128 130 132 Discussion Materials Confidential Exhibit 99.2
Confidential14 40 65 29 68 107 111 154 187 88 89 91 200 183 138 116 67 45 232 232 232 128 130 132 Table of Contents Executive SummaryI Business OverviewII Situation Backdrop III Key Credit HighlightsIV AppendixV 1
14 40 65 29 68 107 111 154 187 88 89 91 200 183 138 116 67 45 232 232 232 128 130 132 I. Executive Summary
Confidential14 40 65 29 68 107 111 154 187 88 89 91 200 183 138 116 67 45 232 232 232 128 130 132 JELD-WEN is a market leading windows and doors manufacturer that has undergone significant operational transformation and is positioned to benefit from a cyclical housing recovery and execution-driven margin improvement ◼ Since 2023, management has executed a comprehensive transformation focused on portfolio simplification, footprint rationalization, and cost efficiency, delivering ~$300M of cost out ◼ Well-positioned for housing recovery to drive operating leverage and improve profitability ◼ Clear path to EBITDA growth and margin expansion as housing activity stabilizes and initiatives are realized ◼ Improving free cash flow generation, supported by disciplined capex and working capital management, enabling balance sheet improvement and deleveraging Executive Summary The Company is evaluating alternatives to address upcoming maturities and extend its debt maturity profile to provide necessary runway to realize transformation benefits and cyclical recovery 2

14 40 65 29 68 107 111 154 187 88 89 91 200 183 138 116 67 45 232 232 232 128 130 132 II. Business Overview
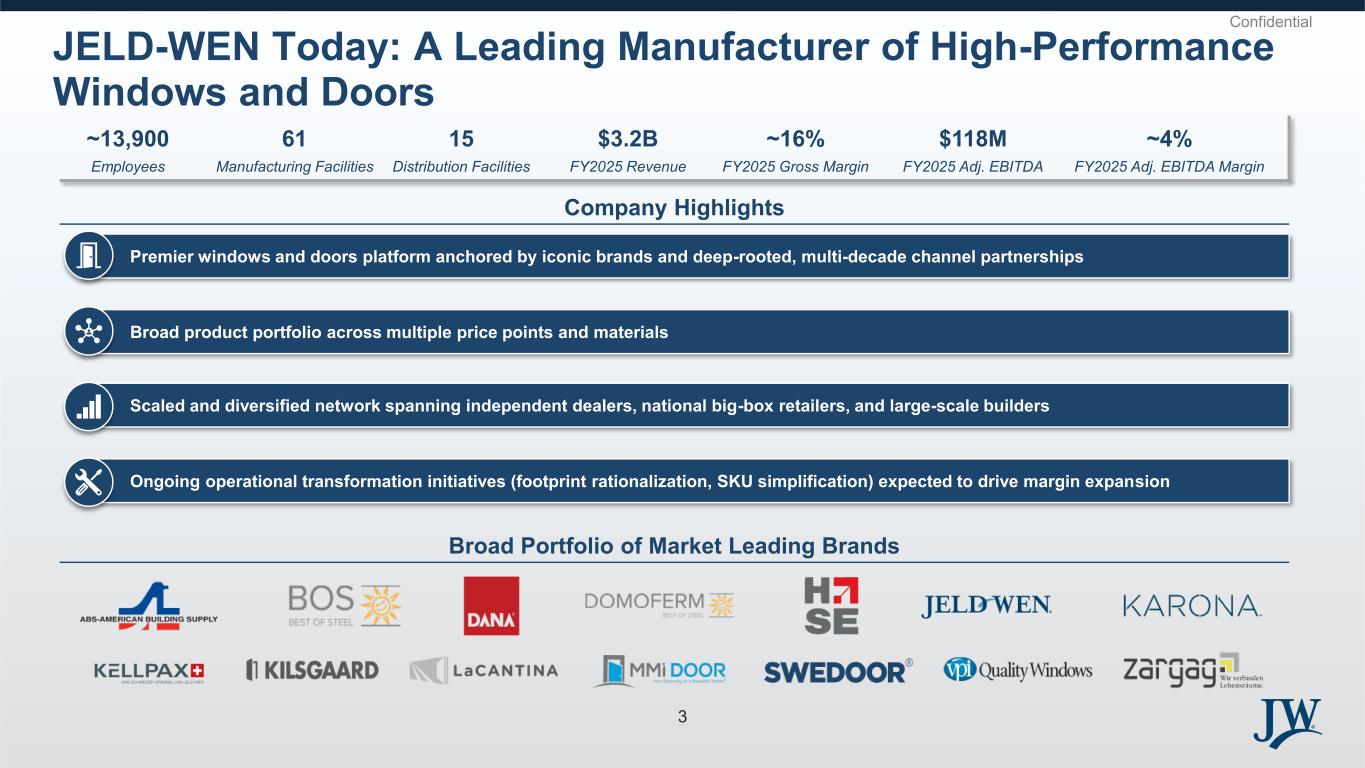
Confidential14 40 65 29 68 107 111 154 187 88 89 91 200 183 138 116 67 45 232 232 232 128 130 132 JELD-WEN Today: A Leading Manufacturer of High-Performance Windows and Doors Broad Portfolio of Market Leading Brands Company Highlights Ongoing operational transformation initiatives (footprint rationalization, SKU simplification) expected to drive margin expansion Scaled and diversified network spanning independent dealers, national big-box retailers, and large-scale builders Premier windows and doors platform anchored by iconic brands and deep-rooted, multi-decade channel partnerships Broad product portfolio across multiple price points and materials ~13,900 Employees 61 Manufacturing Facilities $3.2B FY2025 Revenue 15 Distribution Facilities ~16% FY2025 Gross Margin $118M FY2025 Adj. EBITDA ~4% FY2025 Adj. EBITDA Margin 3
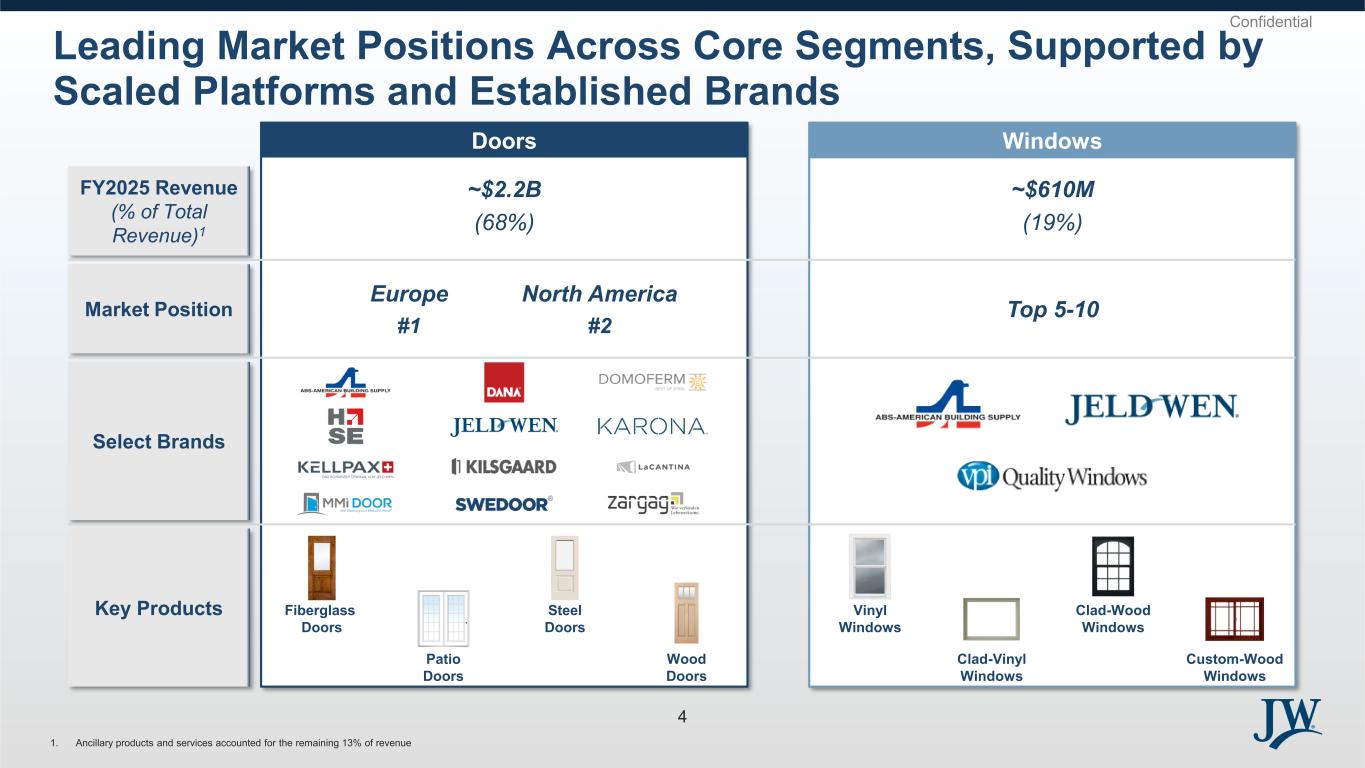
Confidential14 40 65 29 68 107 111 154 187 88 89 91 200 183 138 116 67 45 232 232 232 128 130 132 FY2025 Revenue (% of Total Revenue)1 Market Position Select Brands Key Products Doors Windows ~$2.2B (68%) Fiberglass Doors Steel Doors Wood Doors Patio Doors ~$610M (19%) Top 5-10 Vinyl Windows Clad-Wood Windows Custom-Wood Windows Clad-Vinyl Windows Leading Market Positions Across Core Segments, Supported by Scaled Platforms and Established Brands 1. Ancillary products and services accounted for the remaining 13% of revenue Europe #1 North America #2 4
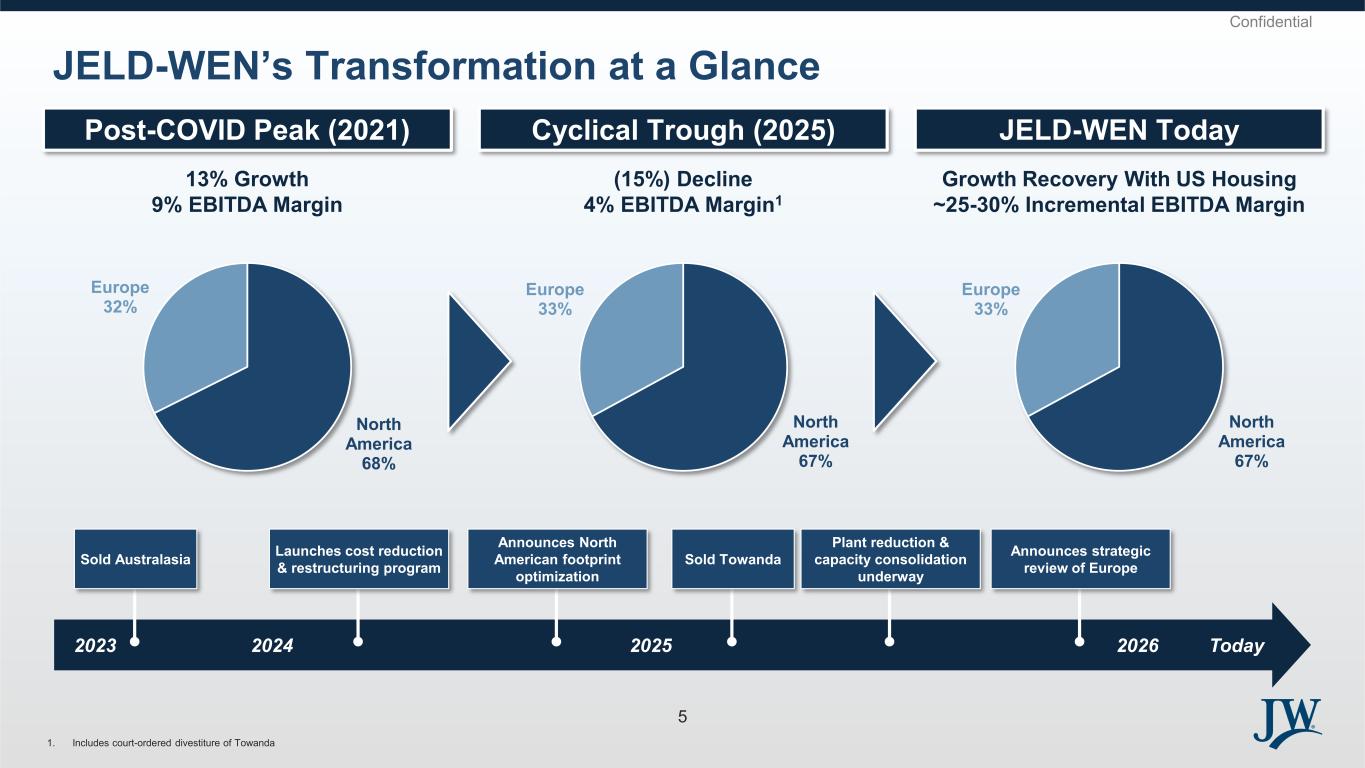
Confidential14 40 65 29 68 107 111 154 187 88 89 91 200 183 138 116 67 45 232 232 232 128 130 132 JELD-WEN’s Transformation at a Glance Post-COVID Peak (2021) Cyclical Trough (2025) JELD-WEN Today 2024 2025 2026 1. Includes court-ordered divestiture of Towanda Announces strategic review of Europe 13% Growth 9% EBITDA Margin (15%) Decline 4% EBITDA Margin1 Growth Recovery With US Housing ~25-30% Incremental EBITDA Margin North America 68% Europe 32% North America 67% Europe 33% North America 67% Europe 33% Announces North American footprint optimization Launches cost reduction & restructuring program Plant reduction & capacity consolidation underway Today2023 Sold Australasia Sold Towanda 5
14 40 65 29 68 107 111 154 187 88 89 91 200 183 138 116 67 45 232 232 232 128 130 132 III. Situation Backdrop
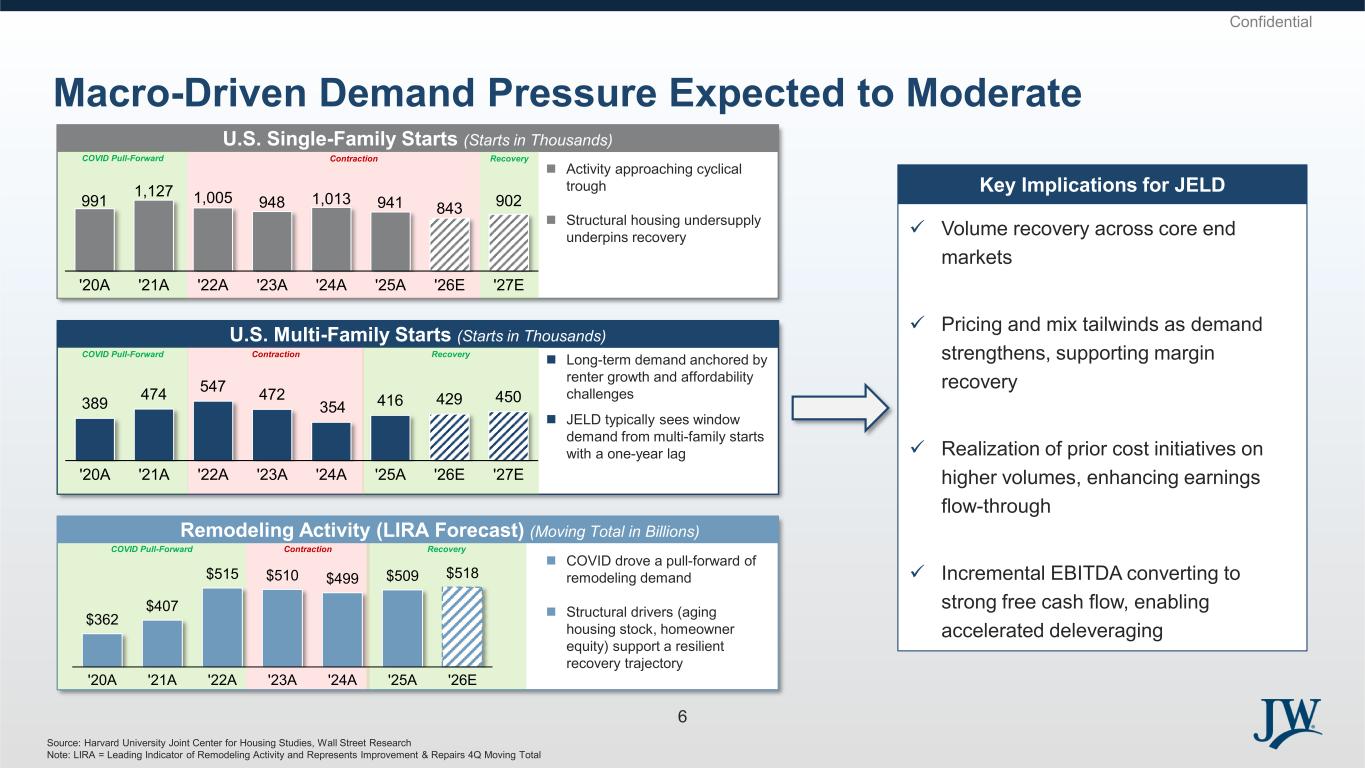
Confidential14 40 65 29 68 107 111 154 187 88 89 91 200 183 138 116 67 45 232 232 232 128 130 132 Macro-Driven Demand Pressure Expected to Moderate Source: Harvard University Joint Center for Housing Studies, Wall Street Research Note: LIRA = Leading Indicator of Remodeling Activity and Represents Improvement & Repairs 4Q Moving Total Key Implications for JELD ✓ Volume recovery across core end markets ✓ Pricing and mix tailwinds as demand strengthens, supporting margin recovery ✓ Realization of prior cost initiatives on higher volumes, enhancing earnings flow-through ✓ Incremental EBITDA converting to strong free cash flow, enabling accelerated deleveraging ◼ COVID drove a pull-forward of remodeling demand ◼ Structural drivers (aging housing stock, homeowner equity) support a resilient recovery trajectory Contraction RecoveryCOVID Pull-Forward $362 $407 $515 $510 $499 $509 $518 '20A '21A '22A '23A '24A '25A '26E ◼ Long-term demand anchored by renter growth and affordability challenges ◼ JELD typically sees window demand from multi-family starts with a one-year lag U.S. Multi-Family Starts (Starts in Thousands) RecoveryContractionCOVID Pull-Forward 389 474 547 472 354 416 429 450 '20A '21A '22A '23A '24A '25A '26E '27E Remodeling Activity (LIRA Forecast) (Moving Total in Billions) U.S. Single-Family Starts (Starts in Thousands) ◼ Activity approaching cyclical trough ◼ Structural housing undersupply underpins recovery RecoveryContractionCOVID Pull-Forward 991 1,127 1,005 948 1,013 941 843 902 '20A '21A '22A '23A '24A '25A '26E '27E 6
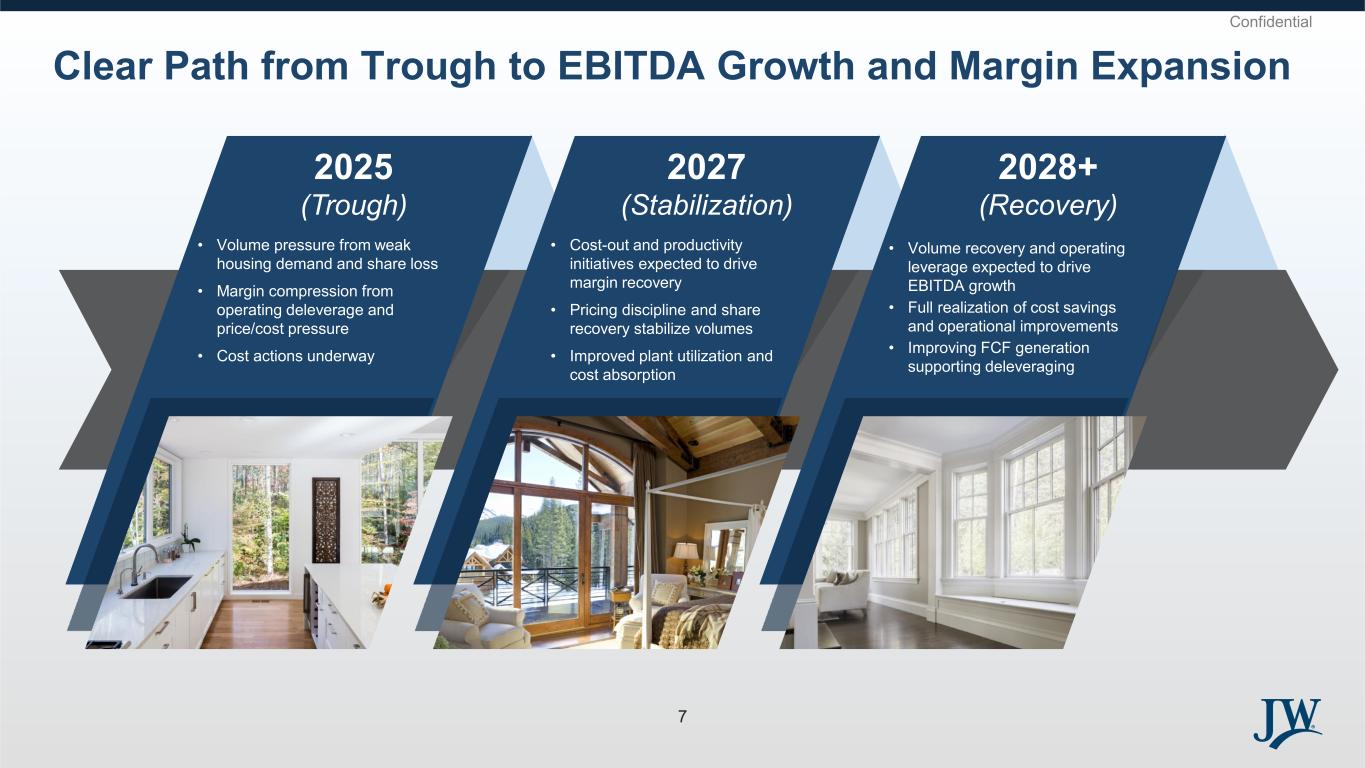
Confidential14 40 65 29 68 107 111 154 187 88 89 91 200 183 138 116 67 45 232 232 232 128 130 132 2025 (Trough) 2027 (Stabilization) 2028+ (Recovery) • Volume pressure from weak housing demand and share loss • Margin compression from operating deleverage and price/cost pressure • Cost actions underway • Cost-out and productivity initiatives expected to drive margin recovery • Pricing discipline and share recovery stabilize volumes • Improved plant utilization and cost absorption • Volume recovery and operating leverage expected to drive EBITDA growth • Full realization of cost savings and operational improvements • Improving FCF generation supporting deleveraging Clear Path from Trough to EBITDA Growth and Margin Expansion 7
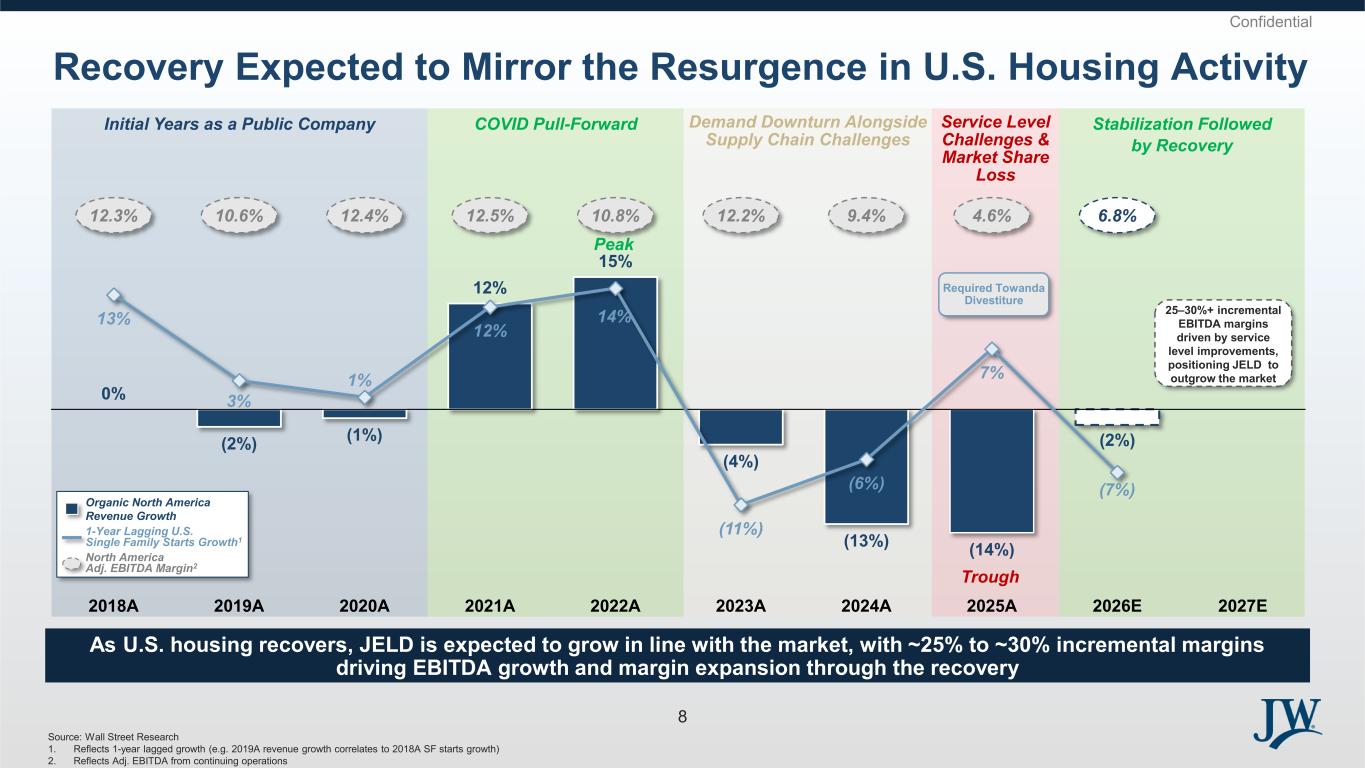
Confidential14 40 65 29 68 107 111 154 187 88 89 91 200 183 138 116 67 45 232 232 232 128 130 132 Source: Wall Street Research 1. Reflects 1-year lagged growth (e.g. 2019A revenue growth correlates to 2018A SF starts growth) 2. Reflects Adj. EBITDA from continuing operations Recovery Expected to Mirror the Resurgence in U.S. Housing Activity Service Level Challenges & Market Share Loss Initial Years as a Public Company Stabilization Followed by Recovery Demand Downturn Alongside Supply Chain Challenges COVID Pull-Forward Trough Organic North America Revenue Growth 1-Year Lagging U.S. Single Family Starts Growth1 North America Adj. EBITDA Margin2 Peak Required Towanda Divestiture 25–30%+ incremental EBITDA margins driven by service level improvements, positioning JELD to outgrow the market As U.S. housing recovers, JELD is expected to grow in line with the market, with ~25% to ~30% incremental margins driving EBITDA growth and margin expansion through the recovery 0% (2%) (1%) 12% 15% (4%) (13%) (14%) (2%) 13% 3% 1% 12% 14% (11%) (6%) 7% (7%) 12.3% 10.6% 12.4% 12.5% 10.8% 12.2% 9.4% 4.6% 6.8% 2018A 2019A 2020A 2021A 2022A 2023A 2024A 2025A 2026E 2027E 8

14 40 65 29 68 107 111 154 187 88 89 91 200 183 138 116 67 45 232 232 232 128 130 132 IV. Key Credit Highlights
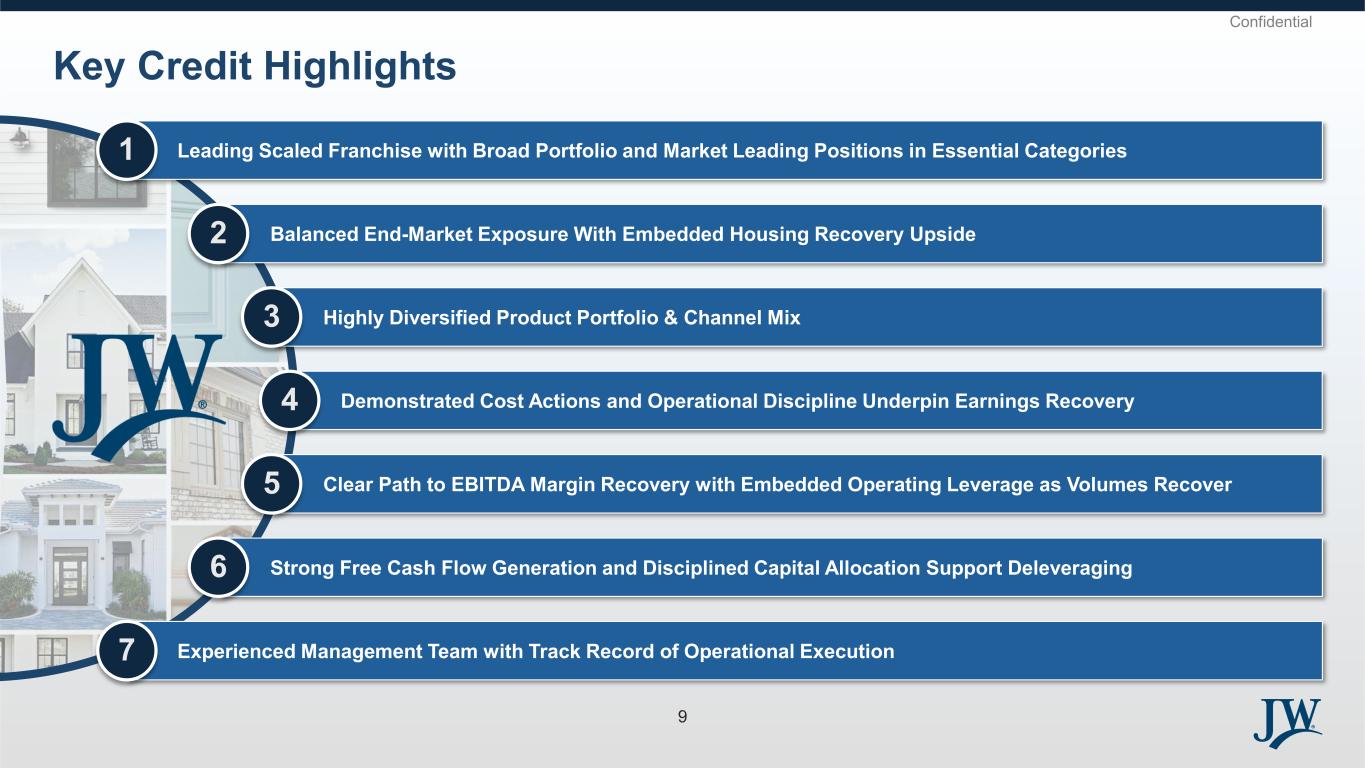
Confidential14 40 65 29 68 107 111 154 187 88 89 91 200 183 138 116 67 45 232 232 232 128 130 132 Leading Scaled Franchise with Broad Portfolio and Market Leading Positions in Essential Categories1 Clear Path to EBITDA Margin Recovery with Embedded Operating Leverage as Volumes Recover5 Strong Free Cash Flow Generation and Disciplined Capital Allocation Support Deleveraging6 Demonstrated Cost Actions and Operational Discipline Underpin Earnings Recovery4 Highly Diversified Product Portfolio & Channel Mix 3 Balanced End-Market Exposure With Embedded Housing Recovery Upside2 Experienced Management Team with Track Record of Operational Execution 7 Key Credit Highlights 9
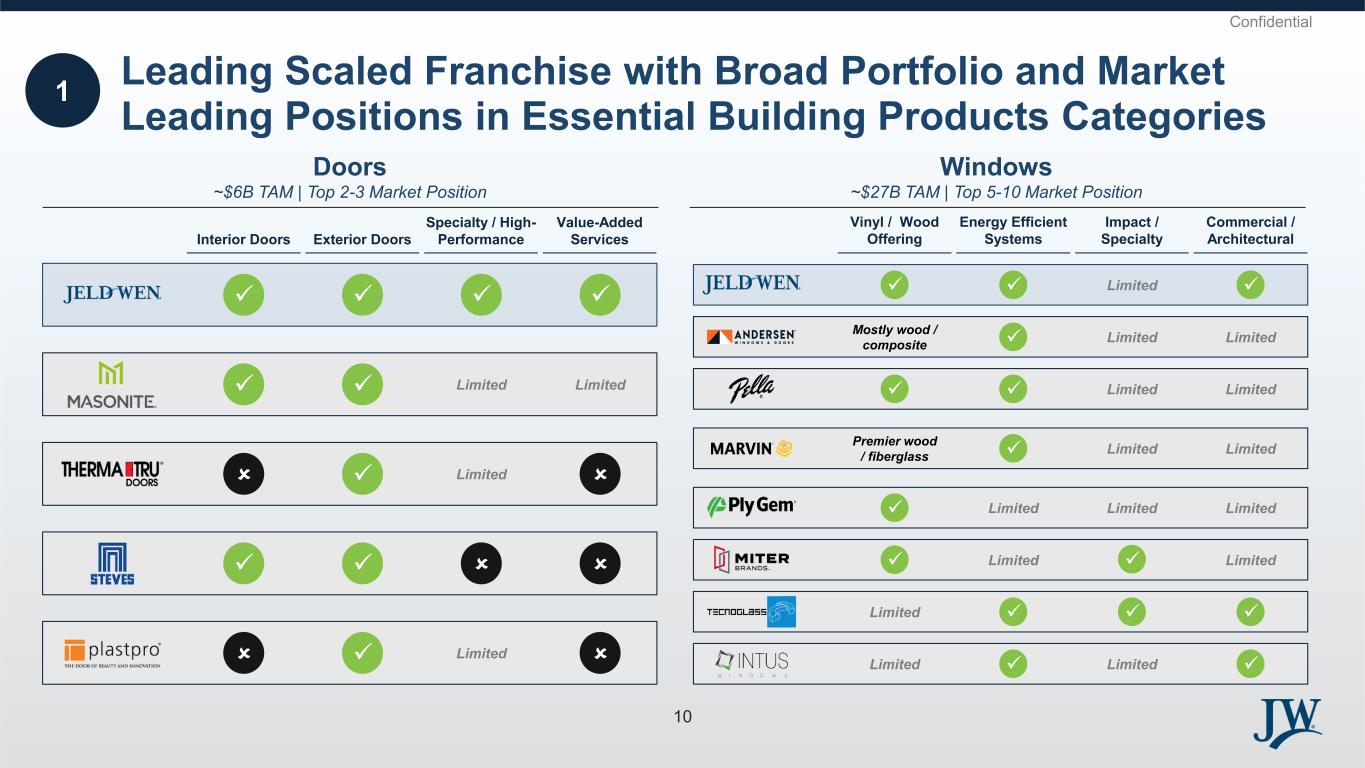
Confidential14 40 65 29 68 107 111 154 187 88 89 91 200 183 138 116 67 45 232 232 232 128 130 132 Leading Scaled Franchise with Broad Portfolio and Market Leading Positions in Essential Building Products Categories 1 Doors ~$6B TAM | Top 2-3 Market Position Exterior DoorsInterior Doors Specialty / High- Performance Value-Added Services ✓ ✓ ✓✓ ✓ ✓ ✓ ✓ Limited Limited ✓ Limited ✓ Limited Energy Efficient Systems Vinyl / Wood Offering Impact / Specialty Commercial / Architectural Windows ~$27B TAM | Top 5-10 Market Position ✓ ✓ ✓ ✓ Limited Limited Mostly wood / composite ✓ ✓ Limited Limited ✓ Limited Limited Premier wood / fiberglass ✓ Limited Limited Limited ✓ Limited Limited ✓ ✓ ✓Limited ✓ ✓LimitedLimited ✓ Limited 10
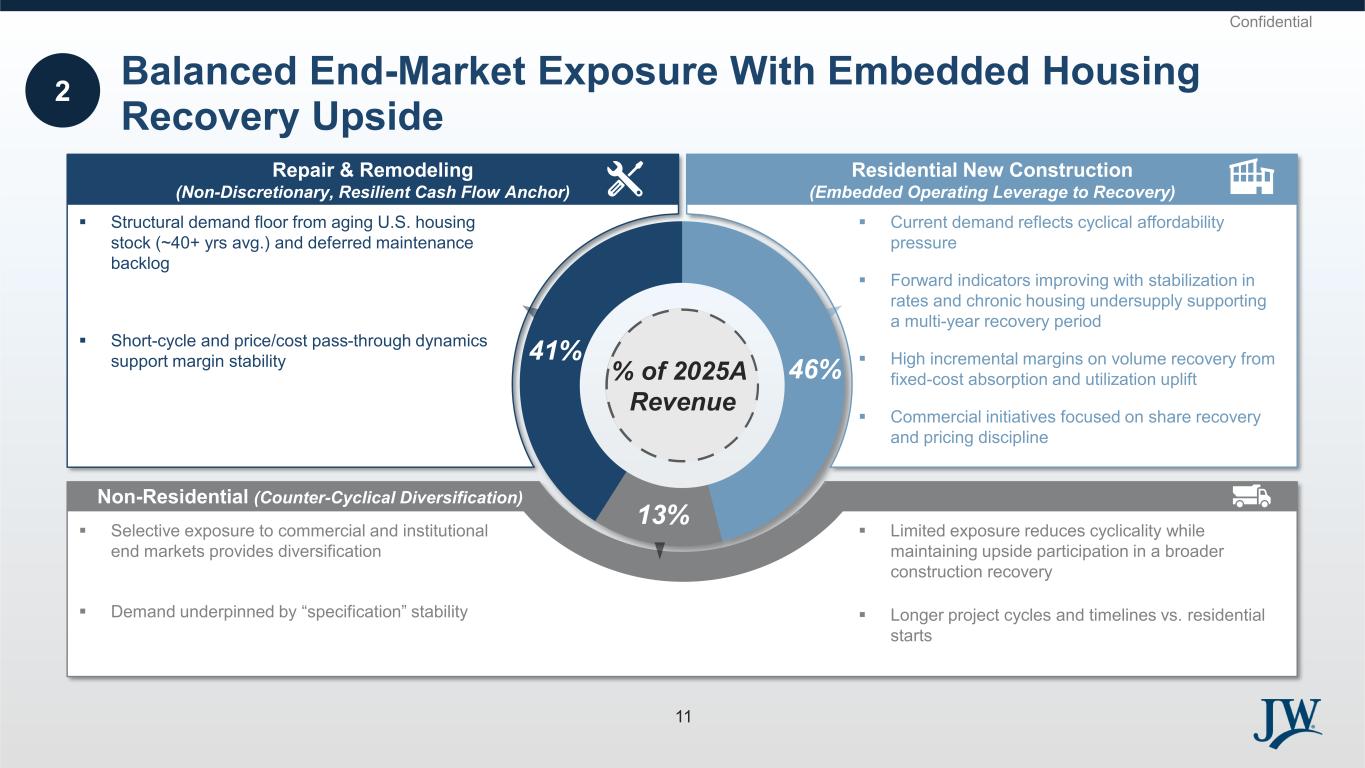
Confidential14 40 65 29 68 107 111 154 187 88 89 91 200 183 138 116 67 45 232 232 232 128 130 132 Balanced End-Market Exposure With Embedded Housing Recovery Upside 2 46% 13% 41% ▪ Structural demand floor from aging U.S. housing stock (~40+ yrs avg.) and deferred maintenance backlog ▪ Short-cycle and price/cost pass-through dynamics support margin stability ▪ Current demand reflects cyclical affordability pressure ▪ Forward indicators improving with stabilization in rates and chronic housing undersupply supporting a multi-year recovery period ▪ High incremental margins on volume recovery from fixed-cost absorption and utilization uplift ▪ Commercial initiatives focused on share recovery and pricing discipline Repair & Remodeling (Non-Discretionary, Resilient Cash Flow Anchor) Residential New Construction (Embedded Operating Leverage to Recovery) Non-Residential (Counter-Cyclical Diversification) ▪ Selective exposure to commercial and institutional end markets provides diversification ▪ Demand underpinned by “specification” stability ▪ Limited exposure reduces cyclicality while maintaining upside participation in a broader construction recovery ▪ Longer project cycles and timelines vs. residential starts % of 2025A Revenue 11
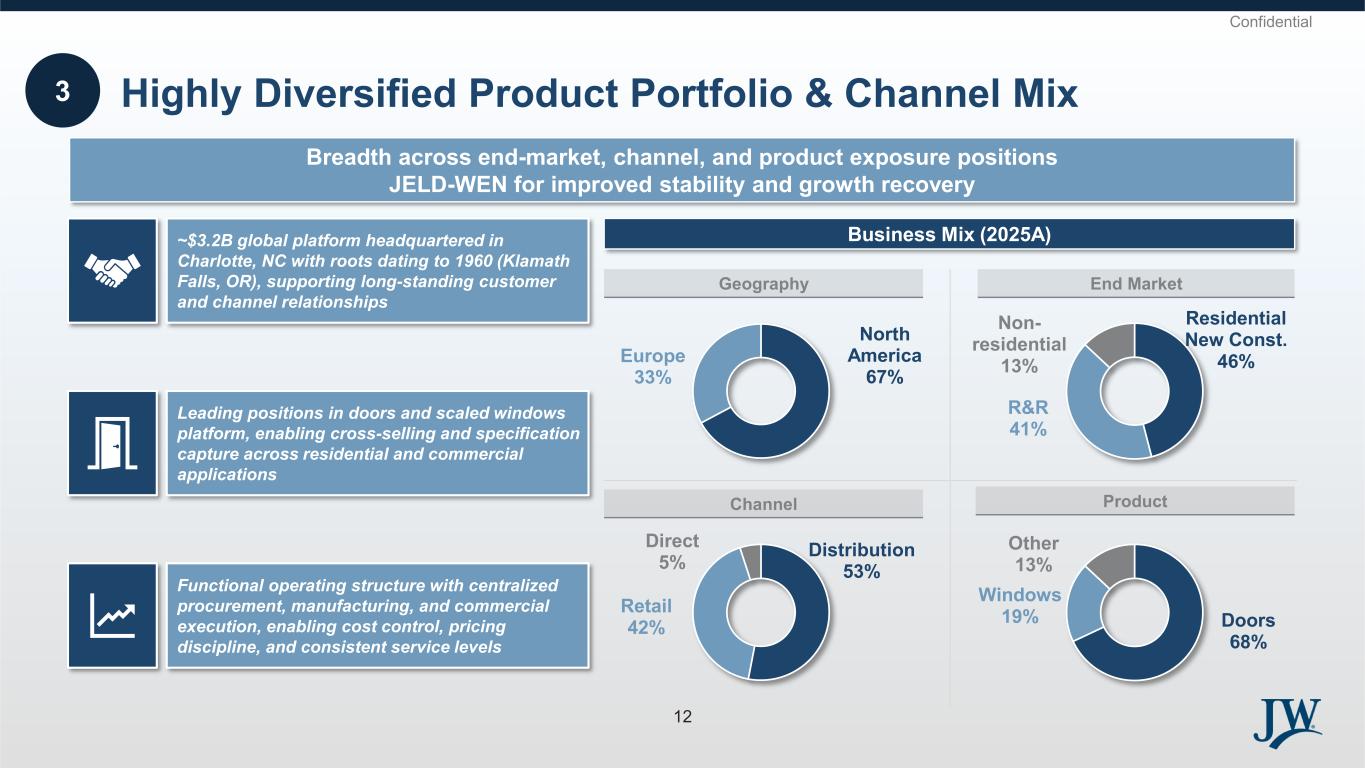
Confidential14 40 65 29 68 107 111 154 187 88 89 91 200 183 138 116 67 45 232 232 232 128 130 132 Doors 68% Windows 19% Other 13% Distribution 53% Retail 42% Direct 5% Residential New Const. 46% R&R 41% Non- residential 13% North America 67% Europe 33% Business Mix (2025A) Breadth across end-market, channel, and product exposure positions JELD-WEN for improved stability and growth recovery Geography End Market Channel Product 3 Highly Diversified Product Portfolio & Channel Mix Leading positions in doors and scaled windows platform, enabling cross-selling and specification capture across residential and commercial applications Functional operating structure with centralized procurement, manufacturing, and commercial execution, enabling cost control, pricing discipline, and consistent service levels ~$3.2B global platform headquartered in Charlotte, NC with roots dating to 1960 (Klamath Falls, OR), supporting long-standing customer and channel relationships 12
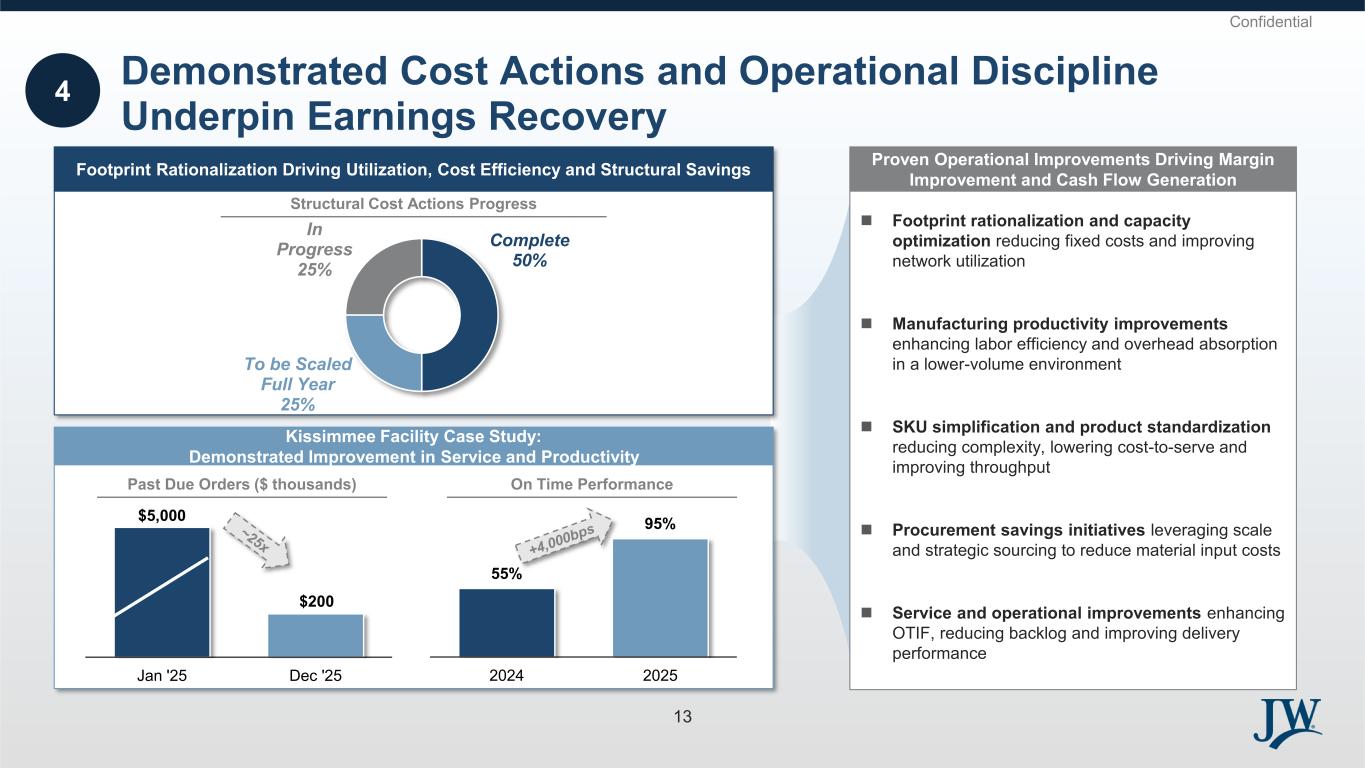
Confidential14 40 65 29 68 107 111 154 187 88 89 91 200 183 138 116 67 45 232 232 232 128 130 132 Demonstrated Cost Actions and Operational Discipline Underpin Earnings Recovery 4 Footprint Rationalization Driving Utilization, Cost Efficiency and Structural Savings Complete 50% To be Scaled Full Year 25% In Progress 25% Kissimmee Facility Case Study: Demonstrated Improvement in Service and Productivity Past Due Orders ($ thousands) Proven Operational Improvements Driving Margin Improvement and Cash Flow Generation ◼ Footprint rationalization and capacity optimization reducing fixed costs and improving network utilization ◼ Manufacturing productivity improvements enhancing labor efficiency and overhead absorption in a lower-volume environment ◼ SKU simplification and product standardization reducing complexity, lowering cost-to-serve and improving throughput ◼ Procurement savings initiatives leveraging scale and strategic sourcing to reduce material input costs ◼ Service and operational improvements enhancing OTIF, reducing backlog and improving delivery performance Structural Cost Actions Progress On Time Performance $5,000 $200 Jan '25 Dec '25 55% 95% 2024 2025 13
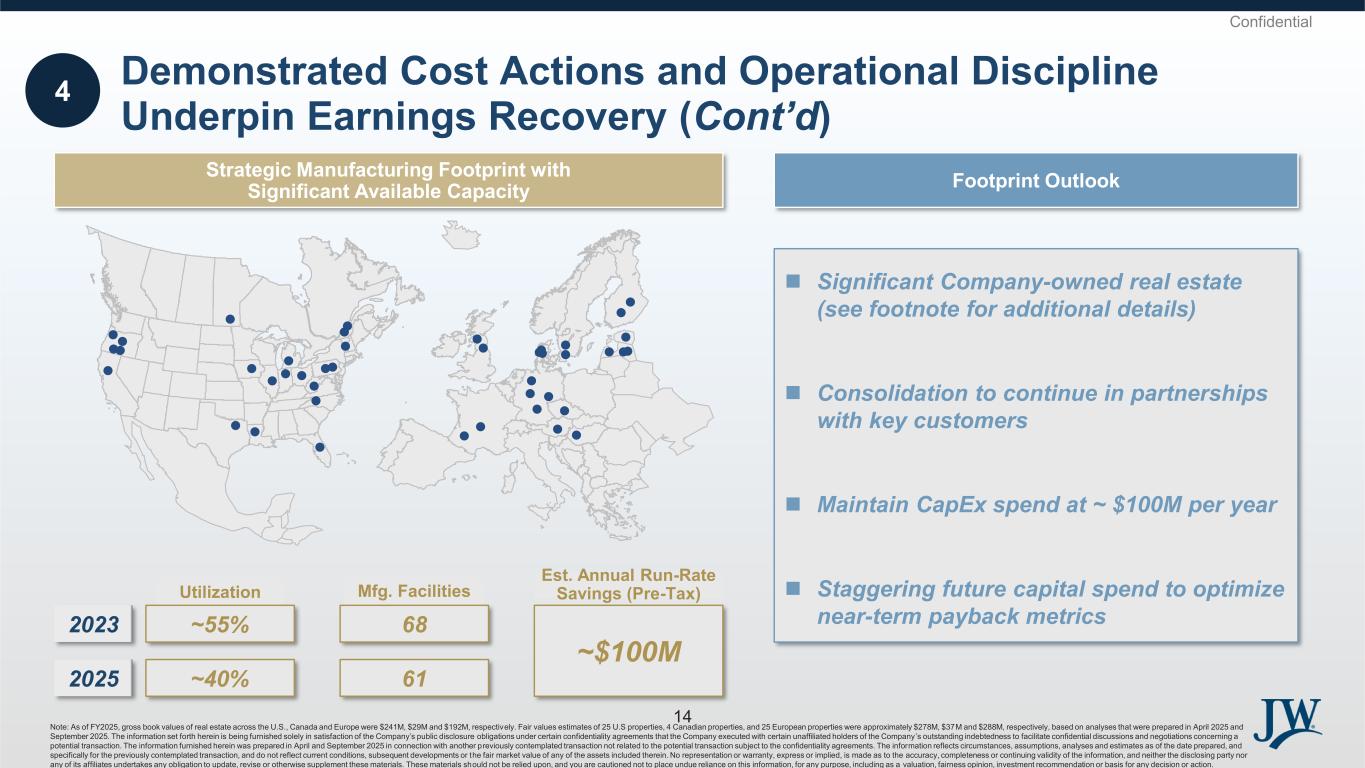
Confidential14 40 65 29 68 107 111 154 187 88 89 91 200 183 138 116 67 45 232 232 232 128 130 132 4 Demonstrated Cost Actions and Operational Discipline Underpin Earnings Recovery (Cont’d) Strategic Manufacturing Footprint with Significant Available Capacity Footprint Outlook ~$100M ◼ Significant Company-owned real estate (see footnote for additional details) ◼ Consolidation to continue in partnerships with key customers ◼ Maintain CapEx spend at ~ $100M per year ◼ Staggering future capital spend to optimize near-term payback metrics2023 2025 Mfg. Facilities 68 61 Utilization ~55% ~40% Est. Annual Run-Rate Savings (Pre-Tax) Note: As of FY2025, gross book values of real estate across the U.S., Canada and Europe were $241M, $29M and $192M, respectively. Fair values estimates of 25 U.S properties, 4 Canadian properties, and 25 European properties were approximately $278M, $37M and $288M, respectively, based on analyses that were prepared in April 2025 and September 2025. The information set forth herein is being furnished solely in satisfaction of the Company’s public disclosure obligations under certain confidentiality agreements that the Company executed with certain unaffiliated holders of the Company ’s outstanding indebtedness to facilitate confidential discussions and negotiations concerning a potential transaction. The information furnished herein was prepared in April and September 2025 in connection with another previously contemplated transaction not related to the potential transaction subject to the confidentiality agreements. The information reflects circumstances, assumptions, analyses and estimates as of the date prepared, and specifically for the previously contemplated transaction, and do not reflect current conditions, subsequent developments or the fair market value of any of the assets included therein. No representation or warranty, express or implied, is made as to the accuracy, completeness or continuing validity of the information, and neither the disclosing party nor any of its affiliates undertakes any obligation to update, revise or otherwise supplement these materials. These materials should not be relied upon, and you are cautioned not to place undue reliance on this information, for any purpose, including as a valuation, fairness opinion, investment recommendation or basis for any decision or action. 14
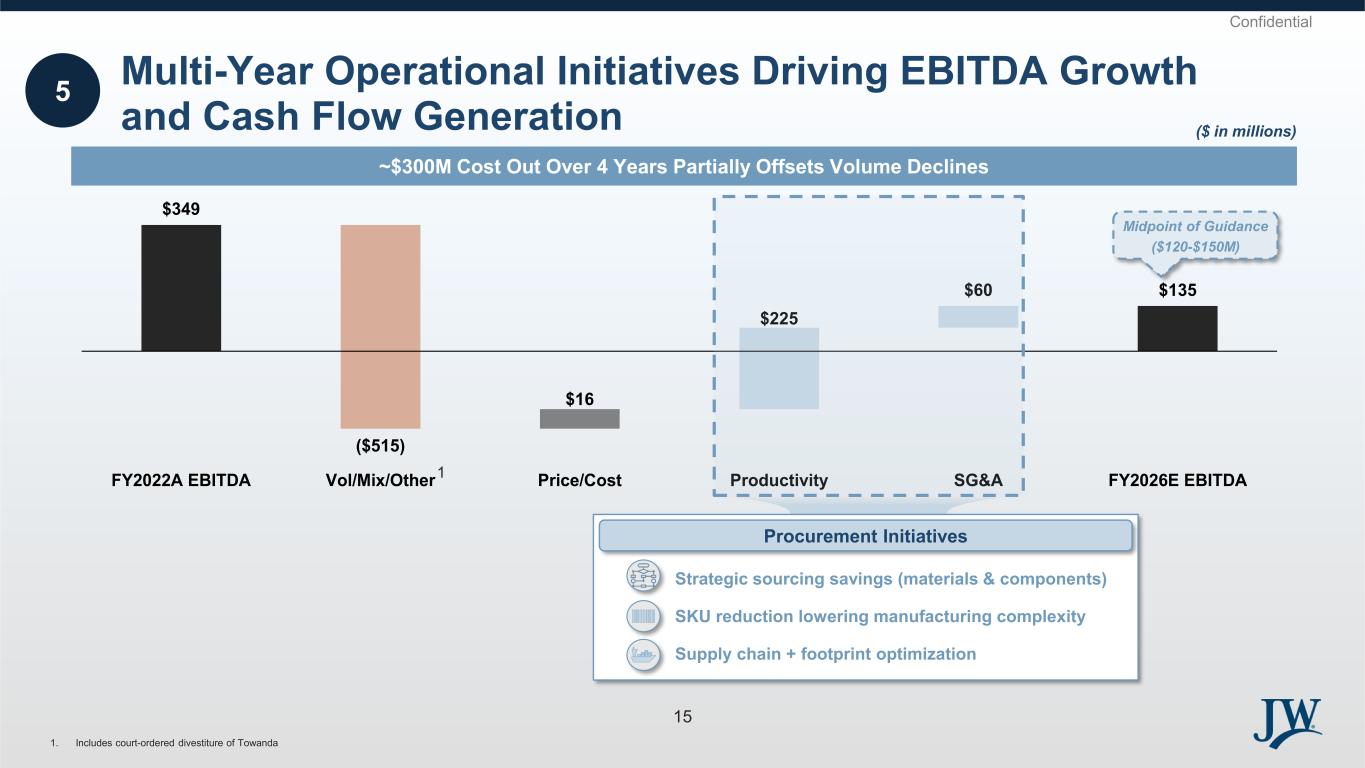
Confidential14 40 65 29 68 107 111 154 187 88 89 91 200 183 138 116 67 45 232 232 232 128 130 132 $349 ($515) $16 $225 $60 $135 FY2022A EBITDA Vol/Mix/Other Price/Cost Productivity SG&A FY2026E EBITDA ◼ Strategic sourcing savings (materials & components) ◼ SKU reduction lowering manufacturing complexity ◼ Supply chain + footprint optimization Multi-Year Operational Initiatives Driving EBITDA Growth and Cash Flow Generation 5 Procurement Initiatives ~$300M Cost Out Over 4 Years Partially Offsets Volume Declines ($ in millions) 1. Includes court-ordered divestiture of Towanda 1 Midpoint of Guidance ($120-$150M) 15
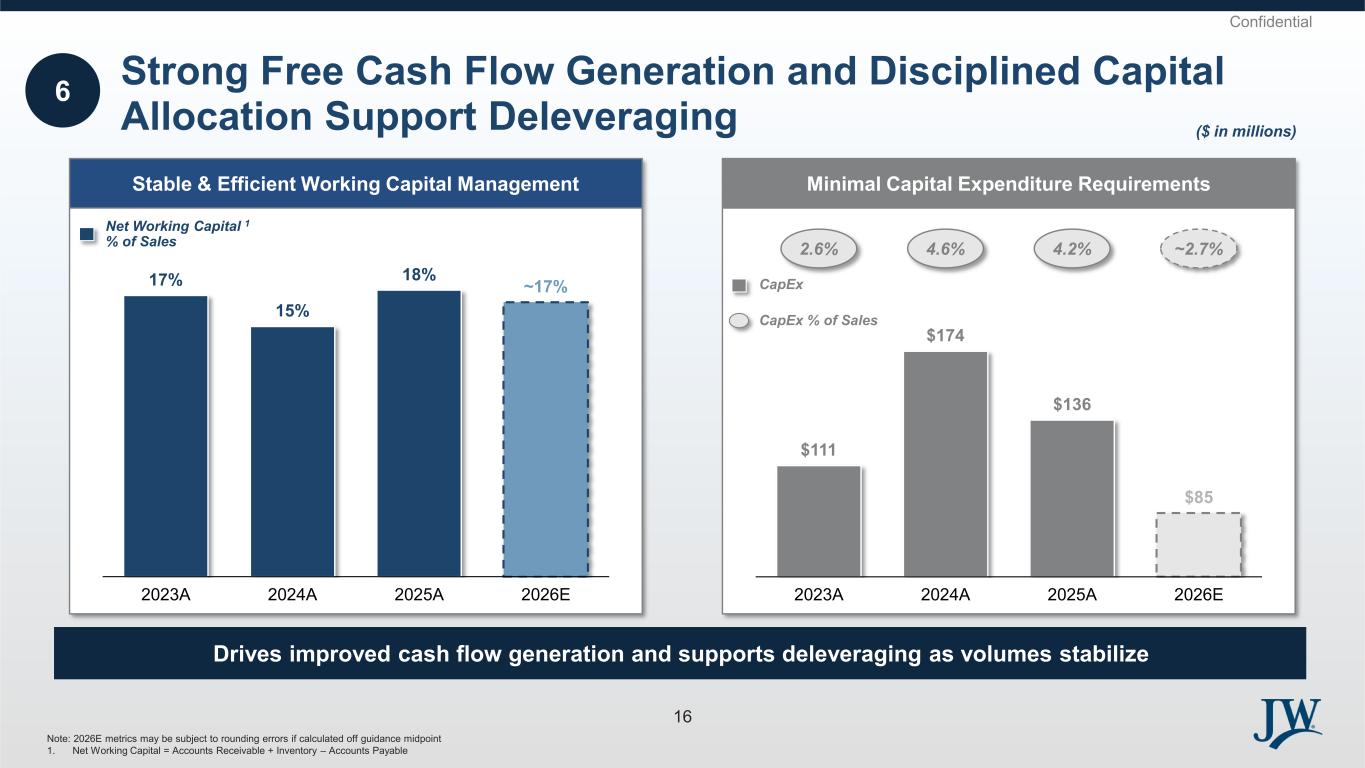
Confidential14 40 65 29 68 107 111 154 187 88 89 91 200 183 138 116 67 45 232 232 232 128 130 132 Note: 2026E metrics may be subject to rounding errors if calculated off guidance midpoint 1. Net Working Capital = Accounts Receivable + Inventory – Accounts Payable Stable & Efficient Working Capital Management Minimal Capital Expenditure Requirements Drives improved cash flow generation and supports deleveraging as volumes stabilize Strong Free Cash Flow Generation and Disciplined Capital Allocation Support Deleveraging 6 CapEx CapEx % of Sales Net Working Capital 1 % of Sales $111 $174 $136 $85 2.6% 4.6% 4.2% ~2.7% 2023A 2024A 2025A 2026E ($ in millions) 17% 15% 18% ~17% 2023A 2024A 2025A 2026E 16
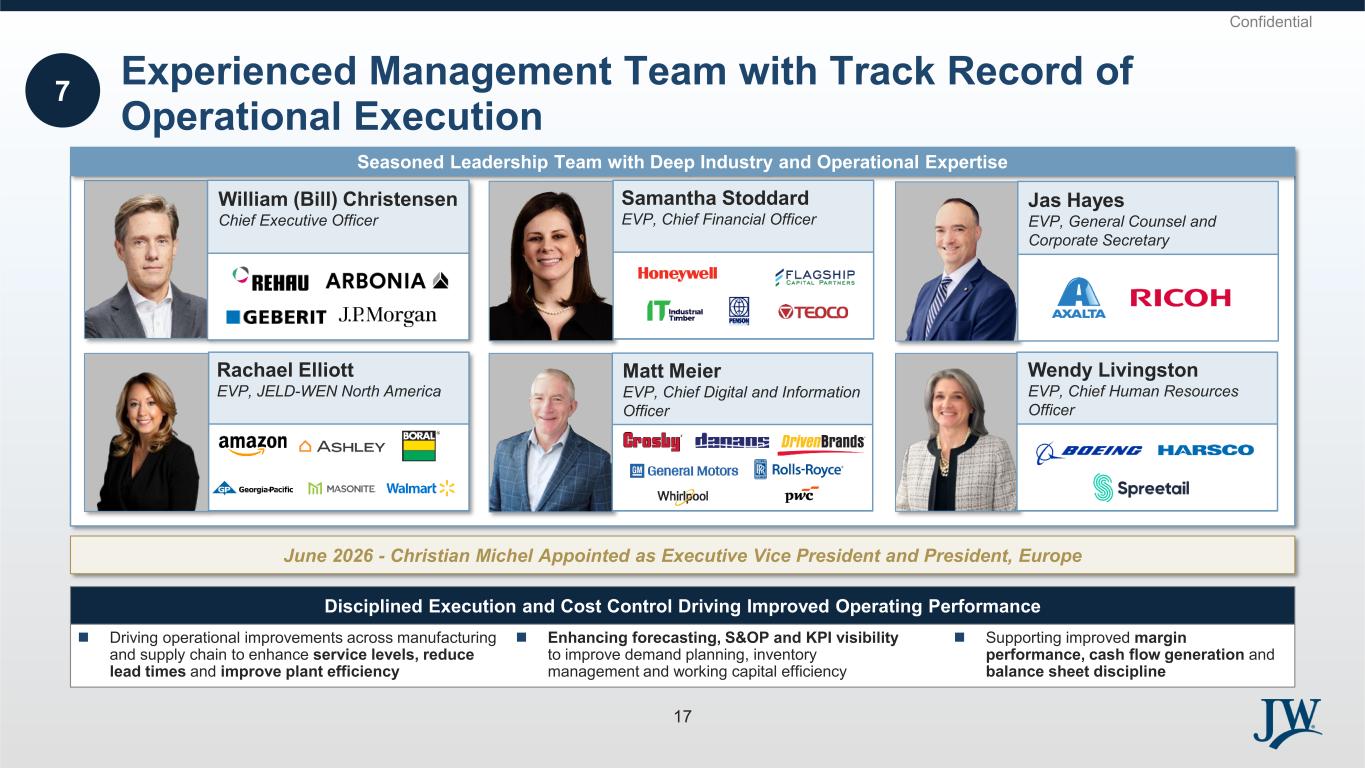
Confidential14 40 65 29 68 107 111 154 187 88 89 91 200 183 138 116 67 45 232 232 232 128 130 132 Seasoned Leadership Team with Deep Industry and Operational Expertise Experienced Management Team with Track Record of Operational Execution 7 Wendy Livingston EVP, Chief Human Resources Officer Matt Meier EVP, Chief Digital and Information Officer Samantha Stoddard EVP, Chief Financial Officer William (Bill) Christensen Chief Executive Officer Jas Hayes EVP, General Counsel and Corporate Secretary Disciplined Execution and Cost Control Driving Improved Operating Performance ◼ Driving operational improvements across manufacturing and supply chain to enhance service levels, reduce lead times and improve plant efficiency ◼ Supporting improved margin performance, cash flow generation and balance sheet discipline ◼ Enhancing forecasting, S&OP and KPI visibility to improve demand planning, inventory management and working capital efficiency Rachael Elliott EVP, JELD-WEN North America June 2026 - Christian Michel Appointed as Executive Vice President and President, Europe 17
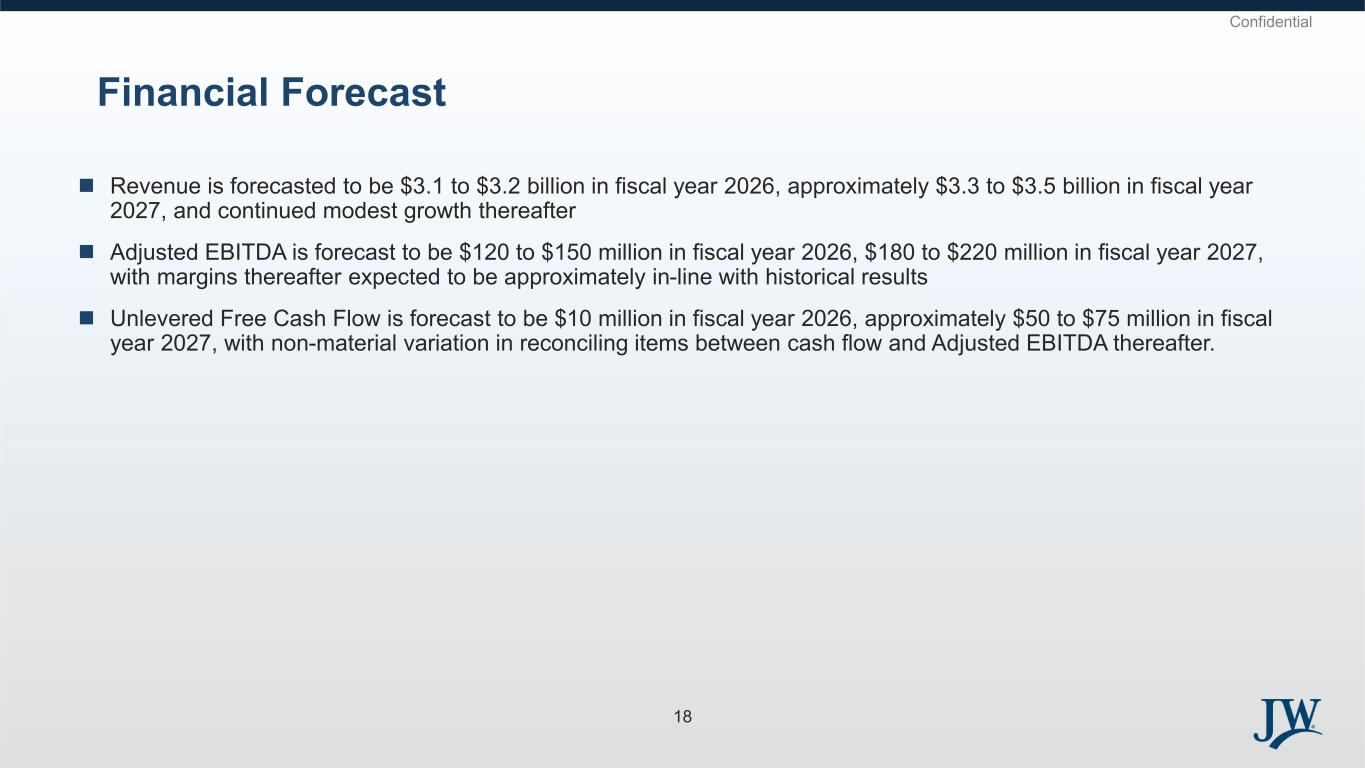
Confidential14 40 65 29 68 107 111 154 187 88 89 91 200 183 138 116 67 45 232 232 232 128 130 132 Financial Forecast ◼ Revenue is forecasted to be $3.1 to $3.2 billion in fiscal year 2026, approximately $3.3 to $3.5 billion in fiscal year 2027, and continued modest growth thereafter ◼ Adjusted EBITDA is forecast to be $120 to $150 million in fiscal year 2026, $180 to $220 million in fiscal year 2027, with margins thereafter expected to be approximately in-line with historical results ◼ Unlevered Free Cash Flow is forecast to be $10 million in fiscal year 2026, approximately $50 to $75 million in fiscal year 2027, with non-material variation in reconciling items between cash flow and Adjusted EBITDA thereafter. 18
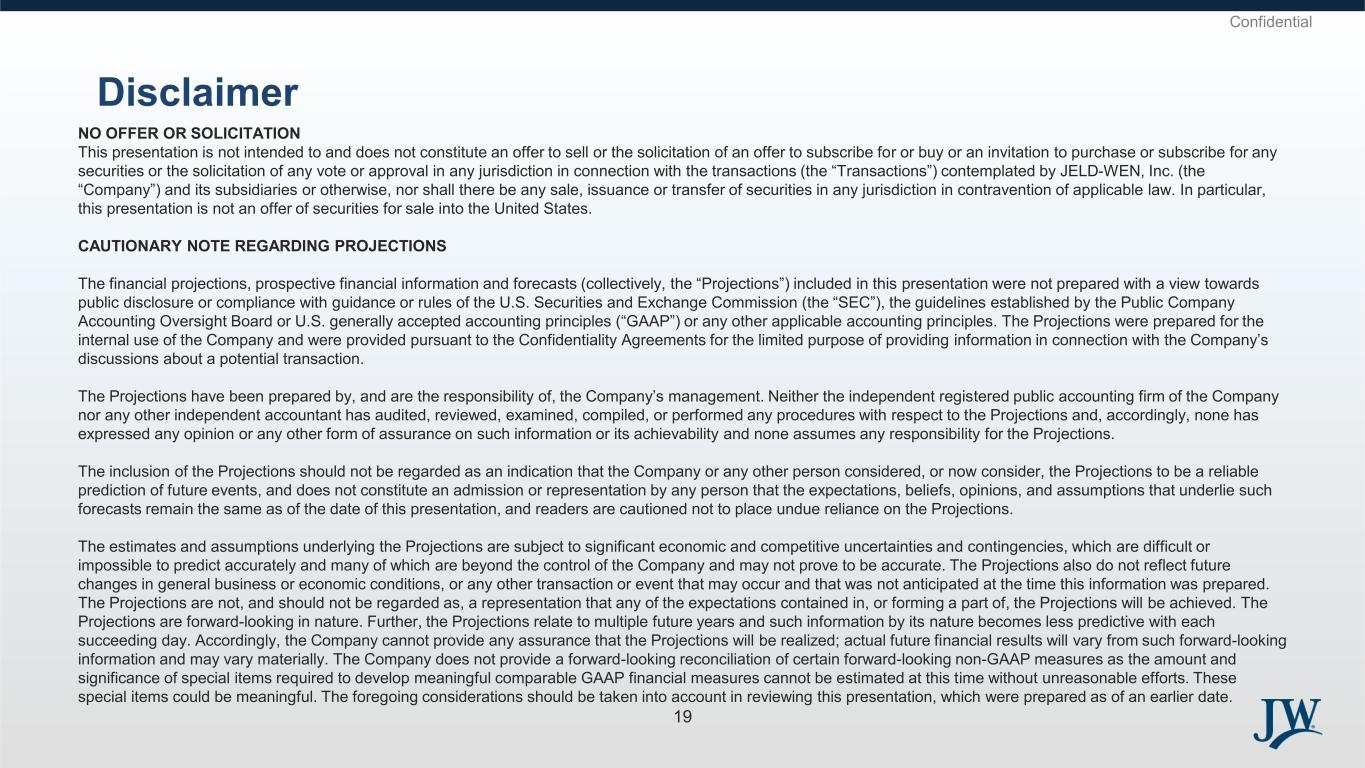
Confidential14 40 65 29 68 107 111 154 187 88 89 91 200 183 138 116 67 45 232 232 232 128 130 132 Disclaimer NO OFFER OR SOLICITATION This presentation is not intended to and does not constitute an offer to sell or the solicitation of an offer to subscribe for or buy or an invitation to purchase or subscribe for any securities or the solicitation of any vote or approval in any jurisdiction in connection with the transactions (the “Transactions”) contemplated by JELD-WEN, Inc. (the “Company”) and its subsidiaries or otherwise, nor shall there be any sale, issuance or transfer of securities in any jurisdiction in contravention of applicable law. In particular, this presentation is not an offer of securities for sale into the United States. CAUTIONARY NOTE REGARDING PROJECTIONS The financial projections, prospective financial information and forecasts (collectively, the “Projections”) included in this presentation were not prepared with a view towards public disclosure or compliance with guidance or rules of the U.S. Securities and Exchange Commission (the “SEC”), the guidelines established by the Public Company Accounting Oversight Board or U.S. generally accepted accounting principles (“GAAP”) or any other applicable accounting principles. The Projections were prepared for the internal use of the Company and were provided pursuant to the Confidentiality Agreements for the limited purpose of providing information in connection with the Company’s discussions about a potential transaction. The Projections have been prepared by, and are the responsibility of, the Company’s management. Neither the independent registered public accounting firm of the Company nor any other independent accountant has audited, reviewed, examined, compiled, or performed any procedures with respect to the Projections and, accordingly, none has expressed any opinion or any other form of assurance on such information or its achievability and none assumes any responsibility for the Projections. The inclusion of the Projections should not be regarded as an indication that the Company or any other person considered, or now consider, the Projections to be a reliable prediction of future events, and does not constitute an admission or representation by any person that the expectations, beliefs, opinions, and assumptions that underlie such forecasts remain the same as of the date of this presentation, and readers are cautioned not to place undue reliance on the Projections. The estimates and assumptions underlying the Projections are subject to significant economic and competitive uncertainties and contingencies, which are difficult or impossible to predict accurately and many of which are beyond the control of the Company and may not prove to be accurate. The Projections also do not reflect future changes in general business or economic conditions, or any other transaction or event that may occur and that was not anticipated at the time this information was prepared. The Projections are not, and should not be regarded as, a representation that any of the expectations contained in, or forming a part of, the Projections will be achieved. The Projections are forward-looking in nature. Further, the Projections relate to multiple future years and such information by its nature becomes less predictive with each succeeding day. Accordingly, the Company cannot provide any assurance that the Projections will be realized; actual future financial results will vary from such forward-looking information and may vary materially. The Company does not provide a forward-looking reconciliation of certain forward-looking non-GAAP measures as the amount and significance of special items required to develop meaningful comparable GAAP financial measures cannot be estimated at this time without unreasonable efforts. These special items could be meaningful. The foregoing considerations should be taken into account in reviewing this presentation, which were prepared as of an earlier date. 19
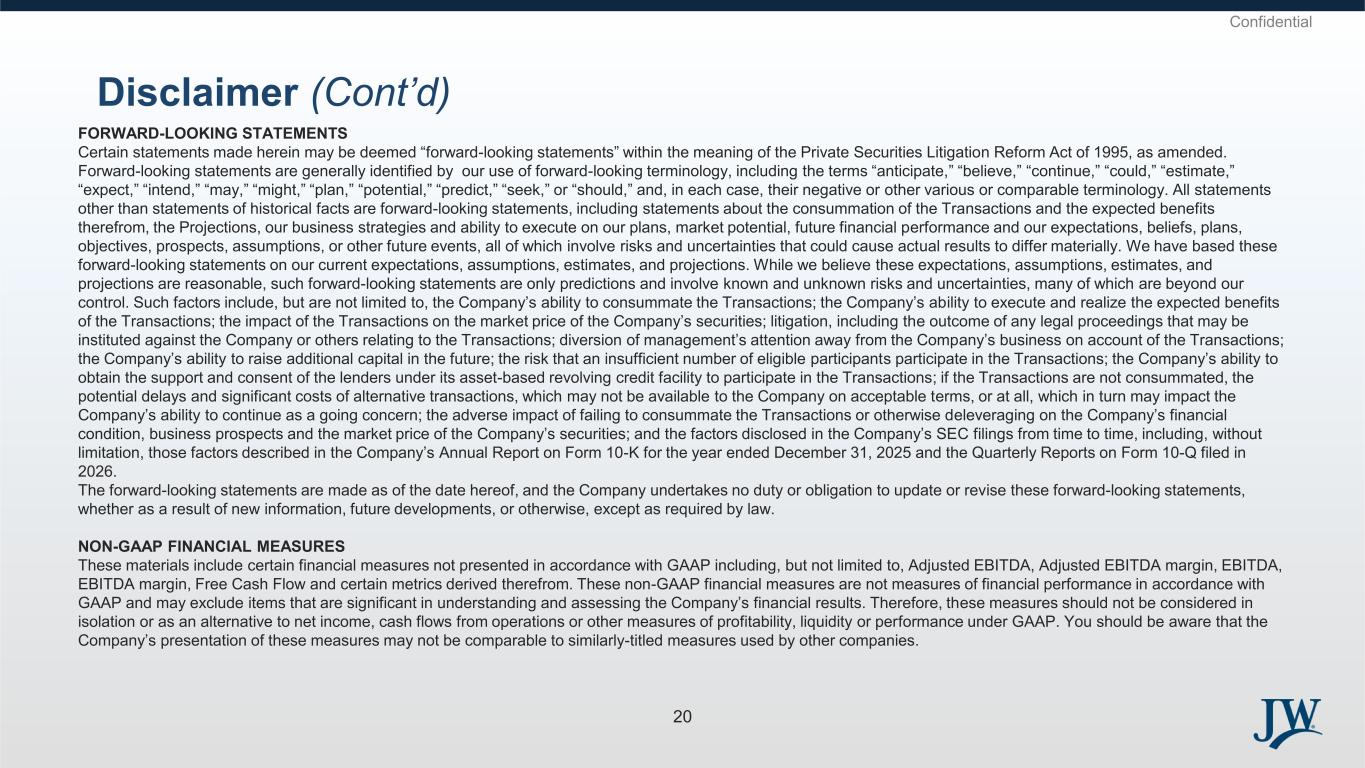
Confidential14 40 65 29 68 107 111 154 187 88 89 91 200 183 138 116 67 45 232 232 232 128 130 132 Disclaimer (Cont’d) FORWARD-LOOKING STATEMENTS Certain statements made herein may be deemed “forward-looking statements” within the meaning of the Private Securities Litigation Reform Act of 1995, as amended. Forward-looking statements are generally identified by our use of forward-looking terminology, including the terms “anticipate,” “believe,” “continue,” “could,” “estimate,” “expect,” “intend,” “may,” “might,” “plan,” “potential,” “predict,” “seek,” or “should,” and, in each case, their negative or other various or comparable terminology. All statements other than statements of historical facts are forward-looking statements, including statements about the consummation of the Transactions and the expected benefits therefrom, the Projections, our business strategies and ability to execute on our plans, market potential, future financial performance and our expectations, beliefs, plans, objectives, prospects, assumptions, or other future events, all of which involve risks and uncertainties that could cause actual results to differ materially. We have based these forward-looking statements on our current expectations, assumptions, estimates, and projections. While we believe these expectations, assumptions, estimates, and projections are reasonable, such forward-looking statements are only predictions and involve known and unknown risks and uncertainties, many of which are beyond our control. Such factors include, but are not limited to, the Company’s ability to consummate the Transactions; the Company’s ability to execute and realize the expected benefits of the Transactions; the impact of the Transactions on the market price of the Company’s securities; litigation, including the outcome of any legal proceedings that may be instituted against the Company or others relating to the Transactions; diversion of management’s attention away from the Company’s business on account of the Transactions; the Company’s ability to raise additional capital in the future; the risk that an insufficient number of eligible participants participate in the Transactions; the Company’s ability to obtain the support and consent of the lenders under its asset-based revolving credit facility to participate in the Transactions; if the Transactions are not consummated, the potential delays and significant costs of alternative transactions, which may not be available to the Company on acceptable terms, or at all, which in turn may impact the Company’s ability to continue as a going concern; the adverse impact of failing to consummate the Transactions or otherwise deleveraging on the Company’s financial condition, business prospects and the market price of the Company’s securities; and the factors disclosed in the Company’s SEC filings from time to time, including, without limitation, those factors described in the Company’s Annual Report on Form 10-K for the year ended December 31, 2025 and the Quarterly Reports on Form 10-Q filed in 2026. The forward-looking statements are made as of the date hereof, and the Company undertakes no duty or obligation to update or revise these forward-looking statements, whether as a result of new information, future developments, or otherwise, except as required by law. NON-GAAP FINANCIAL MEASURES These materials include certain financial measures not presented in accordance with GAAP including, but not limited to, Adjusted EBITDA, Adjusted EBITDA margin, EBITDA, EBITDA margin, Free Cash Flow and certain metrics derived therefrom. These non-GAAP financial measures are not measures of financial performance in accordance with GAAP and may exclude items that are significant in understanding and assessing the Company’s financial results. Therefore, these measures should not be considered in isolation or as an alternative to net income, cash flows from operations or other measures of profitability, liquidity or performance under GAAP. You should be aware that the Company’s presentation of these measures may not be comparable to similarly-titled measures used by other companies. 20