Exhibit 99.1
| Ashley – Huntington’s Disease Community Advocate Phase I/II ifezuntirgene inilparvovec (AMT-130) Huntington’s Disease Program Update September 29, 2026 |

| LEADERSHIP IN GENE THERAPY SEPTEMBER 2026 | 2 This presentation contains forward-looking statements within the meaning of Section 27A of the Securities Act of 1933, as amended, and Section 21E of the Securities Exchange Act of 1934, as amended. All statements other than statements of historical fact are forward-looking statements, which are often indicated by terms such as “anticipate,” “believe,” “could,” “estimate,” “expect,” “goal,” “intend,” “look forward to,” “may,” “plan,” “potential,” “predict,” “project,” “should,” "will,” “would” and similar expressions and the negatives of those terms. Forward-looking statements are based on management's beliefs and assumptions and on information available to management only as of the date of this presentation. Examples of these forward-looking statements include, but are not limited to, statements concerning: the timing of our meetings and discussions with regulatory authorities; our ability to continue accumulating long-term patient data; the potential clinical and functional effects of AMT-130; the potential for accelerated regulatory pathways, including priority review, for AMT-130; our enrollment of a fourth cohort studying AMT-130 in patients with higher striatal volumes compared to patients in prior cohorts; the utility of NfL in CSF as an effective biomarker and indicator of clinical severity; and the potential commercialization of AMT-130 and statements related thereto, including our potential addressable market and potential treatment centers. Because these statements are subject to risks and uncertainties, our actual results could differ materially from those expressed in these forward-looking statements. These risks and uncertainties include, among others: risks related to our clinical trials of AMT-130, including the risk that such trials will be unable to demonstrate data sufficient to support further clinical development and the risk that interim or topline data from the trials may not be predictive of later data readouts; risks related to our interactions with regulatory authorities, which may affect the initiation, timing and progress of clinical trials and pathways to regulatory approval; whether the measurements that we are evaluating continue to be viewed as robust and sensitive measurements of disease progression; whether Regenerative Medicine Advance Therapy designation, Breakthrough Therapy designation, or any accelerated pathway, if granted, will lead to regulatory approval; our ability to conduct and fund a Phase III or confirmatory study for AMT-130 if needed; our ability to continue to build and maintain the infrastructure and personnel needed to achieve our goals, including commercialization of AMT-130 if approved; our effectiveness in managing current and future clinical trials and regulatory processes; our ability to demonstrate the therapeutic benefits of our gene therapy candidates in clinical trials; the continued development and acceptance of gene therapies; our ability to obtain, maintain and protect our intellectual property; and our ability to fund our operations and to raise additional capital as needed and on acceptable terms. These and other risks and uncertainties are described more fully under the heading “Risk Factors” in our periodic filings with the U.S. Securities and Exchange Commission (“SEC”), including in our Annual Report on Form 10-K filed with the SEC on March 2, 2026 our Quarterly Reports on Form 10-Q filed with the SEC on May 5, 2026 and July 29, 2026, and other filings that we make with the SEC from time to time. Given these risks, uncertainties and other factors, you should not place undue reliance on these forward-looking statements and, except as required by law, we assume no obligation to update these forward-looking statements to reflect events that occur or circumstances that exist after the date on which they were made. The ongoing Phase I/II AMT-130 clinical trials, from which the data herein are derived, are supplemented by two additional protocols, each with a statistical plan that was submitted to the FDA. The new protocols, among other things, provide for the pooling of data across the ongoing U.S. and EU studies, and also prespecified the comparison of AMT-130 clinical end points compared to a propensity score-matched external control from the updated Enroll-HD natural history data set. Certain information contained in this presentation relates to or is based on studies, publications, surveys and other data obtained from third-party sources and our own internal estimates and research. While we believe these third-party sources to be reliable as of the date of this presentation, we have not independently verified, and makes no representation as to the adequacy, fairness, accuracy or completeness of, any information obtained from third -party sources. Finally, while we believe our own internal research is reliable, such research has not been verified by any independent source. Disclaimer |
| Opening Remarks Matt Kapusta Chief Executive Officer |

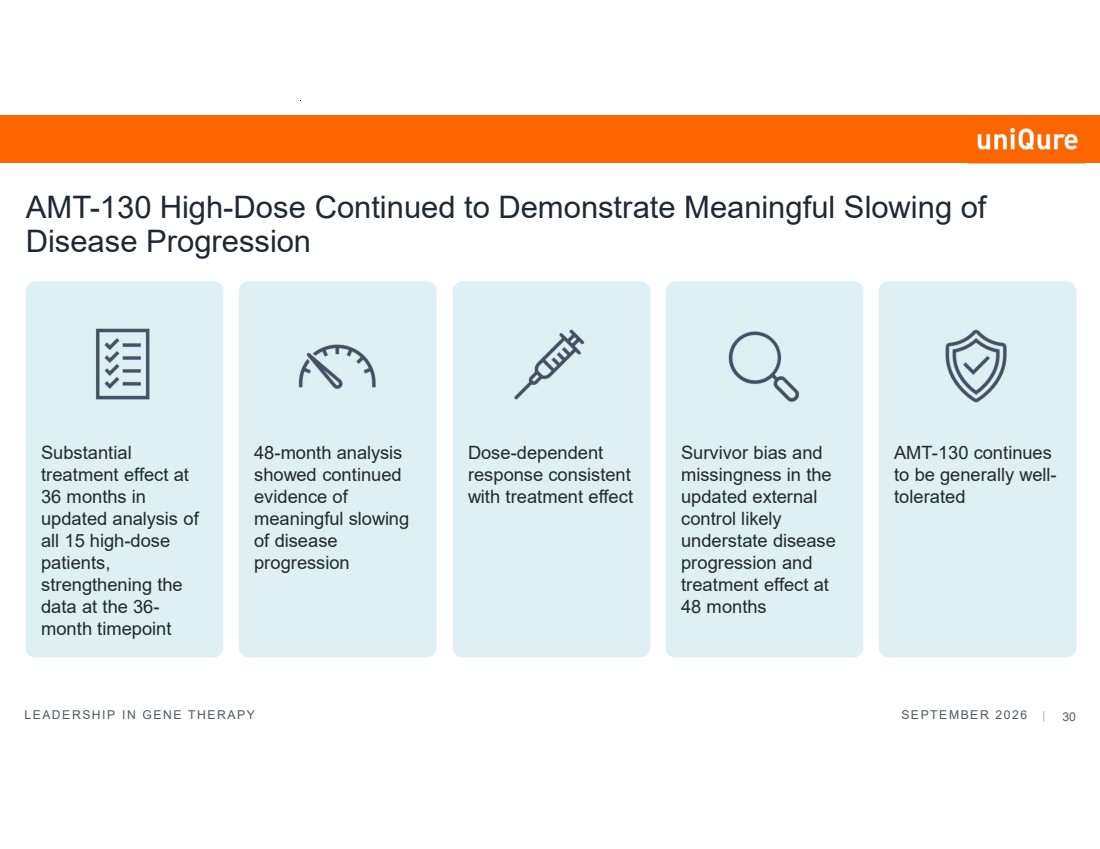
| LEADERSHIP IN GENE THERAPY SEPTEMBER 2026 | 4 AMT-130 High-Dose Continued to Demonstrate Meaningful Slowing of Disease Progression Substantial treatment effect at 36 months in updated analysis of all 15 high-dose patients, strengthening the data at the 36- month timepoint 48-month analysis showed continued evidence of meaningful slowing of disease progression Dose-dependent response consistent with treatment effect Survivor bias and missingness in the updated external control likely understate disease progression and treatment effect at 48 months AMT-130 continues to be generally well-tolerated |
| Review of Data Supporting the BLA and MAA Submissions: June 2025 Data Cut: 36 Month Analysis of AMT-130 High Dose (N=12) Walid Abi-Saab, M.D. Chief Medical Officer BLA, Biologics License Application; MAA, Marketing Authorization Application |
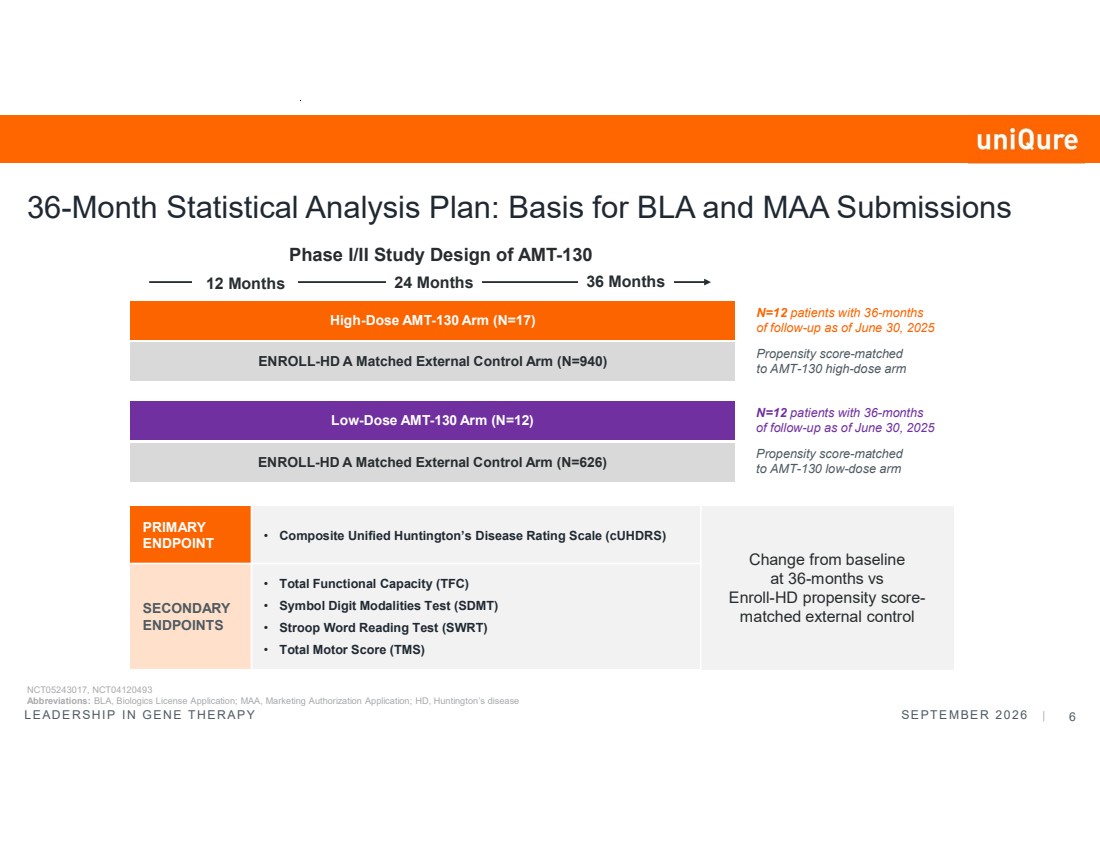
| LEADERSHIP IN GENE THERAPY SEPTEMBER 2026 | 6 36-Month Statistical Analysis Plan: Basis for BLA and MAA Submissions 12 Months 24 Months 36 Months N=12 patients with 36-months of follow-up as of June 30, 2025 Propensity score-matched to AMT-130 high-dose arm High-Dose AMT-130 Arm (N=17) ENROLL-HD A Matched External Control Arm (N=940) Low-Dose AMT-130 Arm (N=12) ENROLL-HD A Matched External Control Arm (N=626) N=12 patients with 36-months of follow-up as of June 30, 2025 Propensity score-matched to AMT-130 low-dose arm Change from baseline at 36-months vs Enroll-HD propensity score-matched external control • Composite Unified Huntington’s Disease Rating Scale (cUHDRS) PRIMARY ENDPOINT • Total Functional Capacity (TFC) • Symbol Digit Modalities Test (SDMT) • Stroop Word Reading Test (SWRT) • Total Motor Score (TMS) SECONDARY ENDPOINTS Phase I/II Study Design of AMT-130 NCT05243017, NCT04120493 Abbreviations: BLA, Biologics License Application; MAA, Marketing Authorization Application; HD, Huntington’s disease |
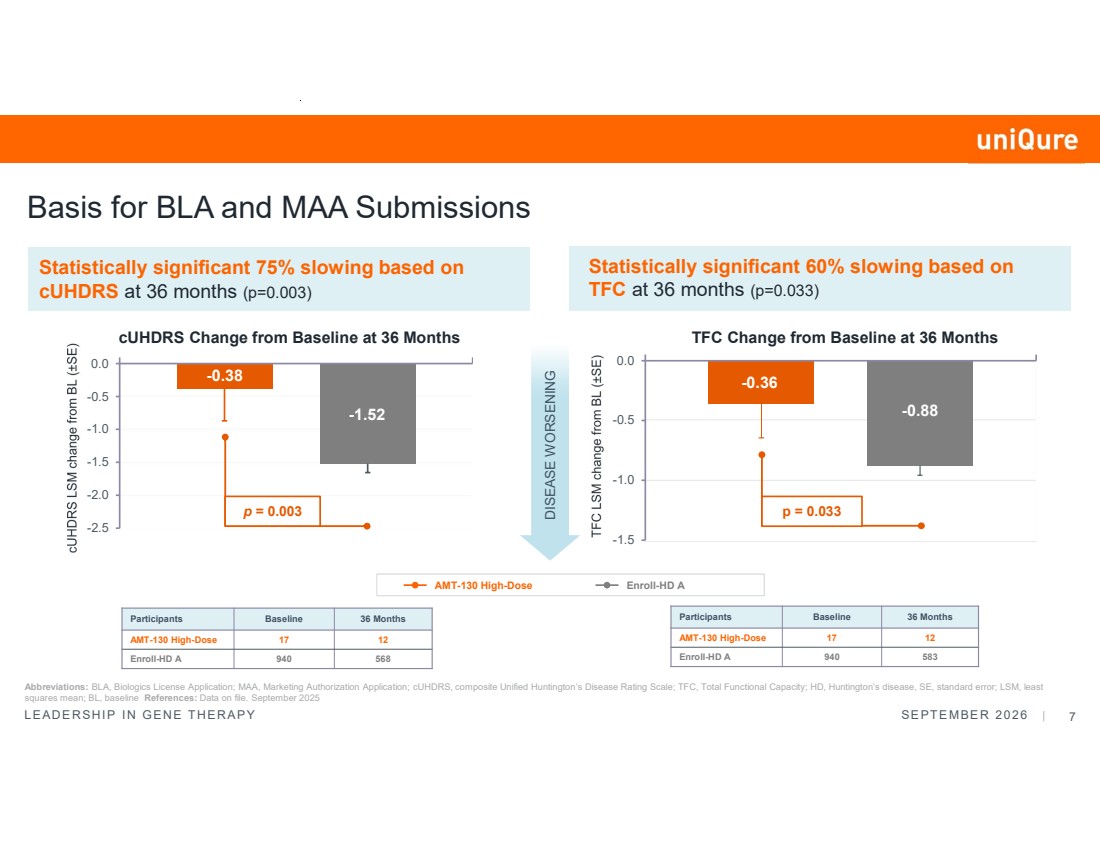
| LEADERSHIP IN GENE THERAPY SEPTEMBER 2026 | 7 Basis for BLA and MAA Submissions Statistically significant 60% slowing based on TFC at 36 months (p=0.033) Statistically significant 75% slowing based on cUHDRS at 36 months (p=0.003) Abbreviations: BLA, Biologics License Application; MAA, Marketing Authorization Application; cUHDRS, composite Unified Huntington’s Disease Rating Scale; TFC, Total Functional Capacity; HD, Huntington’s disease, SE, standard error; LSM, least squares mean; BL, baseline References: Data on file. September 2025 Participants Baseline 36 Months AMT-130 High-Dose 17 12 Enroll-HD A 940 568 Participants Baseline 36 Months AMT-130 High-Dose 17 12 Enroll-HD A 940 583 cUHDRS Change from Baseline at 36 Months DISEASE WORSENING TFC Change from Baseline at 36 Months AMT-130 High-Dose Enroll-HD A -0.38 -1.52 -2.5 -2.0 -1.5 -1.0 -0.5 0.0 p = 0.003 -0.36 -0.88 -1.5 -1.0 -0.5 0.0 p = 0.033 |
| Data as of June 30, 2026 Primary Analysis: Results at 48 Months from the Phase I/II Study |

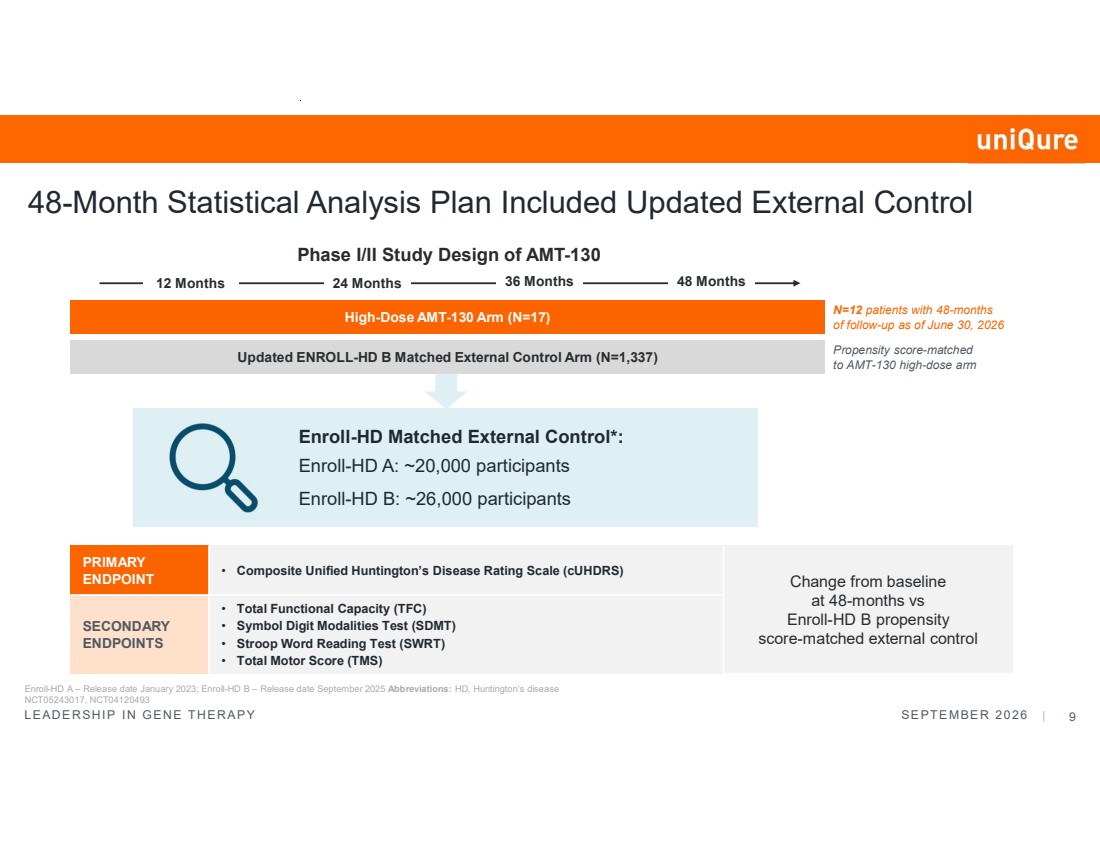
| LEADERSHIP IN GENE THERAPY SEPTEMBER 2026 | 9 Enroll-HD A – Release date January 2023; Enroll-HD B – Release date September 2025 Abbreviations: HD, Huntington’s disease NCT05243017, NCT04120493 48-Month Statistical Analysis Plan Included Updated External Control High-Dose AMT-130 Arm (N=17) Updated ENROLL-HD B Matched External Control Arm (N=1,337) 12 Months 24 Months 36 Months N=12 patients with 48-months of follow-up as of June 30, 2026 Propensity score-matched to AMT-130 high-dose arm Enroll-HD Matched External Control*: Enroll-HD A: ~20,000 participants Enroll-HD B: ~26,000 participants 48 Months Phase I/II Study Design of AMT-130 Change from baseline at 48-months vs Enroll-HD B propensity score-matched external control • Composite Unified Huntington’s Disease Rating Scale (cUHDRS) PRIMARY ENDPOINT • Total Functional Capacity (TFC) • Symbol Digit Modalities Test (SDMT) • Stroop Word Reading Test (SWRT) • Total Motor Score (TMS) SECONDARY ENDPOINTS |
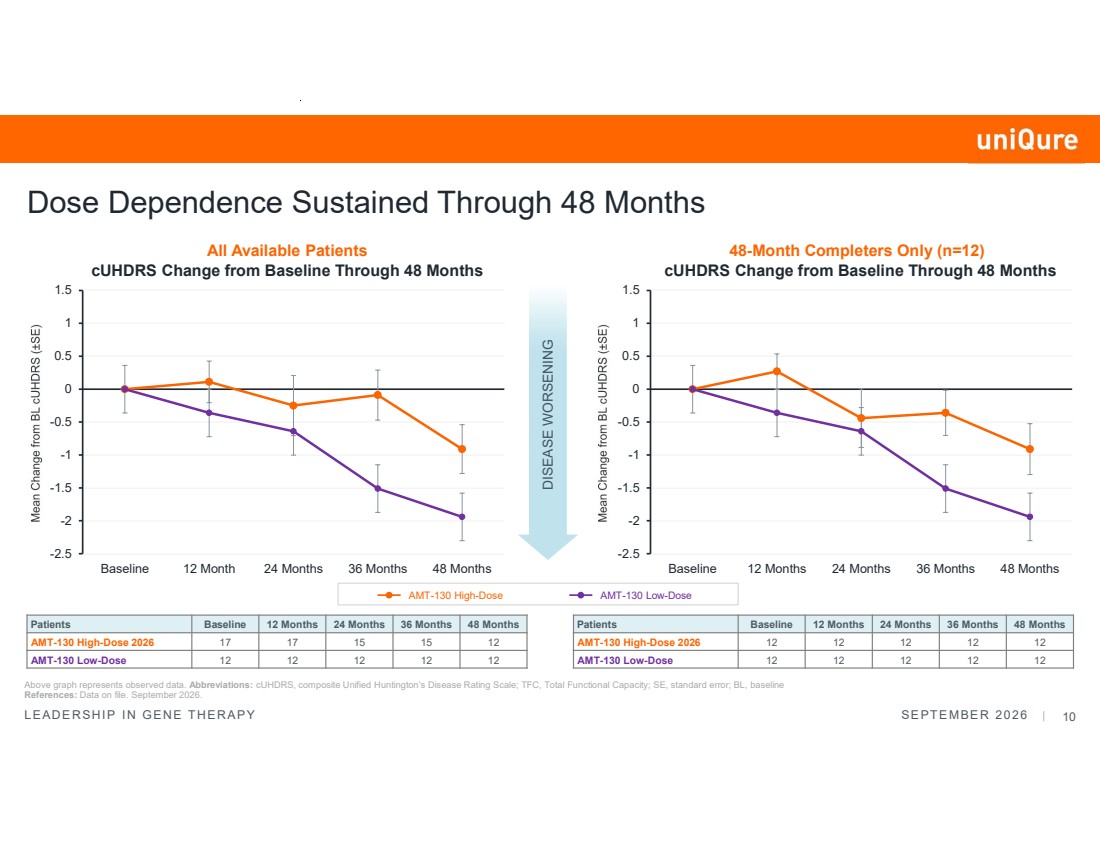
| LEADERSHIP IN GENE THERAPY SEPTEMBER 2026 | 10 Dose Dependence Sustained Through 48 Months Above graph represents observed data. Abbreviations: cUHDRS, composite Unified Huntington’s Disease Rating Scale; TFC, Total Functional Capacity; SE, standard error; BL, baseline References: Data on file. September 2026. cUHDRS Change from Baseline Through 48 Months -2.5 -2 -1.5 -1 -0.5 0 0.5 1 1.5 Baseline 12 Month 24 Months 36 Months 48 Months DISEASE WORSENING Patients Baseline 12 Months 24 Months 36 Months 48 Months AMT-130 High-Dose 2026 17 17 15 15 12 AMT-130 Low-Dose 12 12 12 12 12 AMT-130 High-Dose AMT-130 Low-Dose Patients Baseline 12 Months 24 Months 36 Months 48 Months AMT-130 High-Dose 2026 12 12 12 12 12 AMT-130 Low-Dose 12 12 12 12 12 cUHDRS Change from Baseline Through 48 Months -2.5 -2 -1.5 -1 -0.5 0 0.5 1 1.5 Baseline 12 Months 24 Months 36 Months 48 Months All Available Patients 48-Month Completers Only (n=12) |
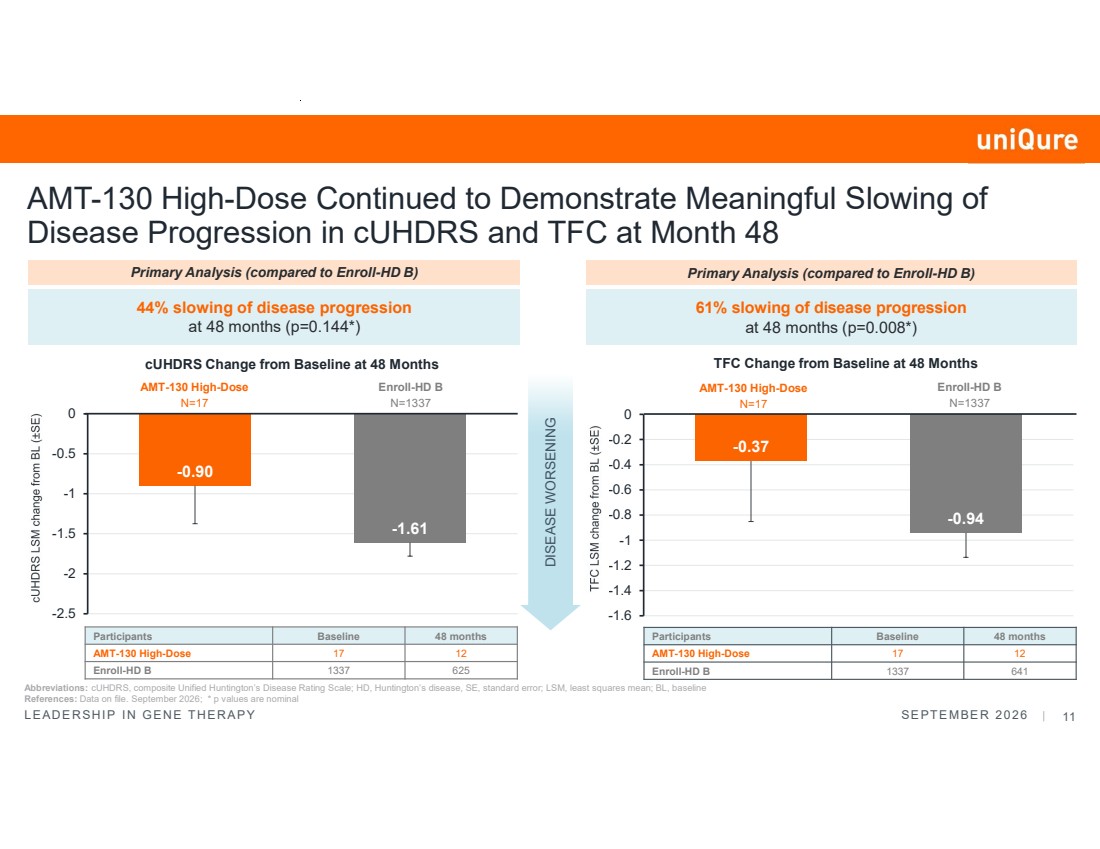
| LEADERSHIP IN GENE THERAPY SEPTEMBER 2026 | 11 AMT-130 High-Dose Continued to Demonstrate Meaningful Slowing of Disease Progression in cUHDRS and TFC at Month 48 DISEASE WORSENING Abbreviations: cUHDRS, composite Unified Huntington’s Disease Rating Scale; HD, Huntington’s disease, SE, standard error; LSM, least squares mean; BL, baseline References: Data on file. September 2026; * p values are nominal 44% slowing of disease progression at 48 months (p=0.144*) Participants Baseline 48 months AMT-130 High-Dose 17 12 Enroll-HD B 1337 625 -0.90 -1.61 -2.5 -2 -1.5 -1 -0.5 0 cUHDRS Change from Baseline at 48 Months AMT-130 High-Dose N=17 Primary Analysis (compared to Enroll-HD B) Enroll-HD B N=1337 -0.37 -0.94 -1.6 -1.4 -1.2 -1 -0.8 -0.6 -0.4 -0.2 0 61% slowing of disease progression at 48 months (p=0.008*) Participants Baseline 48 months AMT-130 High-Dose 17 12 Enroll-HD B 1337 641 TFC Change from Baseline at 48 Months Primary Analysis (compared to Enroll-HD B) AMT-130 High-Dose N=17 Enroll-HD B N=1337 |
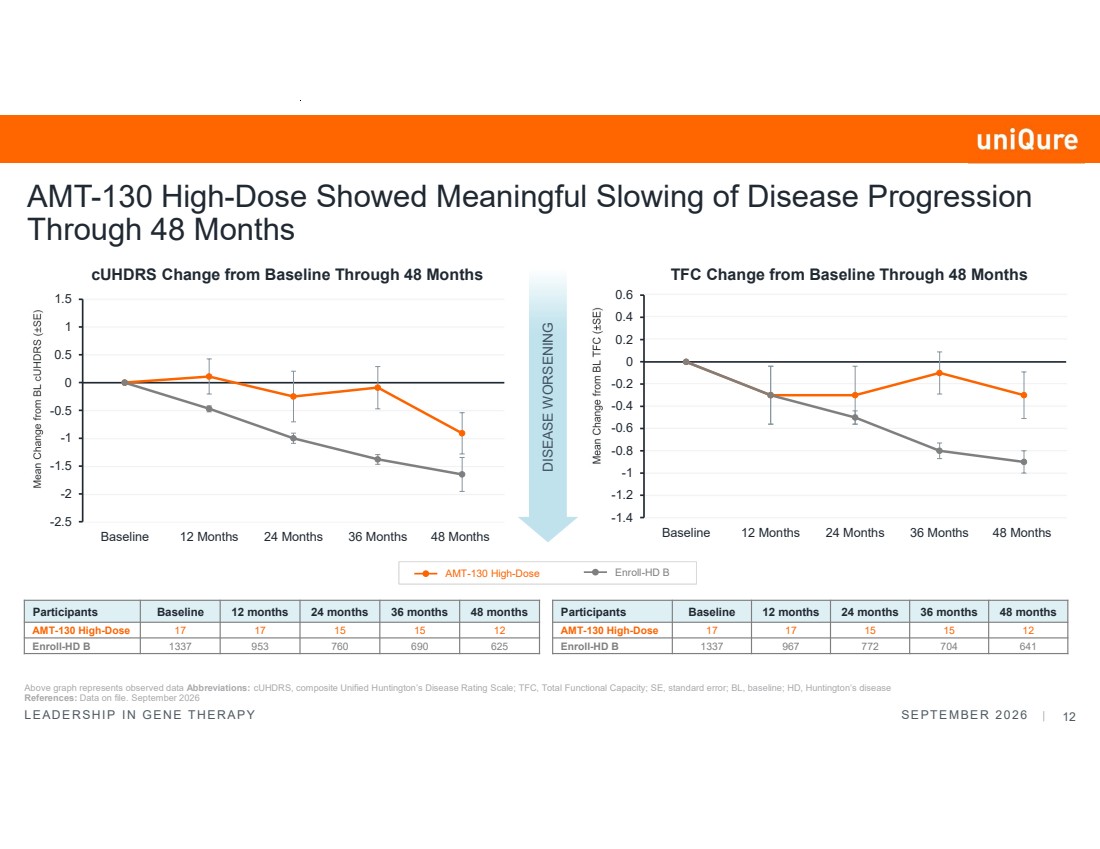
| LEADERSHIP IN GENE THERAPY SEPTEMBER 2026 | 12 Participants Baseline 12 months 24 months 36 months 48 months AMT-130 High-Dose 17 17 15 15 12 Enroll-HD B 1337 967 772 704 641 DISEASE WORSENING Participants Baseline 12 months 24 months 36 months 48 months AMT-130 High-Dose 17 17 15 15 12 Enroll-HD B 1337 953 760 690 625 AMT-130 High-Dose Showed Meaningful Slowing of Disease Progression Through 48 Months Above graph represents observed data Abbreviations: cUHDRS, composite Unified Huntington’s Disease Rating Scale; TFC, Total Functional Capacity; SE, standard error; BL, baseline; HD, Huntington’s disease References: Data on file. September 2026 cUHDRS Change from Baseline Through 48 Months TFC Change from Baseline Through 48 Months -2.5 -2 -1.5 -1 -0.5 0 0.5 1 1.5 Baseline 12 Months 24 Months 36 Months 48 Months -1.4 -1.2 -1 -0.8 -0.6 -0.4 -0.2 0 0.2 0.4 0.6 Baseline 12 Months 24 Months 36 Months 48 Months AMT-130 High-Dose Enroll-HD B |
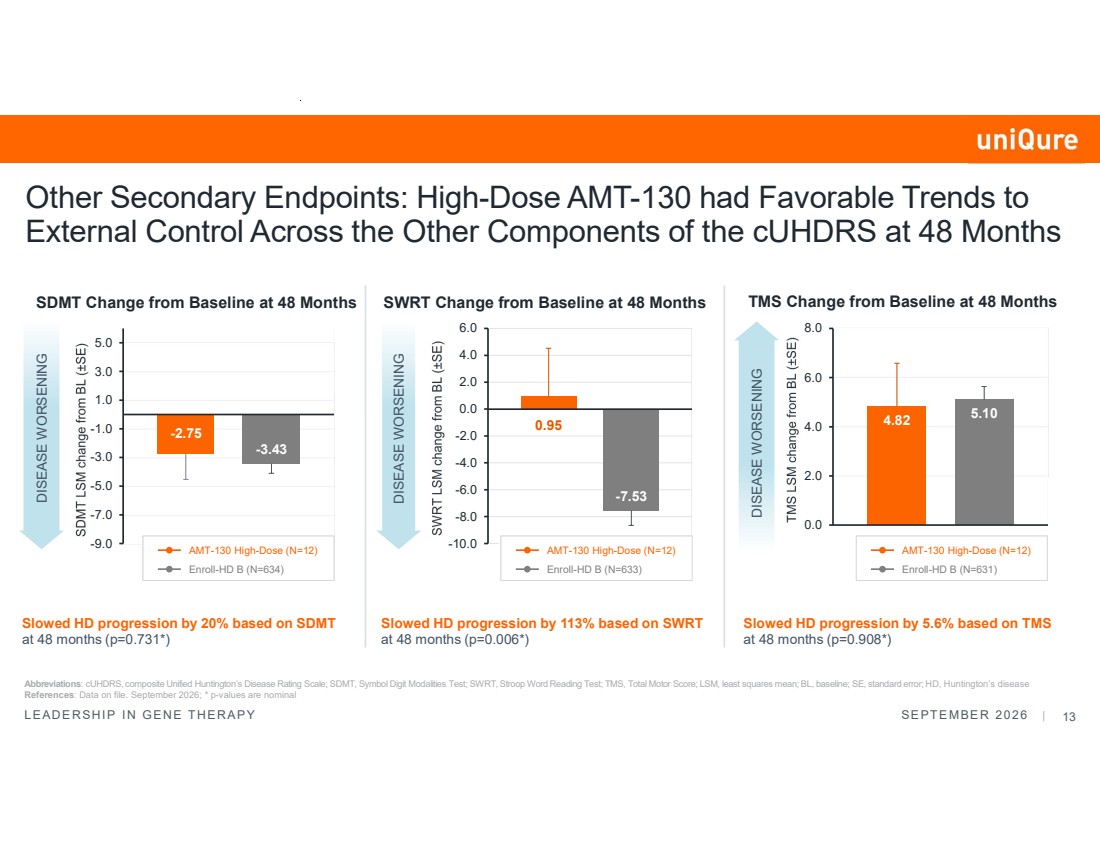
| LEADERSHIP IN GENE THERAPY SEPTEMBER 2026 | 13 Abbreviations: cUHDRS, composite Unified Huntington’s Disease Rating Scale; SDMT, Symbol Digit Modalities Test; SWRT, Stroop Word Reading Test; TMS, Total Motor Score; LSM, least squares mean; BL, baseline; SE, standard error; HD, Huntington’s disease References: Data on file. September 2026; * p-values are nominal Other Secondary Endpoints: High-Dose AMT-130 had Favorable Trends to External Control Across the Other Components of the cUHDRS at 48 Months DISEASE WORSENING DISEASE WORSENING DISEASE WORSENING Slowed HD progression by 20% based on SDMT at 48 months (p=0.731*) Slowed HD progression by 113% based on SWRT at 48 months (p=0.006*) Slowed HD progression by 5.6% based on TMS at 48 months (p=0.908*) SDMT Change from Baseline at 48 Months SWRT Change from Baseline at 48 Months TMS Change from Baseline at 48 Months -2.75 -3.43 -9.0 -7.0 -5.0 -3.0 -1.0 1.0 3.0 5.0 0.95 -7.53 -10.0 -8.0 -6.0 -4.0 -2.0 0.0 2.0 4.0 6.0 4.82 5.10 0.0 2.0 4.0 6.0 8.0 AMT-130 High-Dose (N=12) Enroll-HD B (N=634) AMT-130 High-Dose (N=12) Enroll-HD B (N=633) AMT-130 High-Dose (N=12) Enroll-HD B (N=631) |
| A Closer Look at Enroll-HD B External Control Matched to High-Dose |

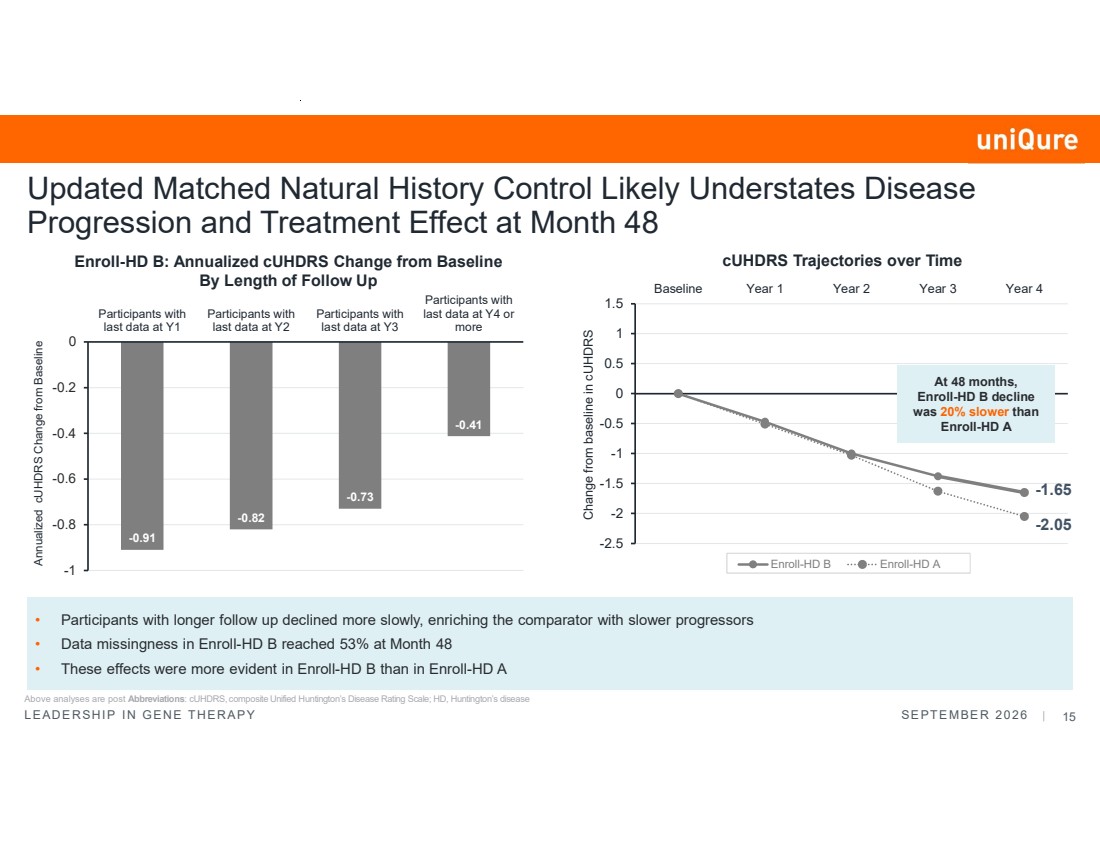
| LEADERSHIP IN GENE THERAPY SEPTEMBER 2026 | 15 Updated Matched Natural History Control Likely Understates Disease Progression and Treatment Effect at Month 48 Enroll-HD B: Annualized cUHDRS Change from Baseline By Length of Follow Up • Participants with longer follow up declined more slowly, enriching the comparator with slower progressors • Data missingness in Enroll-HD B reached 53% at Month 48 • These effects were more evident in Enroll-HD B than in Enroll-HD A -0.91 -0.82 -0.73 -0.41 -1 -0.8 -0.6 -0.4 -0.2 0 Participants with last data at Y1 Participants with last data at Y2 Participants with last data at Y3 Participants with last data at Y4 or more Annualized cUHDRS Change from Baseline cUHDRS Trajectories over Time Change from baseline in cUHDRS -2.5 -2 -1.5 -1 -0.5 0 0.5 1 1.5 Baseline Year 1 Year 2 Year 3 Year 4 Enroll-HD B Enroll-HD A At 48 months, Enroll-HD B decline was 20% slower than Enroll-HD A -1.65 -2.05 Above analyses are post Abbreviations: cUHDRS, composite Unified Huntington’s Disease Rating Scale; HD, Huntington’s disease |
| Post Hoc Analysis using Enroll-HD A at 48 Months from the Phase I/II Study Data as of June 30, 2026 |

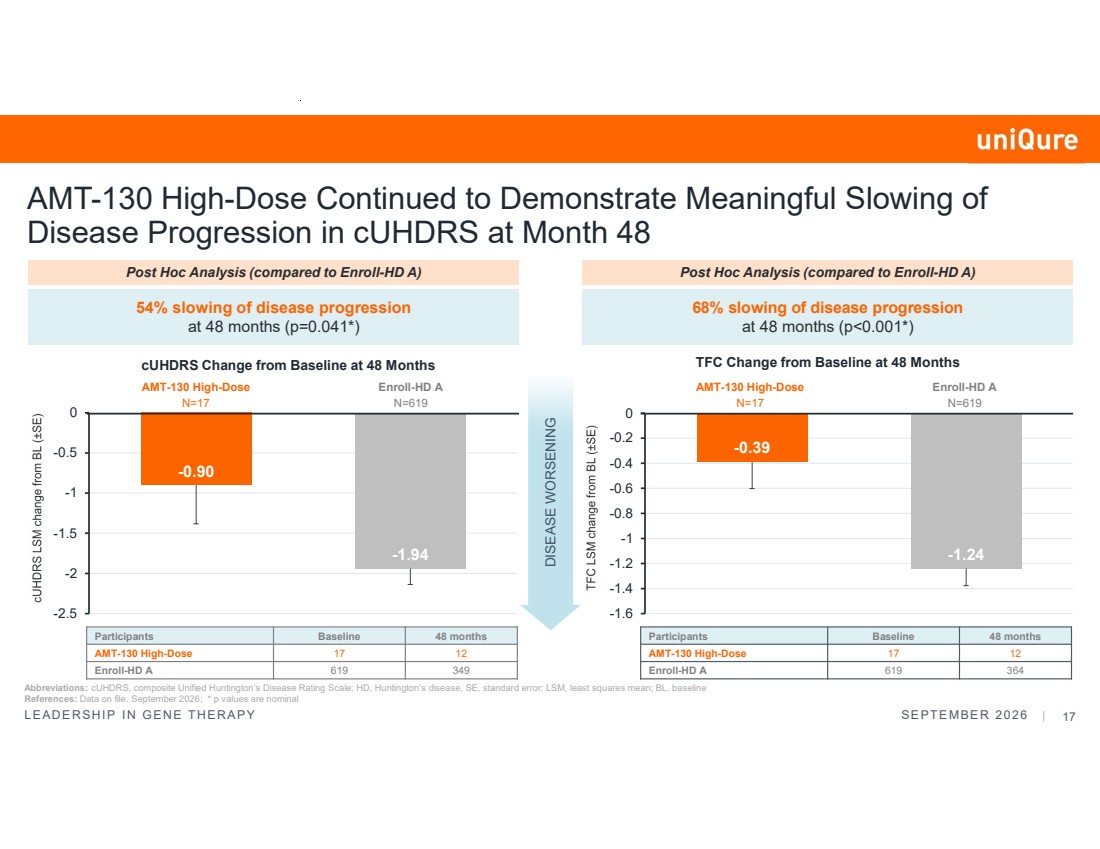
| LEADERSHIP IN GENE THERAPY SEPTEMBER 2026 | 17 -0.90 -1.94 -2.5 -2 -1.5 -1 -0.5 0 AMT-130 High-Dose Continued to Demonstrate Meaningful Slowing of Disease Progression in cUHDRS at Month 48 DISEASE WORSENING Abbreviations: cUHDRS, composite Unified Huntington’s Disease Rating Scale; HD, Huntington’s disease, SE, standard error; LSM, least squares mean; BL, baseline References: Data on file. September 2026; * p values are nominal 54% slowing of disease progression at 48 months (p=0.041*) Participants Baseline 48 months AMT-130 High-Dose 17 12 Enroll-HD A 619 349 cUHDRS Change from Baseline at 48 Months AMT-130 High-Dose N=17 Post Hoc Analysis (compared to Enroll-HD A) Enroll-HD A N=619 -0.39 -1.24 -1.6 -1.4 -1.2 -1 -0.8 -0.6 -0.4 -0.2 0 68% slowing of disease progression at 48 months (p<0.001*) Participants Baseline 48 months AMT-130 High-Dose 17 12 Enroll-HD A 619 364 TFC Change from Baseline at 48 Months Post Hoc Analysis (compared to Enroll-HD A) AMT-130 High-Dose N=17 Enroll-HD A N=619 |
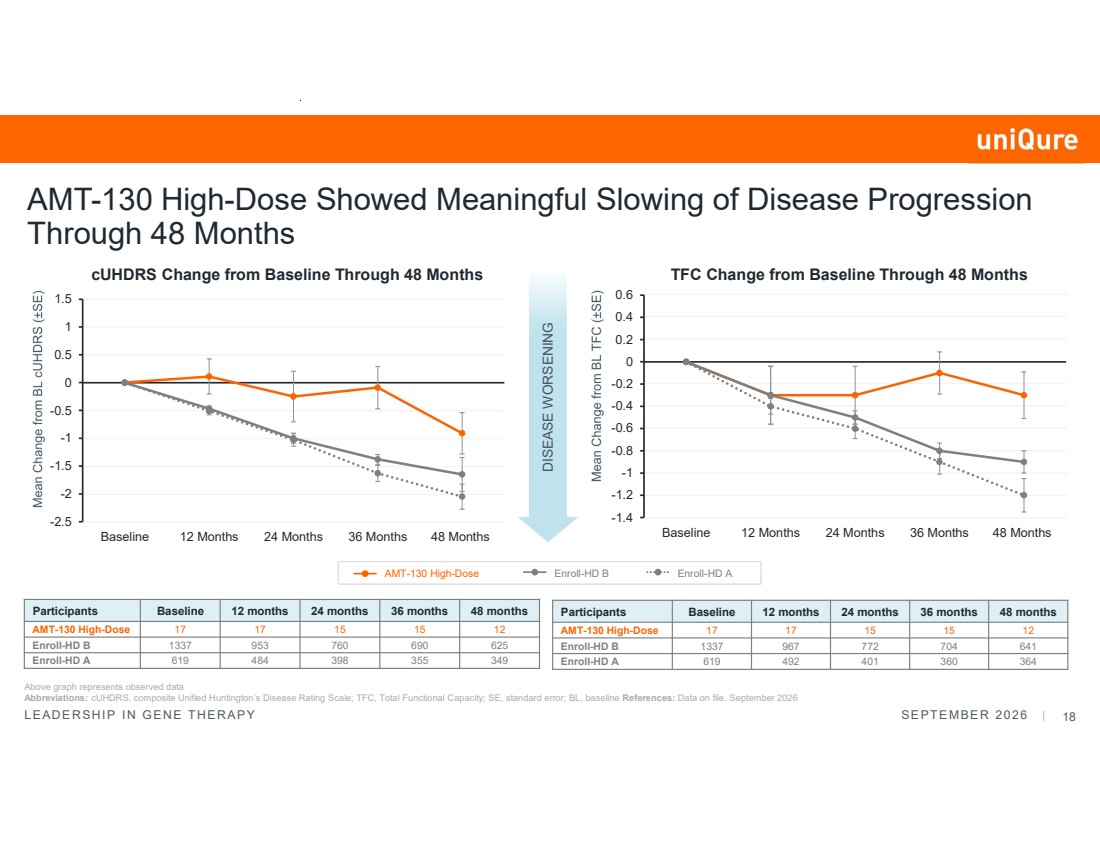
| LEADERSHIP IN GENE THERAPY SEPTEMBER 2026 | 18 DISEASE WORSENING Above graph represents observed data Abbreviations: cUHDRS, composite Unified Huntington’s Disease Rating Scale; TFC, Total Functional Capacity; SE, standard error; BL, baseline References: Data on file. September 2026 cUHDRS Change from Baseline Through 48 Months TFC Change from Baseline Through 48 Months -2.5 -2 -1.5 -1 -0.5 0 0.5 1 1.5 Baseline 12 Months 24 Months 36 Months 48 Months -1.4 -1.2 -1 -0.8 -0.6 -0.4 -0.2 0 0.2 0.4 0.6 Baseline 12 Months 24 Months 36 Months 48 Months AMT-130 High-Dose Enroll-HD B Enroll-HD A AMT-130 High-Dose Showed Meaningful Slowing of Disease Progression Through 48 Months Participants Baseline 12 months 24 months 36 months 48 months AMT-130 High-Dose 17 17 15 15 12 Enroll-HD B 1337 967 772 704 641 Enroll-HD A 619 492 401 360 364 Participants Baseline 12 months 24 months 36 months 48 months AMT-130 High-Dose 17 17 15 15 12 Enroll-HD B 1337 953 760 690 625 Enroll-HD A 619 484 398 355 349 |
| Results at 36 Months from the Phase I/II Study Data as of June 30, 2026 |

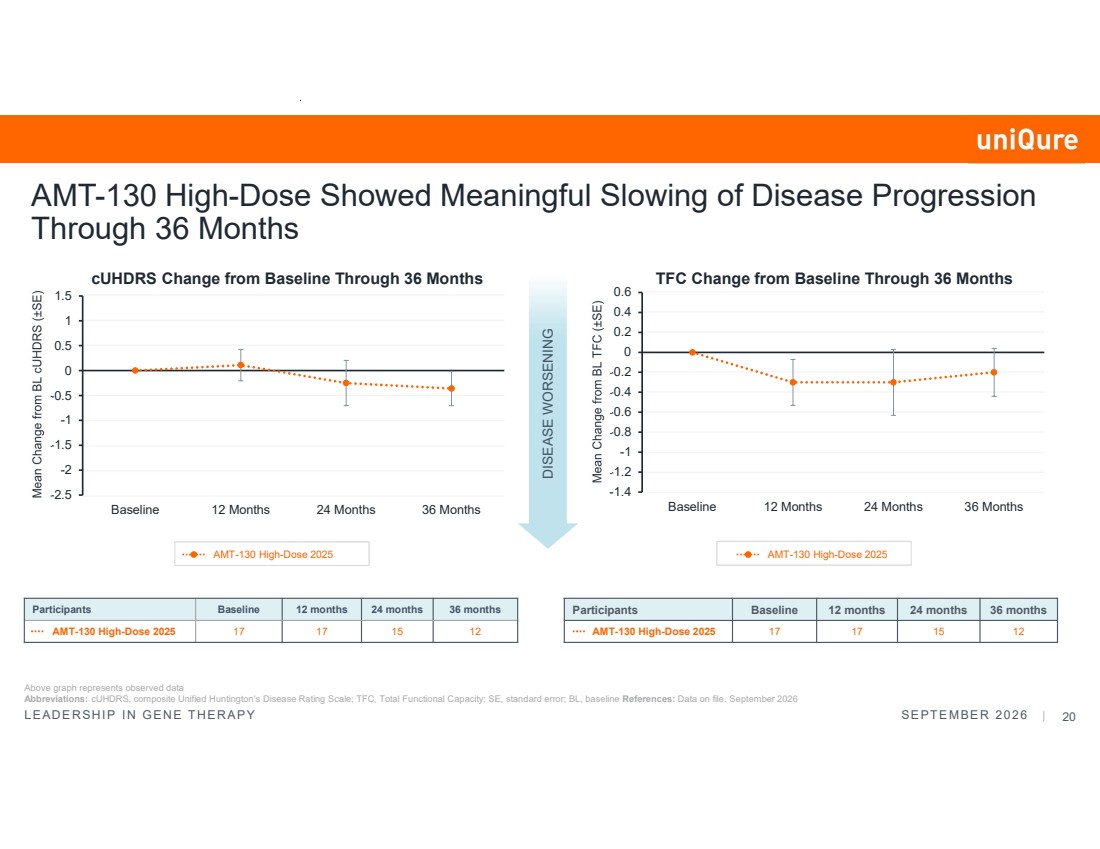
| LEADERSHIP IN GENE THERAPY SEPTEMBER 2026 | 20 -1.4 -1.2 -1 -0.8 -0.6 -0.4 -0.2 0 0.2 0.4 0.6 Baseline 12 Months 24 Months 36 Months -2.5 -2 -1.5 -1 -0.5 0 0.5 1 1.5 Baseline 12 Months 24 Months 36 Months Participants Baseline 12 months 24 months 36 months AMT-130 High-Dose 2025 17 17 15 12 AMT-130 High-Dose Showed Meaningful Slowing of Disease Progression Through 36 Months Above graph represents observed data Abbreviations: cUHDRS, composite Unified Huntington’s Disease Rating Scale; TFC, Total Functional Capacity; SE, standard error; BL, baseline References: Data on file. September 2026 DISEASE WORSENING Participants Baseline 12 months 24 months 36 months AMT-130 High-Dose 2025 17 17 15 12 cUHDRS Change from Baseline Through 36 Months TFC Change from Baseline Through 36 Months AMT-130 High-Dose 2025 AMT-130 High-Dose 2025 |
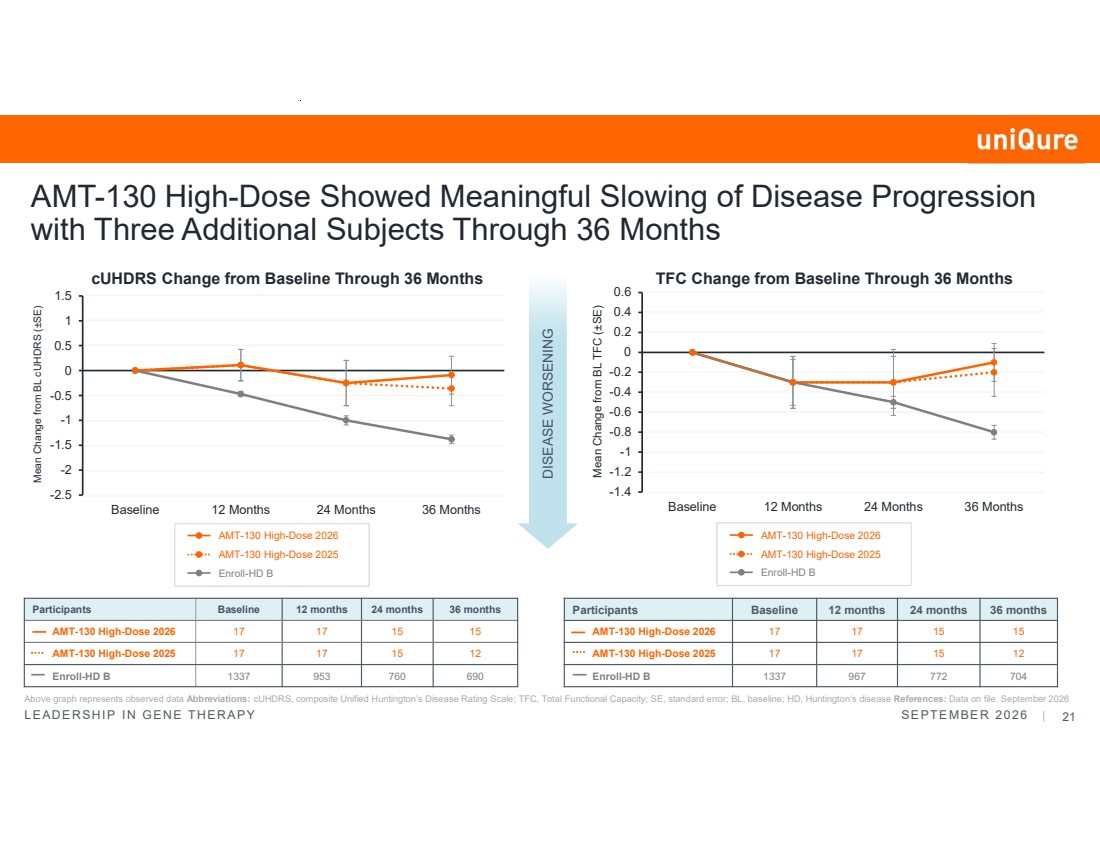
| LEADERSHIP IN GENE THERAPY SEPTEMBER 2026 | 21 -1.4 -1.2 -1 -0.8 -0.6 -0.4 -0.2 0 0.2 0.4 0.6 Baseline 12 Months 24 Months 36 Months -2.5 -2 -1.5 -1 -0.5 0 0.5 1 1.5 Baseline 12 Months 24 Months 36 Months Enroll-HD B Participants Baseline 12 months 24 months 36 months AMT-130 High-Dose 2026 17 17 15 15 AMT-130 High-Dose 2025 17 17 15 12 Enroll-HD B 1337 967 772 704 AMT-130 High-Dose Showed Meaningful Slowing of Disease Progression with Three Additional Subjects Through 36 Months Above graph represents observed data Abbreviations: cUHDRS, composite Unified Huntington’s Disease Rating Scale; TFC, Total Functional Capacity; SE, standard error; BL, baseline; HD, Huntington’s disease References: Data on file. September 2026 DISEASE WORSENING Participants Baseline 12 months 24 months 36 months AMT-130 High-Dose 2026 17 17 15 15 AMT-130 High-Dose 2025 17 17 15 12 Enroll-HD B 1337 953 760 690 Mean Change from BL cUHDRS (±SE) Mean Change from BL TFC (±SE) cUHDRS Change from Baseline Through 36 Months TFC Change from Baseline Through 36 Months AMT-130 High-Dose 2026 AMT-130 High-Dose 2025 Enroll-HD B AMT-130 High-Dose 2026 AMT-130 High-Dose 2025 |
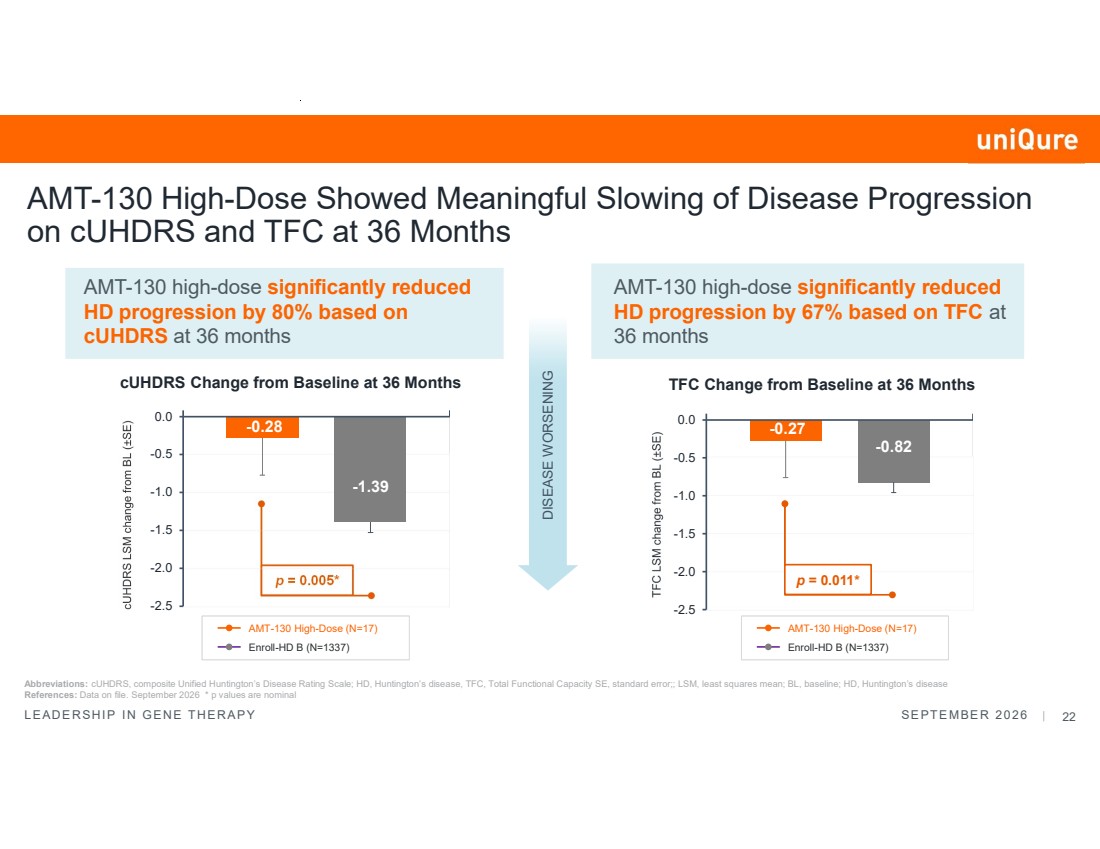
| LEADERSHIP IN GENE THERAPY SEPTEMBER 2026 | 22 Abbreviations: cUHDRS, composite Unified Huntington’s Disease Rating Scale; HD, Huntington’s disease, TFC, Total Functional Capacity SE, standard error;; LSM, least squares mean; BL, baseline; HD, Huntington’s disease References: Data on file. September 2026 * p values are nominal AMT-130 high-dose significantly reduced HD progression by 80% based on cUHDRS at 36 months cUHDRS Change from Baseline at 36 Months TFC Change from Baseline at 36 Months DISEASE WORSENING p = 0.005* AMT-130 High-Dose Showed Meaningful Slowing of Disease Progression on cUHDRS and TFC at 36 Months -0.27 -0.82 -2.5 -2.0 -1.5 -1.0 -0.5 0.0 p = 0.011* AMT-130 high-dose significantly reduced HD progression by 67% based on TFC at 36 months -0.28 -1.39 -2.5 -2.0 -1.5 -1.0 -0.5 0.0 AMT-130 High-Dose (N=17) Enroll-HD B (N=1337) AMT-130 High-Dose (N=17) Enroll-HD B (N=1337) |
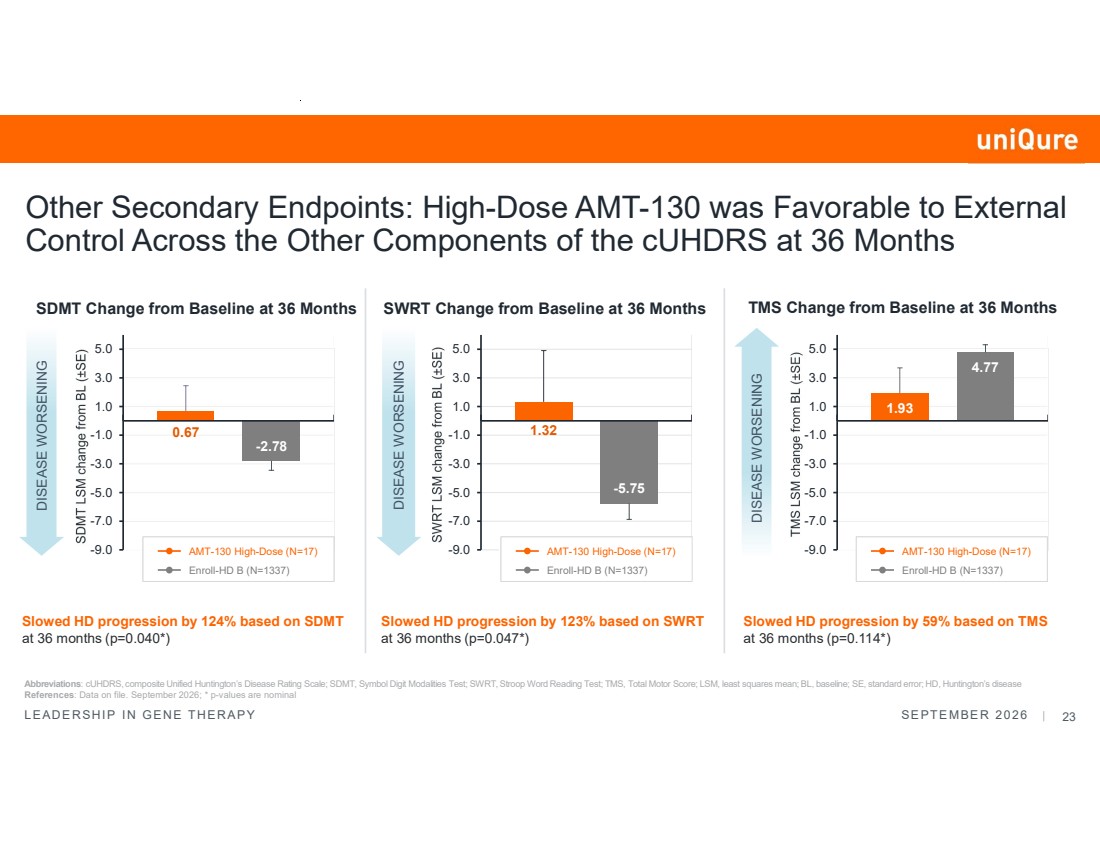
| LEADERSHIP IN GENE THERAPY SEPTEMBER 2026 | 23 Abbreviations: cUHDRS, composite Unified Huntington’s Disease Rating Scale; SDMT, Symbol Digit Modalities Test; SWRT, Stroop Word Reading Test; TMS, Total Motor Score; LSM, least squares mean; BL, baseline; SE, standard error; HD, Huntington’s disease References: Data on file. September 2026; * p-values are nominal Other Secondary Endpoints: High-Dose AMT-130 was Favorable to External Control Across the Other Components of the cUHDRS at 36 Months DISEASE WORSENING DISEASE WORSENING DISEASE WORSENING Slowed HD progression by 124% based on SDMT at 36 months (p=0.040*) Slowed HD progression by 123% based on SWRT at 36 months (p=0.047*) Slowed HD progression by 59% based on TMS at 36 months (p=0.114*) SDMT Change from Baseline at 36 Months SWRT Change from Baseline at 36 Months TMS Change from Baseline at 36 Months 0.67 -2.78 -9.0 -7.0 -5.0 -3.0 -1.0 1.0 3.0 5.0 1.32 -5.75 -9.0 -7.0 -5.0 -3.0 -1.0 1.0 3.0 5.0 1.93 4.77 -9.0 -7.0 -5.0 -3.0 -1.0 1.0 3.0 5.0 AMT-130 High-Dose (N=17) Enroll-HD B (N=1337) AMT-130 High-Dose (N=17) Enroll-HD B (N=1337) AMT-130 High-Dose (N=17) Enroll-HD B (N=1337) |
| Neurofilament Light Chain (NfL) |

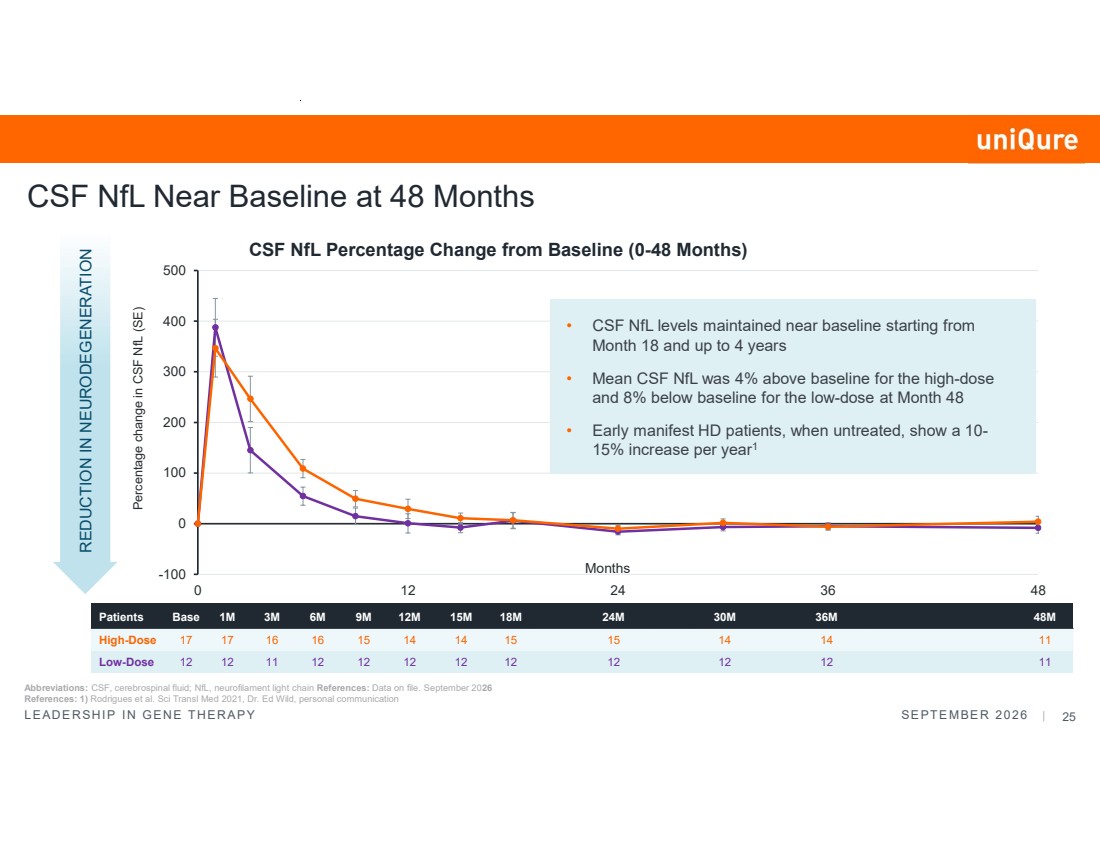
| LEADERSHIP IN GENE THERAPY SEPTEMBER 2026 | 25 -100 0 100 200 300 400 500 0 12 24 36 48 Percentage change in CSF NfL (SE) Months CSF NfL Percentage Change from Baseline (0-48 Months) Patients Base 1M 3M 6M 9M 12M 15M 18M 24M 30M 36M 48M High-Dose 17 17 16 16 15 14 14 15 15 14 14 11 Low-Dose 12 12 11 12 12 12 12 12 12 12 12 11 REDUCTION IN NEURODEGENERATION Abbreviations: CSF, cerebrospinal fluid; NfL, neurofilament light chain References: Data on file. September 2026 References: 1) Rodrigues et al. Sci Transl Med 2021, Dr. Ed Wild, personal communication CSF NfL Near Baseline at 48 Months • CSF NfL levels maintained near baseline starting from Month 18 and up to 4 years • Mean CSF NfL was 4% above baseline for the high-dose and 8% below baseline for the low-dose at Month 48 • Early manifest HD patients, when untreated, show a 10- 15% increase per year1 |
| Safety |

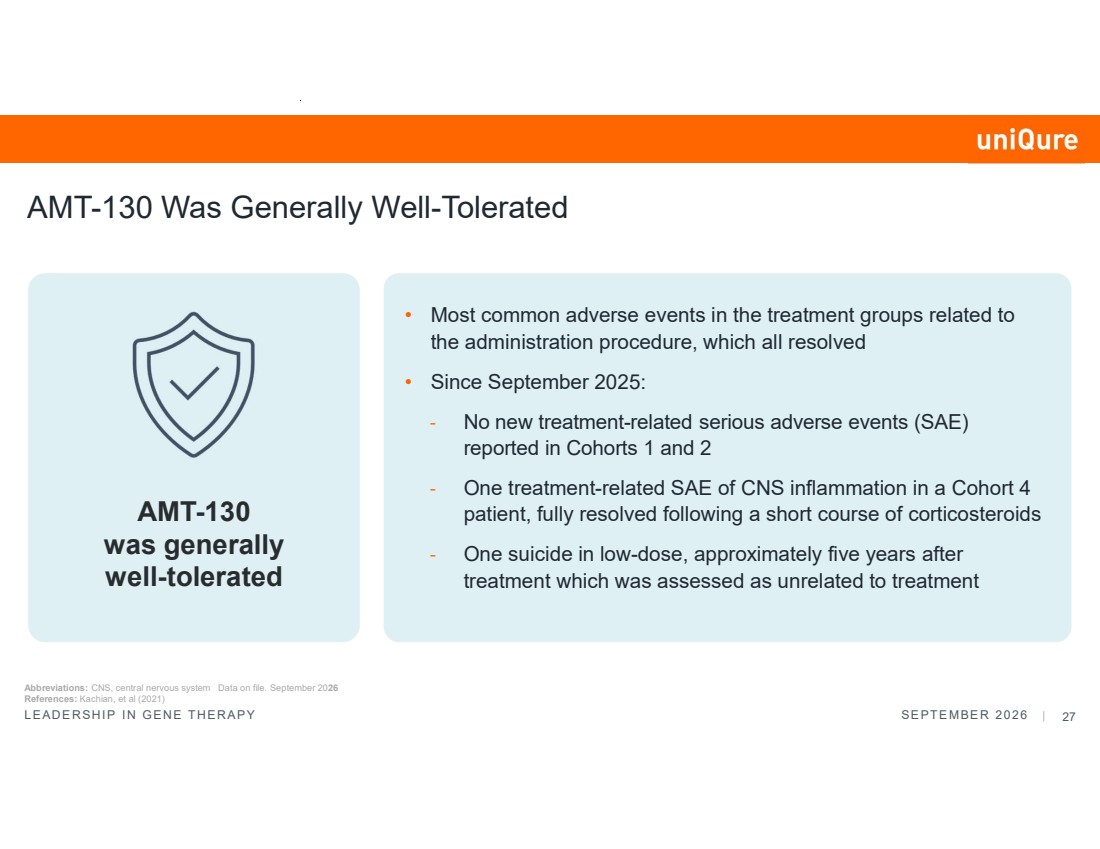
| LEADERSHIP IN GENE THERAPY SEPTEMBER 2026 | 27 AMT-130 Was Generally Well-Tolerated • Most common adverse events in the treatment groups related to the administration procedure, which all resolved • Since September 2025: - No new treatment-related serious adverse events (SAE) reported in Cohorts 1 and 2 - One treatment-related SAE of CNS inflammation in a Cohort 4 patient, fully resolved following a short course of corticosteroids - One suicide in low-dose, approximately five years after treatment which was assessed as unrelated to treatment AMT-130 was generally well-tolerated Abbreviations: CNS, central nervous system Data on file. September 2026 References: Kachian, et al (2021) |
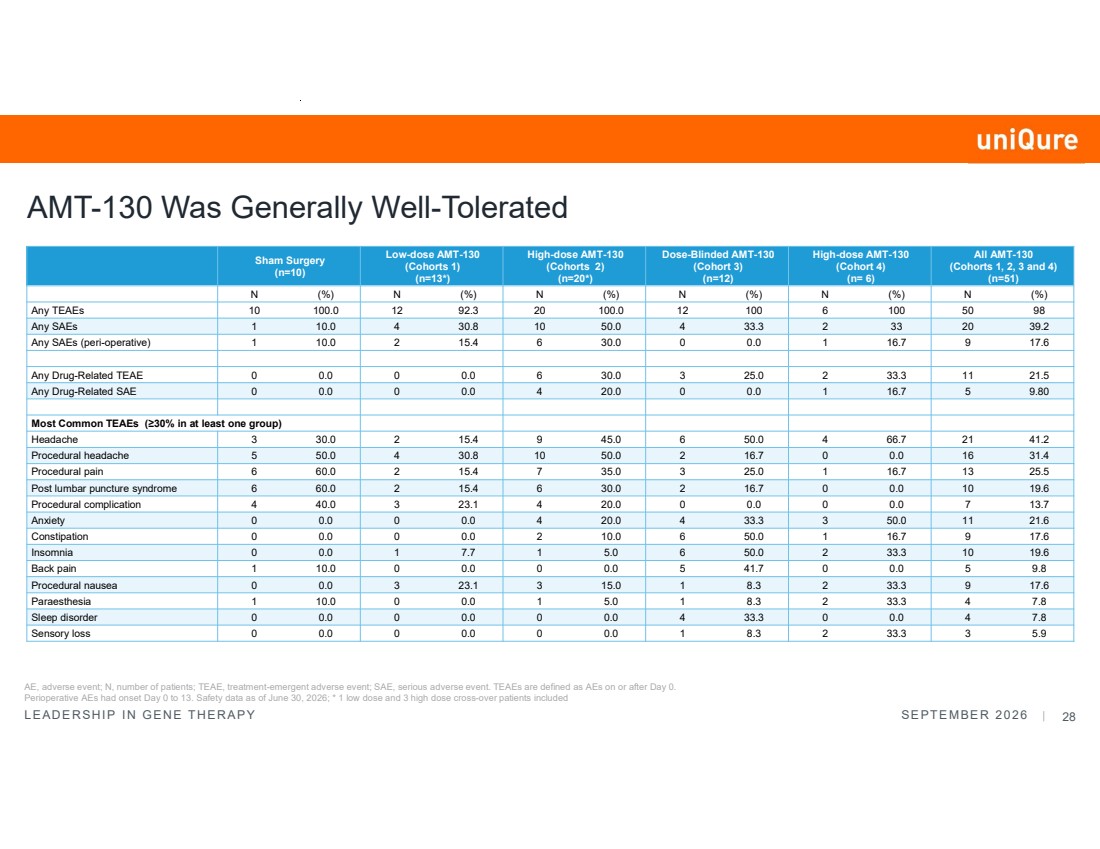
| LEADERSHIP IN GENE THERAPY SEPTEMBER 2026 | 28 All AMT-130 (Cohorts 1, 2, 3 and 4) (n=51) High-dose AMT-130 (Cohort 4) (n= 6) Dose-Blinded AMT-130 (Cohort 3) (n=12) High-dose AMT-130 (Cohorts 2) (n=20*) Low-dose AMT-130 (Cohorts 1) (n=13*) Sham Surgery (n=10) N (%) N (%) N (%) N (%) N (%) N (%) Any TEAEs 10 100.0 12 92.3 20 100.0 12 100 6 100 50 98 Any SAEs 1 10.0 4 30.8 10 50.0 4 33.3 2 33 20 39.2 Any SAEs (peri-operative) 1 10.0 2 15.4 6 30.0 0 0.0 1 16.7 9 17.6 Any Drug-Related TEAE 0 0.0 0 0.0 6 30.0 3 25.0 2 33.3 11 21.5 Any Drug-Related SAE 0 0.0 0 0.0 4 20.0 0 0.0 1 16.7 5 9.80 Most Common TEAEs (≥30% in at least one group) Headache 3 30.0 2 15.4 9 45.0 6 50.0 4 66.7 21 41.2 Procedural headache 5 50.0 4 30.8 10 50.0 2 16.7 0 0.0 16 31.4 Procedural pain 6 60.0 2 15.4 7 35.0 3 25.0 1 16.7 13 25.5 Post lumbar puncture syndrome 6 60.0 2 15.4 6 30.0 2 16.7 0 0.0 10 19.6 Procedural complication 4 40.0 3 23.1 4 20.0 0 0.0 0 0.0 7 13.7 Anxiety 0 0.0 0 0.0 4 20.0 4 33.3 3 50.0 11 21.6 Constipation 0 0.0 0 0.0 2 10.0 6 50.0 1 16.7 9 17.6 Insomnia 0 0.0 1 7.7 1 5.0 6 50.0 2 33.3 10 19.6 Back pain 1 10.0 0 0.0 0 0.0 5 41.7 0 0.0 5 9.8 Procedural nausea 0 0.0 3 23.1 3 15.0 1 8.3 2 33.3 9 17.6 Paraesthesia 1 10.0 0 0.0 1 5.0 1 8.3 2 33.3 4 7.8 Sleep disorder 0 0.0 0 0.0 0 0.0 4 33.3 0 0.0 4 7.8 Sensory loss 0 0.0 0 0.0 0 0.0 1 8.3 2 33.3 3 5.9 AE, adverse event; N, number of patients; TEAE, treatment-emergent adverse event; SAE, serious adverse event. TEAEs are defined as AEs on or after Day 0. Perioperative AEs had onset Day 0 to 13. Safety data as of June 30, 2026; * 1 low dose and 3 high dose cross-over patients included AMT-130 Was Generally Well-Tolerated |
| Summary |

| LEADERSHIP IN GENE THERAPY SEPTEMBER 2026 | 30 AMT-130 High-Dose Continued to Demonstrate Meaningful Slowing of Disease Progression Substantial treatment effect at 36 months in updated analysis of all 15 high-dose patients, strengthening the data at the 36- month timepoint 48-month analysis showed continued evidence of meaningful slowing of disease progression Dose-dependent response consistent with treatment effect Survivor bias and missingness in the updated external control likely understate disease progression and treatment effect at 48 months AMT-130 continues to be generally well-tolerated |
| Clinician’s Perspective Victor Sung, M.D. University of Alabama at Birmingham (UAB) |

| Research Analyst Questions |

| Ashley – Huntington’s Disease Community Advocate Closing Remarks Matt Kapusta Chief Executive Officer |

|