Exhibit 99.6
Highlights
The Report on Québec's Financial Situation - First Quarter of 2026-2027 reports the results as at June 30, 2026, and presents an assessment of the accounting balance for 2026-2027.
After three months, the accounting deficit stood at $467 million.
For fiscal 2026-2027, the forecast accounting deficit in this quarterly corresponds to the forecast accounting deficit presented in the Pre-election report on the state of Québec's public finances - August 2026.
▪ The financial framework and debt forecasts published in the August 17 pre-election report have been analyzed in detail by the Auditor General of Québec.
Accordingly, the accounting deficit for 2026-2027 is expected to stand at $5.2 billion (0.8% of GDP), an improvement of $1.1 billion since Budget 2026-2027. This deficit includes a $2.0 billion contingency reserve.
▪ Taking into account deposits of dedicated revenues of $2.5 billion in the Generations Fund, the budgetary deficit within the meaning of the Balanced Budget Act stands at $7.7 billion (1.2% of GDP).
Revenues are expected to reach $168.4 billion1 in 2026-2027, and expenditures, including the contingency reserve, are expected to stand at $173.6 billion.1
The net debt burden is expected to stand at 37.9% of GDP as at March 31, 2027.1
Moreover, as at June 30, 2026, borrowings contracted since April 1, 2026 amounted to $12.9 billion,2 or 55% of the forecast financing program.
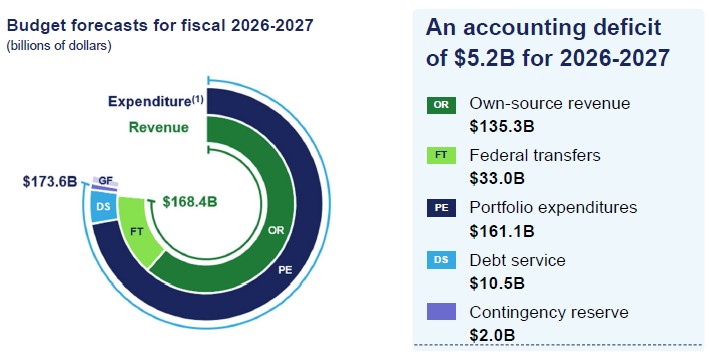


Note : These are the same data as those published in the Pre-election report on the state of Québec's public finances - August 2026.
(1) The contigency reserve, as well as deposits of dedicated revenues in the Generations Fund, are presented under expenditures for illustrative purposes.
(2) Including $2.5 billion deposits of dedicated revenues in the Generations Fund, the budgetary deficit within the meaning of the Balanced Budget Act stands at $7.7 billion (1.2% of GDP).
_______________________________________
1. These are the same data as those published in the Pre-election report on the state of Québec's public finances - August 2026.
2. Long-term borrowings contracted between April 1, 2026 and June 30, 2026.

Recent developments in the economic situation
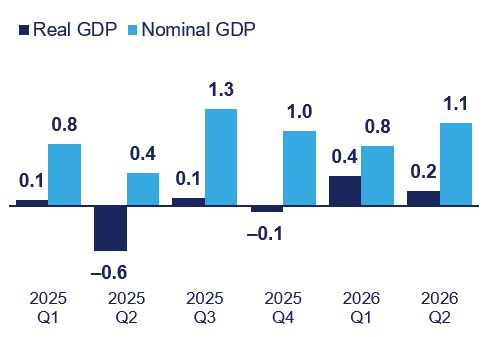
Economic activity in Québec slowed at the beginning of 2026. After a 0.6% increase in 2025, real GDP posted growth of 0.2% during the first two quarters of 2026, compared with the corresponding period in 2025.
Inflation rose, as measured by the change in the consumer price index (CPI). After averaging 2.4% in 2025, it stood at 3.1% for the first eight months of 2026.
This uptick was driven in part by rising energy prices amid geopolitical tensions in the Middle East.
Québec's nominal GDP increased by 3.9% in the first two quarters of 2026 compared to the same period in 2025, after growth of 4.7% in 2025.
The unemployment rate averaged 5.6% over the first eight months of 2026, unchanged from the level recorded for 2025 as a whole.
The unemployment rate in Québec remains below the Canadian average (6.6% on average since the beginning of 2026). Furthermore, the employment rate for people aged 15 to 64 in Québec has averaged 77.2% since the beginning of 2026, which is the highest in the country (74.5% Canada-wide).
Wages and salaries rose by 3.5% during the first two quarters of 2026 compared to the same period in 2025 (4.5% in 2025).
Household spending grew by 4.1% in the first two quarters of 2026 compared to the same period the previous year (4.6% in 2025). This trend reflects consumption remaining relatively robust despite some moderation.
For businesses, performance remains positive despite business environment marked by uncertainty. The net operating surplus of corporations rose by 6.9% in the first two quarters of 2026 compared to the same period in 2025, following a 3.5% increase in 2025.
| Change in economic activity in Québec (real and nominal GDP, quarterly percentage change) |
Consumer Price Index for Québec (annual percentage change) |
|
|
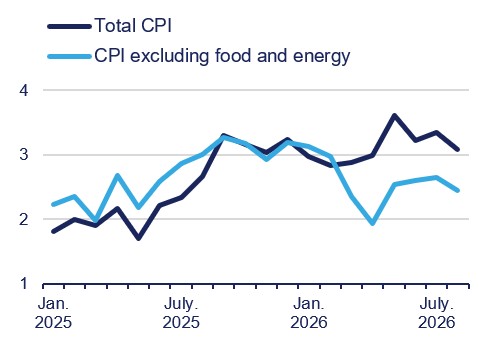 |
Note: The chart on the left shows the data from the economic accounts published on September 23, 2026 by the Institut de la statistique du Québec.
Summary of results and budgetary outlook for 2026-2027
▶ Results as at June 30, 2026
For the first three months of 2026-2027, the accounting deficit stood at $467 million. This is an improvement of $993 million compared to the same period the previous year.
The accounting deficit is attributable to the following factors:
▪ revenues of $41.8 billion, up 5.8% compared to the same period the previous year. This favourable change is largely attributable to own-source revenue, supported by growth in wages and salaries and household consumption. This reflects the resilience shown by the Québec economy since the start of the trade dispute with the United States;
▪ expenditures of $42.2 billion, up 3.2% compared to the same period the previous year. This increase is largely due to portfolio expenditures (3.4%), particularly in the Santé et Services sociaux and Emploi et Solidarité sociale portfolios.
Moreover, the budgetary deficit within the meaning of the Balanced Budget Act, that is, after deposits of dedicated revenues of $829 million in the Generations Fund, stood at $1.3 billion.
| Summary of results as at June 30, 2026 and budgetary outlook for 2026-2027 |
| (unaudited data, millions of dollars, year-over-year change) |
| Forecast for fiscal year 2026-2027 | |||||||||||||||||||||||||||
| March 2026 | Pre-election Report - | ||||||||||||||||||||||||||
| April to June | budget | August 2026 | |||||||||||||||||||||||||
| 2025- | 2026- | Change | Change | Level | Change | Adjustment | Level | Change | |||||||||||||||||||
| 2026 | 2027 | ($M) | (%) | ($M) | (%) | ($M) | ($M) | (%) | |||||||||||||||||||
| Own-source revenue | 32 023 | 34 048 | 2 025 | 6.3 | 134 361 | 3.4 | 982 | 135 343 | 3.6 | ||||||||||||||||||
| Federal transfers | 7 438 | 7 711 | 273 | 3.7 | 32 131 | 5.1 | 915 | 33 046 | 10.9 | ||||||||||||||||||
| Total revenue | 39 461 | 41 759 | 2 298 | 5.8 | 166 492 | 3.7 | 1 897 | 168 389 | 5.0 | ||||||||||||||||||
| Portfolio expenditures | −38 339 | −39 633 | −1 294 | 3.4 | −160 489 | 1.6 | −592 | −161 081 | 3.4 | ||||||||||||||||||
| Debt service | −2 582 | −2 593 | −11 | 0.4 | −10 268 | 1.1 | −248 | −10 516 | 3.6 | ||||||||||||||||||
| Total expenditure | −40 921 | −42 226 | −1 305 | 3.2 | −170 757 | 1.5 | −840 | −171 597 | 3.4 | ||||||||||||||||||
| Contingency reserve | - | - | - | - | −2 000 | - | - | −2 000 | - | ||||||||||||||||||
| ACCOUNTING | |||||||||||||||||||||||||||
| SURPLUS (DEFICIT) | −1 460 | −467 | 993 | - | −6 265 | - | 1 057 | −5 208 | - | ||||||||||||||||||
| Deposits of dedicated | |||||||||||||||||||||||||||
| revenues in the | |||||||||||||||||||||||||||
| Generations Fund | −497 | −829 | −332 | - | −2 347 | - | −135 | −2 482 | - | ||||||||||||||||||
| BUDGETARY | |||||||||||||||||||||||||||
| BALANCE(1) | −1 957 | −1 296 | 661 | - | −8 612 | - | 922 | −7 690 | - | ||||||||||||||||||
(1) Budgetary balance within the meaning of the Balanced Budget Act.

 |
Budgetary outlook for 2026-2027 |
The forecast accounting balance for 2026‑2027 in this quarterly report corresponds to the forecast accounting balance presented in the Pre-election report on the state of Québec’s public finances – August 2026, standing at $5.2 billion (0.8% of GDP).
▪ This deficit includes a $2.0 billion contingency reserve.
This represents an improvement of $1.1 billion between Budget 2026 2027 and the Pre-election report on the state of Québec’s public finances – August 2026.
▪ Revenues have been adjusted upward by $1.9 billion. They now stand at $168.4 billion with annual growth of 5.0%.
▪ Own-source revenue has been adjusted upward by $982 million, primarily due to the recurrence of the more favourable results observed in 2025‑2026, as well as the upward adjustment of wages and salaries and household consumption in 2026.
▪ Federal transfers have been adjusted upward by $915 million. Between Budget 2026-2027 and the pre-election report, the federal government announced funding for the provinces to support childcare services and boost the housing supply. Québec has also entered into agreements with the federal government as part of the implementation of the Canada Public Transit Fund and the Build Communities Strong Fund.3
▪ Expenditures have been adjusted upward by $840 million. They now stand at $171.6 billion with annual growth of 3.4%.
▪ Portfolio expenditures have been adjusted upward by $592 million, reflecting initiatives announced between Budget 2026-2027 and the pre-election report, as well as an increase in expenditures funded by the federal government in public transit and water infrastructure projects for municipalities.
▪ Debt service has been adjusted upward by $248 million due to higher-than-expected interest rates, which have resulted in losses on the disposal of assets as part of the Sinking Fund's investment activities related to government borrowings.
Moreover, the budgetary deficit within the meaning of the Balanced Budget Act, that is, after deposits of dedicated revenues of $2.5 billion in the Generations Fund, stands at $7.7 billion (1.2% of GDP).
| |
Additional information |
The net debt burden stood at 37.9% of GDP as at March 31, 2027, according to the net debt burden forecast in the Pre-election report on the state of Québec's public finances - August 2026.
▪ This represents a decrease of 1.0 percentage point between Budget 2026-2027 and the pre-election report. The decrease is mainly attributable to the downward adjustment of the debt level at the beginning of the fiscal year (partially the result of a smaller deficit in 2025-2026) and a deficit for 2026-2027 that was lower than what was forecast in Budget 2026-2027.
| ______________________________ | ||
|
3. These revenues have no impact on the accounting balance, since an offsetting entry is recorded under expenditures. |

Revenue
Own-source revenue
| |
Results as at June 30, 2026 |
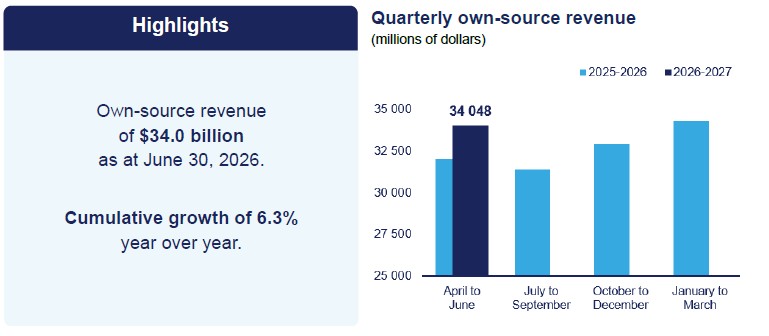
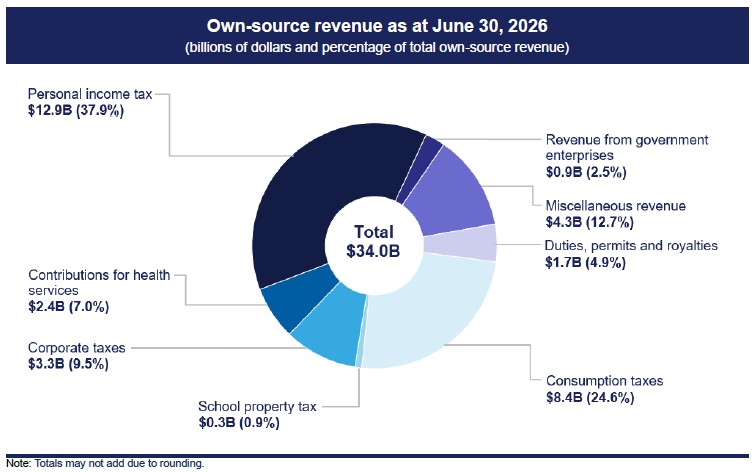
As at June 30, that is, for the first three months of 2026-2027, own-source revenue totalled $34.0 billion. This represents an increase of $2.0 billion (6.3%) compared to the same period the previous year.
Tax revenue increased by $1.4 billion (5.6%) to $27.2 billion, due in particular to increases of:
▪ $811 million (6.7%) in personal income tax and $89 million (3.9%) in contributions for health services, attributable mainly to the growth in wages and salaries, which stood at 3.5% in the first two quarters of 2026;
▪ $14 million (4.6%) in school property tax, reflecting changes in local needs funding, taking into account the projected growth in student enrolment and the rising cost of goods and services funded by school property tax;
▪ $533 million (6.8%) in consumption taxes, attributable in part to household consumption, which grew by 4.1% in the first two quarters of 2026.
Other own-source revenue increased by $648 million (12.1%) to $6.0 billion, due to increases of:
▪ $131 million (8.5%) in duties, permits and royalties, mainly attributable to revenue from mineral resources, reflecting the prices of certain metals and minerals;
▪ $517 million (13.6%) in miscellaneous revenue, in part due to higher investment income from the Generations Fund.
Revenue from government enterprises decreased by $72 million (−7.8%) to $854 million. This decline is primarily attributable to a decrease in earnings from Hydro-Québec, due in particular to an increase in electricity purchases resulting from the prudent management of reservoirs.
|
Own-source revenue |
| April to June | Forecast for fiscal year 2026-2027 | ||||||||||||||||||||||||||
| March 2026 budget |
Pre-election Report - August 2026(1) |
||||||||||||||||||||||||||
| 2025- 2026 |
2026- 2027 |
Change ($M) |
Change (%) |
Level ($M) |
Change (%) |
Adjustment ($M) |
Level ($M) |
Change (%) |
|||||||||||||||||||
| Income and property taxes |
|||||||||||||||||||||||||||
| - Personal income tax | 12 079 | 12 890 | 811 | 6.7 | 50 800 | 3.7 | 142 | 50 942 | 4.0 | ||||||||||||||||||
| - Contributions for health services |
2 285 | 2 374 | 89 | 3.9 | 9 412 | 2.6 | 126 | 9 538 | 2.5 | ||||||||||||||||||
| - Corporate taxes | 3 249 | 3 251 | 2 | 0.1 | 14 527 | 3.0 | 171 | 14 698 | 0.7 | ||||||||||||||||||
| - School property tax | 304 | 318 | 14 | 4.6 | 1 311 | 4.5 | −10 | 1 301 | 4.7 | ||||||||||||||||||
| Consumption taxes | 7 830 | 8 363 | 533 | 6.8 | 30 008 | 2.2 | 674 | 30 682 | 3.5 | ||||||||||||||||||
| Tax revenue | 25 747 | 27 196 | 1 449 | 5.6 | 106 058 | 3.1 | 1 103 | 107 161 | 3.3 | ||||||||||||||||||
| Duties, permits and royalties | 1 550 | 1 681 | 131 | 8.5 | 6 542 | 3.7 | −58 | 6 484 | −3.3 | ||||||||||||||||||
| Miscellaneous revenue | 3 800 | 4 317 | 517 | 13.6 | 15 908 | 3.3 | −118 | 15 790 | 5.8 | ||||||||||||||||||
| Other own-source revenue | 5 350 | 5 998 | 648 | 12.1 | 22 450 | 3.4 | −176 | 22 274 | 3.0 | ||||||||||||||||||
| Total own-source revenue excluding revenue from government enterprises |
31 097 | 33 194 | 2 097 | 6.7 | 128 508 | 3.1 | 927 | 129 435 | 3.2 | ||||||||||||||||||
| Revenue from government enterprises |
926 | 854 | −72 | −7.8 | 5 853 | 9.5 | 55 | 5 908 | 12.7 | ||||||||||||||||||
| TOTAL | 32 023 | 34 048 | 2 025 | 6.3 | 134 361 | 3.4 | 982 | 135 343 | 3.6 | ||||||||||||||||||
|
(1) Adjustments to own-source revenue reflect initiatives announced between Budget 2026-2027 and the pre-election report. At the time the pre-election report was published, the adjustments were presented before incorporating the impact of these initiatives. |
|||||||||||||||||||||||||||
| |
Budgetary outlook for 2026-2027 |
Own-source revenue is expected to stand at $135.3 billion in 2026-2027 (annual growth of 3.6%). This represents an upward adjustment of $982 million between Budget 2026-2027 and the Pre-election report on the state of Québec's public finances - August 2026.
Tax revenue has been adjusted upward by $1.1 billion for 2026-2027. This is mainly attributable to upward adjustments of:
▪ $142 million to personal income tax, reflecting the upward adjustment of 0.3 percentage points to wages and salaries in 2026;
▪ $126 million to contributions for health services, attributable in particular to the recurrence of stronger-than-expected results recorded at the end of 2025-2026;
▪ $171 million to corporate taxes, attributable in part to the recurrence of some of the stronger-than-expected results recorded in 2025-2026, offset in part by the downward adjustment of 0.3 percentage points to total exports in 2026;
▪ $674 million to consumption taxes, attributable in particular to the recurrence of stronger-than-expected results in 2025-2026 and the upward adjustment of 0.8 percentage points to household consumption in 2026.
Other own-source revenue has been adjusted downward by $176 million for 2026-2027. This is mainly attributable to downward adjustments of:
▪ $58 million to duties, permits and royalties, reflecting a downward adjustment of motor vehicle-related revenue, due in particular to the introduction of a temporary rebate on passenger vehicle registration fees;
▪ $118 million to miscellaneous revenue, attributable to the downward adjustment of interest income related to the main tax laws.
Revenue from government enterprises has been adjusted upward by $55 million, largely due to increased revenues from Hydro-Québec, which mainly reflects lower costs associated with the Churchill Falls contract given the postponement of the anticipated date for signing the agreement.

|
Composition of own-source revenue excluding revenue from government enterprises Own-source revenue excluding revenue from government enterprises consists mainly of tax revenue, that is, personal income tax, contributions for health services, corporate taxes, school property tax and consumption taxes. ▪ Changes in own-source revenue generally reflect changes in economic activity in Québec and modifications in the tax system. Own-source revenue excluding revenue from government enterprises also includes other sources of revenue: ▪ duties, permits and royalties, in particular revenue from the carbon market; ▪ miscellaneous revenue, such as investment revenue, services rendered, as well as penalties, fines and recoveries. |
|
Composition of revenue from government enterprises Government enterprises consist of public corporations that play a commercial role, have managerial autonomy and are financially self-sufficient. ▪ Revenue from government enterprises corresponds in large part to the net earnings of these enterprises. |
Revenue
Federal transfers
| |
Results as at June 30, 2026 |
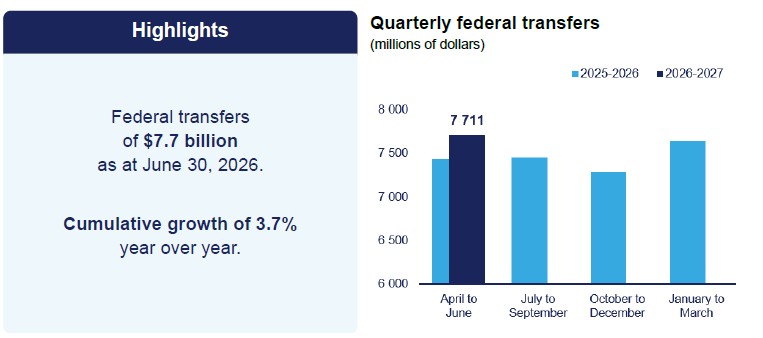
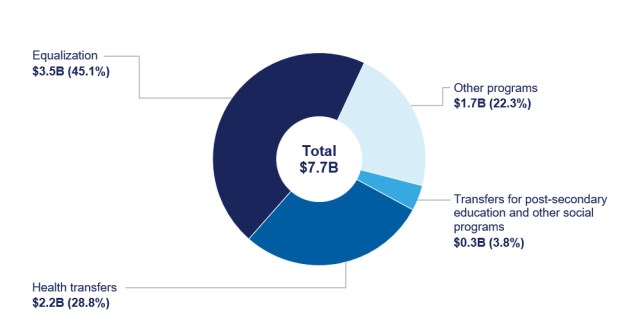
As at June 30, that is, for the first three months of 2026-2027, federal transfers totalled $7.7 billion. This represents an increase of $273 million (3.7%) compared to the same period last year. The increase is attributable in particular to higher equalization revenue resulting from growth in the Canada-wide equalization envelope in line with trends in Canada's nominal GDP, funding provided to the provinces to boost the housing supply, and the pace of federally funded infrastructure projects.4
| Federal transfers (unaudited data, millions of dollars, year-over-year change) |
|||||||||||||||||||||||||||
| April to June | Forecast for fiscal year 2026-2027 | ||||||||||||||||||||||||||
| March 2026 budget |
Pre-election Report - August 2026 |
||||||||||||||||||||||||||
| 2025- 2026 |
2026- 2027 |
Change ($M) |
Change (%) |
Level ($M) |
Change (%) |
Adjustment ($M) |
Level ($M) |
Change (%) |
|||||||||||||||||||
| Equalization | 3 392 | 3 477 | 85 | 2.5 | 13 907 | 2.5 | - | 13 907 | 2.5 | ||||||||||||||||||
| Health transfers | 2 235 | 2 223 | −12 | −0.5 | 9 265 | 6.7 | −158 | 9 107 | 7.9 | ||||||||||||||||||
| Transfers for post-secondary education and other social programs |
333 | 290 | −43 | −12.9 | 1 392 | 5.9 | −100 | 1 292 | 10.6 | ||||||||||||||||||
| Other programs | 1 478 | 1 721 | 243 | 16.4 | 7 567 | 7.9 | 1 173 | 8 740 | 31.9 | ||||||||||||||||||
| TOTAL | 7 438 | 7 711 | 273 | 3.7 | 32 131 | 5.1 | 915 | 33 046 | 10.9 | ||||||||||||||||||

|
4. Adjustments to federal transfer revenue based on the pace of infrastructure projects that receive federal funding have no impact on the budgetary balance, since an offsetting entry is recorded under expenditures. |
|
▶ Budgetary outlook for 2026-2027 Revenue from federal transfers is expected to reach $33.0 billion in 2026-2027, representing an upward adjustment of $915 million between Budget 2026-2027 and the Pre-election report on the state of Québec's public finances - August 2026. This increase is attributable in particular to funding provided to the provinces to support childcare services and boost the housing supply. Québec has also entered into agreements with the federal government as part of the implementation of the Canada Public Transit Fund and the Build Communities Strong Fund.5 |
|
Composition of federal transfers Revenue from federal transfers consists of federal government revenues paid to Québec under the Federal‑Provincial Fiscal Arrangements Act, in addition to revenues from other programs under bilateral agreements. These revenues mainly come from:
|
| Federal transfers as at June 30, 2026 (billions of dollars and percentage of total revenue from federal transfers) |
 |
| Note: Totals may not add due to rounding. |
|
5. These revenues have no impact on the accounting balance, since an offsetting entry is recorded under expenditures. |
Expenditure
Portfolio expenditures and debt service
▶ Results as at June 30, 2026
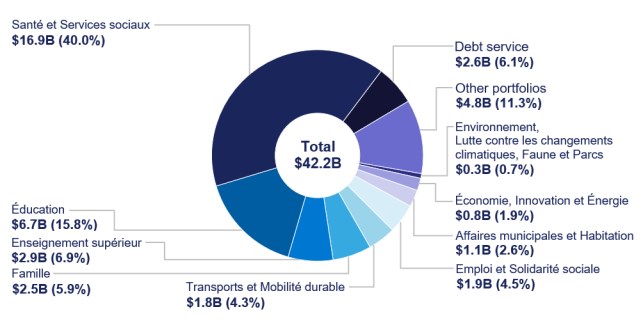
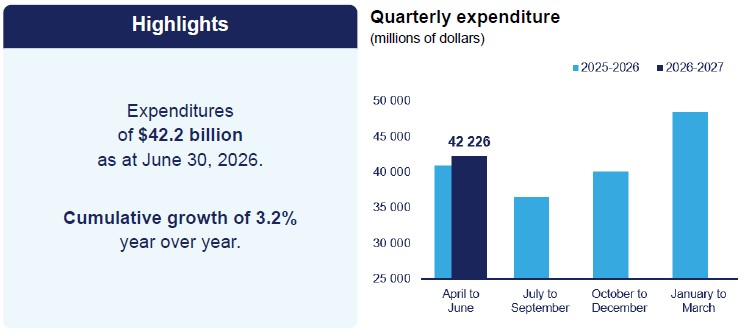
As at June 30, that is, for the first three months of 2026-2027, expenditures totalled $42.2 billion. This represents an increase of $1.3 billion (3.2%) compared to the same period last year.
Portfolio expenditures increased by $1.3 billion (3.4%) to $39.6 billion. The growth observed as at June 30 is attributable to expected changes in the costs of delivering public services, as well as the following factors:
▪ expenditures in the Santé et Services sociaux portfolio increased by $611 million (3.8%) to $16.9 billion. This increase is due in particular to changes in compensation;
▪ expenditures in the Éducation portfolio increased by $81 million (1.2%) to $6.7 billion. This increase is due in particular to expenses by school service centres;
▪ expenditures in the Enseignement supérieur portfolio increased by $46 million (1.6%) to $2.9 billion. This increase is due in particular to changes in the remuneration of higher education staff;
▪ expenditures in the Famille portfolio increased by $85 million (3.6%) to $2.5 billion. This increase is mainly due to the creation of new subsidized daycare spots;
▪ expenditures in the Transports et Mobilité durable portfolio decreased by $232 million (−11.4%) to $1.8 billion. This decrease is due in particular to lower expenditures in 2026-2027 as a result of advance payments in 2025-2026 for certain public transit subsidies;
▪ expenditures in the Emploi et Solidarité sociale portfolio increased by $342 million (22.5%) to $1.9 billion. This increase is due in particular to the new tax credit to offset the rising cost of living.
▪ expenditures in the Affaires municipales et Habitation portfolio increased by $113 million (11.7%) to $1.1 billion. This increase is due in part to higher subsidies for affordable housing;
▪ expenditures in the Économie, Innovation et Énergie portfolio decreased by $92 million (−9.8%) to $845 billion. This decrease is due in particular to the reduction of the tax credit for investment and innovation;
▪ expenditures in other portfolios increased by $331 million (7.4%) to $4.8 billion.
Debt service expenditures increased by $11 million (0.4%) to $2.6 billion. This increase is mainly attributable to a higher debt level.
| Expenditure | |||||||||||
| (unaudited data, millions of dollars, year-over-year change) | |||||||||||
| April to June | Forecast for fiscal year 2026-2027 | ||||||||||
| March 2026 budget |
Pre-election Report - August 2026(1) |
||||||||||
| 2025- | 2026- | Change | Change | Level | Change | Adjustment | Level | Change | |||
| 2026 | 2027 | ($M) | (%) | ($M) | (%) | ($M) | ($M) | (%) | |||
| Santé et Services sociaux | 16 290 | 16 901 | 611 | 3.8 | 68 708 | 4.1 | 1 283 | 69 991 | 6.1 | ||
| Éducation | 6 583 | 6 664 | 81 | 1.2 | 24 075 | 2.4 | 336 | 24 411 | 3.7 | ||
| Enseignement supérieur | 2 884 | 2 930 | 46 | 1.6 | 11 749 | 3.7 | 98 | 11 847 | 5.9 | ||
| Famille | 2 389 | 2 474 | 85 | 3.6 | 10 009 | 2.8 | 58 | 10 067 | 4.5 | ||
| Transports et Mobilité durable |
2 032 | 1 800 | −232 | −11.4 | 7 739 | −16.4 | 130 | 7 869 | −14.2 | ||
| Emploi et Solidarité sociale | 1 517 | 1 859 | 342 | 22.5 | 5 952 | 2.6 | 406 | 6 358 | 9.4 | ||
| Affaires municipales et Habitation |
963 | 1 076 | 113 | 11.7 | 5 608 | −2.6 | 255 | 5 863 | 11.6 | ||
| Économie, Innovation et Énergie |
937 | 845 | −92 | −9.8 | 4 511 | −7.3 | −5 | 4 506 | 3.2 | ||
| Environnement, Lutte contre les changements climatiques, Faune et Parcs | 263 | 272 | 9 | 3.4 | 2 004 | 0.8 | −25 | 1 979 | 9.8 | ||
| Other portfolios | 4 481 | 4 812 | 331 | 7.4 | 20 134 | 1.9 | −1 944 | 18 190 | −4.6 | ||
| Portfolio expenditures | 38 339 | 39 633 | 1 294 | 3.4 | 160 489 | 1.6 | 592 | 161 081 | 3.4 | ||
| Debt service | 2 582 | 2 593 | 11 | 0.4 | 10 268 | 1.1 | 248 | 10 516 | 3.6 | ||
| TOTAL | 40 921 | 42 226 | 1 305 | 3.2 | 170 757 | 1.5 | 840 | 171 597 | 3.4 | ||
| (1) Adjustments to expenditures in the pre-election report are mainly attributable to initiatives announced since the Budget, expenditure adjustments related to new agreements with the federal government, and reclassifications between portfolios made by the Ministère des Finances in response to the Auditor General of Québec's assurance engagement. | |||||||||||
▶ Budgetary outlook for 2026-2027
Expenditures are expected to stand at $171.6 billion in 2026-2027 (annual growth of 3.4%). This represents an upward adjustment of $840 million between Budget 2026-2027 and the Pre-election report on the state of Québec's public finances - August 2026.
▪ Portfolio expenditures have been adjusted upward by $592 million and now total $161.1 million (annual growth of 3.4%). This adjustment reflects initiatives announced since Budget 2026-2027 and increase in expenditures funded by the federal government in public transit and water infrastructure projects for municipalities;
▪ Debt service has been adjusted upward by $248 million and now totals $10.5 billion (annual growth of 3.6%). This adjustment is due to higher-than-expected interest rates, which have resulted in losses on the disposal of assets in connection with the investment activities of the Sinking Fund for Government Borrowing.

Composition of portfolio expenditures
Portfolio expenditures represent all resources allocated to the delivery of public services. The government implements programs that are administered directly by government entities such as departments and organizations.
▪ Programs and entities under a minister’s responsibility constitute a portfolio.
Portfolio expenditures are made up of:
▪ program expenditures;
▪ expenditures incurred notably by special funds, non-budget-funded bodies, as well as bodies in the health and social services, education and higher education networks;
▪ tax-funded expenditures, which consist of refundable tax credits and the expenditure for doubtful accounts associated with tax revenues.
The composition and expenditure level of each portfolio vary according to the nature of the function and programs under the minister’s responsibility. As a result, some portfolios will incur more expenses than others, depending on their mission.
In 2026-2027, there are 25 ministerial portfolios. For the first three months, the three main ones, Santé et
Composition of debt service
Debt service represents the sum of interest on direct debt and interest on other employee future benefits liabilities in the public and parapublic sectors.
It depends in particular on the size of the debt and interest rates on financial markets. Each year, the government must devote a portion of its revenues to making interest payments.
| Expenditure as at June 30, 2026 (billions of dollars and percentage of total expenditure) |
|
|
| Note: Totals may not add due to rounding. |

Debt
As at March 31, 2027, net debt is expected to stand at $253.5 billion, which is $6.1 billion lower than forecast in Budget 2026-2027. The net debt burden is expected to stand at 37.9% of GDP as at March 31, 2027, 1.0 percentage point lower than forecast in Budget 2026-2027. This downward adjustment to net debt is mainly attributable to the downward adjustment of the debt level at the start of the fiscal year (partially the result of a smaller deficit in 2025-2026) and a deficit for 2026-2027 that was lower than what was forecast in Budget 2026-2027.
| Net debt as at March 31, 2027 |
| (millions of dollars, unless otherwise indicated) |
| March 2026 | Pre-election | ||||||||
| Report - | |||||||||
| budget | Adjustment | August 2026 | |||||||
| NET DEBT, BEGINNING OF YEAR | 250 289 | −4 382 (1 | ) | 245 907 | |||||
| % OF GDP | 38.8 | −0.7 | 38.1 | ||||||
| Accounting deficit (surplus) | 6 265 | −1 057 | 5 208 | ||||||
| Capital investments | 8 790 | −234 | 8 556 | ||||||
| Accounting adjustment(2) | −5 835 | −380 | −6 215 | ||||||
| Total change | 9 220 | −1 671 | 7 549 | ||||||
| NET DEBT, END OF YEAR | 259 509 | −6 053 | 253 456 | ||||||
| % OF GDP | 38.9 | −1.0 | 37.9 |
(1) Net debt at the beginning of the fiscal year is lower than projected in Budget 2026-2027, partially as a result of a smaller deficit and lower government capital investments in 2025-2026.
(2) The accounting adjustment reflects the adoption of the new accounting standard for the presentation of financial statements. Under this new standard, non-financial liabilities corresponding to deferred revenue are no longer included in net debt as of April 1, 2026. This change reduces the net debt-to-GDP ratio by 0.9 percentage point for 2026-2027.
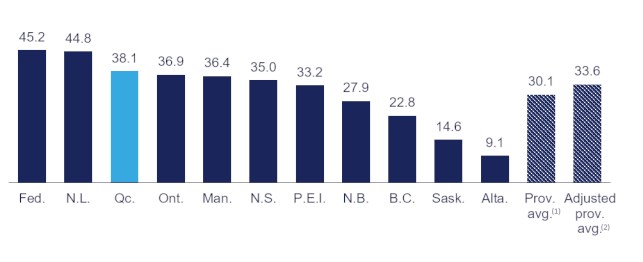
As at March 31, 2026, Québec's net debt burden stood at 38.1% of GDP, compared with the provincial average of 30.1%.6
|
Net debt of governments in Canada as at March 31, 2026 (percentage of GDP) |
|
|
(1) GDP weighted average.
(2) GDP weighted average excluding the least indebted province, Alberta, and the most indebted province, Newfoundland and Labrador.
Sources: Publics accounts and Government budget documents.
________________________________
6. Provincial average as at March 31, 2025 was 28.9%.
Net financial surpluses or requirements
For the period April to June 2026, net financial requirements amount to $10.0 billion and are attributable to:
▪ the $467 million accounting deficit resulting from the difference between government revenue and expenditure;
▪ the $253 million financial requirements for investments, loans and advances, stemming in particular from an increase in the consolidation value of government enterprises;7
▪ the $569 million financial requirements related to government capital assets, mainly due to investments of $2.0 billion, notably for the renovation and construction of schools, healthcare facilities and road infrastructure. These investments are partially offset by amortization expenses of $1.4 billion;7
▪ the $1.1 billion financial requirements related to the liability for retirement plans and other employee future benefits, resulting in particular from the payment of $1.9 billion in government employee benefits, offset by the $1.0 billion net plan costs;⁷
▪ the $5.0 billion financial requirements relating to other accounts,8 resulting in particular from disbursements associated with expenditures recorded at the end of 2025-2026;
▪ the $2.7 billion financial requirements generated by deposits in the Generations Fund.
| Net financial surpluses or requirements |
| (unaudited data, millions of dollars) |
| April to June | ||||||
| 2025-2026 | 2026-2027 | |||||
| ACCOUNTING SURPLUS (DEFICIT) | −1 460 | −467 | ||||
| Non-budgetary transactions | ||||||
| Investments, loans and advances | −352 | −253 | ||||
| Capital investments | −827 | −569 | ||||
| Retirement plans and other employee future benefits | −979 | −1 103 | ||||
| Other accounts(1) | −5 505 | −4 963 | ||||
| Deposits in the Generations Fund | −497 | −2 661 | ||||
| Total non-budgetary transactions | −8 160 | −9 549 | ||||
| NET FINANCIAL SURPLUSES (REQUIREMENTS) | −9 620 | −10 016 | ||||
(1) The financial surpluses or requirements pertaining to other accounts can vary significantly from one month to the next, in particular according to the time when the government collects or disburses funds related to its activities. For example, when the last day of the month is not a business day, QST remittances are collected at the beginning of the following month, such that the equivalent of two months' remittances can be collected in a given month.
__________________________________
7. These items, which are included in the government's budgetary surplus (deficit), are eliminated in non-budgetary transactions because they have no effect on cash flow.
8. The financial surpluses or requirements pertaining to other accounts can vary significantly from one month to the next, in particular according to the time when the government collects or disburses funds related to its activities. For example, when the last day of the month is not a business day, QST remittances are collected at the beginning of the following month, such that the equivalent of two months' remittances can be collected in a given month.

Composition of net financial surpluses or requirements
The government’s revenues and expenditures are established on the accrual basis of accounting.
▪ Revenues are recognized when earned and expenses when incurred, regardless of when receipts and disbursements occur.
Net financial surpluses or requirements, on the other hand, consist of the difference between receipts and disbursements resulting from government activities. To meet its net financial requirements, the government uses a variety of financing sources, including cash and borrowings.
The various items for net financial requirements represent net receipts and disbursements generated by the government’s loans, interests in its enterprises, and fixed assets, by retirement plans and other employee future benefits, as well as by other accounts.
▪ This last item includes the payment of accounts payable and the collection of accounts receivable. Deposits in the Generations Fund also result in financial requirements.
Financing program and borrowings
The financing program consists of long-term borrowings contracted during the fiscal year. Among other things, the program is used to repay maturing borrowings and meet net financial requirements. The latter mainly comprise the budgetary deficit as well as the government's capital investments.
As at June 30, 2026, borrowings contracted since April 1, 2026 amounted to $12.9 billion,9 or 55% of the forecast financing program.
▪ Conventional bonds in Canadian dollars were the main borrowing instrument used.
▪ Borrowings on foreign markets accounted for 54% of borrowings contracted in 2026-2027.
| Summary of long-term borrowings contracted in 2026‑2027 | ||||||
| Currencies | $million | % | ||||
| CANADIAN DOLLAR | ||||||
| Conventional bonds | 5 802 | 45.0 | ||||
| Savings products issued by Épargne Placements Québec | 162 | 1.3 | ||||
| Immigrant investors(1) | 1 | — | ||||
| Subtotal | 5 965 | 46.3 | ||||
| OTHER CURRENCIES | ||||||
| U.S. dollar | 4 135 | 32.1 | ||||
| Euro | 2 796 | 21.7 | ||||
| Subtotal | 6 931 | 53.7 | ||||
| TOTAL | 12 895 | 100.0 | ||||
Notes : Long-term borrowings issued between April 1, 2026 and June 30, 2026.
Totals may not add due to rounding.
An updated list of new borrowings for the 2026-2027 fiscal year is available.
(1) These borrowings come from sums advanced by immigrant investors. These sums are loaned to the government through Investissement Québec.
| Summary of long-term borrowing repayments in 2026‑2027 | |||
| Currencies | $million | ||
| CANADIAN DOLLAR | |||
| Conventional bonds | 2 346 | ||
| Other | 160 | ||
| Subtotal | 2 506 | ||
| OTHER CURRENCIES | |||
| U.S dollar | 2 849 | ||
| Other | 561 | ||
| Subtotal | 3 410 | ||
| TOTAL | 5 916 | ||
Note: Long-term borrowing repayments from April 1, 2026 to June 30, 2026.
____________________________________
9. Long-term borrowings contracted between April 1, 2026 and June 30, 2026.

Appendix 1: Results and budgetary outlook for 2026-2027
| Results and budgetary outlook for 2026-2027 - Budgetary balance | |||||||||||||||||||||||
| (level and adjustment in millions of dollars, percentage change compared to the same period last year) | |||||||||||||||||||||||
| April to June | Forecast for fiscal year 2026-2027 | ||||||||||||||||||||||
| March 2026 budget |
Pre-election Report - August 2026 |
||||||||||||||||||||||
| Level ($M) |
Change (%) |
Level ($M) |
Change (%) |
Adjustment ($M) |
Level ($M) |
Change (%) |
|||||||||||||||||
| Revenue | |||||||||||||||||||||||
| Own-source revenue | 34 048 | 6.3 | 134 361 | 3.4 | 982 | 135 343 | 3.6 | ||||||||||||||||
| Federal transfers | 7 711 | 3.7 | 32 131 | 5.1 | 915 | 33 046 | 10.9 | ||||||||||||||||
| Subtotal - Revenue | 41 759 | 5.8 | 166 492 | 3.7 | 1 897 | 168 389 | 5.0 | ||||||||||||||||
| Expenditure | |||||||||||||||||||||||
| Portfolio expenditures | −39 633 | 3.4 | −160 489 | 1.6 | −592 | −161 081 | 3.4 | ||||||||||||||||
| Debt service | −2 593 | 0.4 | −10 268 | 1.1 | −248 | −10 516 | 3.6 | ||||||||||||||||
| Subtotal - Expenditure | −42 226 | 3.2 | −170 757 | 1.5 | −840 | −171 597 | 3.4 | ||||||||||||||||
| Contingency reserve | - | - | −2 000 | - | - | −2 000 | - | ||||||||||||||||
| ACCOUNTING SURPLUS (DEFICIT) | −467 | - | −6 265 | - | 1 057 | −5 208 | - | ||||||||||||||||
| Deposits of dedicated revenues in the Generations Fund | −829 | - | −2 347 | - | −135 | −2 482 | - | ||||||||||||||||
| BUDGETARY BALANCE(1) | −1 296 | - | −8 612 | - | 922 | −7 690 | - | ||||||||||||||||
(1) Budgetary balance within the meaning of the Balanced Budget Act.
Appendix 1: Results and budgetary outlook for 2026-2027 (cont.)
| Results and budgetary outlook for 2026-2027 - Revenue | |||||||||||||||||||||||
| (level and adjustment in millions of dollars, percentage change compared to the same period last year) | |||||||||||||||||||||||
| April to June | Forecast for fiscal year 2026-2027 | ||||||||||||||||||||||
| March 2026 budget |
Pre-election Report - August 2026(1) |
||||||||||||||||||||||
| Level ($M) |
Change (%) |
Level ($M) |
Change (%) |
Adjustment ($M) |
Level ($M) |
Change (%) |
|||||||||||||||||
| Own-source revenue | |||||||||||||||||||||||
| Income and property taxes | |||||||||||||||||||||||
| - Personal income tax | 12 890 | 6.7 | 50 800 | 3.7 | 142 | 50 942 | 4.0 | ||||||||||||||||
| - Contributions for health services | 2 374 | 3.9 | 9 412 | 2.6 | 126 | 9 538 | 2.5 | ||||||||||||||||
| - Corporate taxes | 3 251 | 0.1 | 14 527 | 3.0 | 171 | 14 698 | 0.7 | ||||||||||||||||
| - School property tax | 318 | 4.6 | 1 311 | 4.5 | −10 | 1 301 | 4.7 | ||||||||||||||||
| Consumption taxes | 8 363 | 6.8 | 30 008 | 2.2 | 674 | 30 682 | 3.5 | ||||||||||||||||
| Subtotal - Tax revenue | 27 196 | 5.6 | 106 058 | 3.1 | 1 103 | 107 161 | 3.3 | ||||||||||||||||
| Duties, permits and royalties | 1 681 | 8.5 | 6 542 | 3.7 | −58 | 6 484 | −3.3 | ||||||||||||||||
| Miscellaneous revenue | 4 317 | 13.6 | 15 908 | 3.3 | −118 | 15 790 | 5.8 | ||||||||||||||||
| Subtotal - Other own-source revenue | 5 998 | 12.1 | 22 450 | 3.4 | −176 | 22 274 | 3.0 | ||||||||||||||||
| Total own-source revenue excluding revenue from government enterprises | 33 194 | 6.7 | 128 508 | 3.1 | 927 | 129 435 | 3.2 | ||||||||||||||||
| Revenue from government enterprises | 854 | −7.8 | 5 853 | 9.5 | 55 | 5 908 | 12.7 | ||||||||||||||||
| Total own-source revenue | 34 048 | 6.3 | 134 361 | 3.4 | 982 | 135 343 | 3.6 | ||||||||||||||||
| Federal transfers | |||||||||||||||||||||||
| Equalization | 3 477 | 2.5 | 13 907 | 2.5 | - | 13 907 | 2.5 | ||||||||||||||||
| Health transfers | 2 223 | −0.5 | 9 265 | 6.7 | −158 | 9 107 | 7.9 | ||||||||||||||||
| Transfers for post-secondary education and other social programs | 290 | −12.9 | 1 392 | 5.9 | −100 | 1 292 | 10.6 | ||||||||||||||||
| Other programs | 1 721 | 16.4 | 7 567 | 7.9 | 1 173 | 8 740 | 31.9 | ||||||||||||||||
| Subtotal - Federal transfers | 7 711 | 3.7 | 32 131 | 5.1 | 915 | 33 046 | 10.9 | ||||||||||||||||
| TOTAL REVENUE | 41 759 | 5.8 | 166 492 | 3.7 | 1 897 | 168 389 | 5.0 | ||||||||||||||||
(1) Adjustments to own-source revenue reflect initiatives announced since between Budget 2026-2027 and the pre-election report. At the time the pre-election report was published, the adjustments were presented before incorporating the impact of these initiatives.
Appendix 1: Results and budgetary outlook for 2026-2027 (cont.)
| Results and budgetary outlook for 2026-2027 - Expenditure | |||||||||||||||||||||||
| (level and adjustment in millions of dollars, percentage change compared to the same period last year) | |||||||||||||||||||||||
| April to June | Forecast for fiscal year 2026-2027 | ||||||||||||||||||||||
| March 2026 budget |
Pre-election Report - August 2026(1) |
||||||||||||||||||||||
| Level ($M) |
Change (%) |
Level ($M) |
Change (%) |
Adjustment ($M) | Level ($M) |
Change (%) |
|||||||||||||||||
| Portfolio expenditures | |||||||||||||||||||||||
| Santé et Services sociaux | 16 901 | 3.8 | 68 708 | 4.1 | 1 283 | 69 991 | 6.1 | ||||||||||||||||
| Éducation | 6 664 | 1.2 | 24 075 | 2.4 | 336 | 24 411 | 3.7 | ||||||||||||||||
| Enseignement supérieur | 2 930 | 1.6 | 11 749 | 3.7 | 98 | 11 847 | 5.9 | ||||||||||||||||
| Famille | 2 474 | 3.6 | 10 009 | 2.8 | 58 | 10 067 | 4.5 | ||||||||||||||||
| Transports et Mobilité durable | 1 800 | −11.4 | 7 739 | −16.4 | 130 | 7 869 | −14.2 | ||||||||||||||||
| Emploi et Solidarité sociale | 1 859 | 22.5 | 5 952 | 2.6 | 406 | 6 358 | 9.4 | ||||||||||||||||
| Affaires municipales et Habitation | 1 076 | 11.7 | 5 608 | −2.6 | 255 | 5 863 | 11.6 | ||||||||||||||||
| Économie, Innovation et Énergie | 845 | −9.8 | 4 511 | −7.3 | −5 | 4 506 | 3.2 | ||||||||||||||||
| Environnement, Lutte contre les changements climatiques, Faune et Parcs | 272 | 3.4 | 2 004 | 0.8 | −25 | 1 979 | 9.8 | ||||||||||||||||
| Other portfolios | 4 812 | 7.4 | 20 134 | 1.9 | −1 944 | 18 190 | −4.6 | ||||||||||||||||
| Subtotal - Portfolio expenditures | 39 633 | 3.4 | 160 489 | 1.6 | 592 | 161 081 | 3.4 | ||||||||||||||||
| Debt service | 2 593 | 0.4 | 10 268 | 1.1 | 248 | 10 516 | 3.6 | ||||||||||||||||
| TOTAL EXPENDITURE | 42 226 | 3.2 | 170 757 | 1.5 | 840 | 171 597 | 3.4 | ||||||||||||||||
(1) Adjustments to expenditures in the pre-election report are mainly attributable to initiatives announced since the Budget, expenditure adjustments related to new agreements with the federal government, and reclassifications between portfolios made by the Ministère des Finances in response to the Auditor General of Québec's assurance engagement.
Appendix 2 : Change in certain economic variables
| Recent economic indicators in Québec | ||||||||||||||||||||||||||||||
| (year-over-year percentage change, unless otherwise indicated) | ||||||||||||||||||||||||||||||
| Quarters of 2026 | Annual | |||||||||||||||||||||||||||||
| May 2026 |
June 2026 |
July 2026 |
Aug. 2026 |
Q1 | Q2 | Q3 | Q4 | Fcst(1) | Obs.(2) | |||||||||||||||||||||
| Real GDP by industry | −0.1 | 0.4 | - | - | 0.3 | 0.2 | - | - | 0.7 | 0.2 | ||||||||||||||||||||
| Jobs creation (thousands) |
13.2 | 14.3 | 0.7 | −18.5 | −21.9 | −42.2 | - | - | −15.4 | −27.9 | ||||||||||||||||||||
| Unemployment rate (per cent) |
5.6 | 5.4 | 5.6 | 5.6 | 5.5 | 5.7 | - | - | 5.6 | 5.6 | ||||||||||||||||||||
| Retail sales (in nominal terms) |
0.7 | 0.5 | - | - | 1.8 | 1.0 | - | - | 3.9 | 3.8 | ||||||||||||||||||||
| Consumer price index(3) | 3.6 | 3.2 | 3.3 | 3.1 | 2.9 | 3.3 | - | - | 3.0 | 3.1 | ||||||||||||||||||||
| Housing starts (thousands) |
49.9 | 54.2 | 63.8 | 60.5 | 62.5 | 54.4 | - | - | 57.0 | 59.4 | ||||||||||||||||||||
| Real GDP | - | - | - | - | 0.4 | 0.2 | - | - | 0.7 | 0.2 | ||||||||||||||||||||
| GDP (in nominal terms) | - | - | - | - | 0.8 | 1.1 | - | - | 3.4 | 3.9 | ||||||||||||||||||||
| Household consumption (in nominal terms) | - | - | - | - | 0.7 | 1.1 | - | - | 4.3 | 4.1 | ||||||||||||||||||||
| Wages and salaries (in nominal terms) |
−1.1 | 0.8 | - | - | 1.0 | 1.2 | - | - | 3.3 | 3.5 | ||||||||||||||||||||
| Net operating surplus of corporations (in nominal terms) | - | - | - | - | 3.0 | -2.2 | - | - | 4.8 | 6.9 | ||||||||||||||||||||
(1) These forecasts correspond to those published in the Pre-election report on the state of Québec's public finances - August 2026.
(2) Cumulative of available periods compared to the same period of the previous year.
(3) Change compared to the previous year.
Sources: Institut de la statistique du Québec, Statistics Canada, Canada Mortgage and Housing Corporation and Ministère des Finances du Québec.

 |
Note to the reader |
The Report on Québec's Financial Situation provides an overview of the Québec government's financial results. It is prepared with a view to increasing the transparency of public finances and regularly monitoring the achievement of the budgetary balance target for the fiscal year. The financial information presented in the report is not audited and is based on the accounting policies in the government's annual financial statements.
|
Consolidated financial information |
Consolidated results include the results of all entities that are part of the government's reporting entity, i.e., that are under its control. To determine consolidated results, the government eliminates transactions carried out between entities in the reporting entity. Additional information on the government's financial organization and the funding of public services can be found on pages 14 to 19 of the document titled "Processus et documentation budgétaires : une reddition de comptes sur les finances publiques de l'État" (in French only).
|
Publication date of next quarterly report |
The Report on Québec's Financial Situation − Second Quarter of 2026-2027 will be published in December 2026.
| For more information, contact the Ministère des Finances at info@finances.gouv.qc.ca. |