Shareholder Report
|
12 Months Ended |
|
Jul. 31, 2026
USD ($)
Holding
|
|---|
| Shareholder Report [Line Items] |
|
| Document Type |
N-CSR
|
| Amendment Flag |
false
|
| Registrant Name |
Lincoln Funds Trust
|
| Entity Central Index Key |
0002015799
|
| Entity Investment Company Type |
N-1A
|
| Document Period End Date |
Jul. 31, 2026
|
| Shareholder Report Annual or Semi-Annual |
Annual Shareholder Report
|
| C000250824 |
|
| Shareholder Report [Line Items] |
|
| Fund Name |
Lincoln Inflation Plus Fund
|
| Class Name |
Class A
|
| Trading Symbol |
LFTAX
|
| Annual or Semi-Annual Statement [Text Block] |
This Annual shareholder report contains important information about Lincoln Inflation Plus Fund for the period of August 1, 2025 to July 31, 2026.
|
| Additional Information [Text Block] |
You can find additional information about the Fund at www.lincolnfinancial.com/lft. You can also request this information by contacting us at 866-436-8717.
|
| Additional Information Phone Number |
866-436-8717
|
| Additional Information Website |
www.lincolnfinancial.com/lft
|
| Expenses [Text Block] |
What were the Fund costs for last year?(based on a hypothetical $10,000 investment) Table SummaryClass Name | Cost of a $10,000 investment | Costs paid as a percentage of a $10,000 investment |
|---|
Class A | $150 | 1.35% |
|---|
|
| Expenses Paid, Amount |
$ 150
|
| Expense Ratio, Percent |
1.35%
|
| Factors Affecting Performance [Text Block] |
How did the Fund perform last year and what affected its performance?Events over the past 12 months have increased the risk of stagflation and higher government spending. The Iran conflict could become the next major fiscal shock, further worsening fiscal outlooks and impacting bond markets. Emerging market local bonds generated attractive income from yields, while precious metals gained amid persistent macro uncertainty. High-yielding local bond positions, particularly in Brazil, Colombia, Mexico, Hungary and South Africa, all contributed positively. Gold and silver positions supported returns, though positions were reduced towards the end of the period given USD strength. Exposure to oil delivered strong contributions to fund performance, as the Iran conflict started. Derivative positions were used primarily to gain exposure to core commodity markets, such as oil, and for FX hedging. The fund exceeded its performance target, as a result of the active shift from income and gold to a more energy heavy allocation. |
| Performance Past Does Not Indicate Future [Text] |
Past performance is not indicative of future performance.
|
| Line Graph [Table Text Block] |
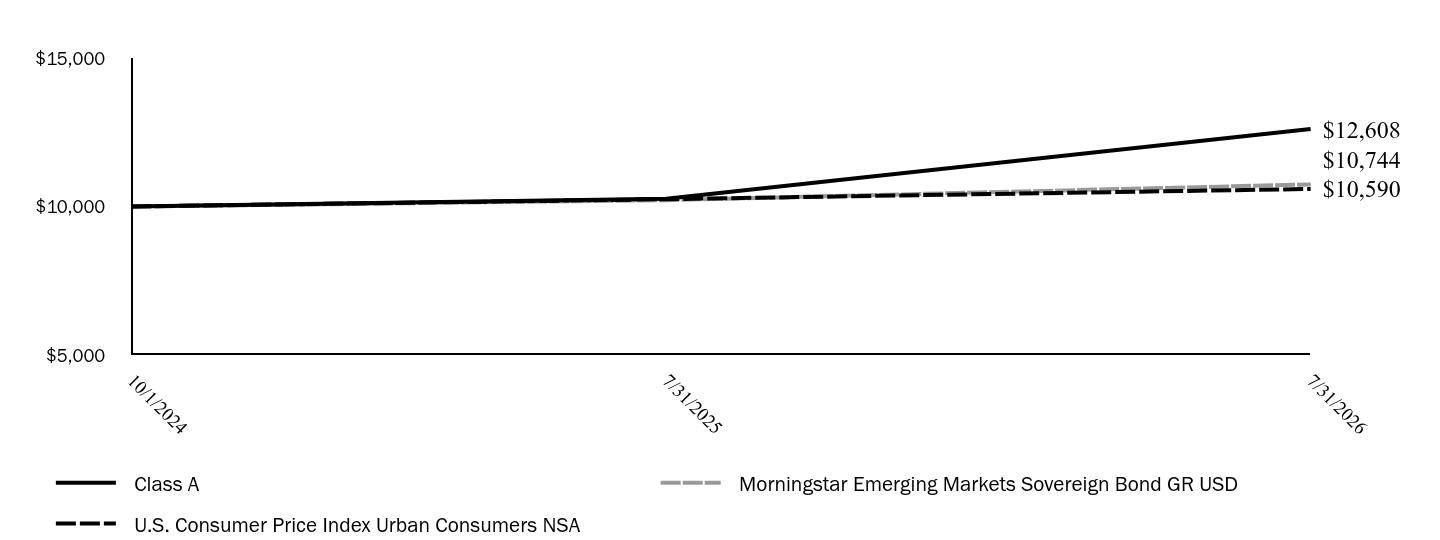
Table Summary | Class A | Morningstar Emerging Markets Sovereign Bond GR USD | U.S. Consumer Price Index Urban Consumers NSA |
|---|
10/1/2024 | $10,000 | $10,000 | $10,000 |
|---|
7/31/2025 | $10,259 | $10,213 | $10,246 |
|---|
7/31/2026 | $12,608 | $10,744 | $10,590 |
|---|
|
| Average Annual Return [Table Text Block] |
Table SummarySub header | 1 year | Since Inception
10/1/2024 |
|---|
Class A | 22.90% | 13.48% |
|---|
Morningstar Emerging Markets Sovereign Bond GR USD | 5.20% | 3.99% |
|---|
U.S. Consumer Price Index Urban Consumers NSA | 3.36% | 3.18% |
|---|
|
| Performance Inception Date |
Oct. 01, 2024
|
| No Deduction of Taxes [Text Block] |
Neither the Fund's returns nor the index returns reflect the deduction of taxes that a shareholder would pay on Fund distributions or redemptions. Performance results reflect any expense waivers in effect during these periods.
|
| AssetsNet |
$ 12,761,062
|
| Holdings Count | Holding |
98
|
| Advisory Fees Paid, Amount |
$ 101,871
|
| InvestmentCompanyPortfolioTurnover |
241.00%
|
| Additional Fund Statistics [Text Block] |
Table SummaryTotal Net Assets | $12,761,062 |
|---|
# of Portfolio Holdings | 98 |
|---|
Portfolio Turnover Rate | 241% |
|---|
Total Advisory Fees Paid | $101,871 |
|---|
|
| Holdings [Text Block] |
Table SummarySovereign Bonds | 40.3% |
|---|
Short-Term Investments | 24.5% |
|---|
U.S. Treasury Obligations | 13.6% |
|---|
Exchange-Traded Funds | 11.6% |
|---|
Supranational Banks | 4.5% |
|---|
Convertible Bonds | 1.5% |
|---|
Common Stock | 0.2% |
|---|
Money Market Funds | 0.0% |
|---|
Other | 3.8% |
|---|
|
| Credit Quality Explanation [Text Block] |
Top 5 Countries (Fixed Income) Table SummaryUnited States | 13.6% |
|---|
Brazil | 6.8% |
|---|
Colombia | 6.5% |
|---|
Mexico | 5.7% |
|---|
Republic Of Korea | 5.3% |
|---|
|
| Largest Holdings [Text Block] |
Table SummaryAustralia | 0.1% |
|---|
Canada | 0.1% |
|---|
|
| Material Fund Change [Text Block] |
|
| C000250823 |
|
| Shareholder Report [Line Items] |
|
| Fund Name |
Lincoln Inflation Plus Fund
|
| Class Name |
Class I
|
| Trading Symbol |
LFTEX
|
| Annual or Semi-Annual Statement [Text Block] |
This Annual shareholder report contains important information about Lincoln Inflation Plus Fund for the period of August 1, 2025 to July 31, 2026.
|
| Additional Information [Text Block] |
You can find additional information about the Fund at www.lincolnfinancial.com/lft. You can also request this information by contacting us at 866-436-8717.
|
| Additional Information Phone Number |
866-436-8717
|
| Additional Information Website |
www.lincolnfinancial.com/lft
|
| Expenses [Text Block] |
What were the Fund costs for last year?(based on a hypothetical $10,000 investment) Table SummaryClass Name | Cost of a $10,000 investment | Costs paid as a percentage of a $10,000 investment |
|---|
Class I | $123 | 1.10% |
|---|
|
| Expenses Paid, Amount |
$ 123
|
| Expense Ratio, Percent |
1.10%
|
| Factors Affecting Performance [Text Block] |
How did the Fund perform last year and what affected its performance?Events over the past 12 months have increased the risk of stagflation and higher government spending. The Iran conflict could become the next major fiscal shock, further worsening fiscal outlooks and impacting bond markets. Emerging market local bonds generated attractive income from yields, while precious metals gained amid persistent macro uncertainty. High-yielding local bond positions, particularly in Brazil, Colombia, Mexico, Hungary and South Africa, all contributed positively. Gold and silver positions supported returns, though positions were reduced towards the end of the period given USD strength. Exposure to oil delivered strong contributions to fund performance, as the Iran conflict started. Derivative positions were used primarily to gain exposure to core commodity markets, such as oil, and for FX hedging. The fund exceeded its performance target, as a result of the active shift from income and gold to a more energy heavy allocation. |
| Performance Past Does Not Indicate Future [Text] |
Past performance is not indicative of future performance.
|
| Line Graph [Table Text Block] |
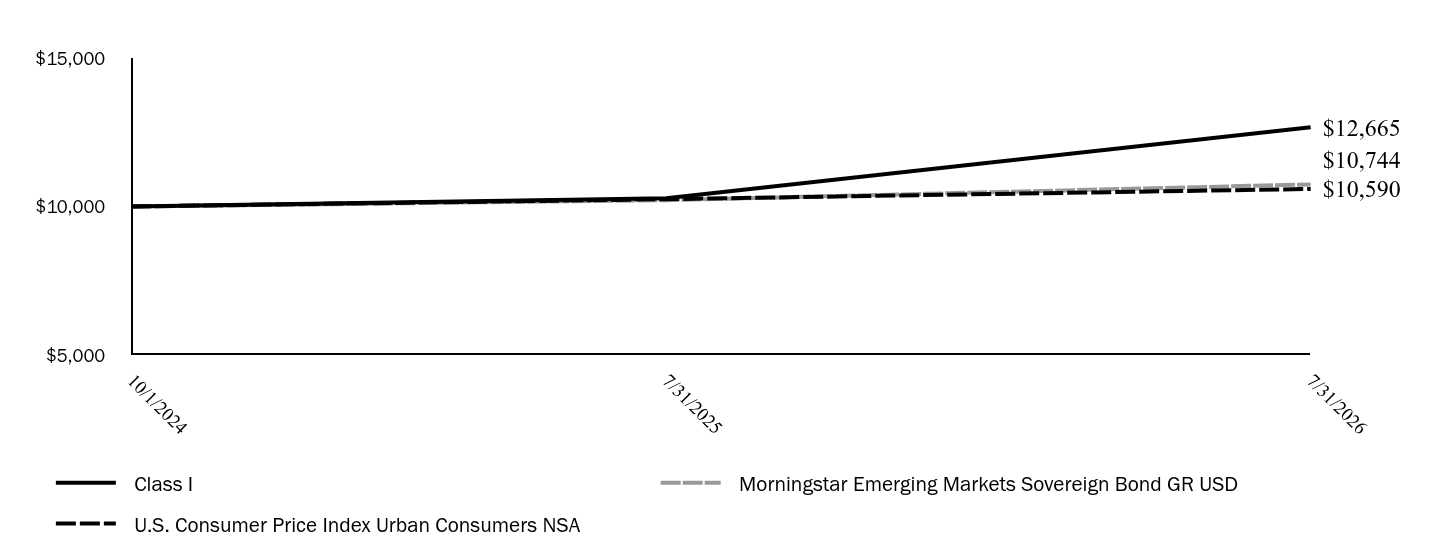
Table Summary | Class I | Morningstar Emerging Markets Sovereign Bond GR USD | U.S. Consumer Price Index Urban Consumers NSA |
|---|
10/1/2024 | $10,000 | $10,000 | $10,000 |
|---|
7/31/2025 | $10,280 | $10,213 | $10,246 |
|---|
7/31/2026 | $12,665 | $10,744 | $10,590 |
|---|
|
| Average Annual Return [Table Text Block] |
Table SummarySub header | 1 year | Since Inception
10/1/2024 |
|---|
Class I | 23.20% | 13.76% |
|---|
Morningstar Emerging Markets Sovereign Bond GR USD | 5.20% | 3.99% |
|---|
U.S. Consumer Price Index Urban Consumers NSA | 3.36% | 3.18% |
|---|
|
| Performance Inception Date |
Oct. 01, 2024
|
| No Deduction of Taxes [Text Block] |
Neither the Fund's returns nor the index returns reflect the deduction of taxes that a shareholder would pay on Fund distributions or redemptions. Performance results reflect any expense waivers in effect during these periods.
|
| AssetsNet |
$ 12,761,062
|
| Holdings Count | Holding |
98
|
| Advisory Fees Paid, Amount |
$ 101,871
|
| InvestmentCompanyPortfolioTurnover |
241.00%
|
| Additional Fund Statistics [Text Block] |
Table SummaryTotal Net Assets | $12,761,062 |
|---|
# of Portfolio Holdings | 98 |
|---|
Portfolio Turnover Rate | 241% |
|---|
Total Advisory Fees Paid | $101,871 |
|---|
|
| Holdings [Text Block] |
Table SummarySovereign Bonds | 40.3% |
|---|
Short-Term Investments | 24.5% |
|---|
U.S. Treasury Obligations | 13.6% |
|---|
Exchange-Traded Funds | 11.6% |
|---|
Supranational Banks | 4.5% |
|---|
Convertible Bonds | 1.5% |
|---|
Common Stock | 0.2% |
|---|
Money Market Funds | 0.0% |
|---|
Other | 3.8% |
|---|
|
| Credit Quality Explanation [Text Block] |
Top 5 Countries (Fixed Income) Table SummaryUnited States | 13.6% |
|---|
Brazil | 6.8% |
|---|
Colombia | 6.5% |
|---|
Mexico | 5.7% |
|---|
Republic Of Korea | 5.3% |
|---|
|
| Largest Holdings [Text Block] |
Table SummaryAustralia | 0.1% |
|---|
Canada | 0.1% |
|---|
|
| Material Fund Change [Text Block] |
|
| C000250826 |
|
| Shareholder Report [Line Items] |
|
| Fund Name |
Lincoln U.S. Equity Income Maximizer Fund
|
| Class Name |
Class A
|
| Trading Symbol |
LFTOX
|
| Annual or Semi-Annual Statement [Text Block] |
This Annual shareholder report contains important information about Lincoln U.S. Equity Income Maximizer Fund for the period of August 1, 2025 to July 31, 2026.
|
| Additional Information [Text Block] |
You can find additional information about the Fund at www.lincolnfinancial.com/lft. You can also request this information by contacting us at 866-436-8717.
|
| Additional Information Phone Number |
866-436-8717
|
| Additional Information Website |
www.lincolnfinancial.com/lft
|
| Expenses [Text Block] |
What were the Fund costs for last year?(based on a hypothetical $10,000 investment) Table SummaryClass Name | Cost of a $10,000 investment | Costs paid as a percentage of a $10,000 investment |
|---|
Class A | $143 | 1.32% |
|---|
|
| Expenses Paid, Amount |
$ 143
|
| Expense Ratio, Percent |
1.32%
|
| Factors Affecting Performance [Text Block] |
How did the Fund perform last year and what affected its performance?The U.S. market has gained over the course of the year but the overall return masks significant volatility during the period. The Fund also rose against this backdrop, but lagged the index in net terms. The equity portfolio slightly trailed the wider market, while the call option overlay strategy contributed positively. The index replication-style equity portfolio aims to provide broad S&P500 exposure via a subset that currently consists of 88 stocks. Position sizing is risk-based, using an optimizer that seeks to minimize the tracking error of the equity basket relative to the index. Over the period, most of the relative lag for the equity portfolio came from names not held but which performed well. The option strategy seeks to enhance the dividend income from the underlying equity portfolio. It does so by selling some of the potential capital growth on selected stocks on a rolling short term basis in return for a premium. Given this trade-off, we would typically expect the strategy to lag a similar, long only equity portfolio in fast rising markets. As stocks fall, remain flat or rise gently, the Fund can benefit from the premium received from selling the call options. While supplementing the income over the 12 months, the option strategy was a positive contributor in performance terms. |
| Performance Past Does Not Indicate Future [Text] |
Past performance is not indicative of future performance.
|
| Line Graph [Table Text Block] |
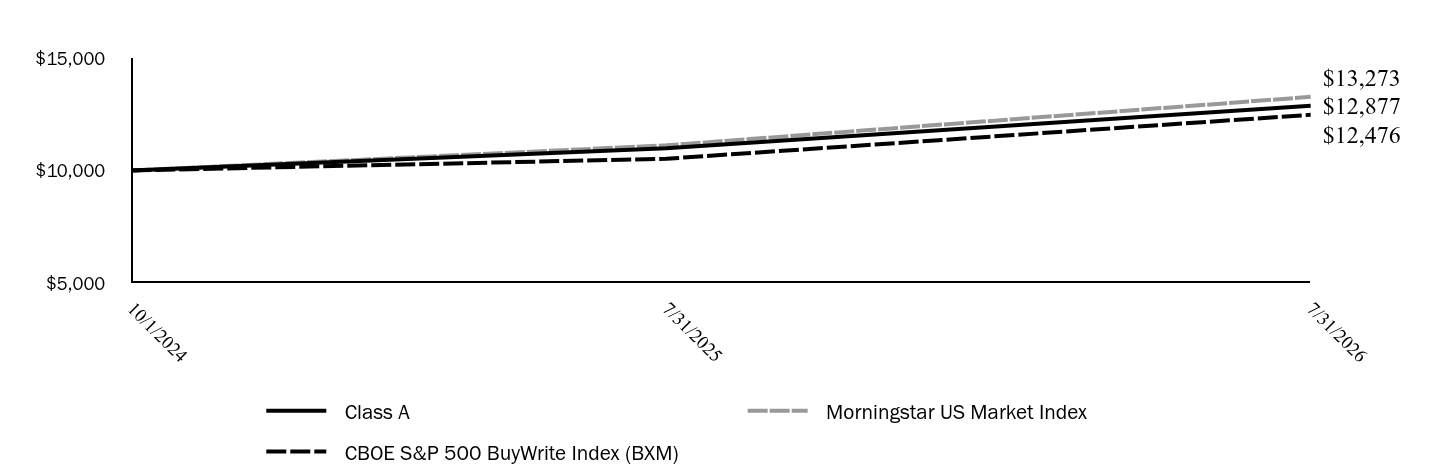
Table Summary | Class A | Morningstar US Market Index | CBOE S&P 500 BuyWrite Index (BXM) |
|---|
10/1/2024 | $10,000 | $10,000 | $10,000 |
|---|
7/31/2025 | $10,987 | $11,117 | $10,521 |
|---|
7/31/2026 | $12,877 | $13,273 | $12,476 |
|---|
|
| Average Annual Return [Table Text Block] |
Table SummarySub header | 1 year | Since Inception
10/1/2024 |
|---|
Class A | 17.21% | 14.79% |
|---|
Morningstar US Market Index | 19.39% | 16.71% |
|---|
CBOE S&P 500 BuyWrite Index (BXM) | 18.58% | 12.83% |
|---|
|
| Performance Inception Date |
Oct. 01, 2024
|
| No Deduction of Taxes [Text Block] |
Neither the Fund's returns nor the index returns reflect the deduction of taxes that a shareholder would pay on Fund distributions or redemptions. Performance results reflect any expense waivers in effect during these periods.
|
| AssetsNet |
$ 19,488,658
|
| Holdings Count | Holding |
112
|
| Advisory Fees Paid, Amount |
$ 154,658
|
| InvestmentCompanyPortfolioTurnover |
32.00%
|
| Additional Fund Statistics [Text Block] |
Table SummaryTotal Net Assets | $19,488,658 |
|---|
# of Portfolio Holdings | 112 |
|---|
Portfolio Turnover Rate | 32% |
|---|
Total Advisory Fees Paid | $154,658 |
|---|
|
| Holdings [Text Block] |
Table SummaryCommon Stock | 96.5% |
|---|
Money Market Funds | 0.0% |
|---|
Options | (0.2%) |
|---|
Other | 3.7% |
|---|
|
| Largest Holdings [Text Block] |
Top 5 Industries (Equity)Table SummarySemiconductors & Semiconductor Equipment | 16.9% |
|---|
Software | 8.3% |
|---|
Interactive Media & Services | 7.8% |
|---|
Technology Hardware, Storage & Peripherals | 7.5% |
|---|
Banks | 4.9% |
|---|
|
| Material Fund Change [Text Block] |
|
| C000250825 |
|
| Shareholder Report [Line Items] |
|
| Fund Name |
Lincoln U.S. Equity Income Maximizer Fund
|
| Class Name |
Class I
|
| Trading Symbol |
LFTPX
|
| Annual or Semi-Annual Statement [Text Block] |
This Annual shareholder report contains important information about Lincoln U.S. Equity Income Maximizer Fund for the period of August 1, 2025 to July 31, 2026.
|
| Additional Information [Text Block] |
You can find additional information about the Fund at www.lincolnfinancial.com/lft. You can also request this information by contacting us at 866-436-8717.
|
| Additional Information Phone Number |
866-436-8717
|
| Additional Information Website |
www.lincolnfinancial.com/lft
|
| Expenses [Text Block] |
What were the Fund costs for last year?(based on a hypothetical $10,000 investment) Table SummaryClass Name | Cost of a $10,000 investment | Costs paid as a percentage of a $10,000 investment |
|---|
Class I | $116 | 1.07% |
|---|
|
| Expenses Paid, Amount |
$ 116
|
| Expense Ratio, Percent |
1.07%
|
| Factors Affecting Performance [Text Block] |
How did the Fund perform last year and what affected its performance?The U.S. market has gained over the course of the year but the overall return masks significant volatility during the period. The Fund also rose against this backdrop, but lagged the index in net terms. The equity portfolio slightly trailed the wider market, while the call option overlay strategy contributed positively. The index replication-style equity portfolio aims to provide broad S&P500 exposure via a subset that currently consists of 88 stocks. Position sizing is risk-based, using an optimizer that seeks to minimize the tracking error of the equity basket relative to the index. Over the period, most of the relative lag for the equity portfolio came from names not held but which performed well. The option strategy seeks to enhance the dividend income from the underlying equity portfolio. It does so by selling some of the potential capital growth on selected stocks on a rolling short term basis in return for a premium. Given this trade-off, we would typically expect the strategy to lag a similar, long only equity portfolio in fast rising markets. As stocks fall, remain flat or rise gently, the Fund can benefit from the premium received from selling the call options. While supplementing the income over the 12 months, the option strategy was a positive contributor in performance terms. |
| Performance Past Does Not Indicate Future [Text] |
Past performance is not indicative of future performance.
|
| Line Graph [Table Text Block] |
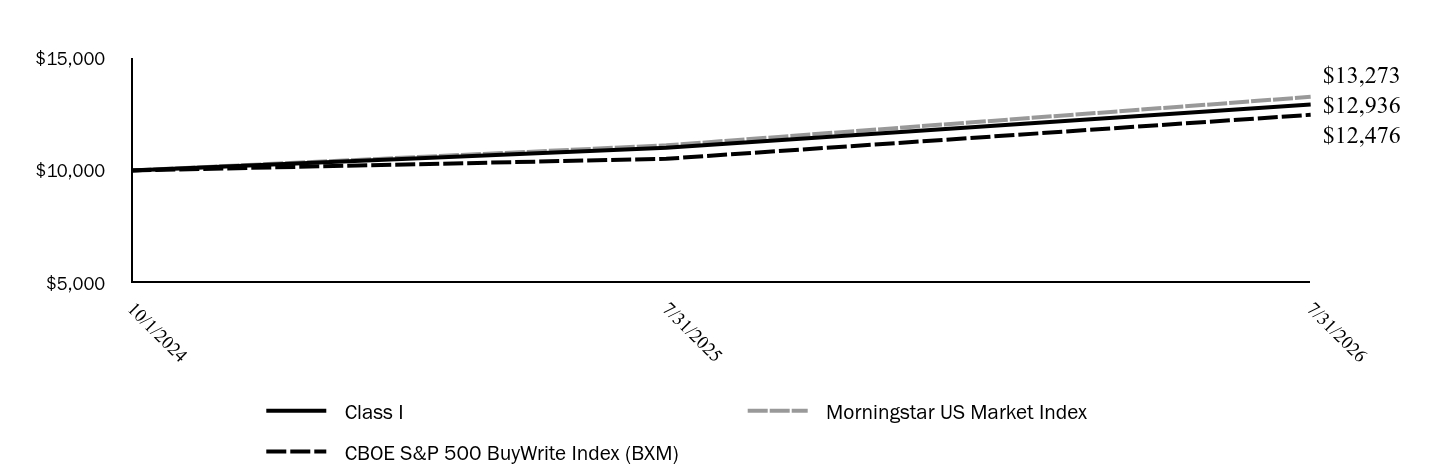
Table Summary | Class I | Morningstar US Market Index | CBOE S&P 500 BuyWrite Index (BXM) |
|---|
10/1/2024 | $10,000 | $10,000 | $10,000 |
|---|
7/31/2025 | $11,010 | $11,117 | $10,521 |
|---|
7/31/2026 | $12,936 | $13,273 | $12,476 |
|---|
|
| Average Annual Return [Table Text Block] |
Table SummarySub header | 1 year | Since Inception
10/1/2024 |
|---|
Class I | 17.50% | 15.08% |
|---|
Morningstar US Market Index | 19.39% | 16.71% |
|---|
CBOE S&P 500 BuyWrite Index (BXM) | 18.58% | 12.83% |
|---|
|
| Performance Inception Date |
Oct. 01, 2024
|
| No Deduction of Taxes [Text Block] |
Neither the Fund's returns nor the index returns reflect the deduction of taxes that a shareholder would pay on Fund distributions or redemptions. Performance results reflect any expense waivers in effect during these periods.
|
| AssetsNet |
$ 19,488,658
|
| Holdings Count | Holding |
112
|
| Advisory Fees Paid, Amount |
$ 154,658
|
| InvestmentCompanyPortfolioTurnover |
32.00%
|
| Additional Fund Statistics [Text Block] |
Table SummaryTotal Net Assets | $19,488,658 |
|---|
# of Portfolio Holdings | 112 |
|---|
Portfolio Turnover Rate | 32% |
|---|
Total Advisory Fees Paid | $154,658 |
|---|
|
| Holdings [Text Block] |
Table SummaryCommon Stock | 96.5% |
|---|
Money Market Funds | 0.0% |
|---|
Options | (0.2%) |
|---|
Other | 3.7% |
|---|
|
| Largest Holdings [Text Block] |
Top 5 Industries (Equity)Table SummarySemiconductors & Semiconductor Equipment | 16.9% |
|---|
Software | 8.3% |
|---|
Interactive Media & Services | 7.8% |
|---|
Technology Hardware, Storage & Peripherals | 7.5% |
|---|
Banks | 4.9% |
|---|
|
| Material Fund Change [Text Block] |
|