Pay vs Performance Disclosure
USD in Thousands
USD in Thousands
May 31, 2026
USD ($)
USD
May 31, 2025
USD ($)
USD
May 31, 2024
USD ($)
USD
May 31, 2023
USD ($)
USD
May 31, 2022
USD ($)
USD
May 31, 2021
USD ($)
USD
Pay Versus Performance
As required by Section 953(a) of the Dodd-Frank Wall Street Reform and Consumer Protection Act, and Item 402(v) of Regulation S-K, we are providing the following information about the relationship between executive
compensation actually paid and certain financial performance of the Company. For further information concerning the Company’s pay-for-performance philosophy and how the Company aligns executive compensation with the Company’s performance, see
“Compensation Discussion and Analysis.” The amounts set forth below in the required table are calculated pursuant to SEC rules but do not represent amounts that have been actually earned or realized by our NEOs.
| Fiscal Year | Summary Compensation Table Total for the CEO (1) | Compensation Actually Paid to the CEO (3)(4) | Average Summary Compensation Table Total for Non-CEO NEOs (2) | Average Compensation Actually Paid to the Non- CEO NEOs (3)(4) | Total Shareholder Return (5) | Peer Group Total Shareholder Return (5) | Net Income (loss) (in thousands) (6) | Revenue (in thousands) (7) | ||||||||||||||||||||||||
| 2026 | $ | 6,060,145 | $ | 13,687,672 | $ | 1,799,117 | $ | 7,350,570 | $ | 49.65 | $ | 56.54 | $ | (36,742 | ) | $ | (320,175 | ) | ||||||||||||||
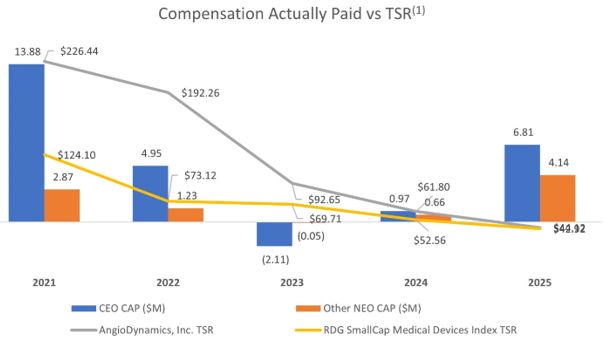
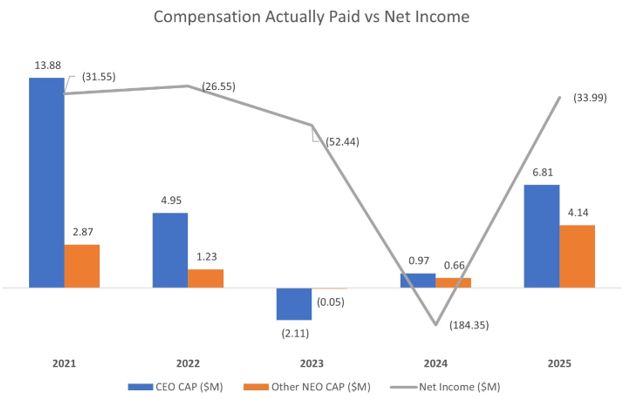
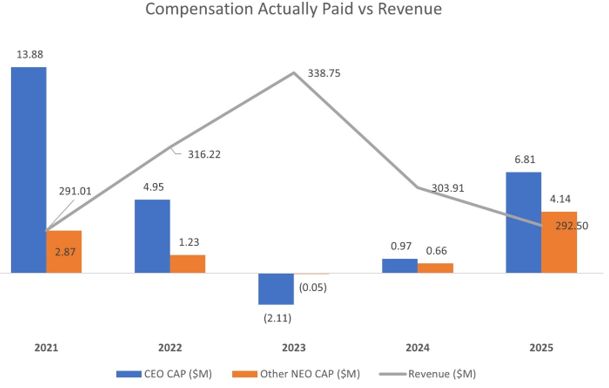
| 2025 | $ | 5,494,284 | $ | 6,807,600 | $ | 1,466,609 | $ | 4,144,464 | $ | 44.12 | $ | 42.92 | $ | (33,993 | ) | $ | 292,498 | |||||||||||||||
| 2024 | $ | 5,005,971 | $ | 971,112 | $ | 1,264,817 | $ | 656,573 | $ | 27.29 | $ | 42.92 | $ | (184,350 | ) | $ | 303,914 | |||||||||||||||
| 2023 | $ | 3,983,690 | $ | (2,114,483 | ) | $ | 914,244 | $ | (45,199 | ) | $ | 40.92 | $ | 56.18 | $ | (52,441 | ) | $ | 338,752 | |||||||||||||
| 2022 | $ | 5,659,727 | $ | 4,953,581 | $ | 1,303,492 | $ | 1,233,726 | $ | 84.90 | $ | 58.92 | $ | (26,547 | ) | $ | 316,219 | |||||||||||||||
| 2021 | $ | 4,045,913 | $ | 13,883,392 | $ | 1,029,527 | $ | 2,868,533 | $ | 226.44 | $ | 124.10 | $ | (31,547 | ) | $ | 291,010 | |||||||||||||||
| (1) | Mr. Clemmer was the CEO for each of the fiscal years presented. |
|
(2)
|
Non-CEO NEOs for fiscal year 2026 and 2025 were Messrs. Trowbridge, Weiss, and Nighan and Ms. Piccinini. Non-CEO NEOs for fiscal year 2024 were Messrs. Trowbridge, Nighan, and Campbell and Ms.
Piccinini. Non-CEO NEOs for fiscal years 2023 and 2022 were Messrs. Trowbridge, Helsel, and Campbell and Ms. Piccinini. Non-CEO NEOs for fiscal year 2021 were Messrs. Trowbridge, Helsel, Campbell and Nighan.
|
| (3) | Subtractions from, and additions to, total compensation in the Summary Compensation Table ("SCT") by fiscal year to calculate Compensation Actually Paid ("CAP") are as follows: |
| 2026 | 2025 | 2024 | 2023 | |||||||||||||||||||||||||||||
| CEO | Average of Non-CEO NEOs | CEO | Average of Non-CEO NEOs | CEO | Average of Non-CEO NEOs | CEO | Average of Non-CEO NEOs | |||||||||||||||||||||||||
| Total Compensation from SCT | $ | 6,060,145 | $ | 1,799,117 | $ | 5,494,284 | $ | 1,466,609 | $ | 5,005,971 | $ | 1,264,817 | $ | 3,983,690 | $ | 914,244 | ||||||||||||||||
| Subtractions: | ||||||||||||||||||||||||||||||||
| SCT Value of Stock and Option Awards | $ | (3,689,866 | ) | $ | (803,570 | ) | $ | (3,437,078 | ) | $ | (734,299 | ) | $ | (3,399,217 | ) | $ | (592,487 | ) | $ | (3,000,774 | ) | $ | (454,289 | ) | ||||||||
| Adjustments: | ||||||||||||||||||||||||||||||||
| Unvested value at year end of equity granted during the covered fiscal year | $ | 6,479,094 | $ | 5,126,562 | $ | 3,736,553 | $ | 3,217,933 | $ | 817,462 | $ | 226,197 | $ | 658,535 | $ | 99,697 | ||||||||||||||||
| Change from prior year end in fair value of awards granted in any prior fiscal year that are outstanding and unvested at covered year end | $ | 5,284,540 | $ | 1,231,890 | $ | 1,263,456 | $ | 243,529 | $ | (313,264 | ) | $ | (42,700 | ) | $ | (3,867,465 | ) | $ | (612,420 | ) | ||||||||||||
| Change as of the vesting date (from the end of the prior fiscal year) in fair value of awards granted in any prior fiscal years for which vesting conditions were satisfied at the end of or during the covered fiscal year | $ | (446,241 | ) | $ | (3,430 | ) | $ | (249,615 | ) | $ | (49,308 | ) | $ | (1,139,840 | ) | $ | (199,254 | ) | $ | 111,531 | $ | 7,569 | ||||||||||
| Compensation Actually Paid | $ | 13,687,672 | $ | 7,350,570 | $ | 6,807,600 | $ | 4,144,464 | $ | 971,112 | $ | 656,573 | $ | (2,114,483 | ) | $ | (45,199 | ) | ||||||||||||||
| 2022 | 2021 | |||||||||||||||
| CEO | Average of Non-CEO NEOs | CEO | Average of Non-CEO NEOs | |||||||||||||
| Total Compensation from SCT | $ | 5,659,727 | $ | 1,303,492 | $ | 4,045,913 | $ | 1,029,527 | ||||||||
| Subtractions: | ||||||||||||||||
| SCT Value of Stock and Option Awards | $ | (4,147,712 | ) | $ | (687,958 | ) | $ | (2,137,451 | ) | $ | (357,244 | ) | ||||
| Adjustments: | ||||||||||||||||
| Unvested value at year end of equity granted during the covered fiscal year | $ | 3,289,559 | $ | 518,057 | $ | 9,414,998 | $ | 1,573,581 | ||||||||
| Change from prior year end in fair value of awards granted in any prior fiscal year that are outstanding and unvested at covered year end | $ | (1,051,502 | ) | $ | (189,282 | ) | $ | 2,574,779 | $ | 561,569 | ||||||
| Change as of the vesting date (from the end of the prior fiscal year) in fair value of awards granted in any prior fiscal years for which vesting conditions were satisfied at the end of or during the covered fiscal year | $ | 1,203,509 | $ | 289,417 | $ | (14,847 | ) | $ | 61,100 | |||||||
| Compensation Actually Paid | $ | 4,953,581 | $ | 1,233,726 | $ | 13,883,392 | $ | 2,868,533 | ||||||||
|
(4)
|
The fair value of each equity award was re-measured on each vesting date and/or year end, as applicable, in accordance with Accounting Standards Codification (ASC) Topic 718. The assumptions used
in the valuation of each type of award are summarized below:
|
| • |
Restricted stock units: The fair value of restricted stock units was based on the Company's closing stock price on each measurement date.
|
| • |
Non-qualified stock options: The fair value of non-qualified stock options was determined using a Black-Scholes option pricing model.
|
| • |
Performance unit awards: Performance unit awards are subject to vesting based on the Company's level of attainment of performance targets, as well as a TSR modifier at the end of each performance period
that can adjust the aggregate number of shares eligible to vest at the end of the three-year performance period. The fair value for performance unit awards was determined using a Monte Carlo simulation.
|
| (5) | Total shareholder return (TSR) is determined based on the value of an initial fixed investment of $100 in common stock on May 31, 2020, assuming the reinvestment of the dividends. The TSR peer group comprises the RDG SmallCap Medical Devices Index. |
|
(6)
|
Reflects the dollar amount of net income reported in our audited financial statements for the applicable fiscal year.
|
| (7) | GAAP Revenue equals Net Revenue, so no reconciliations are required for fiscal years 2026, 2025, 2024, 2023, 2022 or 2021. See our 2026 Annual Report on Form 10-K for the year ended May 31, 2026. |
| (1) | Mr. Clemmer was the CEO for each of the fiscal years presented. |
|
(2)
|
Non-CEO NEOs for fiscal year 2026 and 2025 were Messrs. Trowbridge, Weiss, and Nighan and Ms. Piccinini. Non-CEO NEOs for fiscal year 2024 were Messrs. Trowbridge, Nighan, and Campbell and Ms.
Piccinini. Non-CEO NEOs for fiscal years 2023 and 2022 were Messrs. Trowbridge, Helsel, and Campbell and Ms. Piccinini. Non-CEO NEOs for fiscal year 2021 were Messrs. Trowbridge, Helsel, Campbell and Nighan.
|
| (5) | Total shareholder return (TSR) is determined based on the value of an initial fixed investment of $100 in common stock on May 31, 2020, assuming the reinvestment of the dividends. The TSR peer group comprises the RDG SmallCap Medical Devices Index. |
| (3) | Subtractions from, and additions to, total compensation in the Summary Compensation Table ("SCT") by fiscal year to calculate Compensation Actually Paid ("CAP") are as follows: |
| 2026 | 2025 | 2024 | 2023 | |||||||||||||||||||||||||||||
| CEO | Average of Non-CEO NEOs | CEO | Average of Non-CEO NEOs | CEO | Average of Non-CEO NEOs | CEO | Average of Non-CEO NEOs | |||||||||||||||||||||||||
| Total Compensation from SCT | $ | 6,060,145 | $ | 1,799,117 | $ | 5,494,284 | $ | 1,466,609 | $ | 5,005,971 | $ | 1,264,817 | $ | 3,983,690 | $ | 914,244 | ||||||||||||||||
| Subtractions: | ||||||||||||||||||||||||||||||||
| SCT Value of Stock and Option Awards | $ | (3,689,866 | ) | $ | (803,570 | ) | $ | (3,437,078 | ) | $ | (734,299 | ) | $ | (3,399,217 | ) | $ | (592,487 | ) | $ | (3,000,774 | ) | $ | (454,289 | ) | ||||||||
| Adjustments: | ||||||||||||||||||||||||||||||||
| Unvested value at year end of equity granted during the covered fiscal year | $ | 6,479,094 | $ | 5,126,562 | $ | 3,736,553 | $ | 3,217,933 | $ | 817,462 | $ | 226,197 | $ | 658,535 | $ | 99,697 | ||||||||||||||||
| Change from prior year end in fair value of awards granted in any prior fiscal year that are outstanding and unvested at covered year end | $ | 5,284,540 | $ | 1,231,890 | $ | 1,263,456 | $ | 243,529 | $ | (313,264 | ) | $ | (42,700 | ) | $ | (3,867,465 | ) | $ | (612,420 | ) | ||||||||||||
| Change as of the vesting date (from the end of the prior fiscal year) in fair value of awards granted in any prior fiscal years for which vesting conditions were satisfied at the end of or during the covered fiscal year | $ | (446,241 | ) | $ | (3,430 | ) | $ | (249,615 | ) | $ | (49,308 | ) | $ | (1,139,840 | ) | $ | (199,254 | ) | $ | 111,531 | $ | 7,569 | ||||||||||
| Compensation Actually Paid | $ | 13,687,672 | $ | 7,350,570 | $ | 6,807,600 | $ | 4,144,464 | $ | 971,112 | $ | 656,573 | $ | (2,114,483 | ) | $ | (45,199 | ) | ||||||||||||||
| 2022 | 2021 | |||||||||||||||
| CEO | Average of Non-CEO NEOs | CEO | Average of Non-CEO NEOs | |||||||||||||
| Total Compensation from SCT | $ | 5,659,727 | $ | 1,303,492 | $ | 4,045,913 | $ | 1,029,527 | ||||||||
| Subtractions: | ||||||||||||||||
| SCT Value of Stock and Option Awards | $ | (4,147,712 | ) | $ | (687,958 | ) | $ | (2,137,451 | ) | $ | (357,244 | ) | ||||
| Adjustments: | ||||||||||||||||
| Unvested value at year end of equity granted during the covered fiscal year | $ | 3,289,559 | $ | 518,057 | $ | 9,414,998 | $ | 1,573,581 | ||||||||
| Change from prior year end in fair value of awards granted in any prior fiscal year that are outstanding and unvested at covered year end | $ | (1,051,502 | ) | $ | (189,282 | ) | $ | 2,574,779 | $ | 561,569 | ||||||
| Change as of the vesting date (from the end of the prior fiscal year) in fair value of awards granted in any prior fiscal years for which vesting conditions were satisfied at the end of or during the covered fiscal year | $ | 1,203,509 | $ | 289,417 | $ | (14,847 | ) | $ | 61,100 | |||||||
| Compensation Actually Paid | $ | 4,953,581 | $ | 1,233,726 | $ | 13,883,392 | $ | 2,868,533 | ||||||||
| (3) | Subtractions from, and additions to, total compensation in the Summary Compensation Table ("SCT") by fiscal year to calculate Compensation Actually Paid ("CAP") are as follows: |
| 2026 | 2025 | 2024 | 2023 | |||||||||||||||||||||||||||||
| CEO | Average of Non-CEO NEOs | CEO | Average of Non-CEO NEOs | CEO | Average of Non-CEO NEOs | CEO | Average of Non-CEO NEOs | |||||||||||||||||||||||||
| Total Compensation from SCT | $ | 6,060,145 | $ | 1,799,117 | $ | 5,494,284 | $ | 1,466,609 | $ | 5,005,971 | $ | 1,264,817 | $ | 3,983,690 | $ | 914,244 | ||||||||||||||||
| Subtractions: | ||||||||||||||||||||||||||||||||
| SCT Value of Stock and Option Awards | $ | (3,689,866 | ) | $ | (803,570 | ) | $ | (3,437,078 | ) | $ | (734,299 | ) | $ | (3,399,217 | ) | $ | (592,487 | ) | $ | (3,000,774 | ) | $ | (454,289 | ) | ||||||||
| Adjustments: | ||||||||||||||||||||||||||||||||
| Unvested value at year end of equity granted during the covered fiscal year | $ | 6,479,094 | $ | 5,126,562 | $ | 3,736,553 | $ | 3,217,933 | $ | 817,462 | $ | 226,197 | $ | 658,535 | $ | 99,697 | ||||||||||||||||
| Change from prior year end in fair value of awards granted in any prior fiscal year that are outstanding and unvested at covered year end | $ | 5,284,540 | $ | 1,231,890 | $ | 1,263,456 | $ | 243,529 | $ | (313,264 | ) | $ | (42,700 | ) | $ | (3,867,465 | ) | $ | (612,420 | ) | ||||||||||||
| Change as of the vesting date (from the end of the prior fiscal year) in fair value of awards granted in any prior fiscal years for which vesting conditions were satisfied at the end of or during the covered fiscal year | $ | (446,241 | ) | $ | (3,430 | ) | $ | (249,615 | ) | $ | (49,308 | ) | $ | (1,139,840 | ) | $ | (199,254 | ) | $ | 111,531 | $ | 7,569 | ||||||||||
| Compensation Actually Paid | $ | 13,687,672 | $ | 7,350,570 | $ | 6,807,600 | $ | 4,144,464 | $ | 971,112 | $ | 656,573 | $ | (2,114,483 | ) | $ | (45,199 | ) | ||||||||||||||
| 2022 | 2021 | |||||||||||||||
| CEO | Average of Non-CEO NEOs | CEO | Average of Non-CEO NEOs | |||||||||||||
| Total Compensation from SCT | $ | 5,659,727 | $ | 1,303,492 | $ | 4,045,913 | $ | 1,029,527 | ||||||||
| Subtractions: | ||||||||||||||||
| SCT Value of Stock and Option Awards | $ | (4,147,712 | ) | $ | (687,958 | ) | $ | (2,137,451 | ) | $ | (357,244 | ) | ||||
| Adjustments: | ||||||||||||||||
| Unvested value at year end of equity granted during the covered fiscal year | $ | 3,289,559 | $ | 518,057 | $ | 9,414,998 | $ | 1,573,581 | ||||||||
| Change from prior year end in fair value of awards granted in any prior fiscal year that are outstanding and unvested at covered year end | $ | (1,051,502 | ) | $ | (189,282 | ) | $ | 2,574,779 | $ | 561,569 | ||||||
| Change as of the vesting date (from the end of the prior fiscal year) in fair value of awards granted in any prior fiscal years for which vesting conditions were satisfied at the end of or during the covered fiscal year | $ | 1,203,509 | $ | 289,417 | $ | (14,847 | ) | $ | 61,100 | |||||||
| Compensation Actually Paid | $ | 4,953,581 | $ | 1,233,726 | $ | 13,883,392 | $ | 2,868,533 | ||||||||
| (1) |
TSR represents the value of a $100 investment in common stock, assuming reinvestment of dividends, as measured at each fiscal year end.
|
| (1) |
TSR represents the value of a $100 investment in common stock, assuming reinvestment of dividends, as measured at each fiscal year end.
|
Tabular List of Financial Performance Measures
In our assessment, the three most important financial performance measures used to link CAP (as calculated in accordance with the SEC rules) to our NEOs in fiscal year 2026
to the Company's performance were:
| • | Relative TSR values versus the RDG SmallCap Medical Devices Index; |
| • | EBITDA and EPS; and |
| • | The Company Selected Measure is Revenue. |