The Fund seeks long-term capital growth.
This table describes the fees and expenses that you may pay if you buy, hold, and sell shares of the Fund. You may pay other fees, such as brokerage commissions and other fees to financial intermediaries, which are not reflected in the tables and examples below.
Shareholder Fees | |||||
|
|
|
|
|
|
Maximum Sales Charge (Load) Imposed on |
|
|
| None |
|
Maximum Deferred Sales Charge (Load) (as a |
|
|
| None |
|
Maximum Sales Charge (Load) Imposed on |
|
|
| None |
|
Exchange Fee |
|
|
| None |
|
Annual Fund Operating Expenses | |||||
|
|
|
|
|
|
Management Fees |
|
|
| 0.95% |
|
Distribution (Rule 12b‑1) Fees |
|
|
| None |
|
Other Expenses |
|
|
| 0.44% |
|
Shareholder Service Fee |
| 0.09% |
|
|
|
All Other Expenses |
| 0.35% |
|
|
|
Acquired Fund Fees and Expenses |
|
|
| 0.02% |
|
Total Annual Fund Operating Expenses1 |
|
|
| 1.41% |
|
Fee Waiver and/or Expense Reimbursement2 |
|
|
| (0.66)% |
|
Total Annual Fund Operating Expenses after |
|
|
| 0.75% |
|
expense reimbursements are subject to possible recoupment by the adviser from the Fund in future years (within the three years from the date when the amount is waived or reimbursed) if such recoupment can be achieved within the lesser of the foregoing expense limits or the then-current expense limits. This agreement may be terminated only by the Fund’s Board of Trustees (the “Board”), upon written notice to the adviser.
This Example is intended to help you compare the cost of investing in the Fund with the cost of investing in other mutual funds. The Example assumes that you invest $10,000 in the Fund for the time periods indicated and then redeem all of your shares at the end of those periods. The Example also assumes that your investment has a 5% return each year and that the Fund’s operating expenses remain the same. The Example reflects the Fund’s contractual fee waiver and/or expense reimbursement only for the term of the contractual fee waiver and/or expense reimbursement. Although your actual costs may be higher or lower, based upon these assumptions your costs would be:
One Year | Three Years | Five Years | Ten Years |
$77 | $381 | $708 | $1,634 |
The Fund pays transaction costs, such as commissions, when it buys and sells securities (or “turns over” its portfolio). A higher portfolio turnover may indicate higher transaction costs and may result in higher taxes when Fund shares are held in a taxable account. These costs, which are not reflected in annual fund operating expenses or in the Example, affect the Fund’s performance. During the most recent fiscal year, the Fund’s portfolio turnover was 0% of the average value of its portfolio. The Fund’s portfolio turnover rate may vary from year to year as well as within a year.
The Fund seeks to achieve its investment objective by investing primarily in the equity securities (common stocks, preferred stocks and convertible securities) of U.S. companies. The Fund’s sub-adviser, Bragg Financial Advisors, Inc., invests the Fund’s assets by pursuing a value-oriented strategy without limitation on issuer capitalization. The sub-adviser’s strategy begins with a screening process that seeks to identify companies whose stocks sell at discounted price-to-earnings (P/E) and price-to-cash flow (P/CF) multiples. The sub-adviser favors companies that maintain strong balance sheets and have experienced management. Generally, the sub-adviser attempts to identify situations where stock prices are undervalued by the market.
Under normal circumstances, the Fund will invest at least 80% of its net assets (for the purpose of this requirement, net assets include net assets plus any borrowings for investment purposes) in equity securities of value companies. The Fund currently defines a value company as a company that (i) is included in at least one value index (as defined by the Fund’s sub-adviser (the “Value Indices”), (ii) exhibits one or more valuation metrics (such as price-to-earnings ratio, price-to-book value ratio, price-to-cash flow ratio, price-to-sales ratio, enterprise value-to-EBIT, or enterprise value-to-EBITA, among others) that are lower than the average of an applicable equity market index, or (iii) exhibits characteristics that the sub-adviser determines, based on its proprietary
valuation models, indicate the company’s shares are trading at a discount to the company’s intrinsic value. The Fund’s sub-adviser currently defines the Value Indices to include the following indices: S&P 500 Value Index, Russell 3000 Value Index, Morningstar Large Cap Value Index, Morningstar Mid Cap Value Index, Morningstar Small Cap Value Index, and S&P Composite 1500 Value Index.
The sub-adviser generally sells securities (i) when it believes they are trading for more than their intrinsic value, (ii) to generate tax losses to offset taxable gains, or (iii) if additional cash is needed to fund redemptions.
The Fund is the successor of the FPA Queens Road Value Fund, formerly a series of Bragg Capital Trust (the “Predecessor Fund”). The Fund acquired the assets and liabilities of the Predecessor Fund following the reorganization of the Predecessor Fund on July 28, 2023. As a result of the acquisition, the Fund is the accounting successor of the Predecessor Fund. Performance results shown in the bar chart and the performance table below for periods prior to July 28, 2023 reflect the performance of the Predecessor Fund.
The bar chart and Average Annual Total Returns table below provide an indication of the risks of investing in the Fund by showing changes in the Fund’s performance from year to year and by showing how the Fund’s average annual returns for the 1, 5 and 10 calendar year periods compare with those of the S&P 500 Index, a broad-based market index, and the S&P 500 Value Index, an additional index that provides a measure of the U.S. large cap value equity market. The chart and table reflect the reinvestment of dividends and distributions. In addition, the Fund’s past performance (before and after taxes) is not necessarily an indication of how the Fund will perform in the future.
To obtain updated monthly performance information, please visit the Fund’s website at https://fpa.com/funds or call (800) 982‑4372.
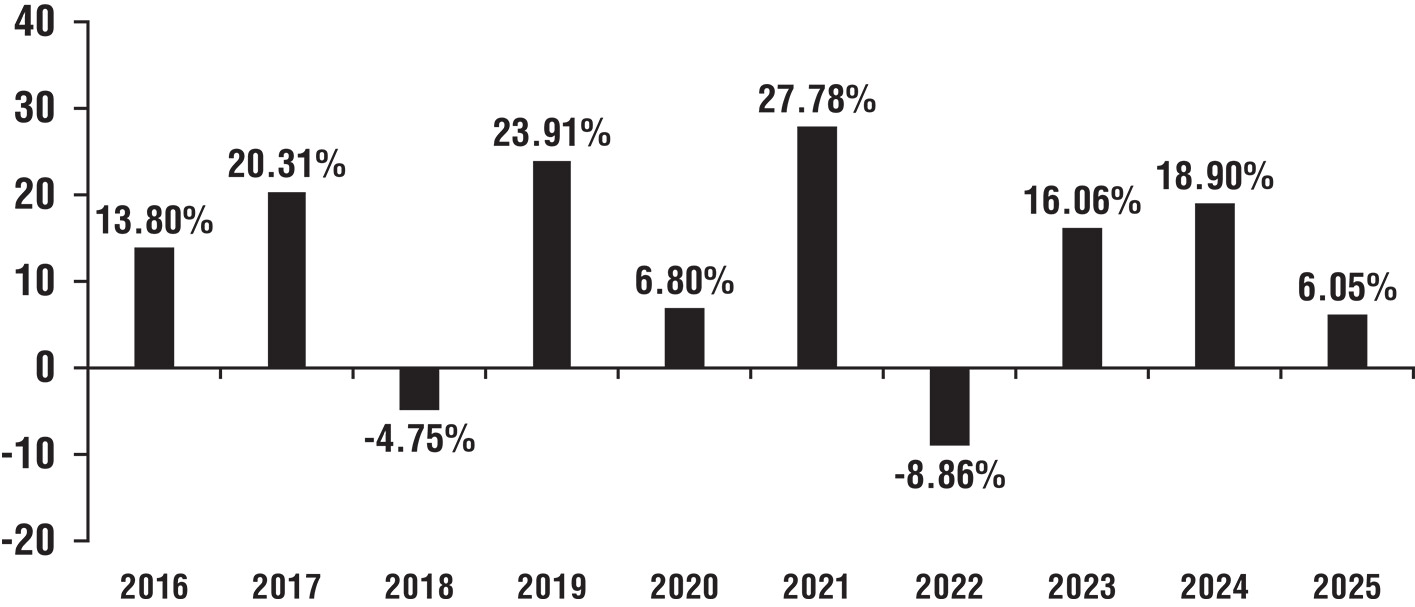
The year-to-date return as of June 30, 2026, was 11.18%.
Average Annual Total Returns |
|
| One |
|
| Five |
|
| Ten |
| |||
Return Before Taxes |
|
| 6.05 | % |
|
| 11.26 | % |
|
| 11.39 | % |
|
Return After Taxes on Distributions1 |
|
| 5.36 | % |
|
| 9.84 | % |
|
| 10.02 | % |
|
Return After Taxes on Distributions and Sale of Fund Shares1 |
|
| 4.08 | % |
|
| 8.72 | % |
|
| 9.07 | % |
|
S&P 500 Index |
|
| 17.88 | % |
|
| 14.42 | % |
|
| 14.82 | % |
|
S&P 500 Value Index |
|
| 13.19 | % |
|
| 12.96 | % |
|
| 11.73 | % |
|