Pay Versus Performance
Provided below is our pay versus performance disclosure as required pursuant to Item 402(v) of Regulation S-K promulgated under the Exchange Act. As required by Item 402(v), we have included:
Note: pursuant to Item 402(v)(8), Lite Strategy, as a smaller reporting company (SRC), has provided the information required by 402(v) for three years, instead of five years and is not required to provide the disclosure required by 402(v)(2)(iv) or 402(v)(5) with respect to the total shareholder return of any peer group, or our-Selected Measure disclosure required by 402 (v)(2)(vi), or the Tabular List provided pursuant to 402(v)(6).
Given our current pay program, the only difference between the SCT and CAP amounts is the value of equity awards, which for purposes of the SCT is based on the grant date fair value of equity awards granted during the year and for purposes of CAP is based on the year over year change in the fair value of equity awards that are unvested as of the end of the year, or that vested, or were forfeited during the year.
Pay Versus Performance Table. In accordance with Item 402(v) and under rules adopted by the SEC pursuant to the Dodd-Frank Wall Street Reform and Consumer Protection Act of 2010, we are providing the tabular disclosure for our Chief Executive Officer (our Principal Executive Officer or PEO) and the average of our NEOs other than the PEO for fiscal years 2024, 2025 and 2026.
Fiscal Year |
|
Summary Compensation Table for Total Current PEO |
|
|
Compensation Actually Paid to Current PEO |
|
|
Summary Compensation Table for Total Former PEO |
|
|
Compensation Actually Paid to Former PEO |
|
|
Average Summary Compensation Table Total for Non-PEO |
|
|
Average Compensation Actually Paid to Non-PEO |
|
|
Value of Initial Fixed $100 Investment Based on Total Shareholder Return(4) |
|
|
Lite Strategy Net (Loss) Income |
|
||||||||
(a) |
|
(b) |
|
|
(c) |
|
|
(b) |
|
|
(c) |
|
|
(d) |
|
|
(e) |
|
|
(f) |
|
|
(h) |
|
||||||||
2026 |
|
$ |
1,577,150 |
|
|
$ |
1,429,975 |
|
|
$ |
— |
|
|
$ |
— |
|
|
$ |
- |
|
|
$ |
— |
|
|
$ |
18 |
|
|
$ |
(71 |
) |
2025 |
|
$ |
912,667 |
|
|
$ |
893,199 |
|
|
$ |
934,046 |
|
|
$ |
683,160 |
|
|
$ |
708,134 |
|
|
$ |
645,430 |
|
|
$ |
48 |
|
|
$ |
(16 |
) |
2024 |
|
$ |
— |
|
|
$ |
— |
|
|
$ |
894,905 |
|
|
$ |
220,789 |
|
|
$ |
730,912 |
|
|
$ |
558,052 |
|
|
$ |
57 |
|
|
$ |
18 |
|
Fiscal Year |
|
PEO |
|
Non-PEO NEOs |
2026 |
|
Justin J. File (Current) |
|
|
2025 |
|
Justin J. File (Current) |
|
Richard G. Ghalie |
2024 |
|
David M. Urso (Current) |
|
Justin J. File and Richard G. Ghalie |
|
Current PEO (File)(i) |
|
|||||||
Fiscal Year |
2024 |
|
2025 |
|
2026 |
|
|||
SCT Total |
$ |
— |
|
$ |
912,667 |
|
$ |
1,577,150 |
|
Stock and Option Award Values Reported in SCT for the Covered Year |
|
— |
|
|
— |
|
|
(595,900 |
) |
Fair Value of Outstanding Unvested Stock and Option Awards Granted in the Covered Year |
|
— |
|
|
— |
|
|
283,041 |
|
Change in Fair Value of Outstanding Unvested Stock and Option Awards from Prior Years |
|
— |
|
|
(15,787 |
) |
|
(14,060 |
) |
Fair Value of Stock and Option Awards Granted in Covered Year that Vested |
|
— |
|
|
— |
|
|
182,039 |
|
Change in Fair Value of Stock and Option Awards from Prior Years that Vested in Covered Year |
|
— |
|
|
(3,681 |
) |
|
(2,295 |
) |
Fair Value of Stock and Option Awards Forfeited during the Covered Year |
|
— |
|
|
— |
|
|
— |
|
Compensation Actually Paid |
$ |
— |
|
$ |
893,199 |
|
$ |
1,429,975 |
|
|
|
|
|
|
|
|
|||
|
Former PEO (Urso)(i) |
|
|||||||
Fiscal Year |
2024 |
|
2025 |
|
2026 |
|
|||
SCT Total |
$ |
894,905 |
|
$ |
934,046 |
|
$ |
— |
|
Stock and Option Award Values Reported in SCT for the Covered Year |
|
— |
|
|
— |
|
|
— |
|
Fair Value of Outstanding Unvested Stock and Option Awards Granted in the Covered Year |
|
— |
|
|
— |
|
|
— |
|
Change in Fair Value of Outstanding Unvested Stock and Option Awards from Prior Years |
|
(511,128 |
) |
|
— |
|
|
— |
|
Fair Value of Stock and Option Awards Granted in Covered Year that Vested |
|
— |
|
|
— |
|
|
— |
|
Change in Fair Value of Stock and Option Awards from Prior Years that Vested in Covered Year |
|
(162,988 |
) |
|
1,757 |
|
|
— |
|
Fair Value of Stock and Option Awards Forfeited during the Covered Year |
|
— |
|
|
(252,643 |
) |
|
— |
|
Compensation Actually Paid |
$ |
220,789 |
|
$ |
683,160 |
|
$ |
— |
|
|
|
|
|
|
|
|
|||
|
Average Non-PEO(i) |
|
|||||||
Fiscal Year |
2024 |
|
2025 |
|
2026 |
|
|||
SCT Total |
$ |
730,912 |
|
$ |
708,134 |
|
$ |
— |
|
Stock and Option Award Values Reported in SCT for the Covered Year |
|
(79,900 |
) |
|
— |
|
|
— |
|
Fair Value of Outstanding Unvested Stock and Option Awards Granted in the Covered Year |
|
28,797 |
|
|
— |
|
|
— |
|
Change in Fair Value of Outstanding Unvested Stock and Option Awards from Prior Years |
|
(93,289 |
) |
|
— |
|
|
— |
|
Fair Value of Stock and Option Awards Granted in Covered Year that Vested |
|
— |
|
|
— |
|
|
— |
|
Change in Fair Value of Stock and Option Awards from Prior Years that Vested in Covered Year |
|
(28,468 |
) |
|
154 |
|
|
— |
|
Fair Value of Stock and Option Awards Forfeited during the Covered Year |
|
— |
|
|
(62,858 |
) |
|
— |
|
Compensation Actually Paid |
$ |
558,052 |
|
$ |
645,430 |
|
$ |
— |
|
|
|
|
|
|
|
|
|||
(i) The fair value of options awards used to calculate CAP was determined using the Black-Scholes option pricing model, in accordance with FASB 718 |
|
||||||||
Fiscal Year |
|
PEO |
|
Non-PEO NEOs |
2026 |
|
Justin J. File (Current) |
|
|
2025 |
|
Justin J. File (Current) |
|
Richard G. Ghalie |
2024 |
|
David M. Urso (Current) |
|
Justin J. File and Richard G. Ghalie |
|
Current PEO (File)(i) |
|
|||||||
Fiscal Year |
2024 |
|
2025 |
|
2026 |
|
|||
SCT Total |
$ |
— |
|
$ |
912,667 |
|
$ |
1,577,150 |
|
Stock and Option Award Values Reported in SCT for the Covered Year |
|
— |
|
|
— |
|
|
(595,900 |
) |
Fair Value of Outstanding Unvested Stock and Option Awards Granted in the Covered Year |
|
— |
|
|
— |
|
|
283,041 |
|
Change in Fair Value of Outstanding Unvested Stock and Option Awards from Prior Years |
|
— |
|
|
(15,787 |
) |
|
(14,060 |
) |
Fair Value of Stock and Option Awards Granted in Covered Year that Vested |
|
— |
|
|
— |
|
|
182,039 |
|
Change in Fair Value of Stock and Option Awards from Prior Years that Vested in Covered Year |
|
— |
|
|
(3,681 |
) |
|
(2,295 |
) |
Fair Value of Stock and Option Awards Forfeited during the Covered Year |
|
— |
|
|
— |
|
|
— |
|
Compensation Actually Paid |
$ |
— |
|
$ |
893,199 |
|
$ |
1,429,975 |
|
|
|
|
|
|
|
|
|||
|
Former PEO (Urso)(i) |
|
|||||||
Fiscal Year |
2024 |
|
2025 |
|
2026 |
|
|||
SCT Total |
$ |
894,905 |
|
$ |
934,046 |
|
$ |
— |
|
Stock and Option Award Values Reported in SCT for the Covered Year |
|
— |
|
|
— |
|
|
— |
|
Fair Value of Outstanding Unvested Stock and Option Awards Granted in the Covered Year |
|
— |
|
|
— |
|
|
— |
|
Change in Fair Value of Outstanding Unvested Stock and Option Awards from Prior Years |
|
(511,128 |
) |
|
— |
|
|
— |
|
Fair Value of Stock and Option Awards Granted in Covered Year that Vested |
|
— |
|
|
— |
|
|
— |
|
Change in Fair Value of Stock and Option Awards from Prior Years that Vested in Covered Year |
|
(162,988 |
) |
|
1,757 |
|
|
— |
|
Fair Value of Stock and Option Awards Forfeited during the Covered Year |
|
— |
|
|
(252,643 |
) |
|
— |
|
Compensation Actually Paid |
$ |
220,789 |
|
$ |
683,160 |
|
$ |
— |
|
|
|
|
|
|
|
|
|||
|
Average Non-PEO(i) |
|
|||||||
Fiscal Year |
2024 |
|
2025 |
|
2026 |
|
|||
SCT Total |
$ |
730,912 |
|
$ |
708,134 |
|
$ |
— |
|
Stock and Option Award Values Reported in SCT for the Covered Year |
|
(79,900 |
) |
|
— |
|
|
— |
|
Fair Value of Outstanding Unvested Stock and Option Awards Granted in the Covered Year |
|
28,797 |
|
|
— |
|
|
— |
|
Change in Fair Value of Outstanding Unvested Stock and Option Awards from Prior Years |
|
(93,289 |
) |
|
— |
|
|
— |
|
Fair Value of Stock and Option Awards Granted in Covered Year that Vested |
|
— |
|
|
— |
|
|
— |
|
Change in Fair Value of Stock and Option Awards from Prior Years that Vested in Covered Year |
|
(28,468 |
) |
|
154 |
|
|
— |
|
Fair Value of Stock and Option Awards Forfeited during the Covered Year |
|
— |
|
|
(62,858 |
) |
|
— |
|
Compensation Actually Paid |
$ |
558,052 |
|
$ |
645,430 |
|
$ |
— |
|
|
|
|
|
|
|
|
|||
(i) The fair value of options awards used to calculate CAP was determined using the Black-Scholes option pricing model, in accordance with FASB 718 |
|
||||||||
|
Current PEO (File)(i) |
|
|||||||
Fiscal Year |
2024 |
|
2025 |
|
2026 |
|
|||
SCT Total |
$ |
— |
|
$ |
912,667 |
|
$ |
1,577,150 |
|
Stock and Option Award Values Reported in SCT for the Covered Year |
|
— |
|
|
— |
|
|
(595,900 |
) |
Fair Value of Outstanding Unvested Stock and Option Awards Granted in the Covered Year |
|
— |
|
|
— |
|
|
283,041 |
|
Change in Fair Value of Outstanding Unvested Stock and Option Awards from Prior Years |
|
— |
|
|
(15,787 |
) |
|
(14,060 |
) |
Fair Value of Stock and Option Awards Granted in Covered Year that Vested |
|
— |
|
|
— |
|
|
182,039 |
|
Change in Fair Value of Stock and Option Awards from Prior Years that Vested in Covered Year |
|
— |
|
|
(3,681 |
) |
|
(2,295 |
) |
Fair Value of Stock and Option Awards Forfeited during the Covered Year |
|
— |
|
|
— |
|
|
— |
|
Compensation Actually Paid |
$ |
— |
|
$ |
893,199 |
|
$ |
1,429,975 |
|
|
|
|
|
|
|
|
|||
|
Former PEO (Urso)(i) |
|
|||||||
Fiscal Year |
2024 |
|
2025 |
|
2026 |
|
|||
SCT Total |
$ |
894,905 |
|
$ |
934,046 |
|
$ |
— |
|
Stock and Option Award Values Reported in SCT for the Covered Year |
|
— |
|
|
— |
|
|
— |
|
Fair Value of Outstanding Unvested Stock and Option Awards Granted in the Covered Year |
|
— |
|
|
— |
|
|
— |
|
Change in Fair Value of Outstanding Unvested Stock and Option Awards from Prior Years |
|
(511,128 |
) |
|
— |
|
|
— |
|
Fair Value of Stock and Option Awards Granted in Covered Year that Vested |
|
— |
|
|
— |
|
|
— |
|
Change in Fair Value of Stock and Option Awards from Prior Years that Vested in Covered Year |
|
(162,988 |
) |
|
1,757 |
|
|
— |
|
Fair Value of Stock and Option Awards Forfeited during the Covered Year |
|
— |
|
|
(252,643 |
) |
|
— |
|
Compensation Actually Paid |
$ |
220,789 |
|
$ |
683,160 |
|
$ |
— |
|
|
|
|
|
|
|
|
|||
|
Average Non-PEO(i) |
|
|||||||
Fiscal Year |
2024 |
|
2025 |
|
2026 |
|
|||
SCT Total |
$ |
730,912 |
|
$ |
708,134 |
|
$ |
— |
|
Stock and Option Award Values Reported in SCT for the Covered Year |
|
(79,900 |
) |
|
— |
|
|
— |
|
Fair Value of Outstanding Unvested Stock and Option Awards Granted in the Covered Year |
|
28,797 |
|
|
— |
|
|
— |
|
Change in Fair Value of Outstanding Unvested Stock and Option Awards from Prior Years |
|
(93,289 |
) |
|
— |
|
|
— |
|
Fair Value of Stock and Option Awards Granted in Covered Year that Vested |
|
— |
|
|
— |
|
|
— |
|
Change in Fair Value of Stock and Option Awards from Prior Years that Vested in Covered Year |
|
(28,468 |
) |
|
154 |
|
|
— |
|
Fair Value of Stock and Option Awards Forfeited during the Covered Year |
|
— |
|
|
(62,858 |
) |
|
— |
|
Compensation Actually Paid |
$ |
558,052 |
|
$ |
645,430 |
|
$ |
— |
|
|
|
|
|
|
|
|
|||
(i) The fair value of options awards used to calculate CAP was determined using the Black-Scholes option pricing model, in accordance with FASB 718 |
|
||||||||
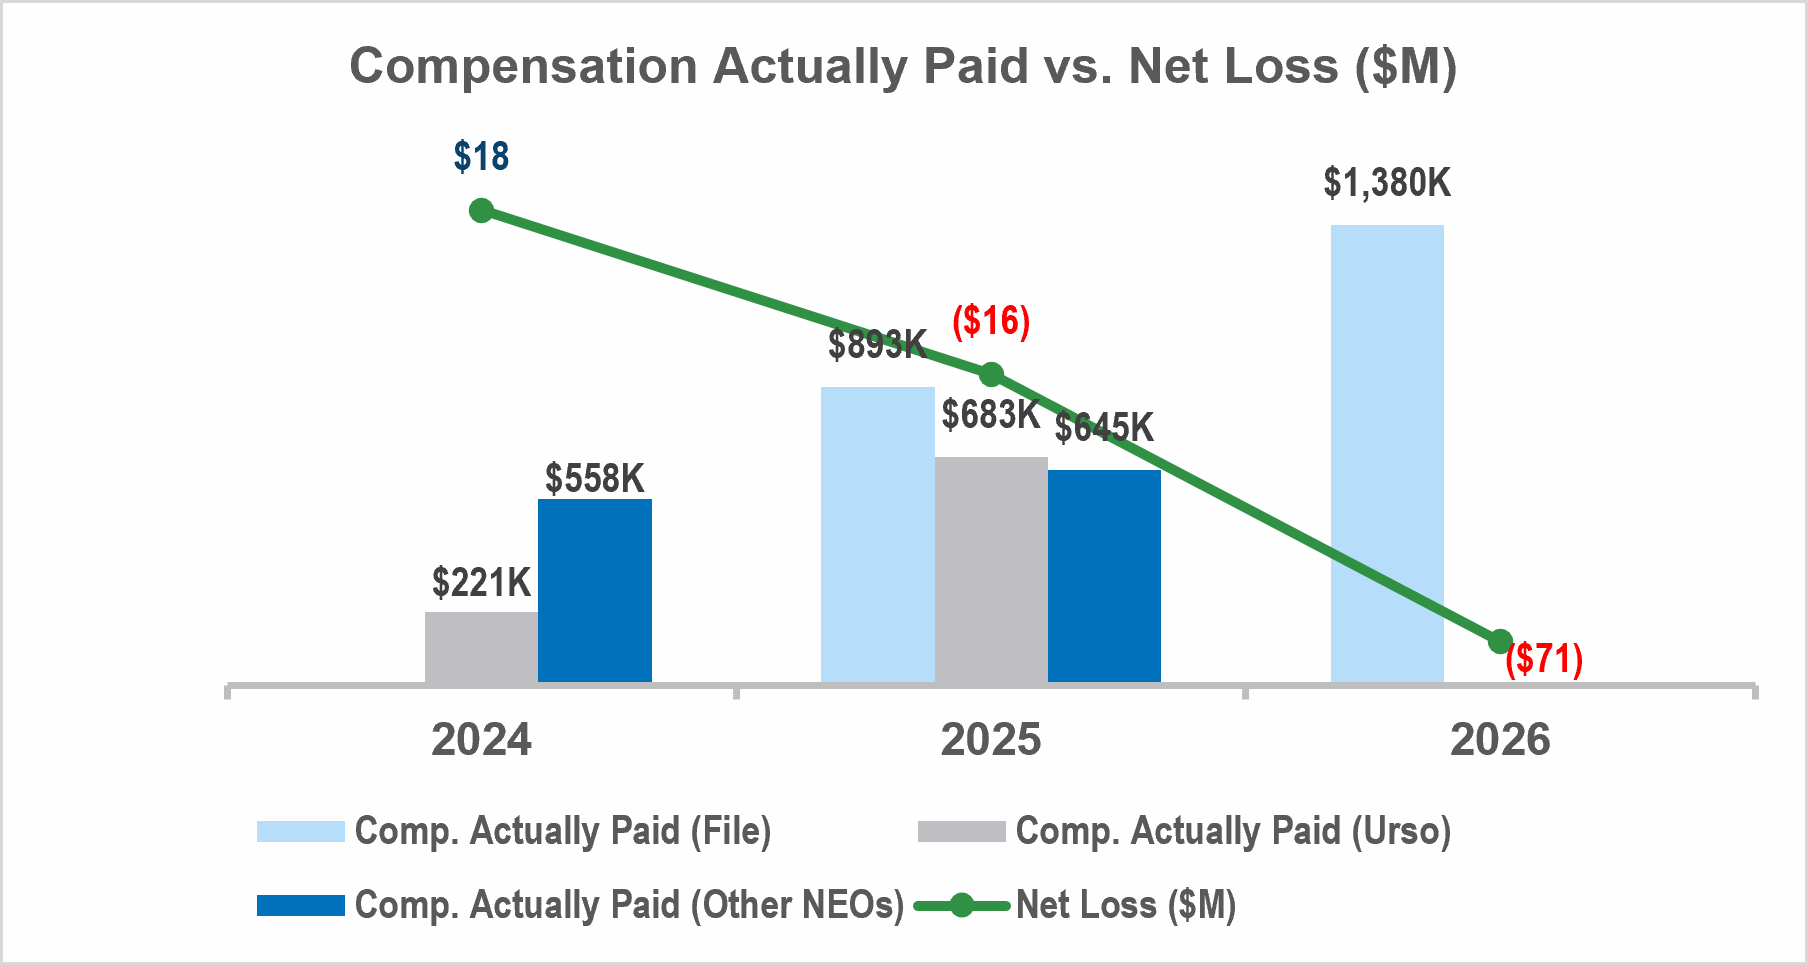
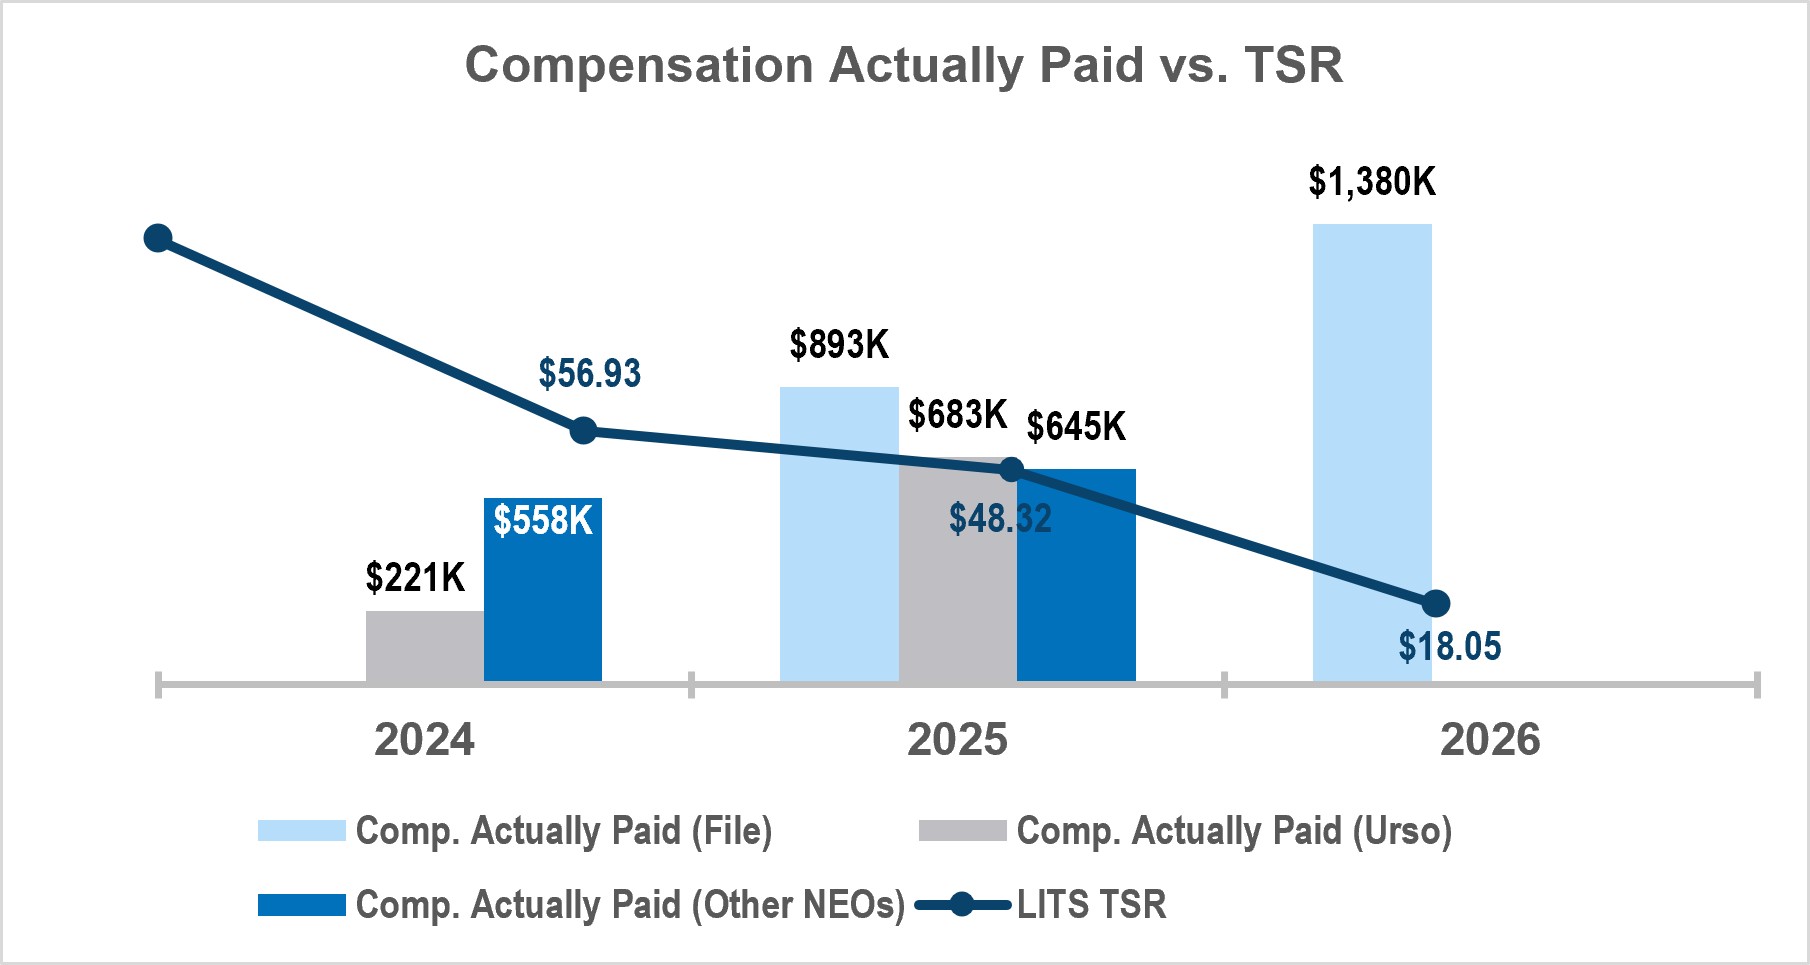
Relationship between CAP and TSR. The chart below reflects the relationship between the PEO and average non-PEO NEO CAP versus our TSR and the Peer Group TSR.
Relationship between CAP and GAAP Net Income (Loss). The chart below reflects the relationship between the PEO and average non-PEO NEO CAP and our GAAP Net Income (Loss).