Shareholder Report
|
12 Months Ended |
|
Jul. 31, 2026
USD ($)
Holding
|
|---|
| Shareholder Report [Line Items] |
|
| Document Type |
N-CSR
|
| Amendment Flag |
false
|
| Registrant Name |
Federated Hermes MDT Series
|
| Entity Central Index Key |
0001363526
|
| Entity Investment Company Type |
N-1A
|
| Document Period End Date |
Jul. 31, 2026
|
| Shareholder Report Annual or Semi-Annual |
Annual Shareholder Report
|
| C000035049 |
|
| Shareholder Report [Line Items] |
|
| Fund Name |
Federated Hermes MDT Large Cap Growth Fund
|
| Class Name |
Class A Shares
|
| Trading Symbol |
QALGX
|
| Annual or Semi-Annual Statement [Text Block] |
This annual shareholder report contains important information about the Federated Hermes MDT Large Cap Growth Fund (the "Fund") for the period of August 1, 2025 to July 31, 2026.
|
| Additional Information [Text Block] |
You can find additional information at FederatedHermes.com/us/FundInformation. You can also request this information by contacting us at 1-800-341-7400, Option 4, or your financial advisor.
|
| Material Fund Change Notice [Text Block] |
This report describes changes made to the Fund during the reporting period.
|
| Additional Information Phone Number |
1-800-341-7400
|
| Additional Information Website |
FederatedHermes.com/us/FundInformation
|
| Expenses [Text Block] |
What were the Fund costs for the last year? (based on a hypothetical $10,000 investment) Table SummaryClass Name | Costs of a $10,000 investment | Costs paid as a percentage of a $10,000 investment |
|---|
Class A Shares | $105 | 1.00% |
|---|
|
| Expenses Paid, Amount |
$ 105
|
| Expense Ratio, Percent |
1.00%
|
| Factors Affecting Performance [Text Block] |
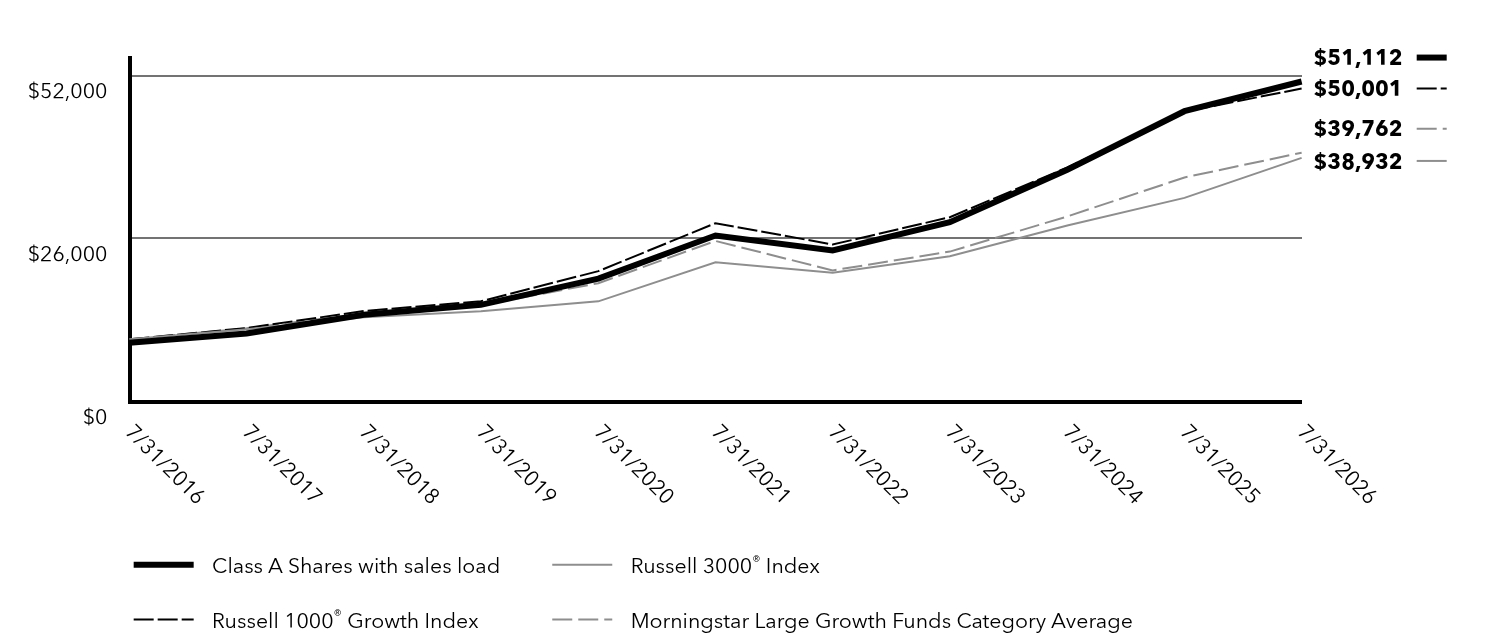
Management's Discussion of Fund PerformanceThe following discussion compares the performance of the Fund to the Russell 1000 Growth Index to show how the Fund’s performance compares to the returns of similar investments for the reporting period. See the Average Annual Total Returns table below for the returns of the Fund and related indexes, including the Russell 3000 Index, a required broad-based index, which represents approximately 98% of investable U.S. equities by market capitalization. The Fund seeks to provide long-term capital appreciation by investing primarily in common stocks of large-sized U.S. companies. Top Contributors to Performance Strong stock selection among mature companies with very high analyst conviction contributed positively to Fund relative performance. By sector, stock selection in Information Technology, Consumer Discretionary and Industrials aided performance. Top individual Fund holdings that contributed positively to performance included overweight positions in Teradyne, Inc. and Lam Research Corporation, as well as an underweight position in Microsoft Corporation.
Top Detractors from Performance Poor stock selection among companies with improving earnings-to-price ratios and negative analyst conviction detracted from Fund relative performance. By sector, stock selection in Consumer Staples and Communication Services detracted from performance. Top individual Fund holdings that detracted from performance included an overweight position in Adobe Inc., as well as underweight positions in Apple Inc., and Eli Lilly and Company.
|
| Performance Past Does Not Indicate Future [Text] |
Keep in mind that the Fund’s past performance is not a predictor of how the Fund will perform in the future.
|
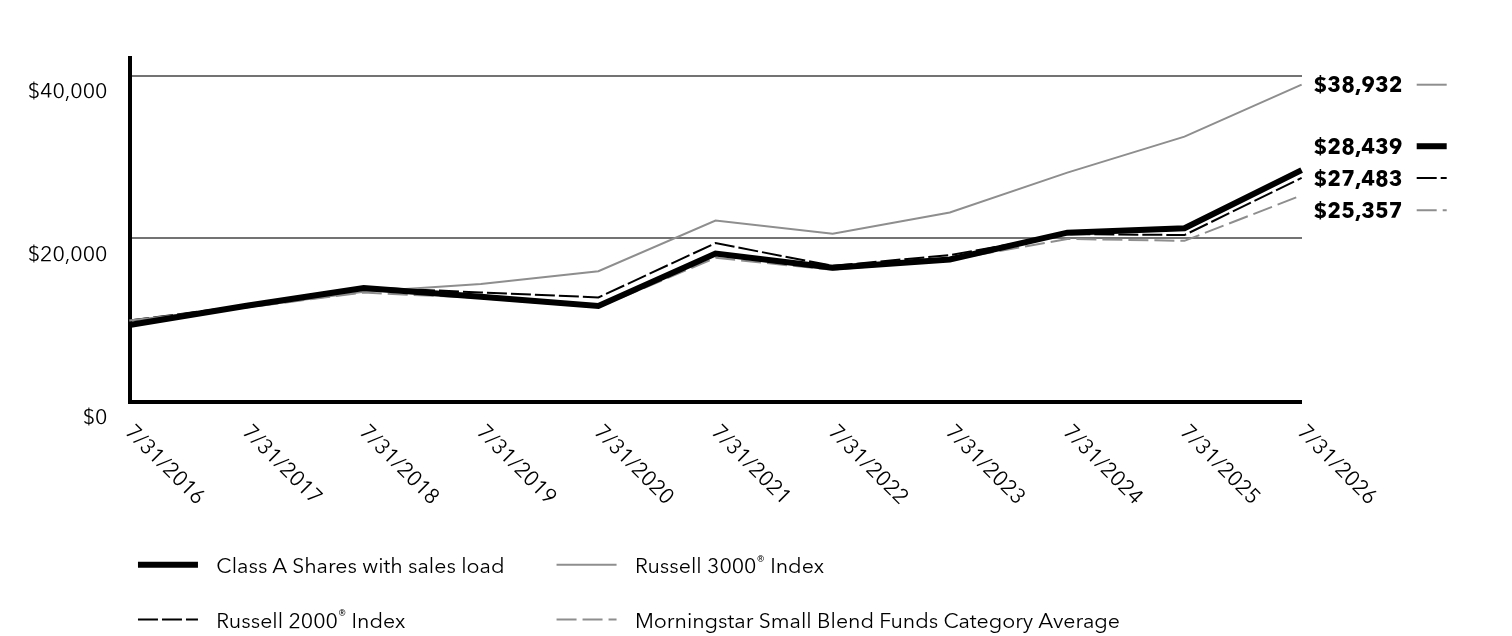
| Line Graph [Table Text Block] |
Table Summary | Class A Shares with sales load | Russell 3000® Index | Russell 1000® Growth Index | Morningstar Large Growth Funds Category Average |
|---|
7/31/2016 | $9,452 | $10,000 | $10,000 | $10,000 |
|---|
7/31/2017 | $10,933 | $11,614 | $11,805 | $11,744 |
|---|
7/31/2018 | $13,926 | $13,517 | $14,502 | $14,124 |
|---|
7/31/2019 | $15,497 | $14,470 | $16,071 | $15,414 |
|---|
7/31/2020 | $19,668 | $16,052 | $20,867 | $18,950 |
|---|
7/31/2021 | $26,551 | $22,268 | $28,520 | $25,685 |
|---|
7/31/2022 | $24,180 | $20,631 | $25,118 | $20,990 |
|---|
7/31/2023 | $28,668 | $23,240 | $29,466 | $23,986 |
|---|
7/31/2024 | $37,053 | $28,138 | $37,403 | $29,589 |
|---|
7/31/2025 | $46,376 | $32,551 | $46,285 | $35,810 |
|---|
7/31/2026 | $51,112 | $38,932 | $50,001 | $39,762 |
|---|
|
| Average Annual Return [Table Text Block] |
Table SummaryFund/Index | 1 Year | 5 Years | 10 Years |
|---|
Class A Shares with sales load | 4.16% | 12.71% | 17.72% |
|---|
Class A Shares without sales load | 10.21% | 14.00% | 18.39% |
|---|
Russell 3000® Index | 19.60% | 11.82% | 14.56% |
|---|
Russell 1000® Growth Index | 8.03% | 11.89% | 17.46% |
|---|
Morningstar Large Growth Funds Category Average | 11.14% | 9.09% | 14.78% |
|---|
|
| No Deduction of Taxes [Text Block] |
The graph and table do not reflect the deduction of taxes that a shareholder would pay on fund distributions or redemption of fund shares.
|
| Updated Performance Information Location [Text Block] |
FederatedHermes.com/us/FundInformation
|
| AssetsNet |
$ 5,610,967,633
|
| Holdings Count | Holding |
98
|
| Advisory Fees Paid, Amount |
$ 27,685,859
|
| InvestmentCompanyPortfolioTurnover |
100.00%
|
| Additional Fund Statistics [Text Block] |
- Net Assets$5,610,967,633
- Number of Investments98
- Portfolio Turnover100%
- Total Advisory Fees Paid$27,685,859
|
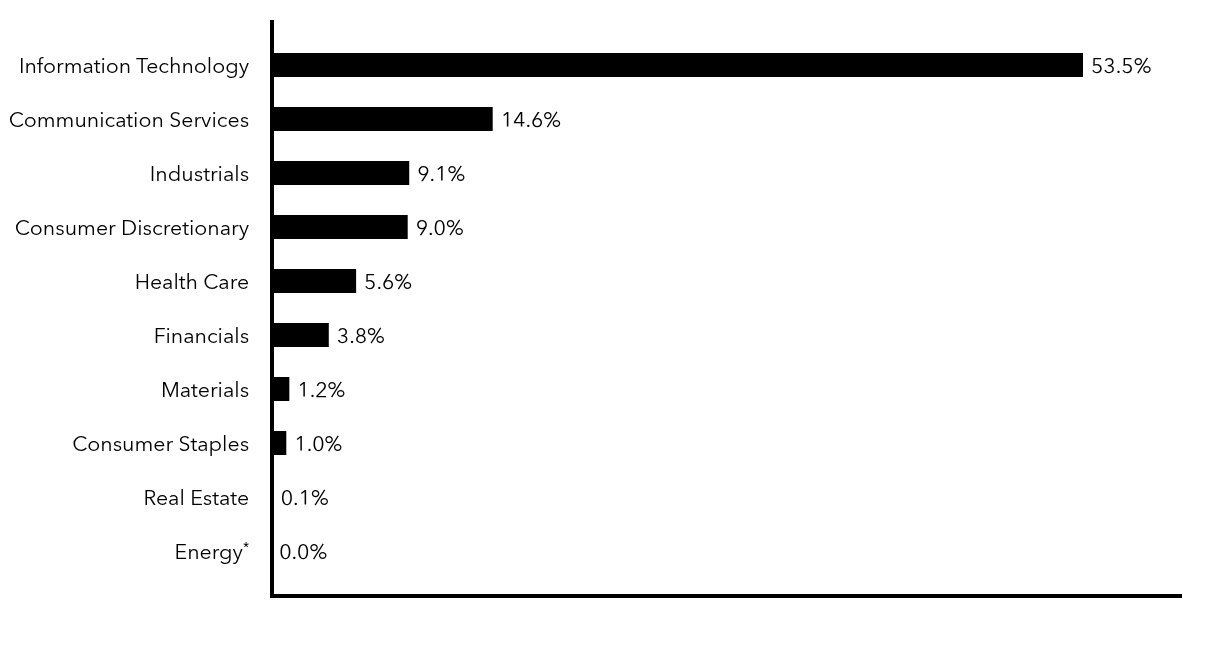
| Holdings [Text Block] |
Top Sectors (% of Net Assets)Table SummaryValue | Value |
|---|
EnergyFootnote Reference* | 0.0% | Real Estate | 0.1% | Consumer Staples | 1.0% | Materials | 1.2% | Financials | 3.8% | Health Care | 5.6% | Consumer Discretionary | 9.0% | Industrials | 9.1% | Communication Services | 14.6% | Information Technology | 53.5% | | Footnote | Description | Footnote* | Represents less than 0.1%. |
|
| Material Fund Change [Text Block] |
Following is a summary of material changes made to the Fund during the reporting period. For more complete and current information, you may review the Fund’s disclosure documents on its webpage at FederatedHermes.com/us/FundInformation or upon request at 1-800-341-7400, Option 4, or by contacting your financial advisor. Effective September 28, 2026, the Fund’s non-fundamental 80% investment policy will change to the following: Under normal circumstances, the Fund will invest its assets so that at least 80% of its net assets (plus any borrowings for investment purposes) are invested in large-cap growth investments. For purposes of this policy, large-cap investments will be defined as companies with market capitalizations within the range of companies in the Russell 1000 Index, and growth investments will be defined as companies with growth characteristics that meet the applicable parameters for inclusion in the Russell 3000 Growth Index. |
| Material Fund Change Strategies [Text Block] |
Effective September 28, 2026, the Fund’s non-fundamental 80% investment policy will change to the following: Under normal circumstances, the Fund will invest its assets so that at least 80% of its net assets (plus any borrowings for investment purposes) are invested in large-cap growth investments. For purposes of this policy, large-cap investments will be defined as companies with market capitalizations within the range of companies in the Russell 1000 Index, and growth investments will be defined as companies with growth characteristics that meet the applicable parameters for inclusion in the Russell 3000 Growth Index.
|
| Summary of Change Legend [Text Block] |
Following is a summary of material changes made to the Fund during the reporting period. For more complete and current information, you may review the Fund’s disclosure documents on its webpage at FederatedHermes.com/us/FundInformation or upon request at 1-800-341-7400, Option 4, or by contacting your financial advisor.
|
| Updated Prospectus Phone Number |
1-800-341-7400
|
| Updated Prospectus Web Address |
<span style="box-sizing: border-box; color: rgb(0, 0, 0); display: inline; flex-wrap: nowrap; font-size: 12px; font-weight: 400; grid-area: auto; line-height: 18px; margin: 0px; overflow: visible; text-align: left; text-align-last: auto; white-space-collapse: preserve-breaks;"><span style="text-decoration: underline; box-sizing: border-box; color: rgb(0, 0, 0); display: inline; flex-wrap: nowrap; font-size: 12px; font-weight: 400; grid-area: auto; line-height: 18px; margin: 0px; overflow: visible; text-align: left; text-align-last: auto; white-space-collapse: preserve-breaks;">FederatedHermes.com/us/FundInformation</span></span>
|
| C000035050 |
|
| Shareholder Report [Line Items] |
|
| Fund Name |
Federated Hermes MDT Large Cap Growth Fund
|
| Class Name |
Class C Shares
|
| Trading Symbol |
QCLGX
|
| Annual or Semi-Annual Statement [Text Block] |
This annual shareholder report contains important information about the Federated Hermes MDT Large Cap Growth Fund (the "Fund") for the period of August 1, 2025 to July 31, 2026.
|
| Additional Information [Text Block] |
You can find additional information at FederatedHermes.com/us/FundInformation. You can also request this information by contacting us at 1-800-341-7400, Option 4, or your financial advisor.
|
| Material Fund Change Notice [Text Block] |
This report describes changes made to the Fund during the reporting period.
|
| Additional Information Phone Number |
1-800-341-7400
|
| Additional Information Website |
FederatedHermes.com/us/FundInformation
|
| Expenses [Text Block] |
What were the Fund costs for the last year? (based on a hypothetical $10,000 investment) Table SummaryClass Name | Costs of a $10,000 investment | Costs paid as a percentage of a $10,000 investment |
|---|
Class C Shares | $186 | 1.78% |
|---|
|
| Expenses Paid, Amount |
$ 186
|
| Expense Ratio, Percent |
1.78%
|
| Factors Affecting Performance [Text Block] |
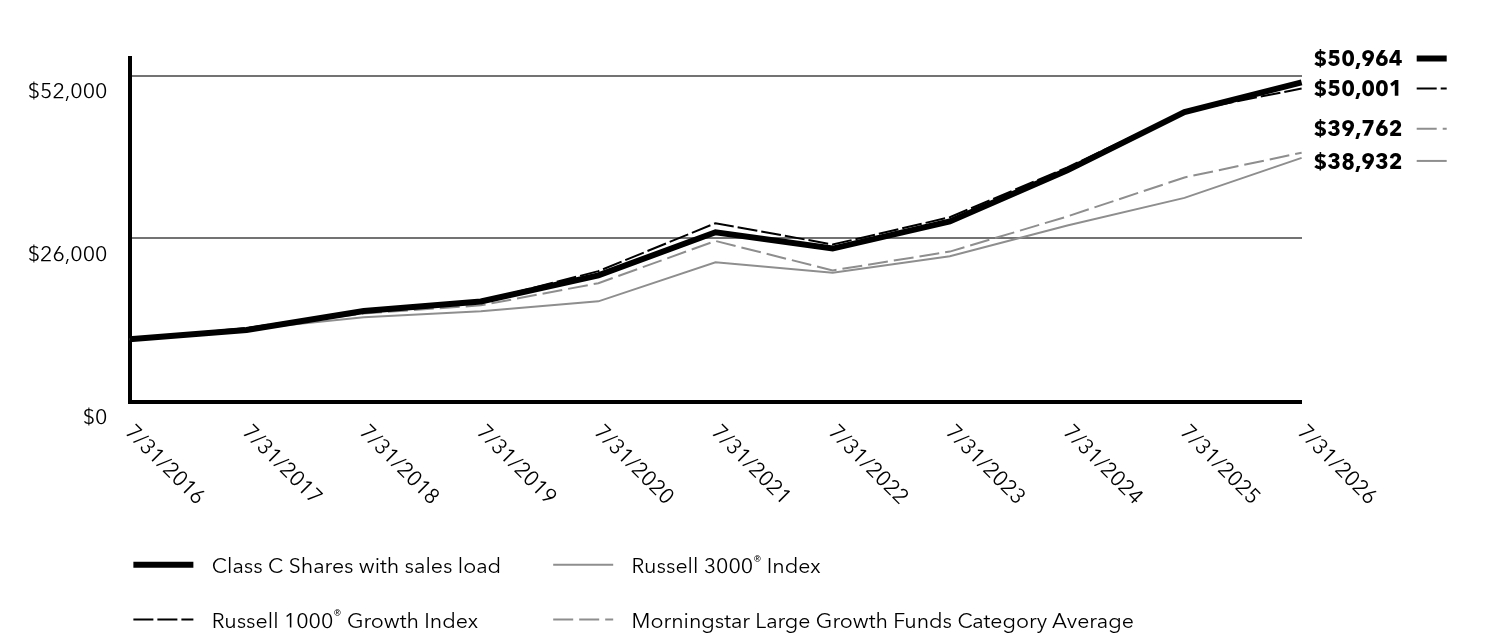
Management's Discussion of Fund PerformanceThe following discussion compares the performance of the Fund to the Russell 1000 Growth Index to show how the Fund’s performance compares to the returns of similar investments for the reporting period. See the Average Annual Total Returns table below for the returns of the Fund and related indexes, including the Russell 3000 Index, a required broad-based index, which represents approximately 98% of investable U.S. equities by market capitalization. The Fund seeks to provide long-term capital appreciation by investing primarily in common stocks of large-sized U.S. companies. Top Contributors to Performance Strong stock selection among mature companies with very high analyst conviction contributed positively to Fund relative performance. By sector, stock selection in Information Technology, Consumer Discretionary and Industrials aided performance. Top individual Fund holdings that contributed positively to performance included overweight positions in Teradyne, Inc. and Lam Research Corporation, as well as an underweight position in Microsoft Corporation.
Top Detractors from Performance Poor stock selection among companies with improving earnings-to-price ratios and negative analyst conviction detracted from Fund relative performance. By sector, stock selection in Consumer Staples and Communication Services detracted from performance. Top individual Fund holdings that detracted from performance included an overweight position in Adobe Inc., as well as underweight positions in Apple Inc., and Eli Lilly and Company.
|
| Performance Past Does Not Indicate Future [Text] |
Keep in mind that the Fund’s past performance is not a predictor of how the Fund will perform in the future.
|
| Line Graph [Table Text Block] |
Table Summary | Class C Shares with sales load | Russell 3000® Index | Russell 1000® Growth Index | Morningstar Large Growth Funds Category Average |
|---|
7/31/2016 | $10,000 | $10,000 | $10,000 | $10,000 |
|---|
7/31/2017 | $11,482 | $11,614 | $11,805 | $11,744 |
|---|
7/31/2018 | $14,516 | $13,517 | $14,502 | $14,124 |
|---|
7/31/2019 | $16,035 | $14,470 | $16,071 | $15,414 |
|---|
7/31/2020 | $20,202 | $16,052 | $20,867 | $18,950 |
|---|
7/31/2021 | $27,072 | $22,268 | $28,520 | $25,685 |
|---|
7/31/2022 | $24,473 | $20,631 | $25,118 | $20,990 |
|---|
7/31/2023 | $28,802 | $23,240 | $29,466 | $23,986 |
|---|
7/31/2024 | $36,946 | $28,138 | $37,403 | $29,589 |
|---|
7/31/2025 | $46,243 | $32,551 | $46,285 | $35,810 |
|---|
7/31/2026 | $50,964 | $38,932 | $50,001 | $39,762 |
|---|
|
| Average Annual Return [Table Text Block] |
Table SummaryFund/Index | 1 Year | 5 Years | 10 Years |
|---|
Class C Shares with sales load | 8.39% | 13.15% | 17.69% |
|---|
Class C Shares without sales load | 9.39% | 13.15% | 17.69% |
|---|
Russell 3000® Index | 19.60% | 11.82% | 14.56% |
|---|
Russell 1000® Growth Index | 8.03% | 11.89% | 17.46% |
|---|
Morningstar Large Growth Funds Category Average | 11.14% | 9.09% | 14.78% |
|---|
|
| No Deduction of Taxes [Text Block] |
The graph and table do not reflect the deduction of taxes that a shareholder would pay on fund distributions or redemption of fund shares.
|
| Updated Performance Information Location [Text Block] |
FederatedHermes.com/us/FundInformation
|
| AssetsNet |
$ 5,610,967,633
|
| Holdings Count | Holding |
98
|
| Advisory Fees Paid, Amount |
$ 27,685,859
|
| InvestmentCompanyPortfolioTurnover |
100.00%
|
| Additional Fund Statistics [Text Block] |
- Net Assets$5,610,967,633
- Number of Investments98
- Portfolio Turnover100%
- Total Advisory Fees Paid$27,685,859
|
| Holdings [Text Block] |
Top Sectors (% of Net Assets)Table SummaryValue | Value |
|---|
EnergyFootnote Reference* | 0.0% | Real Estate | 0.1% | Consumer Staples | 1.0% | Materials | 1.2% | Financials | 3.8% | Health Care | 5.6% | Consumer Discretionary | 9.0% | Industrials | 9.1% | Communication Services | 14.6% | Information Technology | 53.5% | | Footnote | Description | Footnote* | Represents less than 0.1%. |
|
| Material Fund Change [Text Block] |
Following is a summary of material changes made to the Fund during the reporting period. For more complete and current information, you may review the Fund’s disclosure documents on its webpage at FederatedHermes.com/us/FundInformation or upon request at 1-800-341-7400, Option 4, or by contacting your financial advisor. Effective September 28, 2026, the Fund’s non-fundamental 80% investment policy will change to the following: Under normal circumstances, the Fund will invest its assets so that at least 80% of its net assets (plus any borrowings for investment purposes) are invested in large-cap growth investments. For purposes of this policy, large-cap investments will be defined as companies with market capitalizations within the range of companies in the Russell 1000 Index, and growth investments will be defined as companies with growth characteristics that meet the applicable parameters for inclusion in the Russell 3000 Growth Index. |
| Material Fund Change Strategies [Text Block] |
Effective September 28, 2026, the Fund’s non-fundamental 80% investment policy will change to the following: Under normal circumstances, the Fund will invest its assets so that at least 80% of its net assets (plus any borrowings for investment purposes) are invested in large-cap growth investments. For purposes of this policy, large-cap investments will be defined as companies with market capitalizations within the range of companies in the Russell 1000 Index, and growth investments will be defined as companies with growth characteristics that meet the applicable parameters for inclusion in the Russell 3000 Growth Index.
|
| Summary of Change Legend [Text Block] |
Following is a summary of material changes made to the Fund during the reporting period. For more complete and current information, you may review the Fund’s disclosure documents on its webpage at FederatedHermes.com/us/FundInformation or upon request at 1-800-341-7400, Option 4, or by contacting your financial advisor.
|
| Updated Prospectus Phone Number |
1-800-341-7400
|
| Updated Prospectus Web Address |
<span style="box-sizing: border-box; color: rgb(0, 0, 0); display: inline; flex-wrap: nowrap; font-size: 12px; font-weight: 400; grid-area: auto; line-height: 18px; margin: 0px; overflow: visible; text-align: left; text-align-last: auto; white-space-collapse: preserve-breaks;"><span style="text-decoration: underline; box-sizing: border-box; color: rgb(0, 0, 0); display: inline; flex-wrap: nowrap; font-size: 12px; font-weight: 400; grid-area: auto; line-height: 18px; margin: 0px; overflow: visible; text-align: left; text-align-last: auto; white-space-collapse: preserve-breaks;">FederatedHermes.com/us/FundInformation</span></span>
|
| C000035051 |
|
| Shareholder Report [Line Items] |
|
| Fund Name |
Federated Hermes MDT Large Cap Growth Fund
|
| Class Name |
Institutional Shares
|
| Trading Symbol |
QILGX
|
| Annual or Semi-Annual Statement [Text Block] |
This annual shareholder report contains important information about the Federated Hermes MDT Large Cap Growth Fund (the "Fund") for the period of August 1, 2025 to July 31, 2026.
|
| Additional Information [Text Block] |
You can find additional information at FederatedHermes.com/us/FundInformation. You can also request this information by contacting us at 1-800-341-7400, Option 4, or your financial advisor.
|
| Material Fund Change Notice [Text Block] |
This report describes changes made to the Fund during the reporting period.
|
| Additional Information Phone Number |
1-800-341-7400
|
| Additional Information Website |
FederatedHermes.com/us/FundInformation
|
| Expenses [Text Block] |
What were the Fund costs for the last year? (based on a hypothetical $10,000 investment) Table SummaryClass Name | Costs of a $10,000 investment | Costs paid as a percentage of a $10,000 investment |
|---|
Institutional Shares | $79 | 0.75% |
|---|
|
| Expenses Paid, Amount |
$ 79
|
| Expense Ratio, Percent |
0.75%
|
| Factors Affecting Performance [Text Block] |
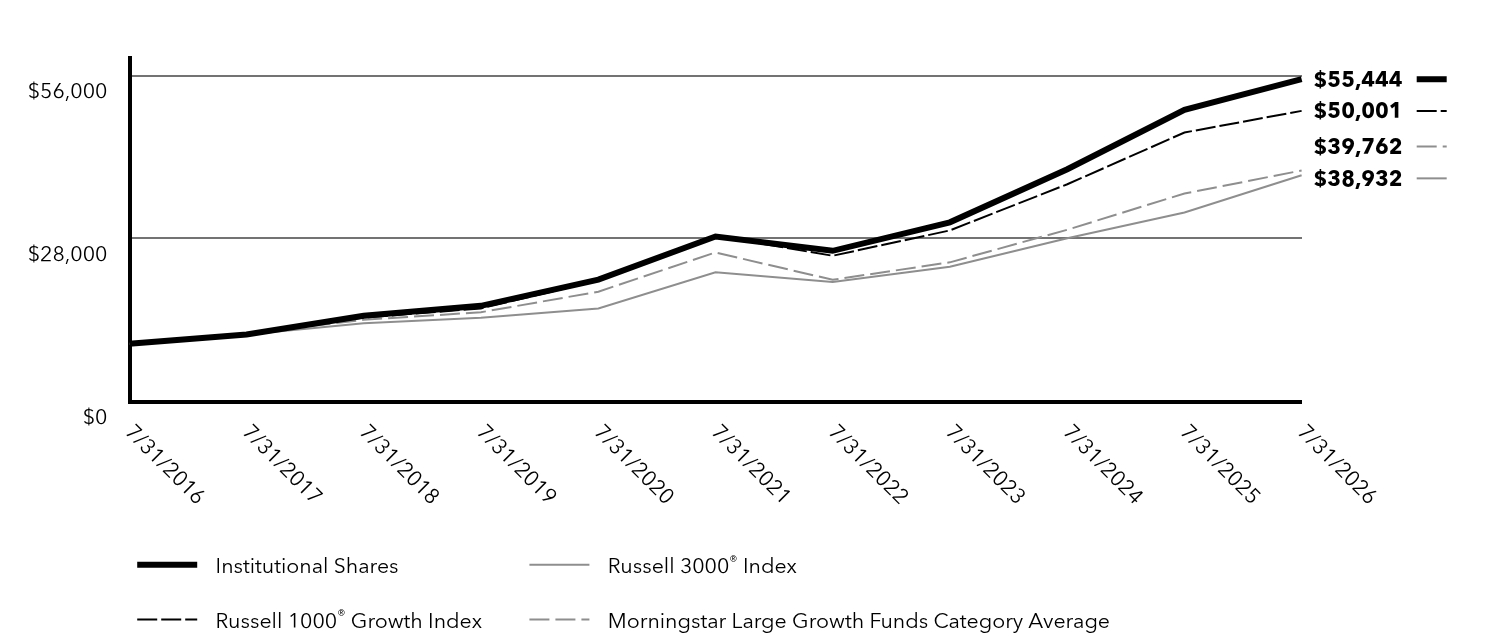
Management's Discussion of Fund PerformanceThe following discussion compares the performance of the Fund to the Russell 1000 Growth Index to show how the Fund’s performance compares to the returns of similar investments for the reporting period. See the Average Annual Total Returns table below for the returns of the Fund and related indexes, including the Russell 3000 Index, a required broad-based index, which represents approximately 98% of investable U.S. equities by market capitalization. The Fund seeks to provide long-term capital appreciation by investing primarily in common stocks of large-sized U.S. companies. Top Contributors to Performance Strong stock selection among mature companies with very high analyst conviction contributed positively to Fund relative performance. By sector, stock selection in Information Technology, Consumer Discretionary and Industrials aided performance. Top individual Fund holdings that contributed positively to performance included overweight positions in Teradyne, Inc. and Lam Research Corporation, as well as an underweight position in Microsoft Corporation.
Top Detractors from Performance Poor stock selection among companies with improving earnings-to-price ratios and negative analyst conviction detracted from Fund relative performance. By sector, stock selection in Consumer Staples and Communication Services detracted from performance. Top individual Fund holdings that detracted from performance included an overweight position in Adobe Inc., as well as underweight positions in Apple Inc., and Eli Lilly and Company.
|
| Performance Past Does Not Indicate Future [Text] |
Keep in mind that the Fund’s past performance is not a predictor of how the Fund will perform in the future.
|
| Line Graph [Table Text Block] |
Table Summary | Institutional Shares | Russell 3000® Index | Russell 1000® Growth Index | Morningstar Large Growth Funds Category Average |
|---|
7/31/2016 | $10,000 | $10,000 | $10,000 | $10,000 |
|---|
7/31/2017 | $11,598 | $11,614 | $11,805 | $11,744 |
|---|
7/31/2018 | $14,805 | $13,517 | $14,502 | $14,124 |
|---|
7/31/2019 | $16,520 | $14,470 | $16,071 | $15,414 |
|---|
7/31/2020 | $21,017 | $16,052 | $20,867 | $18,950 |
|---|
7/31/2021 | $28,434 | $22,268 | $28,520 | $25,685 |
|---|
7/31/2022 | $25,964 | $20,631 | $25,118 | $20,990 |
|---|
7/31/2023 | $30,865 | $23,240 | $29,466 | $23,986 |
|---|
7/31/2024 | $39,982 | $28,138 | $37,403 | $29,589 |
|---|
7/31/2025 | $50,180 | $32,551 | $46,285 | $35,810 |
|---|
7/31/2026 | $55,444 | $38,932 | $50,001 | $39,762 |
|---|
|
| Average Annual Return [Table Text Block] |
Table SummaryFund/Index | 1 Year | 5 Years | 10 Years |
|---|
Institutional Shares | 10.49% | 14.29% | 18.68% |
|---|
Russell 3000® Index | 19.60% | 11.82% | 14.56% |
|---|
Russell 1000® Growth Index | 8.03% | 11.89% | 17.46% |
|---|
Morningstar Large Growth Funds Category Average | 11.14% | 9.09% | 14.78% |
|---|
|
| No Deduction of Taxes [Text Block] |
The graph and table do not reflect the deduction of taxes that a shareholder would pay on fund distributions or redemption of fund shares.
|
| Updated Performance Information Location [Text Block] |
FederatedHermes.com/us/FundInformation
|
| AssetsNet |
$ 5,610,967,633
|
| Holdings Count | Holding |
98
|
| Advisory Fees Paid, Amount |
$ 27,685,859
|
| InvestmentCompanyPortfolioTurnover |
100.00%
|
| Additional Fund Statistics [Text Block] |
- Net Assets$5,610,967,633
- Number of Investments98
- Portfolio Turnover100%
- Total Advisory Fees Paid$27,685,859
|
| Holdings [Text Block] |
Top Sectors (% of Net Assets)Table SummaryValue | Value |
|---|
EnergyFootnote Reference* | 0.0% | Real Estate | 0.1% | Consumer Staples | 1.0% | Materials | 1.2% | Financials | 3.8% | Health Care | 5.6% | Consumer Discretionary | 9.0% | Industrials | 9.1% | Communication Services | 14.6% | Information Technology | 53.5% | | Footnote | Description | Footnote* | Represents less than 0.1%. |
|
| Material Fund Change [Text Block] |
Following is a summary of material changes made to the Fund during the reporting period. For more complete and current information, you may review the Fund’s disclosure documents on its webpage at FederatedHermes.com/us/FundInformation or upon request at 1-800-341-7400, Option 4, or by contacting your financial advisor. Effective September 28, 2026, the Fund’s non-fundamental 80% investment policy will change to the following: Under normal circumstances, the Fund will invest its assets so that at least 80% of its net assets (plus any borrowings for investment purposes) are invested in large-cap growth investments. For purposes of this policy, large-cap investments will be defined as companies with market capitalizations within the range of companies in the Russell 1000 Index, and growth investments will be defined as companies with growth characteristics that meet the applicable parameters for inclusion in the Russell 3000 Growth Index. |
| Material Fund Change Strategies [Text Block] |
Effective September 28, 2026, the Fund’s non-fundamental 80% investment policy will change to the following: Under normal circumstances, the Fund will invest its assets so that at least 80% of its net assets (plus any borrowings for investment purposes) are invested in large-cap growth investments. For purposes of this policy, large-cap investments will be defined as companies with market capitalizations within the range of companies in the Russell 1000 Index, and growth investments will be defined as companies with growth characteristics that meet the applicable parameters for inclusion in the Russell 3000 Growth Index.
|
| Summary of Change Legend [Text Block] |
Following is a summary of material changes made to the Fund during the reporting period. For more complete and current information, you may review the Fund’s disclosure documents on its webpage at FederatedHermes.com/us/FundInformation or upon request at 1-800-341-7400, Option 4, or by contacting your financial advisor.
|
| Updated Prospectus Phone Number |
1-800-341-7400
|
| Updated Prospectus Web Address |
<span style="box-sizing: border-box; color: rgb(0, 0, 0); display: inline; flex-wrap: nowrap; font-size: 12px; font-weight: 400; grid-area: auto; line-height: 18px; margin: 0px; overflow: visible; text-align: left; text-align-last: auto; white-space-collapse: preserve-breaks;"><span style="text-decoration: underline; box-sizing: border-box; color: rgb(0, 0, 0); display: inline; flex-wrap: nowrap; font-size: 12px; font-weight: 400; grid-area: auto; line-height: 18px; margin: 0px; overflow: visible; text-align: left; text-align-last: auto; white-space-collapse: preserve-breaks;">FederatedHermes.com/us/FundInformation</span></span>
|
| C000250224 |
|
| Shareholder Report [Line Items] |
|
| Fund Name |
Federated Hermes MDT Large Cap Growth Fund
|
| Class Name |
Class R6 Shares
|
| Trading Symbol |
QRLGX
|
| Annual or Semi-Annual Statement [Text Block] |
This annual shareholder report contains important information about the Federated Hermes MDT Large Cap Growth Fund (the "Fund") for the period of August 1, 2025 to July 31, 2026.
|
| Additional Information [Text Block] |
You can find additional information at FederatedHermes.com/us/FundInformation. You can also request this information by contacting us at 1-800-341-7400, Option 4, or your financial advisor.
|
| Material Fund Change Notice [Text Block] |
This report describes changes made to the Fund during the reporting period.
|
| Additional Information Phone Number |
1-800-341-7400
|
| Additional Information Website |
FederatedHermes.com/us/FundInformation
|
| Expenses [Text Block] |
What were the Fund costs for the last year? (based on a hypothetical $10,000 investment) Table SummaryClass Name | Costs of a $10,000 investment | Costs paid as a percentage of a $10,000 investment |
|---|
Class R6 Shares | $76 | 0.72% |
|---|
|
| Expenses Paid, Amount |
$ 76
|
| Expense Ratio, Percent |
0.72%
|
| Factors Affecting Performance [Text Block] |
Management's Discussion of Fund PerformanceThe following discussion compares the performance of the Fund to the Russell 1000 Growth Index to show how the Fund’s performance compares to the returns of similar investments for the reporting period. See the Average Annual Total Returns table below for the returns of the Fund and related indexes, including the Russell 3000 Index, a required broad-based index, which represents approximately 98% of investable U.S. equities by market capitalization. The Fund seeks to provide long-term capital appreciation by investing primarily in common stocks of large-sized U.S. companies. Top Contributors to Performance Strong stock selection among mature companies with very high analyst conviction contributed positively to Fund relative performance. By sector, stock selection in Information Technology, Consumer Discretionary and Industrials aided performance. Top individual Fund holdings that contributed positively to performance included overweight positions in Teradyne, Inc. and Lam Research Corporation, as well as an underweight position in Microsoft Corporation.
Top Detractors from Performance Poor stock selection among companies with improving earnings-to-price ratios and negative analyst conviction detracted from Fund relative performance. By sector, stock selection in Consumer Staples and Communication Services detracted from performance. Top individual Fund holdings that detracted from performance included an overweight position in Adobe Inc., as well as underweight positions in Apple Inc., and Eli Lilly and Company.
|
| Performance Past Does Not Indicate Future [Text] |
Keep in mind that the Fund’s past performance is not a predictor of how the Fund will perform in the future.
|
| Line Graph [Table Text Block] |
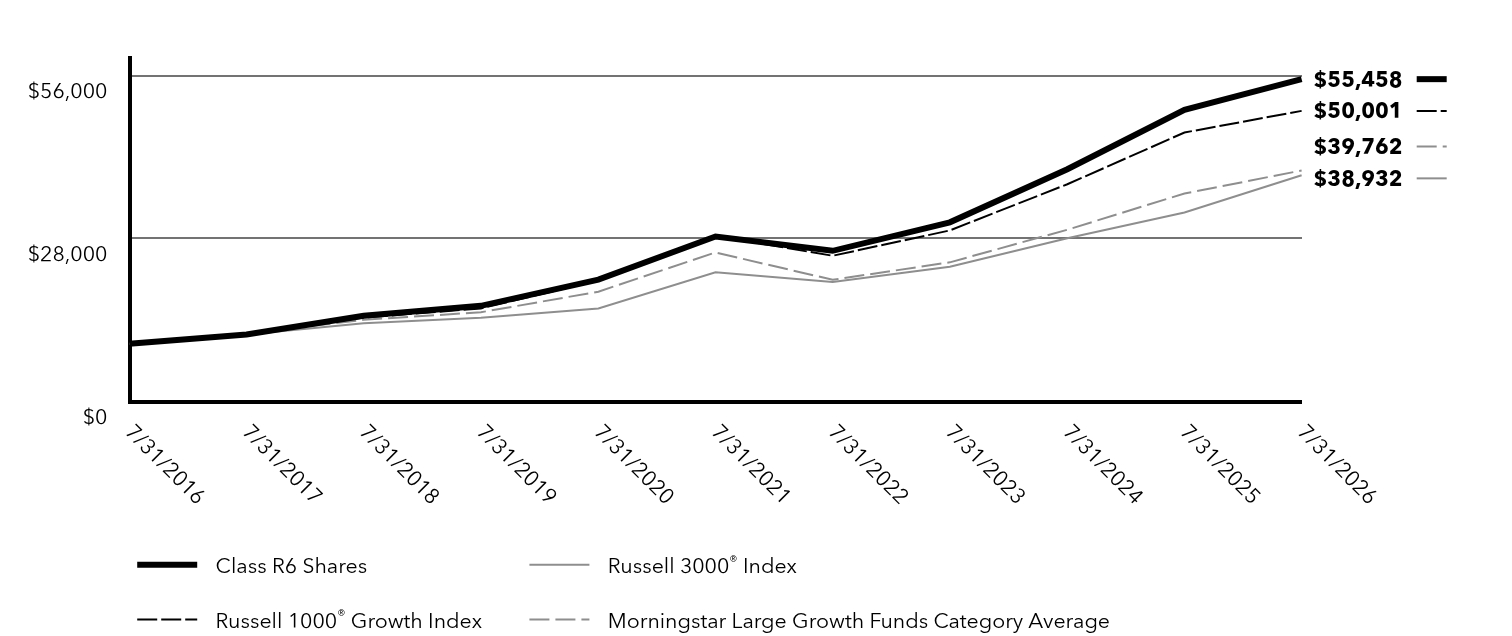
Table Summary | Class R6 Shares | Russell 3000® Index | Russell 1000® Growth Index | Morningstar Large Growth Funds Category Average |
|---|
7/31/2016 | $10,000 | $10,000 | $10,000 | $10,000 |
|---|
7/31/2017 | $11,598 | $11,614 | $11,805 | $11,744 |
|---|
7/31/2018 | $14,805 | $13,517 | $14,502 | $14,124 |
|---|
7/31/2019 | $16,520 | $14,470 | $16,071 | $15,414 |
|---|
7/31/2020 | $21,017 | $16,052 | $20,867 | $18,950 |
|---|
7/31/2021 | $28,434 | $22,268 | $28,520 | $25,685 |
|---|
7/31/2022 | $25,964 | $20,631 | $25,118 | $20,990 |
|---|
7/31/2023 | $30,865 | $23,240 | $29,466 | $23,986 |
|---|
7/31/2024 | $39,982 | $28,138 | $37,403 | $29,589 |
|---|
7/31/2025 | $50,168 | $32,551 | $46,285 | $35,810 |
|---|
7/31/2026 | $55,458 | $38,932 | $50,001 | $39,762 |
|---|
|
| Average Annual Return [Table Text Block] |
Table SummaryFund/Index | 1 Year | 5 Years | 10 Years |
|---|
Class R6 SharesFootnote Referencea | 10.54% | 14.29% | 18.69% |
|---|
Russell 3000® Index | 19.60% | 11.82% | 14.56% |
|---|
Russell 1000® Growth Index | 8.03% | 11.89% | 17.46% |
|---|
Morningstar Large Growth Funds Category Average | 11.14% | 9.09% | 14.78% |
|---|
|
| No Deduction of Taxes [Text Block] |
The graph and table do not reflect the deduction of taxes that a shareholder would pay on fund distributions or redemption of fund shares.
|
| Updated Performance Information Location [Text Block] |
FederatedHermes.com/us/FundInformation
|
| AssetsNet |
$ 5,610,967,633
|
| Holdings Count | Holding |
98
|
| Advisory Fees Paid, Amount |
$ 27,685,859
|
| InvestmentCompanyPortfolioTurnover |
100.00%
|
| Additional Fund Statistics [Text Block] |
- Net Assets$5,610,967,633
- Number of Investments98
- Portfolio Turnover100%
- Total Advisory Fees Paid$27,685,859
|
| Holdings [Text Block] |
Top Sectors (% of Net Assets)Table SummaryValue | Value |
|---|
EnergyFootnote Reference* | 0.0% | Real Estate | 0.1% | Consumer Staples | 1.0% | Materials | 1.2% | Financials | 3.8% | Health Care | 5.6% | Consumer Discretionary | 9.0% | Industrials | 9.1% | Communication Services | 14.6% | Information Technology | 53.5% | | Footnote | Description | Footnote* | Represents less than 0.1%. |
|
| Material Fund Change [Text Block] |
Following is a summary of material changes made to the Fund during the reporting period. For more complete and current information, you may review the Fund’s disclosure documents on its webpage at FederatedHermes.com/us/FundInformation or upon request at 1-800-341-7400, Option 4, or by contacting your financial advisor. Effective September 28, 2026, the Fund’s non-fundamental 80% investment policy will change to the following: Under normal circumstances, the Fund will invest its assets so that at least 80% of its net assets (plus any borrowings for investment purposes) are invested in large-cap growth investments. For purposes of this policy, large-cap investments will be defined as companies with market capitalizations within the range of companies in the Russell 1000 Index, and growth investments will be defined as companies with growth characteristics that meet the applicable parameters for inclusion in the Russell 3000 Growth Index. |
| Material Fund Change Strategies [Text Block] |
Effective September 28, 2026, the Fund’s non-fundamental 80% investment policy will change to the following: Under normal circumstances, the Fund will invest its assets so that at least 80% of its net assets (plus any borrowings for investment purposes) are invested in large-cap growth investments. For purposes of this policy, large-cap investments will be defined as companies with market capitalizations within the range of companies in the Russell 1000 Index, and growth investments will be defined as companies with growth characteristics that meet the applicable parameters for inclusion in the Russell 3000 Growth Index.
|
| Summary of Change Legend [Text Block] |
Following is a summary of material changes made to the Fund during the reporting period. For more complete and current information, you may review the Fund’s disclosure documents on its webpage at FederatedHermes.com/us/FundInformation or upon request at 1-800-341-7400, Option 4, or by contacting your financial advisor.
|
| Updated Prospectus Phone Number |
1-800-341-7400
|
| Updated Prospectus Web Address |
<span style="box-sizing: border-box; color: rgb(0, 0, 0); display: inline; flex-wrap: nowrap; font-size: 12px; font-weight: 400; grid-area: auto; line-height: 18px; margin: 0px; overflow: visible; text-align: left; text-align-last: auto; white-space-collapse: preserve-breaks;"><span style="text-decoration: underline; box-sizing: border-box; color: rgb(0, 0, 0); display: inline; flex-wrap: nowrap; font-size: 12px; font-weight: 400; grid-area: auto; line-height: 18px; margin: 0px; overflow: visible; text-align: left; text-align-last: auto; white-space-collapse: preserve-breaks;">FederatedHermes.com/us/FundInformation</span></span>
|
| C000035043 |
|
| Shareholder Report [Line Items] |
|
| Fund Name |
Federated Hermes MDT All Cap Core Fund
|
| Class Name |
Class A Shares
|
| Trading Symbol |
QAACX
|
| Annual or Semi-Annual Statement [Text Block] |
This annual shareholder report contains important information about the Federated Hermes MDT All Cap Core Fund (the "Fund") for the period of August 1, 2025 to July 31, 2026.
|
| Additional Information [Text Block] |
You can find additional information at FederatedHermes.com/us/FundInformation. You can also request this information by contacting us at 1-800-341-7400, Option 4, or your financial advisor.
|
| Additional Information Phone Number |
1-800-341-7400
|
| Additional Information Website |
FederatedHermes.com/us/FundInformation
|
| Expenses [Text Block] |
What were the Fund costs for the last year? (based on a hypothetical $10,000 investment) Table SummaryClass Name | Costs of a $10,000 investment | Costs paid as a percentage of a $10,000 investment |
|---|
Class A Shares | $114 | 1.05% |
|---|
|
| Expenses Paid, Amount |
$ 114
|
| Expense Ratio, Percent |
1.05%
|
| Factors Affecting Performance [Text Block] |
Management's Discussion of Fund PerformanceThe following discussion compares the performance of the Fund to the Russell 3000 Index to show how the Fund’s performance compares to the returns of similar investments for the reporting period. See the Average Annual Total Returns table below for the returns of the Fund and related indexes. The Fund seeks to provide long-term capital appreciation by investing primarily in the common stock of U.S. companies. Top Contributors to Performance An underweight position in and favorable stock selection among companies with flat or worsening earnings-to-price ratios and negative analyst conviction contributed positively to Fund relative performance. By sector, stock selection in Financials, Health Care and Consumer Discretionary aided performance. Top individual Fund holdings that contributed positively to performance included overweight positions in Teradyne, Inc. and Viking Holdings Ltd., as well as an underweight position in Oracle Corporation.
Top Detractors from Performance Weak stock selection among companies with flat or improving earnings-to-price ratios and neutral to high analyst conviction. By sector, stock selection in Information Technology detracted from performance. Top individual Fund holdings that detracted from performance were underweight positions in Intel Corporation and Advanced Micro Devices, Inc., as well as an overweight position in Adobe Inc.
|
| Performance Past Does Not Indicate Future [Text] |
Keep in mind that the Fund’s past performance is not a predictor of how the Fund will perform in the future.
|
| Line Graph [Table Text Block] |
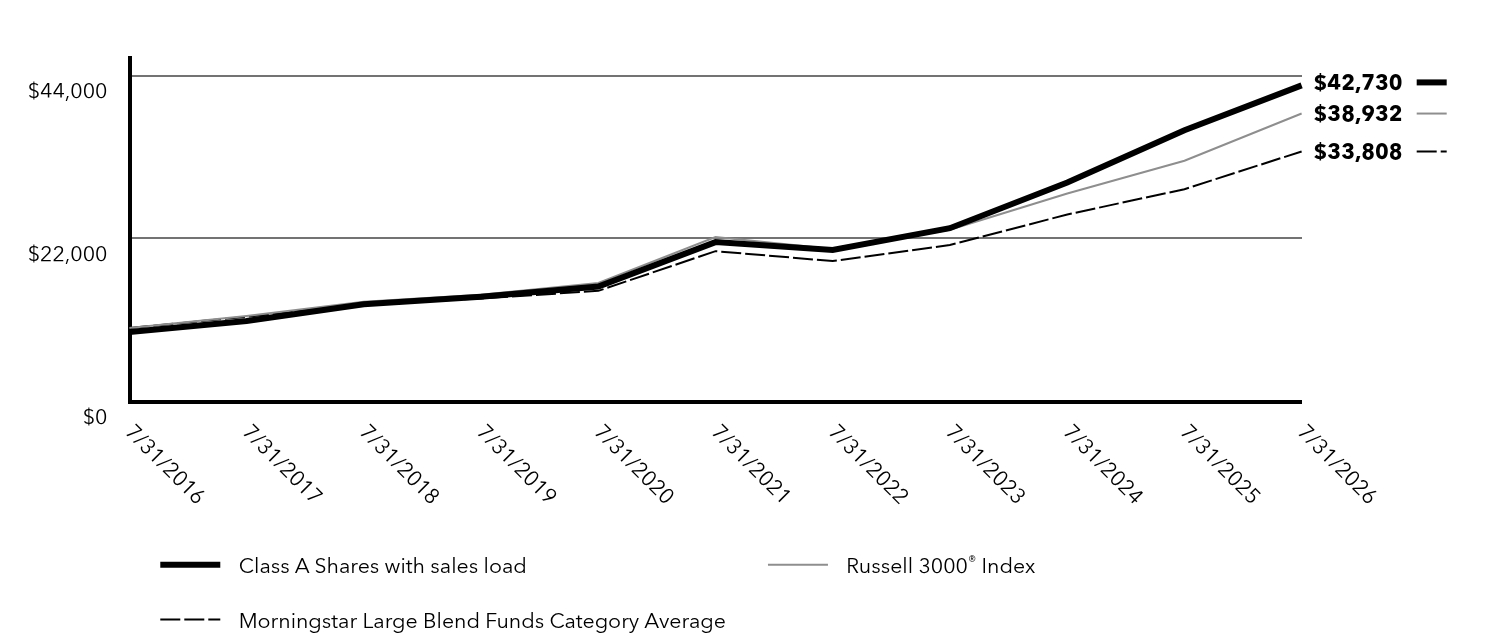
Table Summary | Class A Shares with sales load | Russell 3000® Index | Morningstar Large Blend Funds Category Average |
|---|
7/31/2016 | $9,449 | $10,000 | $10,000 |
|---|
7/31/2017 | $10,919 | $11,614 | $11,497 |
|---|
7/31/2018 | $13,188 | $13,517 | $13,181 |
|---|
7/31/2019 | $14,212 | $14,470 | $13,963 |
|---|
7/31/2020 | $15,591 | $16,052 | $14,999 |
|---|
7/31/2021 | $21,578 | $22,268 | $20,355 |
|---|
7/31/2022 | $20,510 | $20,631 | $19,021 |
|---|
7/31/2023 | $23,453 | $23,240 | $21,184 |
|---|
7/31/2024 | $29,631 | $28,138 | $25,304 |
|---|
7/31/2025 | $36,668 | $32,551 | $28,721 |
|---|
7/31/2026 | $42,730 | $38,932 | $33,808 |
|---|
|
| Average Annual Return [Table Text Block] |
Table SummaryFund/Index | 1 Year | 5 Years | 10 Years |
|---|
Class A Shares with sales load | 10.11% | 13.35% | 15.63% |
|---|
Class A Shares without sales load | 16.53% | 14.64% | 16.29% |
|---|
Russell 3000® Index | 19.60% | 11.82% | 14.56% |
|---|
Morningstar Large Blend Funds Category Average | 17.47% | 10.64% | 12.90% |
|---|
|
| No Deduction of Taxes [Text Block] |
The graph and table do not reflect the deduction of taxes that a shareholder would pay on fund distributions or redemption of fund shares.
|
| Updated Performance Information Location [Text Block] |
FederatedHermes.com/us/FundInformation
|
| AssetsNet |
$ 3,914,676,337
|
| Holdings Count | Holding |
173
|
| Advisory Fees Paid, Amount |
$ 19,378,957
|
| InvestmentCompanyPortfolioTurnover |
71.00%
|
| Additional Fund Statistics [Text Block] |
- Net Assets$3,914,676,337
- Number of Investments173
- Portfolio Turnover71%
- Total Advisory Fees Paid$19,378,957
|
| Holdings [Text Block] |
Top Sectors (% of Net Assets)Table SummaryValue | Value |
|---|
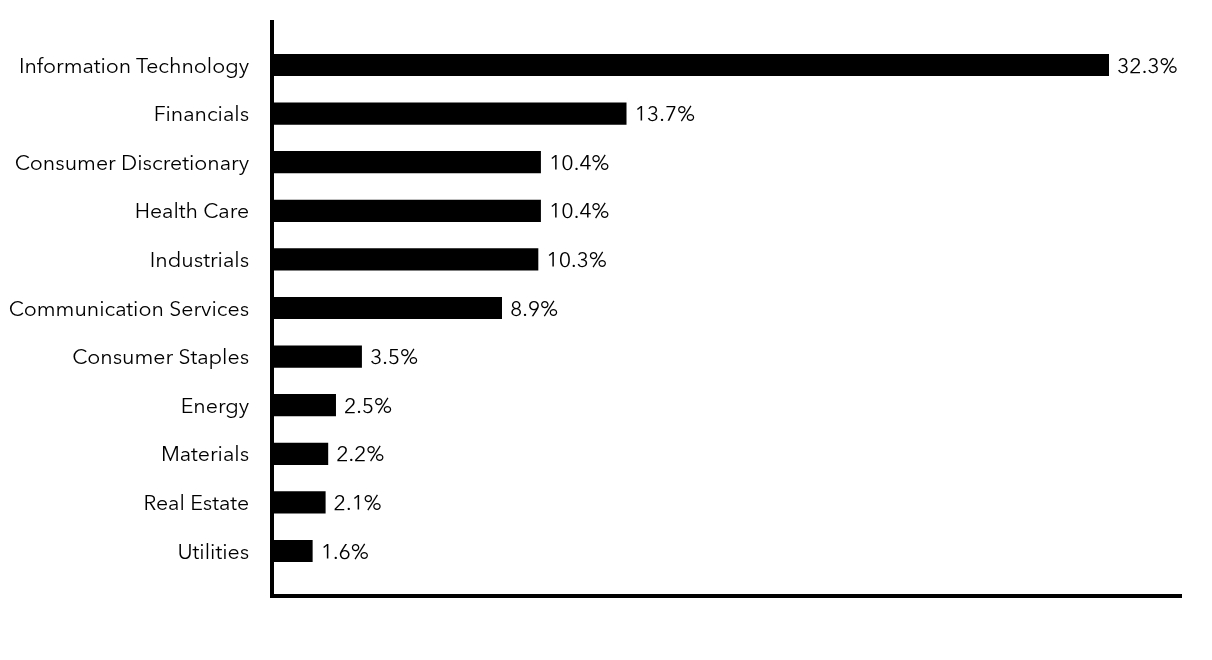
Utilities | 1.6% | Real Estate | 2.1% | Materials | 2.2% | Energy | 2.5% | Consumer Staples | 3.5% | Communication Services | 8.9% | Industrials | 10.3% | Health Care | 10.4% | Consumer Discretionary | 10.4% | Financials | 13.7% | Information Technology | 32.3% | |
| Material Fund Change [Text Block] |
|
| C000035044 |
|
| Shareholder Report [Line Items] |
|
| Fund Name |
Federated Hermes MDT All Cap Core Fund
|
| Class Name |
Class C Shares
|
| Trading Symbol |
QCACX
|
| Annual or Semi-Annual Statement [Text Block] |
This annual shareholder report contains important information about the Federated Hermes MDT All Cap Core Fund (the "Fund") for the period of August 1, 2025 to July 31, 2026.
|
| Additional Information [Text Block] |
You can find additional information at FederatedHermes.com/us/FundInformation. You can also request this information by contacting us at 1-800-341-7400, Option 4, or your financial advisor.
|
| Additional Information Phone Number |
1-800-341-7400
|
| Additional Information Website |
FederatedHermes.com/us/FundInformation
|
| Expenses [Text Block] |
What were the Fund costs for the last year? (based on a hypothetical $10,000 investment) Table SummaryClass Name | Costs of a $10,000 investment | Costs paid as a percentage of a $10,000 investment |
|---|
Class C Shares | $195 | 1.81% |
|---|
|
| Expenses Paid, Amount |
$ 195
|
| Expense Ratio, Percent |
1.81%
|
| Factors Affecting Performance [Text Block] |
Management's Discussion of Fund PerformanceThe following discussion compares the performance of the Fund to the Russell 3000 Index to show how the Fund’s performance compares to the returns of similar investments for the reporting period. See the Average Annual Total Returns table below for the returns of the Fund and related indexes. The Fund seeks to provide long-term capital appreciation by investing primarily in the common stock of U.S. companies. Top Contributors to Performance An underweight position in and favorable stock selection among companies with flat or worsening earnings-to-price ratios and negative analyst conviction contributed positively to Fund relative performance. By sector, stock selection in Financials, Health Care and Consumer Discretionary aided performance. Top individual Fund holdings that contributed positively to performance included overweight positions in Teradyne, Inc. and Viking Holdings Ltd., as well as an underweight position in Oracle Corporation.
Top Detractors from Performance Weak stock selection among companies with flat or improving earnings-to-price ratios and neutral to high analyst conviction. By sector, stock selection in Information Technology detracted from performance. Top individual Fund holdings that detracted from performance were underweight positions in Intel Corporation and Advanced Micro Devices, Inc., as well as an overweight position in Adobe Inc.
|
| Performance Past Does Not Indicate Future [Text] |
Keep in mind that the Fund’s past performance is not a predictor of how the Fund will perform in the future.
|
| Line Graph [Table Text Block] |
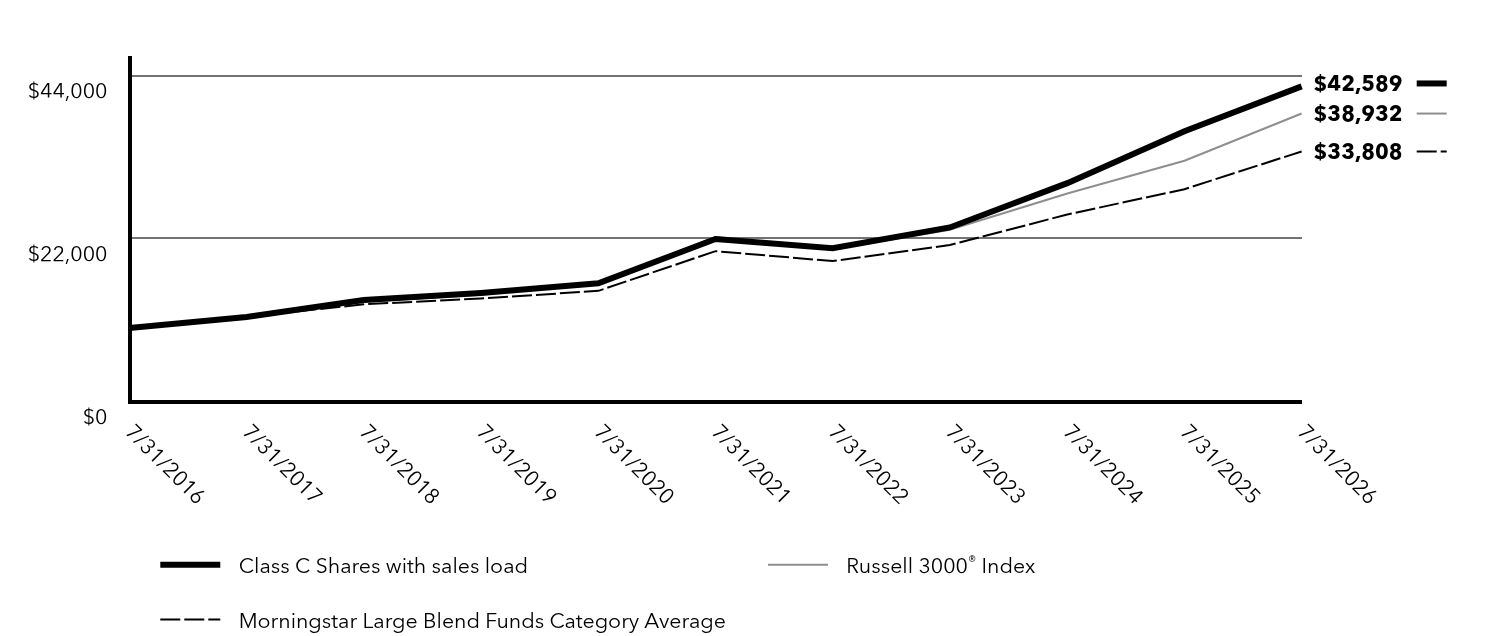
Table Summary | Class C Shares with sales load | Russell 3000® Index | Morningstar Large Blend Funds Category Average |
|---|
7/31/2016 | $10,000 | $10,000 | $10,000 |
|---|
7/31/2017 | $11,472 | $11,614 | $11,497 |
|---|
7/31/2018 | $13,755 | $13,517 | $13,181 |
|---|
7/31/2019 | $14,712 | $14,470 | $13,963 |
|---|
7/31/2020 | $16,015 | $16,052 | $14,999 |
|---|
7/31/2021 | $22,000 | $22,268 | $20,355 |
|---|
7/31/2022 | $20,754 | $20,631 | $19,021 |
|---|
7/31/2023 | $23,555 | $23,240 | $21,184 |
|---|
7/31/2024 | $29,533 | $28,138 | $25,304 |
|---|
7/31/2025 | $36,547 | $32,551 | $28,721 |
|---|
7/31/2026 | $42,589 | $38,932 | $33,808 |
|---|
|
| Average Annual Return [Table Text Block] |
Table SummaryFund/Index | 1 Year | 5 Years | 10 Years |
|---|
Class C Shares with sales load | 14.63% | 13.77% | 15.59% |
|---|
Class C Shares without sales load | 15.63% | 13.77% | 15.59% |
|---|
Russell 3000® Index | 19.60% | 11.82% | 14.56% |
|---|
Morningstar Large Blend Funds Category Average | 17.47% | 10.64% | 12.90% |
|---|
|
| No Deduction of Taxes [Text Block] |
The graph and table do not reflect the deduction of taxes that a shareholder would pay on fund distributions or redemption of fund shares.
|
| Updated Performance Information Location [Text Block] |
FederatedHermes.com/us/FundInformation
|
| AssetsNet |
$ 3,914,676,337
|
| Holdings Count | Holding |
173
|
| Advisory Fees Paid, Amount |
$ 19,378,957
|
| InvestmentCompanyPortfolioTurnover |
71.00%
|
| Additional Fund Statistics [Text Block] |
- Net Assets$3,914,676,337
- Number of Investments173
- Portfolio Turnover71%
- Total Advisory Fees Paid$19,378,957
|
| Holdings [Text Block] |
Top Sectors (% of Net Assets)Table SummaryValue | Value |
|---|
Utilities | 1.6% | Real Estate | 2.1% | Materials | 2.2% | Energy | 2.5% | Consumer Staples | 3.5% | Communication Services | 8.9% | Industrials | 10.3% | Health Care | 10.4% | Consumer Discretionary | 10.4% | Financials | 13.7% | Information Technology | 32.3% | |
| Material Fund Change [Text Block] |
|
| C000035045 |
|
| Shareholder Report [Line Items] |
|
| Fund Name |
Federated Hermes MDT All Cap Core Fund
|
| Class Name |
Institutional Shares
|
| Trading Symbol |
QIACX
|
| Annual or Semi-Annual Statement [Text Block] |
This annual shareholder report contains important information about the Federated Hermes MDT All Cap Core Fund (the "Fund") for the period of August 1, 2025 to July 31, 2026.
|
| Additional Information [Text Block] |
You can find additional information at FederatedHermes.com/us/FundInformation. You can also request this information by contacting us at 1-800-341-7400, Option 4, or your financial advisor.
|
| Additional Information Phone Number |
1-800-341-7400
|
| Additional Information Website |
FederatedHermes.com/us/FundInformation
|
| Expenses [Text Block] |
What were the Fund costs for the last year? (based on a hypothetical $10,000 investment) Table SummaryClass Name | Costs of a $10,000 investment | Costs paid as a percentage of a $10,000 investment |
|---|
Institutional Shares | $81 | 0.75% |
|---|
|
| Expenses Paid, Amount |
$ 81
|
| Expense Ratio, Percent |
0.75%
|
| Factors Affecting Performance [Text Block] |
Management's Discussion of Fund PerformanceThe following discussion compares the performance of the Fund to the Russell 3000 Index to show how the Fund’s performance compares to the returns of similar investments for the reporting period. See the Average Annual Total Returns table below for the returns of the Fund and related indexes. The Fund seeks to provide long-term capital appreciation by investing primarily in the common stock of U.S. companies. Top Contributors to Performance An underweight position in and favorable stock selection among companies with flat or worsening earnings-to-price ratios and negative analyst conviction contributed positively to Fund relative performance. By sector, stock selection in Financials, Health Care and Consumer Discretionary aided performance. Top individual Fund holdings that contributed positively to performance included overweight positions in Teradyne, Inc. and Viking Holdings Ltd., as well as an underweight position in Oracle Corporation.
Top Detractors from Performance Weak stock selection among companies with flat or improving earnings-to-price ratios and neutral to high analyst conviction. By sector, stock selection in Information Technology detracted from performance. Top individual Fund holdings that detracted from performance were underweight positions in Intel Corporation and Advanced Micro Devices, Inc., as well as an overweight position in Adobe Inc.
|
| Performance Past Does Not Indicate Future [Text] |
Keep in mind that the Fund’s past performance is not a predictor of how the Fund will perform in the future.
|
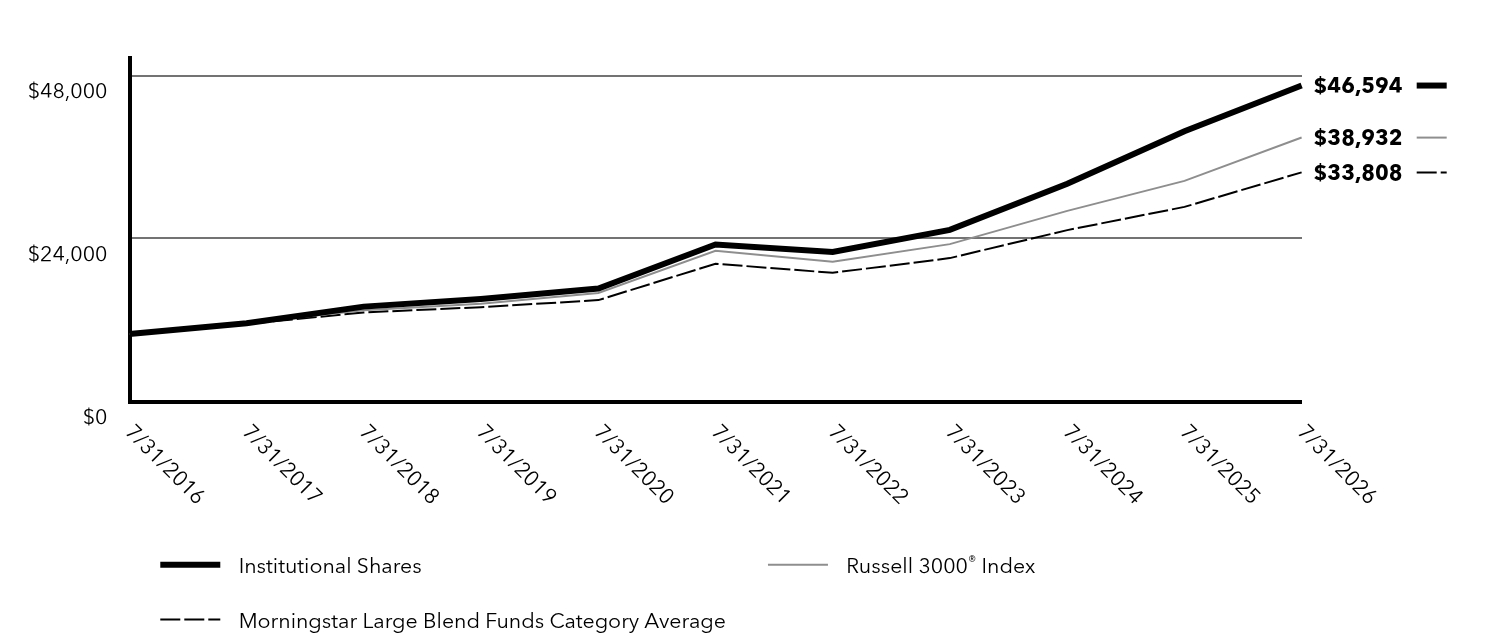
| Line Graph [Table Text Block] |
Table Summary | Institutional Shares | Russell 3000® Index | Morningstar Large Blend Funds Category Average |
|---|
7/31/2016 | $10,000 | $10,000 | $10,000 |
|---|
7/31/2017 | $11,590 | $11,614 | $11,497 |
|---|
7/31/2018 | $14,041 | $13,517 | $13,181 |
|---|
7/31/2019 | $15,176 | $14,470 | $13,963 |
|---|
7/31/2020 | $16,695 | $16,052 | $14,999 |
|---|
7/31/2021 | $23,177 | $22,268 | $20,355 |
|---|
7/31/2022 | $22,095 | $20,631 | $19,021 |
|---|
7/31/2023 | $25,341 | $23,240 | $21,184 |
|---|
7/31/2024 | $32,114 | $28,138 | $25,304 |
|---|
7/31/2025 | $39,867 | $32,551 | $28,721 |
|---|
7/31/2026 | $46,594 | $38,932 | $33,808 |
|---|
|
| Average Annual Return [Table Text Block] |
Table SummaryFund/Index | 1 Year | 5 Years | 10 Years |
|---|
Institutional Shares | 16.87% | 14.99% | 16.64% |
|---|
Russell 3000® Index | 19.60% | 11.82% | 14.56% |
|---|
Morningstar Large Blend Funds Category Average | 17.47% | 10.64% | 12.90% |
|---|
|
| No Deduction of Taxes [Text Block] |
The graph and table do not reflect the deduction of taxes that a shareholder would pay on fund distributions or redemption of fund shares.
|
| Updated Performance Information Location [Text Block] |
FederatedHermes.com/us/FundInformation
|
| AssetsNet |
$ 3,914,676,337
|
| Holdings Count | Holding |
173
|
| Advisory Fees Paid, Amount |
$ 19,378,957
|
| InvestmentCompanyPortfolioTurnover |
71.00%
|
| Additional Fund Statistics [Text Block] |
- Net Assets$3,914,676,337
- Number of Investments173
- Portfolio Turnover71%
- Total Advisory Fees Paid$19,378,957
|
| Holdings [Text Block] |
Top Sectors (% of Net Assets)Table SummaryValue | Value |
|---|
Utilities | 1.6% | Real Estate | 2.1% | Materials | 2.2% | Energy | 2.5% | Consumer Staples | 3.5% | Communication Services | 8.9% | Industrials | 10.3% | Health Care | 10.4% | Consumer Discretionary | 10.4% | Financials | 13.7% | Information Technology | 32.3% | |
| Material Fund Change [Text Block] |
|
| C000043497 |
|
| Shareholder Report [Line Items] |
|
| Fund Name |
Federated Hermes MDT All Cap Core Fund
|
| Class Name |
Class R6 Shares
|
| Trading Symbol |
QKACX
|
| Annual or Semi-Annual Statement [Text Block] |
This annual shareholder report contains important information about the Federated Hermes MDT All Cap Core Fund (the "Fund") for the period of August 1, 2025 to July 31, 2026.
|
| Additional Information [Text Block] |
You can find additional information at FederatedHermes.com/us/FundInformation. You can also request this information by contacting us at 1-800-341-7400, Option 4, or your financial advisor.
|
| Additional Information Phone Number |
1-800-341-7400
|
| Additional Information Website |
FederatedHermes.com/us/FundInformation
|
| Expenses [Text Block] |
What were the Fund costs for the last year? (based on a hypothetical $10,000 investment) Table SummaryClass Name | Costs of a $10,000 investment | Costs paid as a percentage of a $10,000 investment |
|---|
Class R6 Shares | $80 | 0.74% |
|---|
|
| Expenses Paid, Amount |
$ 80
|
| Expense Ratio, Percent |
0.74%
|
| Factors Affecting Performance [Text Block] |
Management's Discussion of Fund PerformanceThe following discussion compares the performance of the Fund to the Russell 3000 Index to show how the Fund’s performance compares to the returns of similar investments for the reporting period. See the Average Annual Total Returns table below for the returns of the Fund and related indexes. The Fund seeks to provide long-term capital appreciation by investing primarily in the common stock of U.S. companies. Top Contributors to Performance An underweight position in and favorable stock selection among companies with flat or worsening earnings-to-price ratios and negative analyst conviction contributed positively to Fund relative performance. By sector, stock selection in Financials, Health Care and Consumer Discretionary aided performance. Top individual Fund holdings that contributed positively to performance included overweight positions in Teradyne, Inc. and Viking Holdings Ltd., as well as an underweight position in Oracle Corporation.
Top Detractors from Performance Weak stock selection among companies with flat or improving earnings-to-price ratios and neutral to high analyst conviction. By sector, stock selection in Information Technology detracted from performance. Top individual Fund holdings that detracted from performance were underweight positions in Intel Corporation and Advanced Micro Devices, Inc., as well as an overweight position in Adobe Inc.
|
| Performance Past Does Not Indicate Future [Text] |
Keep in mind that the Fund’s past performance is not a predictor of how the Fund will perform in the future.
|
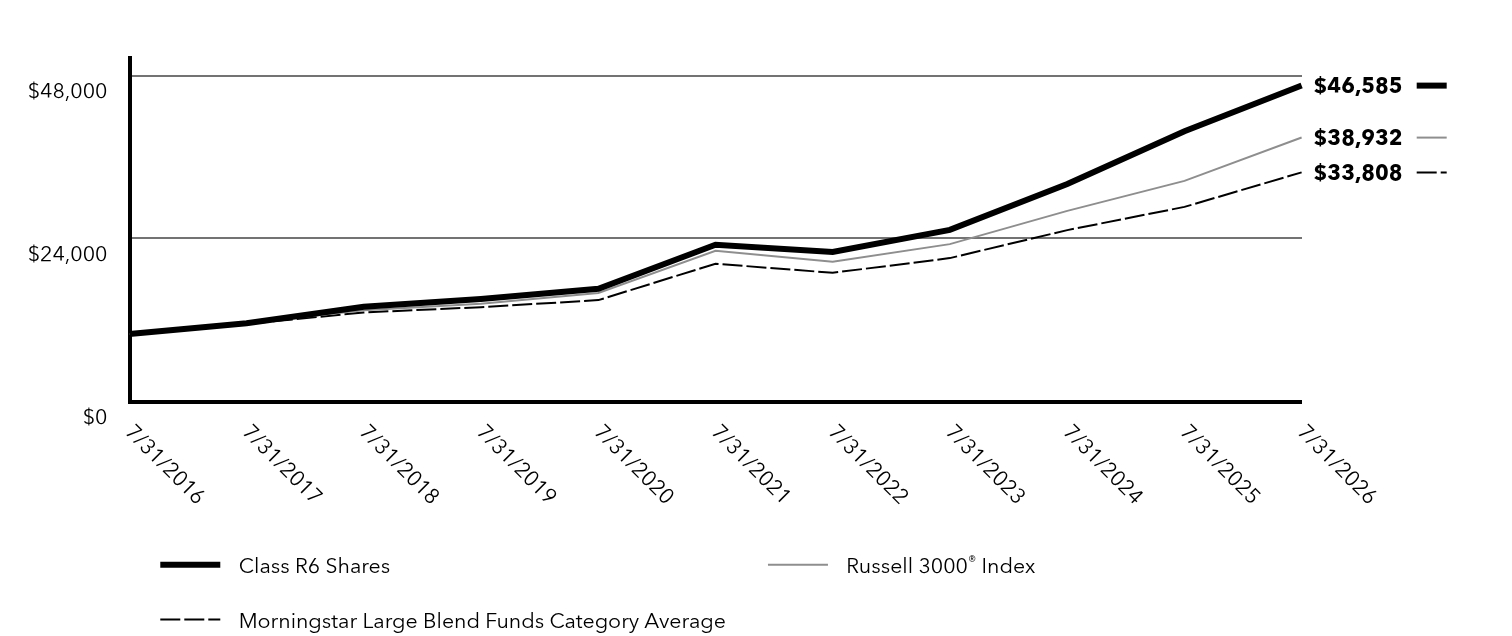
| Line Graph [Table Text Block] |
Table Summary | Class R6 Shares | Russell 3000® Index | Morningstar Large Blend Funds Category Average |
|---|
7/31/2016 | $10,000 | $10,000 | $10,000 |
|---|
7/31/2017 | $11,580 | $11,614 | $11,497 |
|---|
7/31/2018 | $14,031 | $13,517 | $13,181 |
|---|
7/31/2019 | $15,166 | $14,470 | $13,963 |
|---|
7/31/2020 | $16,682 | $16,052 | $14,999 |
|---|
7/31/2021 | $23,161 | $22,268 | $20,355 |
|---|
7/31/2022 | $22,082 | $20,631 | $19,021 |
|---|
7/31/2023 | $25,333 | $23,240 | $21,184 |
|---|
7/31/2024 | $32,102 | $28,138 | $25,304 |
|---|
7/31/2025 | $39,854 | $32,551 | $28,721 |
|---|
7/31/2026 | $46,585 | $38,932 | $33,808 |
|---|
|
| Average Annual Return [Table Text Block] |
Table SummaryFund/Index | 1 Year | 5 Years | 10 Years |
|---|
Class R6 Shares | 16.89% | 15.00% | 16.63% |
|---|
Russell 3000® Index | 19.60% | 11.82% | 14.56% |
|---|
Morningstar Large Blend Funds Category Average | 17.47% | 10.64% | 12.90% |
|---|
|
| No Deduction of Taxes [Text Block] |
The graph and table do not reflect the deduction of taxes that a shareholder would pay on fund distributions or redemption of fund shares.
|
| Updated Performance Information Location [Text Block] |
FederatedHermes.com/us/FundInformation
|
| AssetsNet |
$ 3,914,676,337
|
| Holdings Count | Holding |
173
|
| Advisory Fees Paid, Amount |
$ 19,378,957
|
| InvestmentCompanyPortfolioTurnover |
71.00%
|
| Additional Fund Statistics [Text Block] |
- Net Assets$3,914,676,337
- Number of Investments173
- Portfolio Turnover71%
- Total Advisory Fees Paid$19,378,957
|
| Holdings [Text Block] |
Top Sectors (% of Net Assets)Table SummaryValue | Value |
|---|
Utilities | 1.6% | Real Estate | 2.1% | Materials | 2.2% | Energy | 2.5% | Consumer Staples | 3.5% | Communication Services | 8.9% | Industrials | 10.3% | Health Care | 10.4% | Consumer Discretionary | 10.4% | Financials | 13.7% | Information Technology | 32.3% | |
| Material Fund Change [Text Block] |
|
| C000035055 |
|
| Shareholder Report [Line Items] |
|
| Fund Name |
Federated Hermes MDT Balanced Fund
|
| Class Name |
Class A Shares
|
| Trading Symbol |
QABGX
|
| Annual or Semi-Annual Statement [Text Block] |
This annual shareholder report contains important information about the Federated Hermes MDT Balanced Fund (the "Fund") for the period of August 1, 2025 to July 31, 2026.
|
| Additional Information [Text Block] |
You can find additional information at FederatedHermes.com/us/FundInformation. You can also request this information by contacting us at 1-800-341-7400, Option 4, or your financial advisor.
|
| Additional Information Phone Number |
1-800-341-7400
|
| Additional Information Website |
FederatedHermes.com/us/FundInformation
|
| Expenses [Text Block] |
What were the Fund costs for the last year? (based on a hypothetical $10,000 investment) Table SummaryClass Name | Costs of a $10,000 investment | Costs paid as a percentage of a $10,000 investment |
|---|
Class A Shares | $135 | 1.28% |
|---|
|
| Expenses Paid, Amount |
$ 135
|
| Expense Ratio, Percent |
1.28%
|
| Factors Affecting Performance [Text Block] |
Management's Discussion of Fund PerformanceThe following discussion compares the performance of the Fund to a 60%/40% blend of the S&P 500 Index and the Bloomberg US Aggregate Bond Index to show how the Fund’s performance compares to the returns of similar investments for the reporting period. See the Average Annual Total Returns table below for the returns of the Fund and related indexes. The Fund seeks to provide long-term growth of capital and income by investing in a combination of equity and fixed-income securities. Top Contributors to Performance An overweight allocation to equities and underweight position in fixed income throughout the reporting period aided performance. Security selection in Real Estate Investment Trusts aided performance as these investments outperformed their benchmark. By sector, domestic equity security selection in Financials, Healthcare and Consumer Discretionary aided performance.
Top Detractors from Performance Domestic equity security selection negatively affected Fund relative performance. By sector, domestic equity security selection in Information Technology, Consumer Staples and Industrials detracted from performance. The allocation to cash detracted from Fund relative performance as it underperformed the domestic equity and fixed income markets during the reporting period.
|
| Performance Past Does Not Indicate Future [Text] |
Keep in mind that the Fund’s past performance is not a predictor of how the Fund will perform in the future.
|
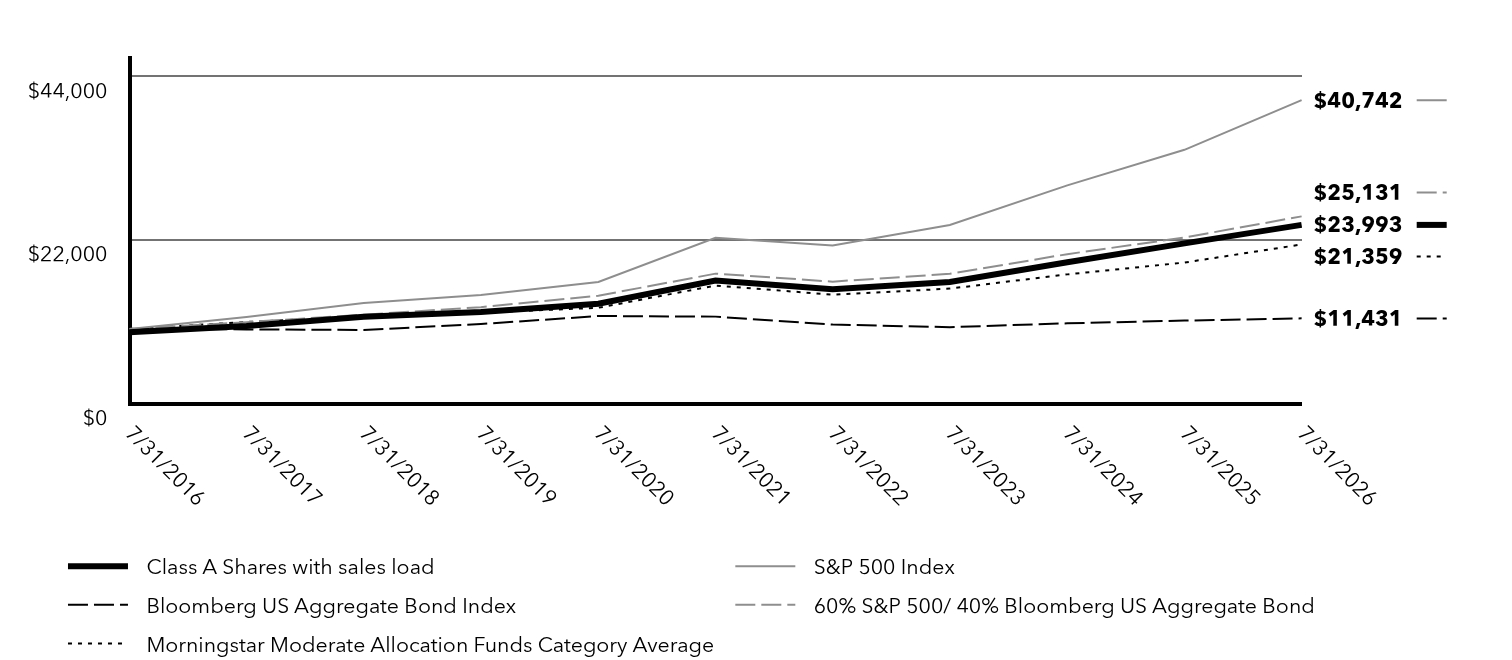
| Line Graph [Table Text Block] |
Table Summary | Class A Shares with sales load | S&P 500 Index | Bloomberg US Aggregate Bond Index | 60% S&P 500/ 40% Bloomberg US Aggregate Bond | Morningstar Moderate Allocation Funds Category Average |
|---|
7/31/2016 | $9,549 | $10,000 | $10,000 | $10,000 | $10,000 |
|---|
7/31/2017 | $10,419 | $11,604 | $9,949 | $10,919 | $10,944 |
|---|
7/31/2018 | $11,660 | $13,489 | $9,869 | $11,927 | $11,696 |
|---|
7/31/2019 | $12,276 | $14,566 | $10,666 | $12,938 | $12,194 |
|---|
7/31/2020 | $13,391 | $16,308 | $11,746 | $14,470 | $12,858 |
|---|
7/31/2021 | $16,512 | $22,251 | $11,664 | $17,439 | $15,839 |
|---|
7/31/2022 | $15,348 | $21,219 | $10,600 | $16,366 | $14,612 |
|---|
7/31/2023 | $16,311 | $23,980 | $10,243 | $17,417 | $15,426 |
|---|
7/31/2024 | $18,979 | $29,292 | $10,766 | $20,057 | $17,341 |
|---|
7/31/2025 | $21,506 | $34,076 | $11,130 | $22,295 | $18,928 |
|---|
7/31/2026 | $23,993 | $40,742 | $11,431 | $25,131 | $21,359 |
|---|
|
| Average Annual Return [Table Text Block] |
Table SummaryFund/Index | 1 Year | 5 Years | 10 Years |
|---|
Class A Shares with sales load | 6.56% | 6.77% | 9.15% |
|---|
Class A Shares without sales load | 11.57% | 7.76% | 9.65% |
|---|
S&P 500 Index | 19.56% | 12.86% | 15.08% |
|---|
Bloomberg US Aggregate Bond Index | 2.71% | (0.40)% | 1.35% |
|---|
60% S&P 500/ 40% Bloomberg US Aggregate Bond | 12.72% | 7.58% | 9.65% |
|---|
Morningstar Moderate Allocation Funds Category Average | 12.86% | 6.15% | 7.92% |
|---|
|
| No Deduction of Taxes [Text Block] |
The graph and table do not reflect the deduction of taxes that a shareholder would pay on fund distributions or redemption of fund shares.
|
| Updated Performance Information Location [Text Block] |
FederatedHermes.com/us/FundInformation
|
| AssetsNet |
$ 330,186,640
|
| Holdings Count | Holding |
536
|
| Advisory Fees Paid, Amount |
$ 2,326,872
|
| InvestmentCompanyPortfolioTurnover |
63.00%
|
| Additional Fund Statistics [Text Block] |
- Net Assets$330,186,640
- Number of Investments536
- Portfolio Turnover63%
- Total Advisory Fees Paid$2,326,872
|
| Holdings [Text Block] |
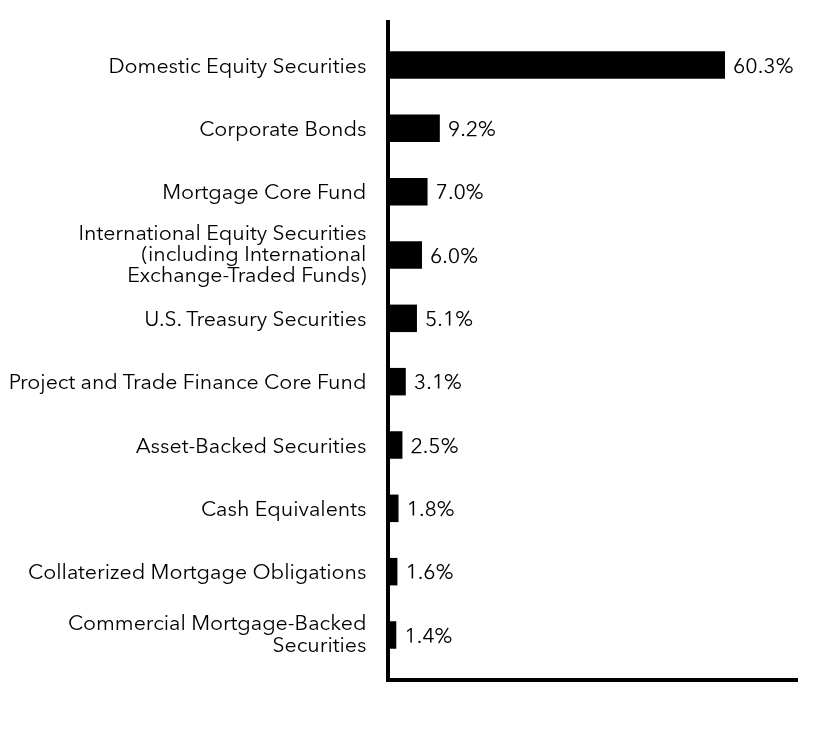
Top Security Types (% of Net Assets)Table SummaryValue | Value |
|---|
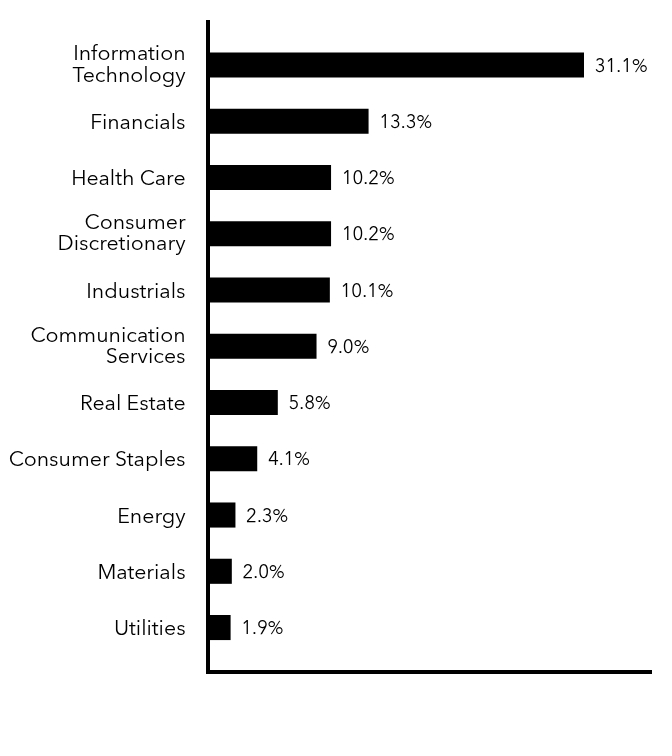
Commercial Mortgage-Backed Securities | 1.4% | Collaterized Mortgage Obligations | 1.6% | Cash Equivalents | 1.8% | Asset-Backed Securities | 2.5% | Project and Trade Finance Core Fund | 3.1% | U.S. Treasury Securities | 5.1% | International Equity Securities (including International Exchange-Traded Funds) | 6.0% | Mortgage Core Fund | 7.0% | Corporate Bonds | 9.2% | Domestic Equity Securities | 60.3% | Top Sectors - Equity (% of Equity Securities)Table SummaryValue | Value |
|---|
Utilities | 1.9% | Materials | 2.0% | Energy | 2.3% | Consumer Staples | 4.1% | Real Estate | 5.8% | Communication Services | 9.0% | Industrials | 10.1% | Consumer Discretionary | 10.2% | Health Care | 10.2% | Financials | 13.3% | Information Technology | 31.1% | |
| Material Fund Change [Text Block] |
|
| C000035056 |
|
| Shareholder Report [Line Items] |
|
| Fund Name |
Federated Hermes MDT Balanced Fund
|
| Class Name |
Class C Shares
|
| Trading Symbol |
QCBGX
|
| Annual or Semi-Annual Statement [Text Block] |
This annual shareholder report contains important information about the Federated Hermes MDT Balanced Fund (the "Fund") for the period of August 1, 2025 to July 31, 2026.
|
| Additional Information [Text Block] |
You can find additional information at FederatedHermes.com/us/FundInformation. You can also request this information by contacting us at 1-800-341-7400, Option 4, or your financial advisor.
|
| Additional Information Phone Number |
1-800-341-7400
|
| Additional Information Website |
FederatedHermes.com/us/FundInformation
|
| Expenses [Text Block] |
What were the Fund costs for the last year? (based on a hypothetical $10,000 investment) Table SummaryClass Name | Costs of a $10,000 investment | Costs paid as a percentage of a $10,000 investment |
|---|
Class C Shares | $217 | 2.06% |
|---|
|
| Expenses Paid, Amount |
$ 217
|
| Expense Ratio, Percent |
2.06%
|
| Factors Affecting Performance [Text Block] |
Management's Discussion of Fund PerformanceThe following discussion compares the performance of the Fund to a 60%/40% blend of the S&P 500 Index and the Bloomberg US Aggregate Bond Index to show how the Fund’s performance compares to the returns of similar investments for the reporting period. See the Average Annual Total Returns table below for the returns of the Fund and related indexes. The Fund seeks to provide long-term growth of capital and income by investing in a combination of equity and fixed-income securities. Top Contributors to Performance An overweight allocation to equities and underweight position in fixed income throughout the reporting period aided performance. Security selection in Real Estate Investment Trusts aided performance as these investments outperformed their benchmark. By sector, domestic equity security selection in Financials, Healthcare and Consumer Discretionary aided performance.
Top Detractors from Performance Domestic equity security selection negatively affected Fund relative performance. By sector, domestic equity security selection in Information Technology, Consumer Staples and Industrials detracted from performance. The allocation to cash detracted from Fund relative performance as it underperformed the domestic equity and fixed income markets during the reporting period.
|
| Performance Past Does Not Indicate Future [Text] |
Keep in mind that the Fund’s past performance is not a predictor of how the Fund will perform in the future.
|
| Line Graph [Table Text Block] |
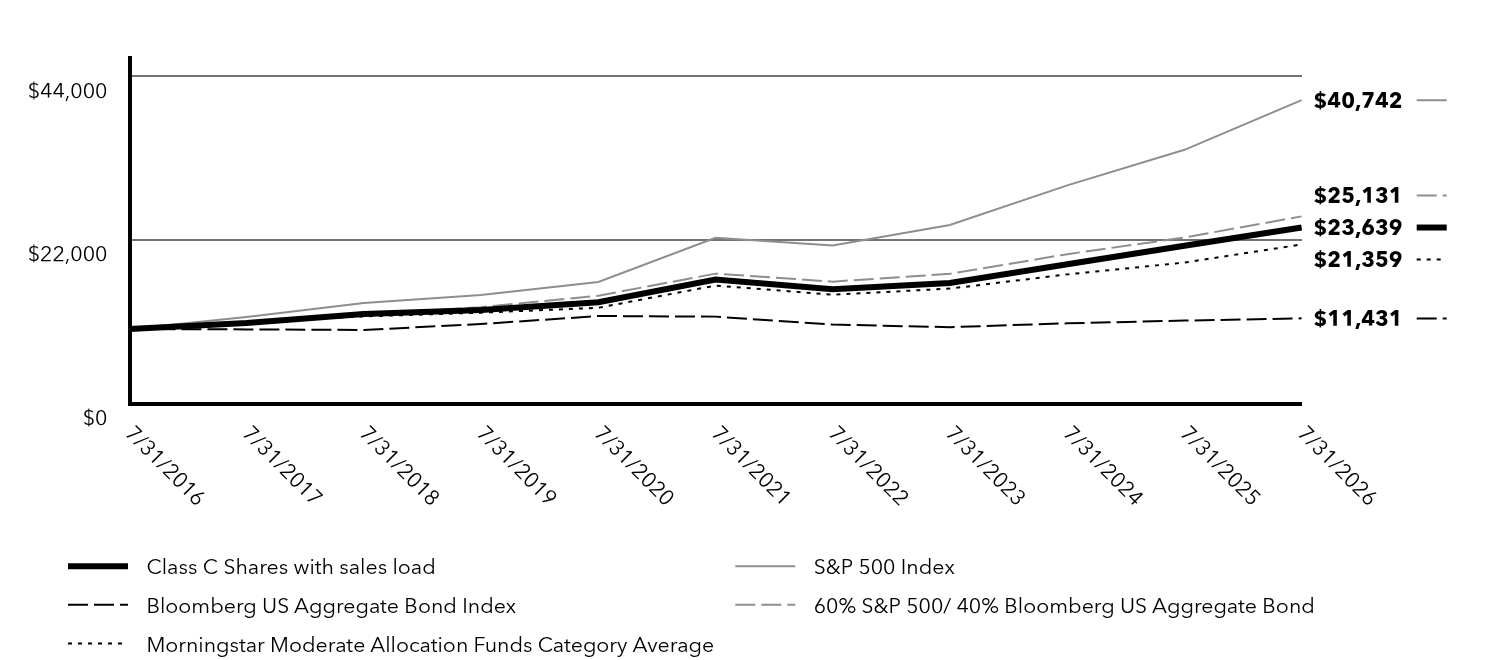
Table Summary | Class C Shares with sales load | S&P 500 Index | Bloomberg US Aggregate Bond Index | 60% S&P 500/ 40% Bloomberg US Aggregate Bond | Morningstar Moderate Allocation Funds Category Average |
|---|
7/31/2016 | $10,000 | $10,000 | $10,000 | $10,000 | $10,000 |
|---|
7/31/2017 | $10,823 | $11,604 | $9,949 | $10,919 | $10,944 |
|---|
7/31/2018 | $12,023 | $13,489 | $9,869 | $11,927 | $11,696 |
|---|
7/31/2019 | $12,570 | $14,566 | $10,666 | $12,938 | $12,194 |
|---|
7/31/2020 | $13,606 | $16,308 | $11,746 | $14,470 | $12,858 |
|---|
7/31/2021 | $16,651 | $22,251 | $11,664 | $17,439 | $15,839 |
|---|
7/31/2022 | $15,358 | $21,219 | $10,600 | $16,366 | $14,612 |
|---|
7/31/2023 | $16,195 | $23,980 | $10,243 | $17,417 | $15,426 |
|---|
7/31/2024 | $18,698 | $29,292 | $10,766 | $20,057 | $17,341 |
|---|
7/31/2025 | $21,188 | $34,076 | $11,130 | $22,295 | $18,928 |
|---|
7/31/2026 | $23,639 | $40,742 | $11,431 | $25,131 | $21,359 |
|---|
|
| Average Annual Return [Table Text Block] |
Table SummaryFund/Index | 1 Year | 5 Years | 10 Years |
|---|
Class C Shares with sales load | 9.69% | 6.93% | 8.98% |
|---|
Class C Shares without sales load | 10.69% | 6.93% | 8.98% |
|---|
S&P 500 Index | 19.56% | 12.86% | 15.08% |
|---|
Bloomberg US Aggregate Bond Index | 2.71% | (0.40)% | 1.35% |
|---|
60% S&P 500/ 40% Bloomberg US Aggregate Bond | 12.72% | 7.58% | 9.65% |
|---|
Morningstar Moderate Allocation Funds Category Average | 12.86% | 6.15% | 7.92% |
|---|
|
| No Deduction of Taxes [Text Block] |
The graph and table do not reflect the deduction of taxes that a shareholder would pay on fund distributions or redemption of fund shares.
|
| Updated Performance Information Location [Text Block] |
FederatedHermes.com/us/FundInformation
|
| AssetsNet |
$ 330,186,640
|
| Holdings Count | Holding |
536
|
| Advisory Fees Paid, Amount |
$ 2,326,872
|
| InvestmentCompanyPortfolioTurnover |
63.00%
|
| Additional Fund Statistics [Text Block] |
- Net Assets$330,186,640
- Number of Investments536
- Portfolio Turnover63%
- Total Advisory Fees Paid$2,326,872
|
| Holdings [Text Block] |
Top Security Types (% of Net Assets)Table SummaryValue | Value |
|---|
Commercial Mortgage-Backed Securities | 1.4% | Collaterized Mortgage Obligations | 1.6% | Cash Equivalents | 1.8% | Asset-Backed Securities | 2.5% | Project and Trade Finance Core Fund | 3.1% | U.S. Treasury Securities | 5.1% | International Equity Securities (including International Exchange-Traded Funds) | 6.0% | Mortgage Core Fund | 7.0% | Corporate Bonds | 9.2% | Domestic Equity Securities | 60.3% | Top Sectors - Equity (% of Equity Securities)Table SummaryValue | Value |
|---|
Utilities | 1.9% | Materials | 2.0% | Energy | 2.3% | Consumer Staples | 4.1% | Real Estate | 5.8% | Communication Services | 9.0% | Industrials | 10.1% | Consumer Discretionary | 10.2% | Health Care | 10.2% | Financials | 13.3% | Information Technology | 31.1% | |
| Material Fund Change [Text Block] |
|
| C000035057 |
|
| Shareholder Report [Line Items] |
|
| Fund Name |
Federated Hermes MDT Balanced Fund
|
| Class Name |
Institutional Shares
|
| Trading Symbol |
QIBGX
|
| Annual or Semi-Annual Statement [Text Block] |
This annual shareholder report contains important information about the Federated Hermes MDT Balanced Fund (the "Fund") for the period of August 1, 2025 to July 31, 2026.
|
| Additional Information [Text Block] |
You can find additional information at FederatedHermes.com/us/FundInformation. You can also request this information by contacting us at 1-800-341-7400, Option 4, or your financial advisor.
|
| Additional Information Phone Number |
1-800-341-7400
|
| Additional Information Website |
FederatedHermes.com/us/FundInformation
|
| Expenses [Text Block] |
What were the Fund costs for the last year? (based on a hypothetical $10,000 investment) Table SummaryClass Name | Costs of a $10,000 investment | Costs paid as a percentage of a $10,000 investment |
|---|
Institutional Shares | $112 | 1.06% |
|---|
|
| Expenses Paid, Amount |
$ 112
|
| Expense Ratio, Percent |
1.06%
|
| Factors Affecting Performance [Text Block] |
Management's Discussion of Fund PerformanceThe following discussion compares the performance of the Fund to a 60%/40% blend of the S&P 500 Index and the Bloomberg US Aggregate Bond Index to show how the Fund’s performance compares to the returns of similar investments for the reporting period. See the Average Annual Total Returns table below for the returns of the Fund and related indexes. The Fund seeks to provide long-term growth of capital and income by investing in a combination of equity and fixed-income securities. Top Contributors to Performance An overweight allocation to equities and underweight position in fixed income throughout the reporting period aided performance. Security selection in Real Estate Investment Trusts aided performance as these investments outperformed their benchmark. By sector, domestic equity security selection in Financials, Healthcare and Consumer Discretionary aided performance.
Top Detractors from Performance Domestic equity security selection negatively affected Fund relative performance. By sector, domestic equity security selection in Information Technology, Consumer Staples and Industrials detracted from performance. The allocation to cash detracted from Fund relative performance as it underperformed the domestic equity and fixed income markets during the reporting period.
|
| Performance Past Does Not Indicate Future [Text] |
Keep in mind that the Fund’s past performance is not a predictor of how the Fund will perform in the future.
|
| Line Graph [Table Text Block] |
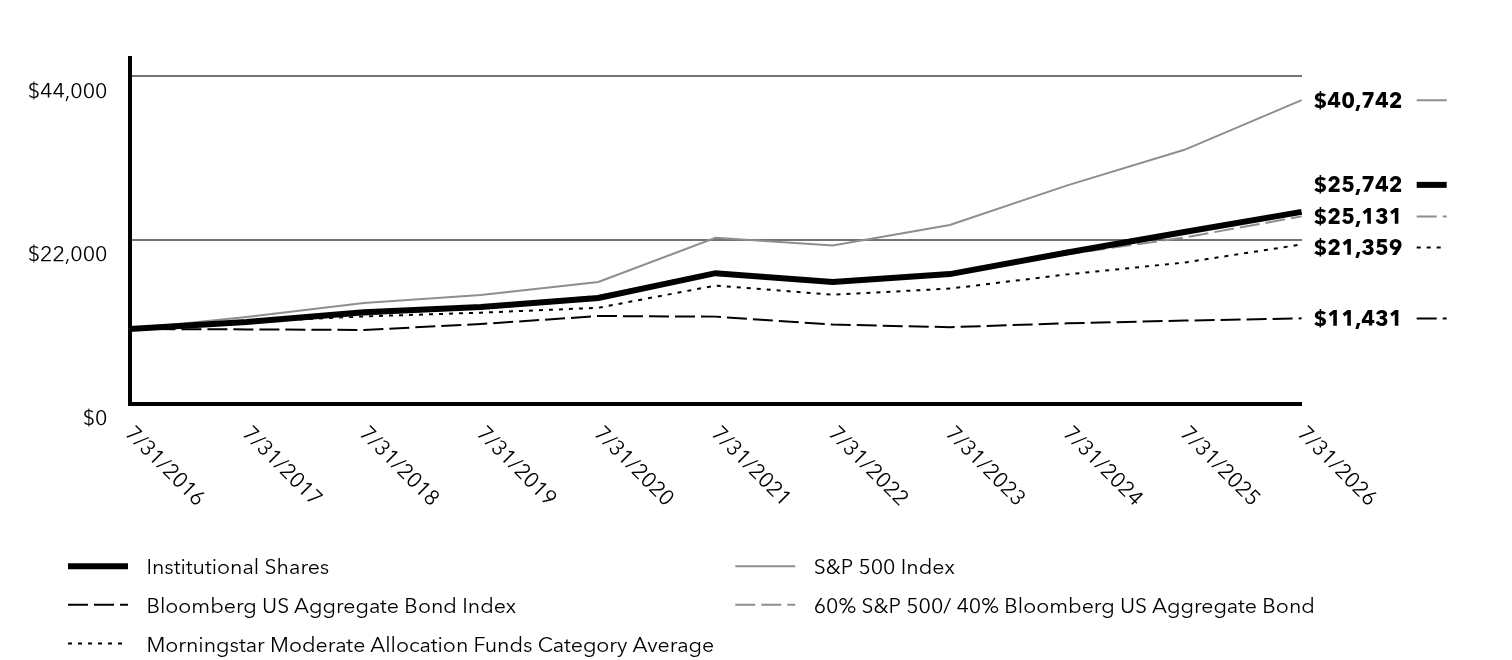
Table Summary | Institutional Shares | S&P 500 Index | Bloomberg US Aggregate Bond Index | 60% S&P 500/ 40% Bloomberg US Aggregate Bond | Morningstar Moderate Allocation Funds Category Average |
|---|
7/31/2016 | $10,000 | $10,000 | $10,000 | $10,000 | $10,000 |
|---|
7/31/2017 | $10,936 | $11,604 | $9,949 | $10,919 | $10,944 |
|---|
7/31/2018 | $12,265 | $13,489 | $9,869 | $11,927 | $11,696 |
|---|
7/31/2019 | $12,953 | $14,566 | $10,666 | $12,938 | $12,194 |
|---|
7/31/2020 | $14,162 | $16,308 | $11,746 | $14,470 | $12,858 |
|---|
7/31/2021 | $17,503 | $22,251 | $11,664 | $17,439 | $15,839 |
|---|
7/31/2022 | $16,309 | $21,219 | $10,600 | $16,366 | $14,612 |
|---|
7/31/2023 | $17,380 | $23,980 | $10,243 | $17,417 | $15,426 |
|---|
7/31/2024 | $20,269 | $29,292 | $10,766 | $20,057 | $17,341 |
|---|
7/31/2025 | $23,026 | $34,076 | $11,130 | $22,295 | $18,928 |
|---|
7/31/2026 | $25,742 | $40,742 | $11,431 | $25,131 | $21,359 |
|---|
|
| Average Annual Return [Table Text Block] |
Table SummaryFund/Index | 1 Year | 5 Years | 10 Years |
|---|
Institutional Shares | 11.79% | 8.02% | 9.92% |
|---|
S&P 500 Index | 19.56% | 12.86% | 15.08% |
|---|
Bloomberg US Aggregate Bond Index | 2.71% | (0.40)% | 1.35% |
|---|
60% S&P 500/ 40% Bloomberg US Aggregate Bond | 12.72% | 7.58% | 9.65% |
|---|
Morningstar Moderate Allocation Funds Category Average | 12.86% | 6.15% | 7.92% |
|---|
|
| No Deduction of Taxes [Text Block] |
The graph and table do not reflect the deduction of taxes that a shareholder would pay on fund distributions or redemption of fund shares.
|
| Updated Performance Information Location [Text Block] |
FederatedHermes.com/us/FundInformation
|
| AssetsNet |
$ 330,186,640
|
| Holdings Count | Holding |
536
|
| Advisory Fees Paid, Amount |
$ 2,326,872
|
| InvestmentCompanyPortfolioTurnover |
63.00%
|
| Additional Fund Statistics [Text Block] |
- Net Assets$330,186,640
- Number of Investments536
- Portfolio Turnover63%
- Total Advisory Fees Paid$2,326,872
|
| Holdings [Text Block] |
Top Security Types (% of Net Assets)Table SummaryValue | Value |
|---|
Commercial Mortgage-Backed Securities | 1.4% | Collaterized Mortgage Obligations | 1.6% | Cash Equivalents | 1.8% | Asset-Backed Securities | 2.5% | Project and Trade Finance Core Fund | 3.1% | U.S. Treasury Securities | 5.1% | International Equity Securities (including International Exchange-Traded Funds) | 6.0% | Mortgage Core Fund | 7.0% | Corporate Bonds | 9.2% | Domestic Equity Securities | 60.3% | Top Sectors - Equity (% of Equity Securities)Table SummaryValue | Value |
|---|
Utilities | 1.9% | Materials | 2.0% | Energy | 2.3% | Consumer Staples | 4.1% | Real Estate | 5.8% | Communication Services | 9.0% | Industrials | 10.1% | Consumer Discretionary | 10.2% | Health Care | 10.2% | Financials | 13.3% | Information Technology | 31.1% | |
| Material Fund Change [Text Block] |
|
| C000043498 |
|
| Shareholder Report [Line Items] |
|
| Fund Name |
Federated Hermes MDT Balanced Fund
|
| Class Name |
Class R6 Shares
|
| Trading Symbol |
QKBGX
|
| Annual or Semi-Annual Statement [Text Block] |
This annual shareholder report contains important information about the Federated Hermes MDT Balanced Fund (the "Fund") for the period of August 1, 2025 to July 31, 2026.
|
| Additional Information [Text Block] |
You can find additional information at FederatedHermes.com/us/FundInformation. You can also request this information by contacting us at 1-800-341-7400, Option 4, or your financial advisor.
|
| Additional Information Phone Number |
1-800-341-7400
|
| Additional Information Website |
FederatedHermes.com/us/FundInformation
|
| Expenses [Text Block] |
What were the Fund costs for the last year? (based on a hypothetical $10,000 investment) Table SummaryClass Name | Costs of a $10,000 investment | Costs paid as a percentage of a $10,000 investment |
|---|
Class R6 Shares | $105 | 0.99% |
|---|
|
| Expenses Paid, Amount |
$ 105
|
| Expense Ratio, Percent |
0.99%
|
| Factors Affecting Performance [Text Block] |
Management's Discussion of Fund PerformanceThe following discussion compares the performance of the Fund to a 60%/40% blend of the S&P 500 Index and the Bloomberg US Aggregate Bond Index to show how the Fund’s performance compares to the returns of similar investments for the reporting period. See the Average Annual Total Returns table below for the returns of the Fund and related indexes. The Fund seeks to provide long-term growth of capital and income by investing in a combination of equity and fixed-income securities. Top Contributors to Performance An overweight allocation to equities and underweight position in fixed income throughout the reporting period aided performance. Security selection in Real Estate Investment Trusts aided performance as these investments outperformed their benchmark. By sector, domestic equity security selection in Financials, Healthcare and Consumer Discretionary aided performance.
Top Detractors from Performance Domestic equity security selection negatively affected Fund relative performance. By sector, domestic equity security selection in Information Technology, Consumer Staples and Industrials detracted from performance. The allocation to cash detracted from Fund relative performance as it underperformed the domestic equity and fixed income markets during the reporting period.
|
| Performance Past Does Not Indicate Future [Text] |
Keep in mind that the Fund’s past performance is not a predictor of how the Fund will perform in the future.
|
| Line Graph [Table Text Block] |
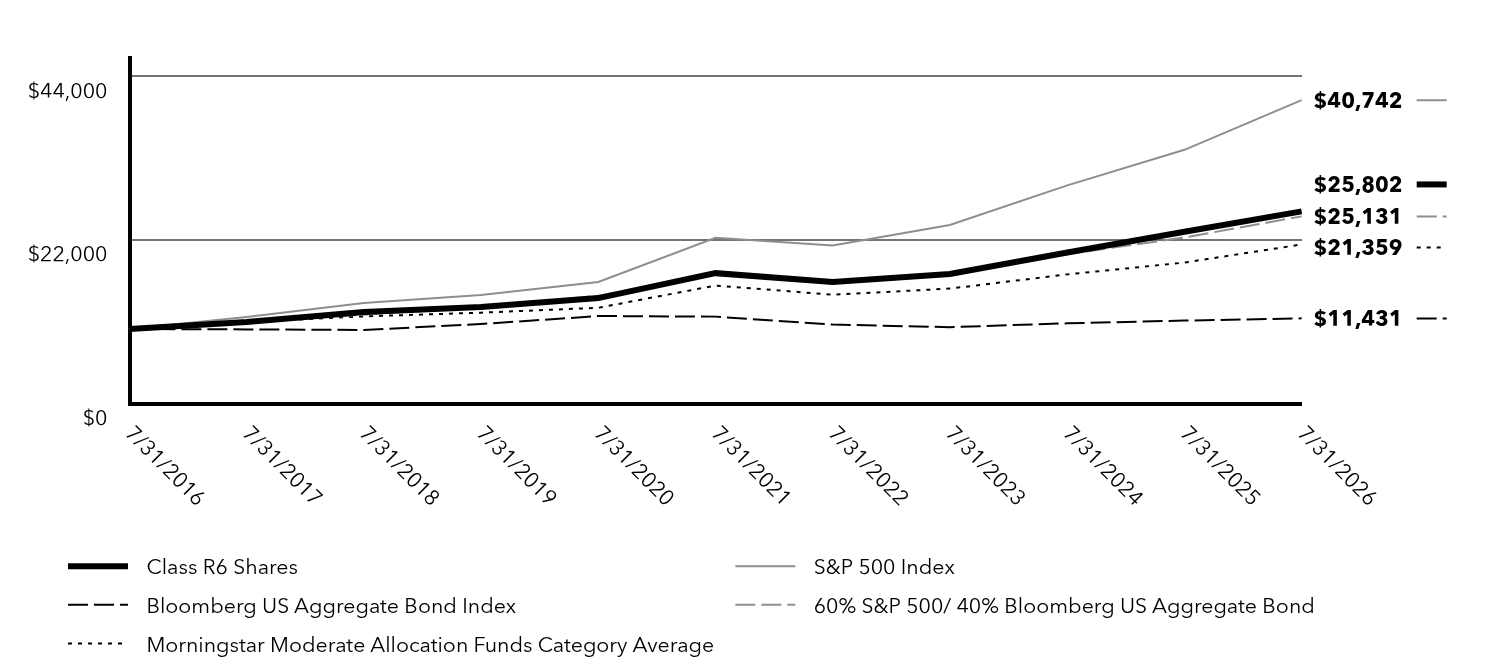
Table Summary | Class R6 Shares | S&P 500 Index | Bloomberg US Aggregate Bond Index | 60% S&P 500/ 40% Bloomberg US Aggregate Bond | Morningstar Moderate Allocation Funds Category Average |
|---|
7/31/2016 | $10,000 | $10,000 | $10,000 | $10,000 | $10,000 |
|---|
7/31/2017 | $10,932 | $11,604 | $9,949 | $10,919 | $10,944 |
|---|
7/31/2018 | $12,270 | $13,489 | $9,869 | $11,927 | $11,696 |
|---|
7/31/2019 | $12,946 | $14,566 | $10,666 | $12,938 | $12,194 |
|---|
7/31/2020 | $14,153 | $16,308 | $11,746 | $14,470 | $12,858 |
|---|
7/31/2021 | $17,507 | $22,251 | $11,664 | $17,439 | $15,839 |
|---|
7/31/2022 | $16,314 | $21,219 | $10,600 | $16,366 | $14,612 |
|---|
7/31/2023 | $17,389 | $23,980 | $10,243 | $17,417 | $15,426 |
|---|
7/31/2024 | $20,285 | $29,292 | $10,766 | $20,057 | $17,341 |
|---|
7/31/2025 | $23,065 | $34,076 | $11,130 | $22,295 | $18,928 |
|---|
7/31/2026 | $25,802 | $40,742 | $11,431 | $25,131 | $21,359 |
|---|
|
| Average Annual Return [Table Text Block] |
Table SummaryFund/Index | 1 Year | 5 Years | 10 Years |
|---|
Class R6 Shares | 11.87% | 8.07% | 9.94% |
|---|
S&P 500 Index | 19.56% | 12.86% | 15.08% |
|---|
Bloomberg US Aggregate Bond Index | 2.71% | (0.40)% | 1.35% |
|---|
60% S&P 500/ 40% Bloomberg US Aggregate Bond | 12.72% | 7.58% | 9.65% |
|---|
Morningstar Moderate Allocation Funds Category Average | 12.86% | 6.15% | 7.92% |
|---|
|
| No Deduction of Taxes [Text Block] |
The graph and table do not reflect the deduction of taxes that a shareholder would pay on fund distributions or redemption of fund shares.
|
| Updated Performance Information Location [Text Block] |
FederatedHermes.com/us/FundInformation
|
| AssetsNet |
$ 330,186,640
|
| Holdings Count | Holding |
536
|
| Advisory Fees Paid, Amount |
$ 2,326,872
|
| InvestmentCompanyPortfolioTurnover |
63.00%
|
| Additional Fund Statistics [Text Block] |
- Net Assets$330,186,640
- Number of Investments536
- Portfolio Turnover63%
- Total Advisory Fees Paid$2,326,872
|
| Holdings [Text Block] |
Top Security Types (% of Net Assets)Table SummaryValue | Value |
|---|
Commercial Mortgage-Backed Securities | 1.4% | Collaterized Mortgage Obligations | 1.6% | Cash Equivalents | 1.8% | Asset-Backed Securities | 2.5% | Project and Trade Finance Core Fund | 3.1% | U.S. Treasury Securities | 5.1% | International Equity Securities (including International Exchange-Traded Funds) | 6.0% | Mortgage Core Fund | 7.0% | Corporate Bonds | 9.2% | Domestic Equity Securities | 60.3% | Top Sectors - Equity (% of Equity Securities)Table SummaryValue | Value |
|---|
Utilities | 1.9% | Materials | 2.0% | Energy | 2.3% | Consumer Staples | 4.1% | Real Estate | 5.8% | Communication Services | 9.0% | Industrials | 10.1% | Consumer Discretionary | 10.2% | Health Care | 10.2% | Financials | 13.3% | Information Technology | 31.1% | |
| Material Fund Change [Text Block] |
|
| C000035058 |
|
| Shareholder Report [Line Items] |
|
| Fund Name |
Federated Hermes MDT Small Cap Core Fund
|
| Class Name |
Class A Shares
|
| Trading Symbol |
QASCX
|
| Annual or Semi-Annual Statement [Text Block] |
This annual shareholder report contains important information about the Federated Hermes MDT Small Cap Core Fund (the "Fund") for the period of August 1, 2025 to July 31, 2026.
|
| Additional Information [Text Block] |
You can find additional information at FederatedHermes.com/us/FundInformation. You can also request this information by contacting us at 1-800-341-7400, Option 4, or your financial advisor.
|
| Additional Information Phone Number |
1-800-341-7400
|
| Additional Information Website |
FederatedHermes.com/us/FundInformation
|
| Expenses [Text Block] |
What were the Fund costs for the last year? (based on a hypothetical $10,000 investment) Table SummaryClass Name | Costs of a $10,000 investment | Costs paid as a percentage of a $10,000 investment |
|---|
Class A Shares | $133 | 1.14% |
|---|
|
| Expenses Paid, Amount |
$ 133
|
| Expense Ratio, Percent |
1.14%
|
| Factors Affecting Performance [Text Block] |
Management's Discussion of Fund PerformanceThe following discussion compares the performance of the Fund to the Russell 2000 Index to show how the Fund’s performance compares to the returns of similar investments for the reporting period. See the Average Annual Total Returns table below for the returns of the Fund and related indexes, including the Russell 3000 Index, a required broad-based index, which represents approximately 98% of investable U.S. equities by market capitalization. The Fund seeks to provide long-term capital appreciation by investing primarily in common stock of small U.S. companies. Top Contributors to Performance An overweight position in younger companies with strong one-year returns and positive analyst conviction contributed positively to Fund relative performance. By sector, stock selection in Industrials, Financials and Communication Services aided performance. Top individual Fund holdings that contributed positively to performance included overweight positions in Powell Industries, Inc., MaxLinear, Inc. and SSR Mining, Inc.
Top Detractors from Performance Weak stock selection among companies with significant external financing required detracted from Fund relative performance. By sector, stock selection in Information Technology, Consumer Staples and Consumer Discretionary detracted from performance. Top individual Fund holdings that detracted from performance included overweight positions in MGP Ingredients, Inc., Sprouts Farmers Market, Inc. and Pagaya Technologies Ltd. Class A.
|
| Performance Past Does Not Indicate Future [Text] |
Keep in mind that the Fund’s past performance is not a predictor of how the Fund will perform in the future.
|
| Line Graph [Table Text Block] |
Table Summary | Class A Shares with sales load | Russell 3000® Index | Russell 2000® Index | Morningstar Small Blend Funds Category Average |
|---|
7/31/2016 | $9,449 | $10,000 | $10,000 | $10,000 |
|---|
7/31/2017 | $11,808 | $11,614 | $11,845 | $11,602 |
|---|
7/31/2018 | $13,992 | $13,517 | $14,064 | $13,424 |
|---|
7/31/2019 | $12,916 | $14,470 | $13,443 | $12,754 |
|---|
7/31/2020 | $11,791 | $16,052 | $12,826 | $11,625 |
|---|
7/31/2021 | $18,203 | $22,268 | $19,491 | $17,686 |
|---|
7/31/2022 | $16,467 | $20,631 | $16,705 | $16,215 |
|---|
7/31/2023 | $17,492 | $23,240 | $18,027 | $17,464 |
|---|
7/31/2024 | $20,771 | $28,138 | $20,596 | $20,000 |
|---|
7/31/2025 | $21,321 | $32,551 | $20,481 | $19,771 |
|---|
7/31/2026 | $28,439 | $38,932 | $27,483 | $25,357 |
|---|
|
| Average Annual Return [Table Text Block] |
Table SummaryFund/Index | 1 Year | 5 Years | 10 Years |
|---|
Class A Shares with sales load | 26.06% | 8.10% | 11.02% |
|---|
Class A Shares without sales load | 33.38% | 9.33% | 11.65% |
|---|
Russell 3000® Index | 19.60% | 11.82% | 14.56% |
|---|
Russell 2000® Index | 34.18% | 7.11% | 10.64% |
|---|
Morningstar Small Blend Funds Category Average | 28.33% | 7.42% | 9.71% |
|---|
|
| No Deduction of Taxes [Text Block] |
The graph and table do not reflect the deduction of taxes that a shareholder would pay on fund distributions or redemption of fund shares.
|
| Updated Performance Information Location [Text Block] |
FederatedHermes.com/us/FundInformation
|
| AssetsNet |
$ 2,249,807,252
|
| Holdings Count | Holding |
301
|
| Advisory Fees Paid, Amount |
$ 12,767,072
|
| InvestmentCompanyPortfolioTurnover |
76.00%
|
| Additional Fund Statistics [Text Block] |
- Net Assets$2,249,807,252
- Number of Investments301
- Portfolio Turnover76%
- Total Advisory Fees Paid$12,767,072
|
| Holdings [Text Block] |
Top Sectors (% of Net Assets)Table SummaryValue | Value |
|---|
Consumer Staples | 1.3% | Utilities | 1.6% | Communication Services | 1.6% | Materials | 4.0% | Energy | 5.2% | Real Estate | 6.7% | Consumer Discretionary | 8.7% | Information Technology | 13.0% | Industrials | 15.1% | Health Care | 20.0% | Financials | 20.4% | |
| Material Fund Change [Text Block] |
|
| C000035059 |
|
| Shareholder Report [Line Items] |
|
| Fund Name |
Federated Hermes MDT Small Cap Core Fund
|
| Class Name |
Class C Shares
|
| Trading Symbol |
QCSCX
|
| Annual or Semi-Annual Statement [Text Block] |
This annual shareholder report contains important information about the Federated Hermes MDT Small Cap Core Fund (the "Fund") for the period of August 1, 2025 to July 31, 2026.
|
| Additional Information [Text Block] |
You can find additional information at FederatedHermes.com/us/FundInformation. You can also request this information by contacting us at 1-800-341-7400, Option 4, or your financial advisor.
|
| Additional Information Phone Number |
1-800-341-7400
|
| Additional Information Website |
FederatedHermes.com/us/FundInformation
|
| Expenses [Text Block] |
What were the Fund costs for the last year? (based on a hypothetical $10,000 investment) Table SummaryClass Name | Costs of a $10,000 investment | Costs paid as a percentage of a $10,000 investment |
|---|
Class C Shares | $228 | 1.96% |
|---|
|
| Expenses Paid, Amount |
$ 228
|
| Expense Ratio, Percent |
1.96%
|
| Factors Affecting Performance [Text Block] |
Management's Discussion of Fund PerformanceThe following discussion compares the performance of the Fund to the Russell 2000 Index to show how the Fund’s performance compares to the returns of similar investments for the reporting period. See the Average Annual Total Returns table below for the returns of the Fund and related indexes, including the Russell 3000 Index, a required broad-based index, which represents approximately 98% of investable U.S. equities by market capitalization. The Fund seeks to provide long-term capital appreciation by investing primarily in common stock of small U.S. companies. Top Contributors to Performance An overweight position in younger companies with strong one-year returns and positive analyst conviction contributed positively to Fund relative performance. By sector, stock selection in Industrials, Financials and Communication Services aided performance. Top individual Fund holdings that contributed positively to performance included overweight positions in Powell Industries, Inc., MaxLinear, Inc. and SSR Mining, Inc.
Top Detractors from Performance Weak stock selection among companies with significant external financing required detracted from Fund relative performance. By sector, stock selection in Information Technology, Consumer Staples and Consumer Discretionary detracted from performance. Top individual Fund holdings that detracted from performance included overweight positions in MGP Ingredients, Inc., Sprouts Farmers Market, Inc. and Pagaya Technologies Ltd. Class A.
|
| Performance Past Does Not Indicate Future [Text] |
Keep in mind that the Fund’s past performance is not a predictor of how the Fund will perform in the future.
|
| Line Graph [Table Text Block] |
Table Summary | Class C Shares with sales load | Russell 3000® Index | Russell 2000® Index | Morningstar Small Blend Funds Category Average |
|---|
7/31/2016 | $10,000 | $10,000 | $10,000 | $10,000 |
|---|
7/31/2017 | $12,398 | $11,614 | $11,845 | $11,602 |
|---|
7/31/2018 | $14,580 | $13,517 | $14,064 | $13,424 |
|---|
7/31/2019 | $13,363 | $14,470 | $13,443 | $12,754 |
|---|
7/31/2020 | $12,114 | $16,052 | $12,826 | $11,625 |
|---|
7/31/2021 | $18,553 | $22,268 | $19,491 | $17,686 |
|---|
7/31/2022 | $16,642 | $20,631 | $16,705 | $16,215 |
|---|
7/31/2023 | $17,533 | $23,240 | $18,027 | $17,464 |
|---|
7/31/2024 | $20,643 | $28,138 | $20,596 | $20,000 |
|---|
7/31/2025 | $21,189 | $32,551 | $20,481 | $19,771 |
|---|
7/31/2026 | $28,262 | $38,932 | $27,483 | $25,357 |
|---|
|
| Average Annual Return [Table Text Block] |
Table SummaryFund/Index | 1 Year | 5 Years | 10 Years |
|---|
Class C Shares with sales load | 31.26% | 8.43% | 10.95% |
|---|
Class C Shares without sales load | 32.26% | 8.43% | 10.95% |
|---|
Russell 3000® Index | 19.60% | 11.82% | 14.56% |
|---|
Russell 2000® Index | 34.18% | 7.11% | 10.64% |
|---|
Morningstar Small Blend Funds Category Average | 28.33% | 7.42% | 9.71% |
|---|
|
| No Deduction of Taxes [Text Block] |
The graph and table do not reflect the deduction of taxes that a shareholder would pay on fund distributions or redemption of fund shares.
|
| Updated Performance Information Location [Text Block] |
FederatedHermes.com/us/FundInformation
|
| AssetsNet |
$ 2,249,807,252
|
| Holdings Count | Holding |
301
|
| Advisory Fees Paid, Amount |
$ 12,767,072
|
| InvestmentCompanyPortfolioTurnover |
76.00%
|
| Additional Fund Statistics [Text Block] |
- Net Assets$2,249,807,252
- Number of Investments301
- Portfolio Turnover76%
- Total Advisory Fees Paid$12,767,072
|
| Holdings [Text Block] |
Top Sectors (% of Net Assets)Table SummaryValue | Value |
|---|
Consumer Staples | 1.3% | Utilities | 1.6% | Communication Services | 1.6% | Materials | 4.0% | Energy | 5.2% | Real Estate | 6.7% | Consumer Discretionary | 8.7% | Information Technology | 13.0% | Industrials | 15.1% | Health Care | 20.0% | Financials | 20.4% | |
| Material Fund Change [Text Block] |
|
| C000035060 |
|
| Shareholder Report [Line Items] |
|
| Fund Name |
Federated Hermes MDT Small Cap Core Fund
|
| Class Name |
Institutional Shares
|
| Trading Symbol |
QISCX
|
| Annual or Semi-Annual Statement [Text Block] |
This annual shareholder report contains important information about the Federated Hermes MDT Small Cap Core Fund (the "Fund") for the period of August 1, 2025 to July 31, 2026.
|
| Additional Information [Text Block] |
You can find additional information at FederatedHermes.com/us/FundInformation. You can also request this information by contacting us at 1-800-341-7400, Option 4, or your financial advisor.
|
| Additional Information Phone Number |
1-800-341-7400
|
| Additional Information Website |
FederatedHermes.com/us/FundInformation
|
| Expenses [Text Block] |
What were the Fund costs for the last year? (based on a hypothetical $10,000 investment) Table SummaryClass Name | Costs of a $10,000 investment | Costs paid as a percentage of a $10,000 investment |
|---|
Institutional Shares | $104 | 0.89% |
|---|
|
| Expenses Paid, Amount |
$ 104
|
| Expense Ratio, Percent |
0.89%
|
| Factors Affecting Performance [Text Block] |
Management's Discussion of Fund PerformanceThe following discussion compares the performance of the Fund to the Russell 2000 Index to show how the Fund’s performance compares to the returns of similar investments for the reporting period. See the Average Annual Total Returns table below for the returns of the Fund and related indexes, including the Russell 3000 Index, a required broad-based index, which represents approximately 98% of investable U.S. equities by market capitalization. The Fund seeks to provide long-term capital appreciation by investing primarily in common stock of small U.S. companies. Top Contributors to Performance An overweight position in younger companies with strong one-year returns and positive analyst conviction contributed positively to Fund relative performance. By sector, stock selection in Industrials, Financials and Communication Services aided performance. Top individual Fund holdings that contributed positively to performance included overweight positions in Powell Industries, Inc., MaxLinear, Inc. and SSR Mining, Inc.
Top Detractors from Performance Weak stock selection among companies with significant external financing required detracted from Fund relative performance. By sector, stock selection in Information Technology, Consumer Staples and Consumer Discretionary detracted from performance. Top individual Fund holdings that detracted from performance included overweight positions in MGP Ingredients, Inc., Sprouts Farmers Market, Inc. and Pagaya Technologies Ltd. Class A.
|
| Performance Past Does Not Indicate Future [Text] |
Keep in mind that the Fund’s past performance is not a predictor of how the Fund will perform in the future.
|
| Line Graph [Table Text Block] |
Table Summary | Institutional Shares | Russell 3000® Index | Russell 2000® Index | Morningstar Small Blend Funds Category Average |
|---|
7/31/2016 | $10,000 | $10,000 | $10,000 | $10,000 |
|---|
7/31/2017 | $12,524 | $11,614 | $11,845 | $11,602 |
|---|
7/31/2018 | $14,876 | $13,517 | $14,064 | $13,424 |
|---|
7/31/2019 | $13,768 | $14,470 | $13,443 | $12,754 |
|---|
7/31/2020 | $12,604 | $16,052 | $12,826 | $11,625 |
|---|
7/31/2021 | $19,502 | $22,268 | $19,491 | $17,686 |
|---|
7/31/2022 | $17,686 | $20,631 | $16,705 | $16,215 |
|---|
7/31/2023 | $18,830 | $23,240 | $18,027 | $17,464 |
|---|
7/31/2024 | $22,424 | $28,138 | $20,596 | $20,000 |
|---|
7/31/2025 | $23,076 | $32,551 | $20,481 | $19,771 |
|---|
7/31/2026 | $30,849 | $38,932 | $27,483 | $25,357 |
|---|
|
| Average Annual Return [Table Text Block] |
Table SummaryFund/Index | 1 Year | 5 Years | 10 Years |
|---|
Institutional Shares | 33.68% | 9.60% | 11.92% |
|---|
Russell 3000® Index | 19.60% | 11.82% | 14.56% |
|---|
Russell 2000® Index | 34.18% | 7.11% | 10.64% |
|---|
Morningstar Small Blend Funds Category Average | 28.33% | 7.42% | 9.71% |
|---|
|
| No Deduction of Taxes [Text Block] |
The graph and table do not reflect the deduction of taxes that a shareholder would pay on fund distributions or redemption of fund shares.
|
| Updated Performance Information Location [Text Block] |
FederatedHermes.com/us/FundInformation
|
| AssetsNet |
$ 2,249,807,252
|
| Holdings Count | Holding |
301
|
| Advisory Fees Paid, Amount |
$ 12,767,072
|
| InvestmentCompanyPortfolioTurnover |
76.00%
|
| Additional Fund Statistics [Text Block] |
- Net Assets$2,249,807,252
- Number of Investments301
- Portfolio Turnover76%
- Total Advisory Fees Paid$12,767,072
|
| Holdings [Text Block] |
Top Sectors (% of Net Assets)Table SummaryValue | Value |
|---|
Consumer Staples | 1.3% | Utilities | 1.6% | Communication Services | 1.6% | Materials | 4.0% | Energy | 5.2% | Real Estate | 6.7% | Consumer Discretionary | 8.7% | Information Technology | 13.0% | Industrials | 15.1% | Health Care | 20.0% | Financials | 20.4% | |
| Material Fund Change [Text Block] |
|
| C000170839 |
|
| Shareholder Report [Line Items] |
|
| Fund Name |
Federated Hermes MDT Small Cap Core Fund
|
| Class Name |
Class R6 Shares
|
| Trading Symbol |
QLSCX
|
| Annual or Semi-Annual Statement [Text Block] |
This annual shareholder report contains important information about the Federated Hermes MDT Small Cap Core Fund (the "Fund") for the period of August 1, 2025 to July 31, 2026.
|
| Additional Information [Text Block] |
You can find additional information at FederatedHermes.com/us/FundInformation. You can also request this information by contacting us at 1-800-341-7400, Option 4, or your financial advisor.
|
| Additional Information Phone Number |
1-800-341-7400
|
| Additional Information Website |
FederatedHermes.com/us/FundInformation
|
| Expenses [Text Block] |
What were the Fund costs for the last year? (based on a hypothetical $10,000 investment) Table SummaryClass Name | Costs of a $10,000 investment | Costs paid as a percentage of a $10,000 investment |
|---|
Class R6 Shares | $102 | 0.87% |
|---|
|
| Expenses Paid, Amount |
$ 102
|
| Expense Ratio, Percent |
0.87%
|
| Factors Affecting Performance [Text Block] |
Management's Discussion of Fund PerformanceThe following discussion compares the performance of the Fund to the Russell 2000 Index to show how the Fund’s performance compares to the returns of similar investments for the reporting period. See the Average Annual Total Returns table below for the returns of the Fund and related indexes, including the Russell 3000 Index, a required broad-based index, which represents approximately 98% of investable U.S. equities by market capitalization. The Fund seeks to provide long-term capital appreciation by investing primarily in common stock of small U.S. companies. Top Contributors to Performance An overweight position in younger companies with strong one-year returns and positive analyst conviction contributed positively to Fund relative performance. By sector, stock selection in Industrials, Financials and Communication Services aided performance. Top individual Fund holdings that contributed positively to performance included overweight positions in Powell Industries, Inc., MaxLinear, Inc. and SSR Mining, Inc.
Top Detractors from Performance Weak stock selection among companies with significant external financing required detracted from Fund relative performance. By sector, stock selection in Information Technology, Consumer Staples and Consumer Discretionary detracted from performance. Top individual Fund holdings that detracted from performance included overweight positions in MGP Ingredients, Inc., Sprouts Farmers Market, Inc. and Pagaya Technologies Ltd. Class A.
|
| Performance Past Does Not Indicate Future [Text] |
Keep in mind that the Fund’s past performance is not a predictor of how the Fund will perform in the future.
|
| Line Graph [Table Text Block] |
Table Summary | Class R6 Shares | Russell 3000® Index | Russell 2000® Index | Morningstar Small Blend Funds Category Average |
|---|
7/31/2016 | $10,000 | $10,000 | $10,000 | $10,000 |
|---|
7/31/2017 | $12,524 | $11,614 | $11,845 | $11,602 |
|---|
7/31/2018 | $14,876 | $13,517 | $14,064 | $13,424 |
|---|
7/31/2019 | $13,769 | $14,470 | $13,443 | $12,754 |
|---|
7/31/2020 | $12,606 | $16,052 | $12,826 | $11,625 |
|---|
7/31/2021 | $19,513 | $22,268 | $19,491 | $17,686 |
|---|
7/31/2022 | $17,698 | $20,631 | $16,705 | $16,215 |
|---|
7/31/2023 | $18,844 | $23,240 | $18,027 | $17,464 |
|---|
7/31/2024 | $22,441 | $28,138 | $20,596 | $20,000 |
|---|
7/31/2025 | $23,096 | $32,551 | $20,481 | $19,771 |
|---|
7/31/2026 | $30,887 | $38,932 | $27,483 | $25,357 |
|---|
|
| Average Annual Return [Table Text Block] |
Table SummaryFund/Index | 1 Year | 5 Years | 10 Years |
|---|
Class R6 Shares | 33.73% | 9.62% | 11.94% |
|---|
Russell 3000® Index | 19.60% | 11.82% | 14.56% |
|---|
Russell 2000® Index | 34.18% | 7.11% | 10.64% |
|---|
Morningstar Small Blend Funds Category Average | 28.33% | 7.42% | 9.71% |
|---|
|
| No Deduction of Taxes [Text Block] |
The graph and table do not reflect the deduction of taxes that a shareholder would pay on fund distributions or redemption of fund shares.
|
| Updated Performance Information Location [Text Block] |
FederatedHermes.com/us/FundInformation
|
| AssetsNet |
$ 2,249,807,252
|
| Holdings Count | Holding |
301
|
| Advisory Fees Paid, Amount |
$ 12,767,072
|
| InvestmentCompanyPortfolioTurnover |
76.00%
|
| Additional Fund Statistics [Text Block] |
- Net Assets$2,249,807,252
- Number of Investments301
- Portfolio Turnover76%
- Total Advisory Fees Paid$12,767,072
|
| Holdings [Text Block] |
Top Sectors (% of Net Assets)Table SummaryValue | Value |
|---|
Consumer Staples | 1.3% | Utilities | 1.6% | Communication Services | 1.6% | Materials | 4.0% | Energy | 5.2% | Real Estate | 6.7% | Consumer Discretionary | 8.7% | Information Technology | 13.0% | Industrials | 15.1% | Health Care | 20.0% | Financials | 20.4% | |
| Material Fund Change [Text Block] |
|
| C000035061 |
|
| Shareholder Report [Line Items] |
|
| Fund Name |
Federated Hermes MDT Small Cap Growth Fund
|
| Class Name |
Class A Shares
|
| Trading Symbol |
QASGX
|
| Annual or Semi-Annual Statement [Text Block] |
This annual shareholder report contains important information about the Federated Hermes MDT Small Cap Growth Fund (the "Fund") for the period of August 1, 2025 to July 31, 2026.
|
| Additional Information [Text Block] |
You can find additional information at FederatedHermes.com/us/FundInformation. You can also request this information by contacting us at 1-800-341-7400, Option 4, or your financial advisor.
|
| Material Fund Change Notice [Text Block] |
This report describes changes made to the Fund during the reporting period.
|
| Additional Information Phone Number |
1-800-341-7400
|
| Additional Information Website |
FederatedHermes.com/us/FundInformation
|
| Expenses [Text Block] |
What were the Fund costs for the last year? (based on a hypothetical $10,000 investment) Table SummaryClass Name | Costs of a $10,000 investment | Costs paid as a percentage of a $10,000 investment |
|---|
Class A Shares | $133 | 1.14% |
|---|
|
| Expenses Paid, Amount |
$ 133
|
| Expense Ratio, Percent |
1.14%
|
| Factors Affecting Performance [Text Block] |
Management's Discussion of Fund PerformanceThe following discussion compares the performance of the Fund to the Russell 2000 Growth Index to show how the Fund’s performance compares to the returns of similar investments for the reporting period. See the Average Annual Total Returns table below for the returns of the Fund and related indexes, including the Russell 3000 Index, a required broad-based index, which represents approximately 98% of investable U.S. equities by market capitalization. The Fund seeks to provide long-term capital appreciation by investing primarily in common stock of small U.S. companies. Top Contributors to Performance An overweight position in and strong stock selection among younger companies with very high analyst conviction contributed positively to Fund relative performance. By sector, stock selection in Industrials, Financials and Materials aided performance. Top individual Fund holdings that contributed positively to performance included overweight positions in MaxLinear, Inc., Powell Industries, Inc., and BrightSpring Health Services, Inc.
Top Detractors from Performance Negative stock selection among companies with significant external financing required and whose stock prices were trading near highs detracted from Fund relative performance. By sector, stock selection in Information Technology and Consumer Staples detracted from performance. Top individual Fund holdings that detracted from performance included overweight positions in Sprouts Farmers Market, Inc. and MGP Ingredients, Inc., as well as an underweight position in SiTime Corporation.
|
| Performance Past Does Not Indicate Future [Text] |
Keep in mind that the Fund’s past performance is not a predictor of how the Fund will perform in the future.
|
| Line Graph [Table Text Block] |
Table Summary | Class A Shares with sales load | Russell 3000® Index | Russell 2000® Growth Index | Morningstar Small Growth Funds Category Average |
|---|
7/31/2016 | $9,449 | $10,000 | $10,000 | $10,000 |
|---|
7/31/2017 | $11,906 | $11,614 | $11,776 | $11,766 |
|---|
7/31/2018 | $14,703 | $13,517 | $14,474 | $14,456 |
|---|
7/31/2019 | $14,280 | $14,470 | $14,298 | $14,931 |
|---|
7/31/2020 | $14,648 | $16,052 | $15,156 | $16,218 |
|---|
7/31/2021 | $20,804 | $22,268 | $21,370 | $23,448 |
|---|
7/31/2022 | $16,965 | $20,631 | $16,416 | $18,151 |
|---|
7/31/2023 | $18,861 | $23,240 | $18,318 | $19,582 |
|---|
7/31/2024 | $21,229 | $28,138 | $20,662 | $21,833 |
|---|
7/31/2025 | $22,704 | $32,551 | $21,313 | $22,513 |
|---|
7/31/2026 | $30,352 | $38,932 | $27,371 | $27,679 |
|---|
|
| Average Annual Return [Table Text Block] |
Table SummaryFund/Index | 1 Year | 5 Years | 10 Years |
|---|
Class A Shares with sales load | 26.32% | 6.64% | 11.74% |
|---|
Class A Shares without sales load | 33.68% | 7.85% | 12.38% |
|---|
Russell 3000® Index | 19.60% | 11.82% | 14.56% |
|---|
Russell 2000® Growth Index | 28.42% | 5.08% | 10.59% |
|---|
Morningstar Small Growth Funds Category Average | 22.97% | 3.36% | 10.72% |
|---|
|
| No Deduction of Taxes [Text Block] |
The graph and table do not reflect the deduction of taxes that a shareholder would pay on fund distributions or redemption of fund shares.
|
| Updated Performance Information Location [Text Block] |
FederatedHermes.com/us/FundInformation
|
| AssetsNet |
$ 834,895,319
|
| Holdings Count | Holding |
251
|
| Advisory Fees Paid, Amount |
$ 4,472,999
|
| InvestmentCompanyPortfolioTurnover |
92.00%
|
| Additional Fund Statistics [Text Block] |
- Net Assets$834,895,319
- Number of Investments251
- Portfolio Turnover92%
- Total Advisory Fees Paid$4,472,999
|
| Holdings [Text Block] |
Top Sectors (% of Net Assets)Table SummaryValue | Value |
|---|
Consumer Staples | 0.6% | Communication Services | 1.0% | Real Estate | 2.2% | Materials | 3.9% | Energy | 4.8% | Consumer Discretionary | 9.1% | Financials | 10.9% | Industrials | 17.2% | Information Technology | 19.4% | Health Care | 28.9% | |
| Material Fund Change [Text Block] |
Following is a summary of material changes made to the Fund during the reporting period. For more complete and current information, you may review the Fund’s disclosure documents on its webpage at FederatedHermes.com/us/FundInformation or upon request at 1-800-341-7400, Option 4, or by contacting your financial advisor. Effective September 28, 2026, the Fund’s non-fundamental 80% investment policy will change to the following: Under normal circumstances, the Fund will invest its assets so that at least 80% of its net assets (plus any borrowings for investment purposes) are invested in small-cap growth investments. For purposes of this policy, small-cap investments will be defined as companies with market capitalizations within the range of companies in the Russell 2000 Index, and growth investments will be defined as companies with growth characteristics that meet the applicable parameters for inclusion in the Russell 3000 Growth Index. |
| Material Fund Change Strategies [Text Block] |
Effective September 28, 2026, the Fund’s non-fundamental 80% investment policy will change to the following: Under normal circumstances, the Fund will invest its assets so that at least 80% of its net assets (plus any borrowings for investment purposes) are invested in small-cap growth investments. For purposes of this policy, small-cap investments will be defined as companies with market capitalizations within the range of companies in the Russell 2000 Index, and growth investments will be defined as companies with growth characteristics that meet the applicable parameters for inclusion in the Russell 3000 Growth Index.
|
| Summary of Change Legend [Text Block] |
Following is a summary of material changes made to the Fund during the reporting period. For more complete and current information, you may review the Fund’s disclosure documents on its webpage at FederatedHermes.com/us/FundInformation or upon request at 1-800-341-7400, Option 4, or by contacting your financial advisor.
|
| Updated Prospectus Phone Number |
1-800-341-7400
|
| Updated Prospectus Web Address |
<span style="box-sizing: border-box; color: rgb(0, 0, 0); display: inline; flex-wrap: nowrap; font-size: 12px; font-weight: 400; grid-area: auto; line-height: 18px; margin: 0px; overflow: visible; text-align: left; text-align-last: auto; white-space-collapse: preserve-breaks;"><span style="text-decoration: underline; box-sizing: border-box; color: rgb(0, 0, 0); display: inline; flex-wrap: nowrap; font-size: 12px; font-weight: 400; grid-area: auto; line-height: 18px; margin: 0px; overflow: visible; text-align: left; text-align-last: auto; white-space-collapse: preserve-breaks;">FederatedHermes.com/us/FundInformation</span></span>
|
| C000035062 |
|
| Shareholder Report [Line Items] |
|
| Fund Name |
Federated Hermes MDT Small Cap Growth Fund
|
| Class Name |
Class C Shares
|
| Trading Symbol |
QCSGX
|
| Annual or Semi-Annual Statement [Text Block] |
This annual shareholder report contains important information about the Federated Hermes MDT Small Cap Growth Fund (the "Fund") for the period of August 1, 2025 to July 31, 2026.
|
| Additional Information [Text Block] |
You can find additional information at FederatedHermes.com/us/FundInformation. You can also request this information by contacting us at 1-800-341-7400, Option 4, or your financial advisor.
|
| Material Fund Change Notice [Text Block] |
This report describes changes made to the Fund during the reporting period.
|
| Additional Information Phone Number |
1-800-341-7400
|
| Additional Information Website |
FederatedHermes.com/us/FundInformation
|
| Expenses [Text Block] |
What were the Fund costs for the last year? (based on a hypothetical $10,000 investment) Table SummaryClass Name | Costs of a $10,000 investment | Costs paid as a percentage of a $10,000 investment |
|---|
Class C Shares | $228 | 1.96% |
|---|
|
| Expenses Paid, Amount |
$ 228
|
| Expense Ratio, Percent |
1.96%
|
| Factors Affecting Performance [Text Block] |
Management's Discussion of Fund PerformanceThe following discussion compares the performance of the Fund to the Russell 2000 Growth Index to show how the Fund’s performance compares to the returns of similar investments for the reporting period. See the Average Annual Total Returns table below for the returns of the Fund and related indexes, including the Russell 3000 Index, a required broad-based index, which represents approximately 98% of investable U.S. equities by market capitalization. The Fund seeks to provide long-term capital appreciation by investing primarily in common stock of small U.S. companies. Top Contributors to Performance An overweight position in and strong stock selection among younger companies with very high analyst conviction contributed positively to Fund relative performance. By sector, stock selection in Industrials, Financials and Materials aided performance. Top individual Fund holdings that contributed positively to performance included overweight positions in MaxLinear, Inc., Powell Industries, Inc., and BrightSpring Health Services, Inc.
Top Detractors from Performance Negative stock selection among companies with significant external financing required and whose stock prices were trading near highs detracted from Fund relative performance. By sector, stock selection in Information Technology and Consumer Staples detracted from performance. Top individual Fund holdings that detracted from performance included overweight positions in Sprouts Farmers Market, Inc. and MGP Ingredients, Inc., as well as an underweight position in SiTime Corporation.
|
| Performance Past Does Not Indicate Future [Text] |
Keep in mind that the Fund’s past performance is not a predictor of how the Fund will perform in the future.
|
| Line Graph [Table Text Block] |
Table Summary | Class C Shares with sales load | Russell 3000® Index | Russell 2000® Growth Index | Morningstar Small Growth Funds Category Average |
|---|
7/31/2016 | $10,000 | $10,000 | $10,000 | $10,000 |
|---|
7/31/2017 | $12,508 | $11,614 | $11,776 | $11,766 |
|---|
7/31/2018 | $15,327 | $13,517 | $14,474 | $14,456 |
|---|
7/31/2019 | $14,778 | $14,470 | $14,298 | $14,931 |
|---|
7/31/2020 | $15,047 | $16,052 | $15,156 | $16,218 |
|---|
7/31/2021 | $21,206 | $22,268 | $21,370 | $23,448 |
|---|
7/31/2022 | $17,148 | $20,631 | $16,416 | $18,151 |
|---|
7/31/2023 | $18,909 | $23,240 | $18,318 | $19,582 |
|---|
7/31/2024 | $21,106 | $28,138 | $20,662 | $21,833 |
|---|
7/31/2025 | $22,572 | $32,551 | $21,313 | $22,513 |
|---|
7/31/2026 | $30,175 | $38,932 | $27,371 | $27,679 |
|---|
|
| Average Annual Return [Table Text Block] |
Table SummaryFund/Index | 1 Year | 5 Years | 10 Years |
|---|
Class C Shares with sales load | 31.64% | 6.95% | 11.68% |
|---|
Class C Shares without sales load | 32.64% | 6.95% | 11.68% |
|---|
Russell 3000® Index | 19.60% | 11.82% | 14.56% |
|---|
Russell 2000® Growth Index | 28.42% | 5.08% | 10.59% |
|---|
Morningstar Small Growth Funds Category Average | 22.97% | 3.36% | 10.72% |
|---|
|
| No Deduction of Taxes [Text Block] |
The graph and table do not reflect the deduction of taxes that a shareholder would pay on fund distributions or redemption of fund shares.
|
| Updated Performance Information Location [Text Block] |
FederatedHermes.com/us/FundInformation
|
| AssetsNet |
$ 834,895,319
|
| Holdings Count | Holding |
251
|
| Advisory Fees Paid, Amount |
$ 4,472,999
|
| InvestmentCompanyPortfolioTurnover |
92.00%
|
| Additional Fund Statistics [Text Block] |
- Net Assets$834,895,319
- Number of Investments251
- Portfolio Turnover92%
- Total Advisory Fees Paid$4,472,999
|
| Holdings [Text Block] |
Top Sectors (% of Net Assets)Table SummaryValue | Value |
|---|
Consumer Staples | 0.6% | Communication Services | 1.0% | Real Estate | 2.2% | Materials | 3.9% | Energy | 4.8% | Consumer Discretionary | 9.1% | Financials | 10.9% | Industrials | 17.2% | Information Technology | 19.4% | Health Care | 28.9% | |
| Material Fund Change [Text Block] |
Following is a summary of material changes made to the Fund during the reporting period. For more complete and current information, you may review the Fund’s disclosure documents on its webpage at FederatedHermes.com/us/FundInformation or upon request at 1-800-341-7400, Option 4, or by contacting your financial advisor. Effective September 28, 2026, the Fund’s non-fundamental 80% investment policy will change to the following: Under normal circumstances, the Fund will invest its assets so that at least 80% of its net assets (plus any borrowings for investment purposes) are invested in small-cap growth investments. For purposes of this policy, small-cap investments will be defined as companies with market capitalizations within the range of companies in the Russell 2000 Index, and growth investments will be defined as companies with growth characteristics that meet the applicable parameters for inclusion in the Russell 3000 Growth Index. |
| Material Fund Change Strategies [Text Block] |
Effective September 28, 2026, the Fund’s non-fundamental 80% investment policy will change to the following: Under normal circumstances, the Fund will invest its assets so that at least 80% of its net assets (plus any borrowings for investment purposes) are invested in small-cap growth investments. For purposes of this policy, small-cap investments will be defined as companies with market capitalizations within the range of companies in the Russell 2000 Index, and growth investments will be defined as companies with growth characteristics that meet the applicable parameters for inclusion in the Russell 3000 Growth Index.
|
| Summary of Change Legend [Text Block] |
Following is a summary of material changes made to the Fund during the reporting period. For more complete and current information, you may review the Fund’s disclosure documents on its webpage at FederatedHermes.com/us/FundInformation or upon request at 1-800-341-7400, Option 4, or by contacting your financial advisor.
|
| Updated Prospectus Phone Number |
1-800-341-7400
|
| Updated Prospectus Web Address |
<span style="box-sizing: border-box; color: rgb(0, 0, 0); display: inline; flex-wrap: nowrap; font-size: 12px; font-weight: 400; grid-area: auto; line-height: 18px; margin: 0px; overflow: visible; text-align: left; text-align-last: auto; white-space-collapse: preserve-breaks;"><span style="text-decoration: underline; box-sizing: border-box; color: rgb(0, 0, 0); display: inline; flex-wrap: nowrap; font-size: 12px; font-weight: 400; grid-area: auto; line-height: 18px; margin: 0px; overflow: visible; text-align: left; text-align-last: auto; white-space-collapse: preserve-breaks;">FederatedHermes.com/us/FundInformation</span></span>
|
| C000035063 |
|
| Shareholder Report [Line Items] |
|
| Fund Name |
Federated Hermes MDT Small Cap Growth Fund
|
| Class Name |
Institutional Shares
|
| Trading Symbol |
QISGX
|
| Annual or Semi-Annual Statement [Text Block] |
This annual shareholder report contains important information about the Federated Hermes MDT Small Cap Growth Fund (the "Fund") for the period of August 1, 2025 to July 31, 2026.
|
| Additional Information [Text Block] |
You can find additional information at FederatedHermes.com/us/FundInformation. You can also request this information by contacting us at 1-800-341-7400, Option 4, or your financial advisor.
|
| Material Fund Change Notice [Text Block] |
This report describes changes made to the Fund during the reporting period.
|
| Additional Information Phone Number |
1-800-341-7400
|
| Additional Information Website |
FederatedHermes.com/us/FundInformation
|
| Expenses [Text Block] |
What were the Fund costs for the last year? (based on a hypothetical $10,000 investment) Table SummaryClass Name | Costs of a $10,000 investment | Costs paid as a percentage of a $10,000 investment |
|---|
Institutional Shares | $104 | 0.89% |
|---|
|
| Expenses Paid, Amount |
$ 104
|
| Expense Ratio, Percent |
0.89%
|
| Factors Affecting Performance [Text Block] |
Management's Discussion of Fund PerformanceThe following discussion compares the performance of the Fund to the Russell 2000 Growth Index to show how the Fund’s performance compares to the returns of similar investments for the reporting period. See the Average Annual Total Returns table below for the returns of the Fund and related indexes, including the Russell 3000 Index, a required broad-based index, which represents approximately 98% of investable U.S. equities by market capitalization. The Fund seeks to provide long-term capital appreciation by investing primarily in common stock of small U.S. companies. Top Contributors to Performance An overweight position in and strong stock selection among younger companies with very high analyst conviction contributed positively to Fund relative performance. By sector, stock selection in Industrials, Financials and Materials aided performance. Top individual Fund holdings that contributed positively to performance included overweight positions in MaxLinear, Inc., Powell Industries, Inc., and BrightSpring Health Services, Inc.
Top Detractors from Performance Negative stock selection among companies with significant external financing required and whose stock prices were trading near highs detracted from Fund relative performance. By sector, stock selection in Information Technology and Consumer Staples detracted from performance. Top individual Fund holdings that detracted from performance included overweight positions in Sprouts Farmers Market, Inc. and MGP Ingredients, Inc., as well as an underweight position in SiTime Corporation.
|
| Performance Past Does Not Indicate Future [Text] |
Keep in mind that the Fund’s past performance is not a predictor of how the Fund will perform in the future.
|
| Line Graph [Table Text Block] |
Table Summary | Institutional Shares | Russell 3000® Index | Russell 2000® Growth Index | Morningstar Small Growth Funds Category Average |
|---|
7/31/2016 | $10,000 | $10,000 | $10,000 | $10,000 |
|---|
7/31/2017 | $12,627 | $11,614 | $11,776 | $11,766 |
|---|
7/31/2018 | $15,639 | $13,517 | $14,474 | $14,456 |
|---|
7/31/2019 | $15,226 | $14,470 | $14,298 | $14,931 |
|---|
7/31/2020 | $15,657 | $16,052 | $15,156 | $16,218 |
|---|
7/31/2021 | $22,295 | $22,268 | $21,370 | $23,448 |
|---|
7/31/2022 | $18,217 | $20,631 | $16,416 | $18,151 |
|---|
7/31/2023 | $20,310 | $23,240 | $18,318 | $19,582 |
|---|
7/31/2024 | $22,919 | $28,138 | $20,662 | $21,833 |
|---|
7/31/2025 | $24,574 | $32,551 | $21,313 | $22,513 |
|---|
7/31/2026 | $32,937 | $38,932 | $27,371 | $27,679 |
|---|
|
| Average Annual Return [Table Text Block] |
Table SummaryFund/Index | 1 Year | 5 Years | 10 Years |
|---|
Institutional Shares | 34.03% | 8.12% | 12.66% |
|---|
Russell 3000® Index | 19.60% | 11.82% | 14.56% |
|---|
Russell 2000® Growth Index | 28.42% | 5.08% | 10.59% |
|---|
Morningstar Small Growth Funds Category Average | 22.97% | 3.36% | 10.72% |
|---|
|
| No Deduction of Taxes [Text Block] |
The graph and table do not reflect the deduction of taxes that a shareholder would pay on fund distributions or redemption of fund shares.
|
| Updated Performance Information Location [Text Block] |
FederatedHermes.com/us/FundInformation
|
| AssetsNet |
$ 834,895,319
|
| Holdings Count | Holding |
251
|
| Advisory Fees Paid, Amount |
$ 4,472,999
|
| InvestmentCompanyPortfolioTurnover |
92.00%
|
| Additional Fund Statistics [Text Block] |
- Net Assets$834,895,319
- Number of Investments251
- Portfolio Turnover92%
- Total Advisory Fees Paid$4,472,999
|
| Holdings [Text Block] |
Top Sectors (% of Net Assets)Table SummaryValue | Value |
|---|
Consumer Staples | 0.6% | Communication Services | 1.0% | Real Estate | 2.2% | Materials | 3.9% | Energy | 4.8% | Consumer Discretionary | 9.1% | Financials | 10.9% | Industrials | 17.2% | Information Technology | 19.4% | Health Care | 28.9% | |
| Material Fund Change [Text Block] |
Following is a summary of material changes made to the Fund during the reporting period. For more complete and current information, you may review the Fund’s disclosure documents on its webpage at FederatedHermes.com/us/FundInformation or upon request at 1-800-341-7400, Option 4, or by contacting your financial advisor. Effective September 28, 2026, the Fund’s non-fundamental 80% investment policy will change to the following: Under normal circumstances, the Fund will invest its assets so that at least 80% of its net assets (plus any borrowings for investment purposes) are invested in small-cap growth investments. For purposes of this policy, small-cap investments will be defined as companies with market capitalizations within the range of companies in the Russell 2000 Index, and growth investments will be defined as companies with growth characteristics that meet the applicable parameters for inclusion in the Russell 3000 Growth Index. |
| Material Fund Change Strategies [Text Block] |
Effective September 28, 2026, the Fund’s non-fundamental 80% investment policy will change to the following: Under normal circumstances, the Fund will invest its assets so that at least 80% of its net assets (plus any borrowings for investment purposes) are invested in small-cap growth investments. For purposes of this policy, small-cap investments will be defined as companies with market capitalizations within the range of companies in the Russell 2000 Index, and growth investments will be defined as companies with growth characteristics that meet the applicable parameters for inclusion in the Russell 3000 Growth Index.
|
| Summary of Change Legend [Text Block] |
Following is a summary of material changes made to the Fund during the reporting period. For more complete and current information, you may review the Fund’s disclosure documents on its webpage at FederatedHermes.com/us/FundInformation or upon request at 1-800-341-7400, Option 4, or by contacting your financial advisor.
|
| Updated Prospectus Phone Number |
1-800-341-7400
|
| Updated Prospectus Web Address |
<span style="box-sizing: border-box; color: rgb(0, 0, 0); display: inline; flex-wrap: nowrap; font-size: 12px; font-weight: 400; grid-area: auto; line-height: 18px; margin: 0px; overflow: visible; text-align: left; text-align-last: auto; white-space-collapse: preserve-breaks;"><span style="text-decoration: underline; box-sizing: border-box; color: rgb(0, 0, 0); display: inline; flex-wrap: nowrap; font-size: 12px; font-weight: 400; grid-area: auto; line-height: 18px; margin: 0px; overflow: visible; text-align: left; text-align-last: auto; white-space-collapse: preserve-breaks;">FederatedHermes.com/us/FundInformation</span></span>
|
| C000170840 |
|
| Shareholder Report [Line Items] |
|
| Fund Name |
Federated Hermes MDT Small Cap Growth Fund
|
| Class Name |
Class R6 Shares
|
| Trading Symbol |
QLSGX
|
| Annual or Semi-Annual Statement [Text Block] |
This annual shareholder report contains important information about the Federated Hermes MDT Small Cap Growth Fund (the "Fund") for the period of August 1, 2025 to July 31, 2026.
|
| Additional Information [Text Block] |
You can find additional information at FederatedHermes.com/us/FundInformation. You can also request this information by contacting us at 1-800-341-7400, Option 4, or your financial advisor.
|
| Material Fund Change Notice [Text Block] |
This report describes changes made to the Fund during the reporting period.
|
| Additional Information Phone Number |
1-800-341-7400
|
| Additional Information Website |
FederatedHermes.com/us/FundInformation
|
| Expenses [Text Block] |
What were the Fund costs for the last year? (based on a hypothetical $10,000 investment) Table SummaryClass Name | Costs of a $10,000 investment | Costs paid as a percentage of a $10,000 investment |
|---|
Class R6 Shares | $103 | 0.88% |
|---|
|
| Expenses Paid, Amount |
$ 103
|
| Expense Ratio, Percent |
0.88%
|
| Factors Affecting Performance [Text Block] |
Management's Discussion of Fund PerformanceThe following discussion compares the performance of the Fund to the Russell 2000 Growth Index to show how the Fund’s performance compares to the returns of similar investments for the reporting period. See the Average Annual Total Returns table below for the returns of the Fund and related indexes, including the Russell 3000 Index, a required broad-based index, which represents approximately 98% of investable U.S. equities by market capitalization. The Fund seeks to provide long-term capital appreciation by investing primarily in common stock of small U.S. companies. Top Contributors to Performance An overweight position in and strong stock selection among younger companies with very high analyst conviction contributed positively to Fund relative performance. By sector, stock selection in Industrials, Financials and Materials aided performance. Top individual Fund holdings that contributed positively to performance included overweight positions in MaxLinear, Inc., Powell Industries, Inc., and BrightSpring Health Services, Inc.
Top Detractors from Performance Negative stock selection among companies with significant external financing required and whose stock prices were trading near highs detracted from Fund relative performance. By sector, stock selection in Information Technology and Consumer Staples detracted from performance. Top individual Fund holdings that detracted from performance included overweight positions in Sprouts Farmers Market, Inc. and MGP Ingredients, Inc., as well as an underweight position in SiTime Corporation.
|
| Performance Past Does Not Indicate Future [Text] |
Keep in mind that the Fund’s past performance is not a predictor of how the Fund will perform in the future.
|
| Line Graph [Table Text Block] |
Table Summary | Class R6 Shares | Russell 3000® Index | Russell 2000® Growth Index | Morningstar Small Growth Funds Category Average |
|---|
7/31/2016 | $10,000 | $10,000 | $10,000 | $10,000 |
|---|
7/31/2017 | $12,627 | $11,614 | $11,776 | $11,766 |
|---|
7/31/2018 | $15,633 | $13,517 | $14,474 | $14,456 |
|---|
7/31/2019 | $15,226 | $14,470 | $14,298 | $14,931 |
|---|
7/31/2020 | $15,664 | $16,052 | $15,156 | $16,218 |
|---|
7/31/2021 | $22,301 | $22,268 | $21,370 | $23,448 |
|---|
7/31/2022 | $18,233 | $20,631 | $16,416 | $18,151 |
|---|
7/31/2023 | $20,328 | $23,240 | $18,318 | $19,582 |
|---|
7/31/2024 | $22,940 | $28,138 | $20,662 | $21,833 |
|---|
7/31/2025 | $24,595 | $32,551 | $21,313 | $22,513 |
|---|
7/31/2026 | $32,976 | $38,932 | $27,371 | $27,679 |
|---|
|
| Average Annual Return [Table Text Block] |
Table SummaryFund/Index | 1 Year | 5 Years | 10 Years |
|---|
Class R6 Shares | 34.08% | 8.14% | 12.67% |
|---|
Russell 3000® Index | 19.60% | 11.82% | 14.56% |
|---|
Russell 2000® Growth Index | 28.42% | 5.08% | 10.59% |
|---|
Morningstar Small Growth Funds Category Average | 22.97% | 3.36% | 10.72% |
|---|
|
| No Deduction of Taxes [Text Block] |
The graph and table do not reflect the deduction of taxes that a shareholder would pay on fund distributions or redemption of fund shares.
|
| Updated Performance Information Location [Text Block] |
FederatedHermes.com/us/FundInformation
|
| AssetsNet |
$ 834,895,319
|
| Holdings Count | Holding |
251
|
| Advisory Fees Paid, Amount |
$ 4,472,999
|
| InvestmentCompanyPortfolioTurnover |
92.00%
|
| Additional Fund Statistics [Text Block] |
- Net Assets$834,895,319
- Number of Investments251
- Portfolio Turnover92%
- Total Advisory Fees Paid$4,472,999
|
| Holdings [Text Block] |
Top Sectors (% of Net Assets)Table SummaryValue | Value |
|---|
Consumer Staples | 0.6% | Communication Services | 1.0% | Real Estate | 2.2% | Materials | 3.9% | Energy | 4.8% | Consumer Discretionary | 9.1% | Financials | 10.9% | Industrials | 17.2% | Information Technology | 19.4% | Health Care | 28.9% | |
| Material Fund Change [Text Block] |
Following is a summary of material changes made to the Fund during the reporting period. For more complete and current information, you may review the Fund’s disclosure documents on its webpage at FederatedHermes.com/us/FundInformation or upon request at 1-800-341-7400, Option 4, or by contacting your financial advisor. Effective September 28, 2026, the Fund’s non-fundamental 80% investment policy will change to the following: Under normal circumstances, the Fund will invest its assets so that at least 80% of its net assets (plus any borrowings for investment purposes) are invested in small-cap growth investments. For purposes of this policy, small-cap investments will be defined as companies with market capitalizations within the range of companies in the Russell 2000 Index, and growth investments will be defined as companies with growth characteristics that meet the applicable parameters for inclusion in the Russell 3000 Growth Index. |
| Material Fund Change Strategies [Text Block] |
Effective September 28, 2026, the Fund’s non-fundamental 80% investment policy will change to the following: Under normal circumstances, the Fund will invest its assets so that at least 80% of its net assets (plus any borrowings for investment purposes) are invested in small-cap growth investments. For purposes of this policy, small-cap investments will be defined as companies with market capitalizations within the range of companies in the Russell 2000 Index, and growth investments will be defined as companies with growth characteristics that meet the applicable parameters for inclusion in the Russell 3000 Growth Index.
|
| Summary of Change Legend [Text Block] |
Following is a summary of material changes made to the Fund during the reporting period. For more complete and current information, you may review the Fund’s disclosure documents on its webpage at FederatedHermes.com/us/FundInformation or upon request at 1-800-341-7400, Option 4, or by contacting your financial advisor.
|
| Updated Prospectus Phone Number |
1-800-341-7400
|
| Updated Prospectus Web Address |
<span style="box-sizing: border-box; color: rgb(0, 0, 0); display: inline; flex-wrap: nowrap; font-size: 12px; font-weight: 400; grid-area: auto; line-height: 18px; margin: 0px; overflow: visible; text-align: left; text-align-last: auto; white-space-collapse: preserve-breaks;"><span style="text-decoration: underline; box-sizing: border-box; color: rgb(0, 0, 0); display: inline; flex-wrap: nowrap; font-size: 12px; font-weight: 400; grid-area: auto; line-height: 18px; margin: 0px; overflow: visible; text-align: left; text-align-last: auto; white-space-collapse: preserve-breaks;">FederatedHermes.com/us/FundInformation</span></span>
|