The bar chart and Average Annual Total Returns table give some indication of the risks of investing in the Fund. The bar chart shows the performance of Class I shares of the Fund for each full calendar year since the Fund’s inception. The Average Annual Total Returns table shows how the Fund’s average annual returns compare with those of a broad measure of market performance. Remember, the Fund’s past performance, before and after taxes, is not necessarily an indication of how the Fund will perform in the future. Updated performance information will be available at no cost by calling the Fund toll-free at 855-294-7540.
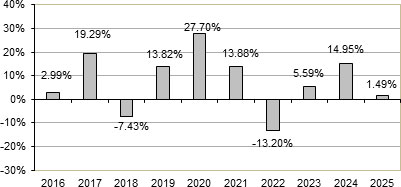
The calendar year-to-date return for the Fund’s Class I shares as of June 30, 2026 was 14.89%.
During the period shown in the bar chart, the best performance for a quarter was 9.85% (for the quarter ended June 30, 2020). The worst performance was -10.40% (for the quarter ended December 31, 2018).
| One Year | Five Year | Ten Year | |
| Class I Shares | |||
| Return Before Taxes | 1.49% | 4.02% | 7.24%* |
| Return After Taxes on Distributions | 1.49% | 3.15% | 1.80% |
| Return After Taxes on Distributions and Sale of Fund Shares | 0.88% | 2.71% | 2.70% |
| Class A shares | |||
| Return Before Taxes | (4.61)% | 2.52% | 6.31%** |
| Bloomberg U.S. Aggregate Bond Index | 7.30% | (0.36)% | 2.01% |
| SG Trend Index | 2.39% | 6.97% | 3.67% |
| * | Class I shares of the Longboard Fund commenced operations on March 19, 2015. |
| ** | Class A shares of the Longboard Fund commenced operations on December 9, 2015. |
After-tax returns are based on the highest historical individual federal marginal income tax rates, and do not reflect the impact of state and local taxes; actual after-tax returns depend on an individual investor’s tax situation and may differ from those shown. If you own shares of the Fund in a tax-deferred account, such as an individual retirement account or a 401(k) plan, this information is not applicable to your investment. A higher after-tax return results when a capital loss occurs upon redemption and translates into an assumed tax deduction that benefits the shareholder. After tax returns are shown for only Class I Shares. After tax returns for Class A shares will vary.
Bloomberg U.S. Aggregate Bond Index: A widely used, market-capitalization-weighted index that tracks the performance of the U.S. investment-grade fixed-rate debt market. It Includes a broad range of U.S. dollar-denominated securities, such as government bonds, investment-grade corporate debt, mortgage-backed securities (MBS), and asset-backed securities (ABS). which the adviser believes is more representative of the Fund’s strategy. The Bloomberg U.S. Aggregate Bond Index replaces the S&P 500 Total Return Index as the Fund’s primary broad-based securities market index.
SG Trend Index: The SG Trend Index tracks is designed to track the performance of large trend-following commodity trading advisers and managed futures programs. The index is composed of ten of the largest qualifying trend-following managers by assets under management, is equally weighted, and is reconstituted annually. The index reflects the net daily returns of its constituent programs.