The following performance information provides some indication of the risks of investing in the YP Amazon Fund by showing changes in the Fund’s performance over time. The following bar chart shows the YP Amazon Fund’s annual returns. The table illustrates how the YP Amazon Fund’s average annual returns for the 1-year and since inception periods compare with those of a broad measure of market performance. Although past performance of the YP Amazon Fund is no guarantee of how it will perform in the future, historical performance may give you some indication of the risks of investing in the Fund. Updated performance information will be available on the YP Amazon Fund’s website at www.kurvinvest.com.
Prior performance shown below is for the Predecessor YP Amazon Fund (the Kurv Yield Premium Strategy Amazon (AMZN) ETF, a former series of NEOS ETF Trust) for periods prior to November 18, 2024. The YP Amazon Fund has adopted the performance of the Predecessor YP Amazon Fund as a result of a reorganization in which the YP Amazon Fund acquired all the assets and liabilities of the Predecessor YP Amazon Fund (the “Reorganization”). Prior to the Reorganization, the YP Amazon Fund was a newly formed “shell” fund with no assets and had not commenced operations.
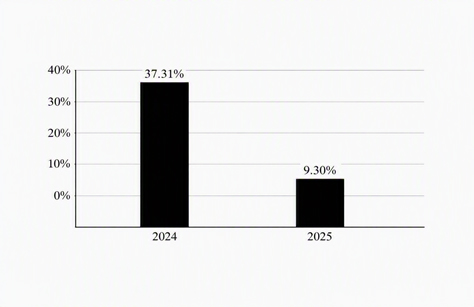
The YP Amazon Fund’s year-to-date return as of the most recent calendar quarter ended June 30, 2026, was -0.25%.
During
the period shown in the bar chart, the best performance for a quarter was 16.12% for the quarter ended December 31, 2024. The
worst performance was -12.37% for the quarter ended March 31, 2025.
| One Year | Since Inception* | |
| YP Amazon Fund | ||
| Return Before Taxes | 9.30% | 27.26% |
| Return After Taxes on Distributions | 7.19% | 21.82% |
| Return After Taxes on Distributions and Sale of Fund Shares | 5.47% | 18.62% |
S&P 500 Total Return Index (reflects no deduction for fees, expenses or taxes) |
17.88% | 27.44% |
| * | The YP Amazon Fund commenced operations on October 30, 2023. |
After-tax returns are based on the highest historical individual federal marginal income tax rates, and do not reflect the impact of state and local taxes; actual after-tax returns depend on an individual investor’s tax situation and may differ from those shown. If you own shares of the YP Amazon Fund in a tax-deferred account, such as an individual retirement account or a 401(k) plan, this information is not applicable to your investment. A higher after-tax return results when a capital loss occurs upon redemption and translates into an assumed tax deduction that benefits the shareholder.
The S&P 500 Total Return Index is an unmanaged market-capitalization-weighted index of 500 of the largest capitalized U.S. domiciled companies. Index returns assume reinvestment of dividends. Investors may not invest in the indexes directly; unlike the YP Amazon Fund’s returns, the indexes do not reflect any fees or expenses.
The following performance information provides some indication of the risks of investing in the YP Apple Fund by showing changes in the Fund’s performance over time. The following bar chart shows the YP Apple Fund’s annual returns. The table illustrates how the YP Apple Fund’s average annual returns for the 1-year and since inception periods compare with those of a broad measure of market performance. Although past performance of the YP Apple Fund is no guarantee of how it will perform in the future, historical performance may give you some indication of the risks of investing in the Fund. Updated performance information will be available on the YP Apple Fund’s website at www.kurvinvest.com.
Prior performance shown below is for the Predecessor YP Apple Fund (the Kurv Yield Premium Strategy Apple (AAPL) ETF) for periods prior to November 18, 2024. The YP Apple Fund has adopted the performance of the Predecessor YP Apple Fund as a result of a reorganization in which the Fund has acquired all the assets and liabilities of the Predecessor YP Apple Fund (the “Reorganization”). Prior to the Reorganization, the YP Apple Fund was a newly formed “shell” fund with no assets and had not commenced operations.
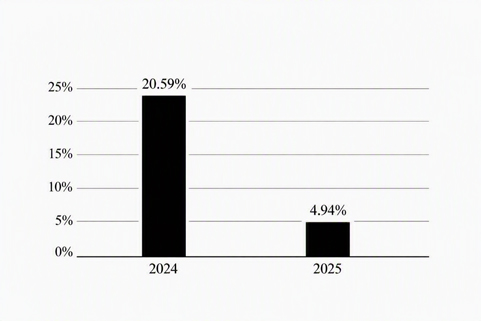
The YP Apple Fund’s year-to-date return as of the most recent calendar quarter ended June 30, 2026, was 5.77%.
During the period shown in the bar chart, the best performance for a quarter was 15.11% for the quarter ended September 30, 2025. The worst performance was -10.49% for the quarter ended March 31, 2025.
| One Year | Since Inception* | |
| YP Apple Fund | ||
| Return Before Taxes | 4.94% | 16.04% |
| Return After Taxes on Distributions | 3.93% | 12.33% |
| Return After Taxes on Distributions and Sale of Fund Shares | 2.85% | 10.60% |
S&P 500 Total Return Index (reflects no deduction for fees, expenses or taxes) |
17.88% | 27.71% |
| * | The YP Apple Fund commenced operations on October 26, 2023. |
After-tax returns are based on the highest historical individual federal marginal income tax rates, and do not reflect the impact of state and local taxes; actual after-tax returns depend on an individual investor’s tax situation and may differ from those shown. If you own shares of the YP Apple Fund in a tax-deferred account, such as an individual retirement account or a 401(k) plan, this information is not applicable to your investment. A higher after-tax return results when a capital loss occurs upon redemption and translates into an assumed tax deduction that benefits the shareholder.
The S&P 500 Total Return Index is an unmanaged market-capitalization-weighted index of 500 of the largest capitalized U.S. domiciled companies. Index returns assume reinvestment of dividends. Investors may not invest in the indexes directly; unlike the YP Apple Fund’s returns, the indexes do not reflect any fees or expenses.
The following performance information provides some indication of the risks of investing in the YP Google Fund by showing changes in the Fund’s performance over time. The following bar chart shows the YP Google Fund’s annual returns. The table illustrates how the YP Google Fund’s average annual returns for the 1-year and since inception periods compare with those of a broad measure of market performance. Although past performance of the YP Google Fund is no guarantee of how it will perform in the future, historical performance may give you some indication of the risks of investing in the Fund. Updated performance information will be available on the YP Google Fund’s website at www.kurvinvest.com.
Prior performance shown below is for the Predecessor YP Google Fund (the Kurv Yield Premium Strategy Google (GOOGL) ETF) for periods prior to November 18, 2024. The YP Google Fund has adopted the performance of the Predecessor YP Google Fund as a result of a reorganization in which the Fund has acquired all the assets and liabilities of the Predecessor YP Google Fund (the “Reorganization”). Prior to the Reorganization, the YP Google Fund was a newly formed “shell” fund with no assets and had not commenced operations.
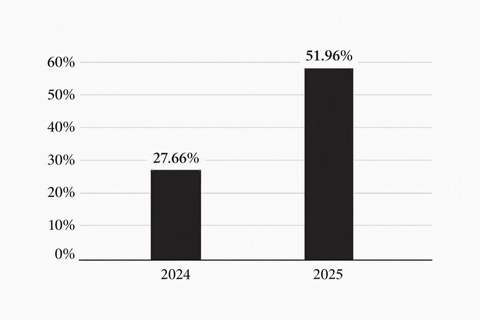
The YP Google Fund’s year-to-date return as of the most recent calendar quarter ended June 30, 2026, was 11.84%.
During the period shown in the bar chart, the best performance for a quarter was 30.34% for the quarter ended September 30, 2025. The worst performance was -17.52% for the quarter ended March 31, 2025.
| One Year | Since Inception* | |
| YP Google Fund | ||
| Return Before Taxes | 51.96% | 42.10% |
| Return After Taxes on Distributions | 51.00% | 38.01% |
| Return After Taxes on Distributions and Sale of Fund Shares | 30.63% | 30.56% |
S&P 500 Total Return Index (reflects no deduction for fees, expenses or taxes) |
17.88% | 27.44% |
| * | The YP Google Fund commenced operations on October 30, 2023. |
After-tax returns are based on the highest historical individual federal marginal income tax rates, and do not reflect the impact of state and local taxes; actual after-tax returns depend on an individual investor’s tax situation and may differ from those shown. If you own shares of the YP Google Fund in a tax-deferred account, such as an individual retirement account or a 401(k) plan, this information is not applicable to your investment. A higher after-tax return results when a capital loss occurs upon redemption and translates into an assumed tax deduction that benefits the shareholder.
The S&P 500 Total Return Index is an unmanaged market-capitalization-weighted index of 500 of the largest capitalized U.S. domiciled companies. Index returns assume reinvestment of dividends. Investors may not invest in the indexes directly; unlike the YP Google Fund’s returns, the indexes do not reflect any fees or expenses.
The following performance information provides some indication of the risks of investing in the YP Microsoft Fund by showing changes in the Fund’s performance over time. The following bar chart shows the YP Microsoft Fund’s annual returns. The table illustrates how the YP Microsoft Fund’s average annual returns for the 1-year and since inception periods compare with those of a broad measure of market performance. Although past performance of the YP Microsoft Fund is no guarantee of how it will perform in the future, historical performance may give you some indication of the risks of investing in the Fund. Updated performance information will be available on the YP Microsoft Fund’s website at www.kurvinvest.com.
Prior performance shown below is for the Predecessor YP Microsoft Fund (the Kurv Yield Premium Strategy Microsoft (MSFT) ETF) for periods prior to November 18, 2024. The YP Microsoft Fund has adopted the performance of the Predecessor YP Microsoft Fund as a result of a reorganization in which the Fund has acquired all the assets and liabilities of the Predecessor YP Microsoft Fund (the “Reorganization”). Prior to the Reorganization, the YP Microsoft Fund was a newly formed “shell” fund with no assets and had not commenced operations.
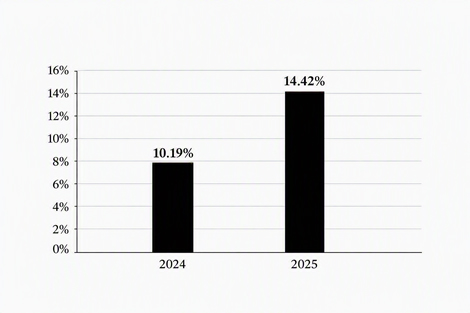
The YP Microsoft Fund’s year-to-date return as of the most recent calendar quarter ended June 30, 2026, was -25.94%.
During the period shown in the bar chart, the best performance for a quarter was 24.36% for the quarter ended June 30, 2025. The worst performance was -9.55% for the quarter ended March 31, 2025.
| One Year | Since Inception* | |
| YP Microsoft Fund | ||
| Return Before Taxes | 14.42% | 14.71% |
| Return After Taxes on Distributions | 9.28% | 9.65% |
| Return After Taxes on Distributions and Sale of Fund Shares | 8.57% | 9.14% |
S&P 500 Total Return Index (reflects no deduction for fees, expenses or taxes) |
17.88% | 27.44% |
| * | The YP Microsoft Fund commenced operations on October 30, 2023. |
After-tax returns are based on the highest historical individual federal marginal income tax rates, and do not reflect the impact of state and local taxes; actual after-tax returns depend on an individual investor’s tax situation and may differ from those shown. If you own shares of the YP Microsoft Fund in a tax-deferred account, such as an individual retirement account or a 401(k) plan, this information is not applicable to your investment. A higher after-tax return results when a capital loss occurs upon redemption and translates into an assumed tax deduction that benefits the shareholder.
The S&P 500 Total Return Index is an unmanaged market-capitalization-weighted index of 500 of the largest capitalized U.S. domiciled companies. Index returns assume reinvestment of dividends. Investors may not invest in the indexes directly; unlike the YP Microsoft Fund’s returns, the indexes do not reflect any fees or expenses.
The following performance information provides some indication of the risks of investing in the YP Netflix Fund by showing changes in the Fund’s performance over time. The following bar chart shows the YP Netflix Fund’s annual returns. The table illustrates how the YP Netflix Fund’s average annual returns for the 1-year and since inception periods compare with those of a broad measure of market performance. Although past performance of the YP Netflix Fund is no guarantee of how it will perform in the future, historical performance may give you some indication of the risks of investing in the Fund. Updated performance information will be available on the YP Netflix Fund’s website at www.kurvinvest.com.
Prior performance shown below is for the Predecessor YP Netflix Fund (the Kurv Yield Premium Strategy Netflix (NFLX) ETF) for periods prior to November 18, 2024. The YP Netflix Fund has adopted the performance of the Predecessor YP Netflix Fund as a result of a reorganization in which the Fund has acquired all the assets and liabilities of the Predecessor YP Netflix Fund (the “Reorganization”). Prior to the Reorganization, the YP Netflix Fund was a newly formed “shell” fund with no assets and had not commenced operations.
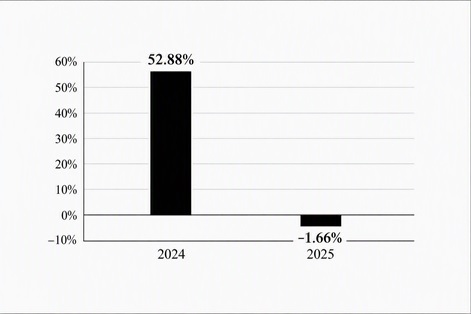
The YP Netflix Fund’s year-to-date return as of the most recent calendar quarter ended June 30, 2026, was -30.38%.
During the period shown in the bar chart, the best performance for a quarter was 32.55% for the quarter ended June 30, 2025. The worst performance was -20.89% for the quarter ended December 31, 2025.
| One Year | Since Inception* | |
| YP Netflix Fund | ||
| Return Before Taxes | -1.66% | 28.10% |
| Return After Taxes on Distributions | -4.67% | 20.74% |
| Return After Taxes on Distributions and Sale of Fund Shares | -0.69% | 18.69% |
S&P 500 Total Return Index (reflects no deduction for fees, expenses or taxes) |
17.88% | 27.71% |
| * | The YP Netflix Fund commenced operations on October 26, 2023. |
After-tax returns are based on the highest historical individual federal marginal income tax rates, and do not reflect the impact of state and local taxes; actual after-tax returns depend on an individual investor’s tax situation and may differ from those shown. If you own shares of the YP Netflix Fund in a tax-deferred account, such as an individual retirement account or a 401(k) plan, this information is not applicable to your investment. A higher after-tax return results when a capital loss occurs upon redemption and translates into an assumed tax deduction that benefits the shareholder.
The S&P 500 Total Return Index is an unmanaged market-capitalization-weighted index of 500 of the largest capitalized U.S. domiciled companies. Index returns assume reinvestment of dividends. Investors may not invest in the indexes directly; unlike the YP Netflix Fund’s returns, the indexes do not reflect any fees or expenses.
The following performance information provides some indication of the risks of investing in the YP Tesla Fund by showing changes in the Fund’s performance over time. The following bar chart shows the YP Tesla Fund’s annual returns. The table illustrates how the YP Tesla Fund’s average annual returns for the 1-year and since inception periods compare with those of a broad measure of market performance. Although past performance of the YP Tesla Fund is no guarantee of how it will perform in the future, historical performance may give you some indication of the risks of investing in the Fund. Updated performance information will be available on the YP Tesla Fund’s website at www.kurvinvest.com.
Prior performance shown below is for the Predecessor YP Tesla Fund (the Kurv Yield Premium Strategy Tesla (TSLA) ETF) for periods prior to November 18, 2024. The YP Tesla Fund has adopted the performance of the Predecessor YP Tesla Fund as a result of a reorganization in which the Fund has acquired all the assets and liabilities of the Predecessor YP Tesla Fund (the “Reorganization”). Prior to the Reorganization, the YP Tesla Fund was a newly formed “shell” fund with no assets and had not commenced operations.
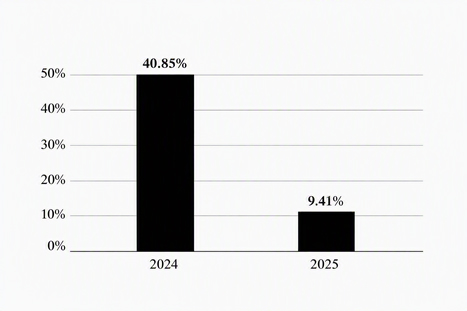
The YP Tesla Fund’s year-to-date return as of the most recent calendar quarter ended June 30, 2026, was -9.93%.
During the period shown in the bar chart, the best performance for a quarter was 35.81% for the quarter ended December 31, 2024. The worst performance was -31.34% for the quarter ended March 31, 2025.
| One Year | Since Inception* | |
| YP Tesla Fund | ||
| Return Before Taxes | 9.41% | 31.83% |
| Return After Taxes on Distributions | 8.73% | 26.25% |
| Return After Taxes on Distributions and Sale of Fund Shares | 5.51% | 21.58% |
S&P 500 Total Return Index (reflects no deduction for fees, expenses or taxes) |
17.88% | 27.71% |
| * | The YP Tesla Fund commenced operations on October 26, 2023. |
After-tax returns are based on the highest historical individual federal marginal income tax rates, and do not reflect the impact of state and local taxes; actual after-tax returns depend on an individual investor’s tax situation and may differ from those shown. If you own shares of the YP Tesla Fund in a tax-deferred account, such as an individual retirement account or a 401(k) plan, this information is not applicable to your investment. A higher after-tax return results when a capital loss occurs upon redemption and translates into an assumed tax deduction that benefits the shareholder.
The S&P 500 Total Return Index is an unmanaged market-capitalization-weighted index of 500 of the largest capitalized U.S. domiciled companies. Index returns assume reinvestment of dividends. Investors may not invest in the indexes directly; unlike the YP Tesla Fund’s returns, the indexes do not reflect any fees or expenses.
Because the Gold Fund has not been in operation for a full calendar year, the performance section is omitted. When such information is included, this section will provide some indication of the risks of investing in the Gold Fund by showing changes in the Gold Fund’s performance history from year to year and showing how the Gold Fund’s average annual total returns compare with those of a broad measure of market performance. Although past performance of the Gold Fund is no guarantee of how it will perform in the future, historical performance may give you some indication of the risks of investing in the Gold Fund. Updated performance information will be available on the Gold Fund’s website at www.kurvinvest.com.
Because the Silver Fund has not been in operation for a full calendar year, the performance section is omitted. When such information is included, this section will provide some indication of the risks of investing in the Silver Fund by showing changes in the Silver Fund’s performance history from year to year and showing how the Silver Fund’s average annual total returns compare with those of a broad measure of market performance. Although past performance of the Silver Fund is no guarantee of how it will perform in the future, historical performance may give you some indication of the risks of investing in the Silver Fund. Updated performance information will be available on the Silver Fund’s website at www.kurvinvest.com.
Because the Platinum Fund has not yet launched, the performance section is omitted. When such information is included, this section will provide some indication of the risks of investing in the Platinum Fund by showing changes in the Platinum Fund’s performance history from year to year and showing how the Platinum Fund’s average annual total returns compare with those of a broad measure of market performance. Although past performance of the Platinum Fund is no guarantee of how it will perform in the future, historical performance may give you some indication of the risks of investing in the Platinum Fund. Updated performance information will be available on the Platinum Fund’s website at www.kurvinvest.com.
Because the Copper Fund has not been in operation for a full calendar year, the performance section is omitted. When such information is included, this section will provide some indication of the risks of investing in the Copper Fund by showing changes in the Fund’s performance history from year to year and showing how the Fund’s average annual total returns compare with those of a broad measure of market performance. Although past performance of the Copper Fund is no guarantee of how it will perform in the future, historical performance may give you some indication of the risks of investing in the Fund. Updated performance information will be available on the Copper Fund’s website at www.kurvinvest.com.
The following performance information provides some indication of the risks of investing in the Fund by showing changes in the Fund’s performance over time. The following bar chart shows the Fund’s annual returns. The table illustrates how the Fund’s average annual returns for the 1-year and since inception periods compare with those of a broad measure of market performance. Although past performance of the Fund is no guarantee of how it will perform in the future, historical performance may give you some indication of the risks of investing in the Fund. Updated performance information will be available on the Fund’s website at www.kurvinvest.com.
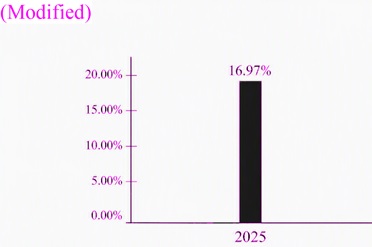
The Fund’s year-to-date return as of the most recent calendar quarter ended June 30, 2026, was 17.43%.
During the period shown in the bar chart, the best performance for a quarter was 19.54% for the quarter ended June 30, 2025. The worst performance was -12.88% for the quarter ended March 31, 2025.
| One Year |
Since Inception* | |
| Kurv Technology Titans Select Fund | ||
| Return Before Taxes | 16.97% | 19.90% |
| Return After Taxes on Distributions | 16.25% | 18.54% |
| Return After Taxes on Distributions and Sale of Fund Shares | 10.05% | 14.58% |
| S&P
500 Total Return Index (reflects no deduction for fees, expenses or taxes) |
17.88% | 16.94% |
| NASDAQ
100 Total Return Index (reflects no deduction for fees, expenses or taxes) |
21.02% | 19.13% |
| * | The Fund commenced operations on July 22, 2024. |
After-tax returns are based on the highest historical individual federal marginal income tax rates, and do not reflect the impact of state and local taxes; actual after-tax returns depend on an individual investor’s tax situation and may differ from those shown. If you own shares of the Fund in a tax-deferred account, such as an individual retirement account or a 401(k) plan, this information is not applicable to your investment. A higher after-tax return results when a capital loss occurs upon redemption and translates into an assumed tax deduction that benefits the shareholder.
The S&P 500 Total Return Index is an unmanaged market capitalization weighted index of 500 of the largest capitalized U.S. domiciled companies. Index returns assume reinvestment of dividends. Investors may not invest in the indexes directly; unlike the YP Amazon Fund’s returns, the indexes do not reflect any fees or expenses.
Because the Fund has not been in operations a full calendar year, the performance section is omitted. When such information is included, this section will provide some indication of the risks of investing in the Fund by showing changes in the Fund’s performance history from year to year and showing how the Fund’s average annual total returns compare with those of a broad measure of market performance. Although past performance of the Fund is no guarantee of how it will perform in the future, historical performance may give you some indication of the risks of investing in the Fund. Updated performance information will be available on the Fund’s website at www.kurvinvest.com.