| Fund | Costs of a $10,000 Investment | Costs Paid as a Percentage of a $10,000 Investment |
|---|---|---|
| Alpha Fiduciary Quantitative Strategy Fund | $189 | 1.70% |
Alpha Fiduciary Quantitative Strategy Fund (the "Fund" or "AFQSX") is a Quantitative Trend Following fund, as such from August 1, 2025, to July 31, 2026 the following narrative discussion of key factors which affected the Fund's performance are presented:
From August 1, 2025 through March 9, 2026, the Fund's model maintained a market weight exposure with the exception of two very brief periods when the model went to 0% exposure. These exposures caused the Fund to overall perform in line with the S&P 500 from August 1, 2025 through March 9, 2026.
The Fund's model indicated a 0% exposure from March 10, 2026, thru March 19, 2026, a period in which the S&P 500 fell. The Fund's model went to a market weight exposure on March 19, 2026, and had maintained a market weight exposure until June 15, 2026, when it again went to a 0% exposure until June 25, 2026, when it went to a market weight exposure.
These brief periods when the Fund's model indicated no exposure while the S&P 500 experienced market declines have caused the Fund to outperform the S&P 500 by several percentage points in both the Fund's fiscal year from August 1, 2025 through July 31, 2026, and calendar year to date in 2026 thru its fiscal year ended July 31, 2026.
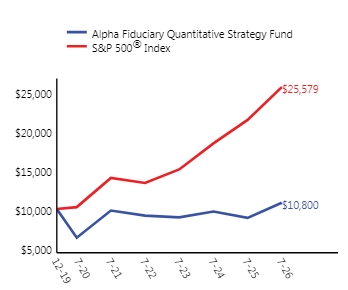
| One Year | Five Years | Inception (12/31/2019) | |
|---|---|---|---|
| Alpha Fiduciary Quantitative Strategy Fund | 21.90% | 1.96% | 1.18% |
| S&P 500® Index | 19.56% | 12.86% | 15.34% |
| Net Assets ($) | $23,740,702 |
|---|---|
| Number of Portfolio Holdings | |
| Portfolio Turnover Rate (%) | 0% |
| Total Advisory Fees Paid ($) | $214,842 |
| iShares Core S&P 500 ETF | |
| Goldman Sachs Financial Square Treasury Instrument Institutional Class |
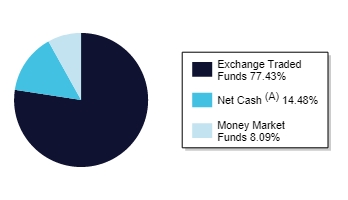
(A) | Net Cash represents cash and other assets in excess of liabilities, including futures contracts. |
| iShares Core S&P 500 ETF | |
| Goldman Sachs Financial Square Treasury Instrument Institutional Class |