This annual shareholder report contains important information about the Integrity Dividend Harvest Fund.
Period covered: August 1, 2025 through July 31, 2026
(Based on a hypothetical $10,000 investment)
| Class Name | Cost of a $10,000 investment | Costs paid as a percentage of a $10,000 investment |
| Class A | $109 | 0.95% |
| How did the Fund perform last year? | ||
| • | For the 12 month period ended July 31, 2026, the Fund’s Class A shares returned 29.99%. | |
| • | In comparison, the S&P High Yield Dividend Aristocrats Index (the Benchmark) returned 16.59% for the same period. | |
| What affected the Fund’s performance? | ||
| • | During the period, the Federal Reserve (“the Fed”) reduced rates by 0.25% in September 2025, 0.25% in October 2025, and 0.25% in December 2025, bringing the Federal Funds Rate to 3.50%-3.75%. | |
| • | U.S. stocks rose over the period. Performance was supported by continued optimism surrounding artificial intelligence and solid corporate earnings, while the Fed’s rate cuts provided additional support. Markets experienced periods of volatility amid concerns over tariffs, inflation, interest rates, and geopolitical tensions. | |
| • | Energy and technology were the best performing sectors, while communication services and consumer discretionary performed the worst. | |
| • | The Fund outperformed the Benchmark, primarily driven by stock selection in technology, health care, and financials. | |
| • | Detracting from relative performance was an underweight allocation to industrials. | |
How did the Fund perform over the past 10 years?*
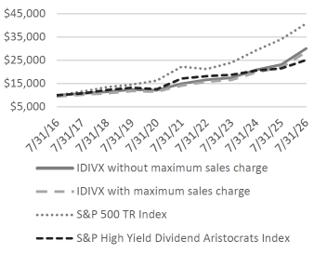
The chart below reflects a hypothetical $10,000 investment in the class of shares noted with and without sales charges.
CUMULATIVE PERFORMANCE
AVERAGE ANNUAL TOTAL RETURN (%)
For the Periods Ended July 31, 2026
| 1 Year | 5 Years | 10 Years | |
| Class A without sales charge | 29.99 | 15.06 | 11.62 |
| Class A with sales charge | 23.47 | 13.88 | 11.05 |
S&P 500 TR Index | 19.56 | 12.86 | 15.08 |
| S&P High Yield Dividend Aristocrats Index | 16.59 | 7.87 | 9.63 |
* The Fund’s past performance is not a good predictor of the Fund’s future performance. The graph and table do not reflect the deduction of taxes that a shareholder would pay on Fund distributions or redemptions of Fund shares.
What are some key Fund statistics?
(as of July 31, 2026)
| Total Net Assets (Millions) | $806 |
| Number of Holdings | 61 |
| Net Advisory Fee Paid | $1.98M |
| Annual Portfolio Turnover | 28% |
| Distribution Rate @ NAV | 2.63% |
| Beta | 0.66 |
| 30-Day SEC Yield (IDIVX) | 2.15% |
Additional Fund Statistics Information
Distribution Rate is an annualized rate of dividend distributions for shareholders taking dividends in cash based on actual dividend
distributions and actual
number of days in the distribution period.
Beta is a volatility measure of the percentage price change of the Fund given a one percent change in a representative market index.
The Beta value is
determined by comparing the weekly price movements of the Fund and the S&P 500 Index over the last five years.
SEC yield of a fund is a standardized calculation of the fund's yield. This allows investors to compare funds from different issuers.
The SEC yield listed is subsidized, which means it reflects income earned during a 30-day period after the deduction of the fund's net
expenses. The yield is net of expense waivers and reimbursements.
What did the Fund invest in?
(as of July 31, 2026)
| Sectors | % Net Assets | ||
| Financials | 17.1 | ||
| Energy | 15.9 | ||
| Information Technology | 15.5 | ||
| Consumer Staples | 13.2 | ||
| Health Care | 12.7 | ||
| Utilities | 8.4 | ||
| Consumer Discretionary | 6.0 | ||
| Communication Services | 4.6 | ||
| Industrials | 3.1 | ||
| Cash Equivalents and Other | 2.4 | ||
| Materials | 1.1 |
| Top 10 Holdings | % Net Assets | |
| Broadcom Inc | 4.98 | |
| Chevron Corp | 3.81 | |
| Bristol Myers Squibb Co | 3.49 | |
| AbbVie Inc | 3.43 | |
| Hewlett Packard Enterprise Co | 2.97 | |
| TC Energy Corp | 2.93 | |
| NextEra Energy Inc | 2.70 | |
| Williams Cos Inc/The | 2.49 | |
| Morgan Stanley | 2.48 | |
| Genuine Parts Co | 2.47 | |
This annual shareholder report contains important information about the Integrity Dividend Harvest Fund.
Period covered: August 1, 2025 through July 31, 2026
(Based on a hypothetical $10,000 investment)
| Class Name | Cost of a $10,000 investment | Costs paid as a percentage of a $10,000 investment |
| Class C | $195 | 1.70% |
| How did the Fund perform last year? | ||
| • | For the 12 month period ended July 31, 2026, the Fund’s Class C shares returned 28.96%. | |
| • | In comparison, the S&P High Yield Dividend Aristocrats Index (the Benchmark) returned 16.59% for the same period. | |
| What affected the Fund’s performance? | ||
| • | During the period, the Federal Reserve (“the Fed”) reduced rates by 0.25% in September 2025, 0.25% in October 2025, and 0.25% in December 2025, bringing the Federal Funds Rate to 3.50%-3.75%. | |
| • | U.S. stocks rose over the period. Performance was supported by continued optimism surrounding artificial intelligence and solid corporate earnings, while the Fed’s rate cuts provided additional support. Markets experienced periods of volatility amid concerns over tariffs, inflation, interest rates, and geopolitical tensions. | |
| • | Energy and technology were the best performing sectors, while communication services and consumer discretionary performed the worst. | |
| • | The Fund outperformed the Benchmark, primarily driven by stock selection in technology, health care, and financials. | |
| • | Detracting from relative performance was an underweight allocation to industrials. | |
How did the Fund perform over the past 10 years?*
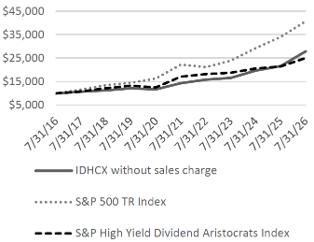
The chart below reflects a hypothetical $10,000 investment in the class of shares noted without sales charges. There is a 1% contingent deferred sales charge on any Class C shares you sell within 12 months of purchase. This would not apply to the chart below as the investment is held for over 12 months.
CUMULATIVE PERFORMANCE
AVERAGE ANNUAL TOTAL RETURN (%)
For the Periods Ended July 31, 2026
| 1 Year | 5 Years | 10 Years | |
| Class C without sales charge | 28.96 | 14.19 | 10.79 |
| Class C with sales charge | 27.96 | 14.19 | 10.79 |
S&P 500 TR Index | 19.56 | 12.86 | 15.08 |
| S&P High Yield Dividend Aristocrats Index | 16.59 | 7.87 | 9.63 |
* The Fund’s past performance is not a good predictor of the Fund’s future performance. The graph and table do not reflect the deduction of taxes that a shareholder would pay on Fund distributions or redemptions of Fund shares.
What are some key Fund statistics?
(as of July 31, 2026)
| Total Net Assets (Millions) | $806 |
| Number of Holdings | 61 |
| Net Advisory Fee Paid | $1.98M |
| Annual Portfolio Turnover | 28% |
| Distribution Rate | 1.93% |
| Beta | 0.66 |
| 30-Day SEC Yield (IDHCX) | 1.58% |
Additional Fund Statistics Information
Distribution Rate is an annualized rate of dividend distributions for shareholders taking dividends in cash based on actual dividend
distributions and actual
number of days in the distribution period.
Beta is a volatility measure of the percentage price change of the Fund given a one percent change in a representative market index.
The Beta value is
determined by comparing the weekly price movements of the Fund and the S&P 500 Index over the last five years.
SEC yield of a fund is a standardized calculation of the fund's yield. This allows investors to compare funds from different issuers.
The SEC yield listed is subsidized, which means it reflects income earned during a 30-day period after the deduction of the fund's net
expenses. The yield is net of expense waivers and reimbursements.
What did the Fund invest in?
(as of July 31, 2026)
| Sectors | % Net Assets | ||
| Financials | 17.1 | ||
| Energy | 15.9 | ||
| Information Technology | 15.5 | ||
| Consumer Staples | 13.2 | ||
| Health Care | 12.7 | ||
| Utilities | 8.4 | ||
| Consumer Discretionary | 6.0 | ||
| Communication Services | 4.6 | ||
| Industrials | 3.1 | ||
| Cash Equivalents and Other | 2.4 | ||
| Materials | 1.1 |
| Top 10 Holdings | % Net Assets | |
| Broadcom Inc | 4.98 | |
| Chevron Corp | 3.81 | |
| Bristol Myers Squibb Co | 3.49 | |
| AbbVie Inc | 3.43 | |
| Hewlett Packard Enterprise Co | 2.97 | |
| TC Energy Corp | 2.93 | |
| NextEra Energy Inc | 2.70 | |
| Williams Cos Inc/The | 2.49 | |
| Morgan Stanley | 2.48 | |
| Genuine Parts Co | 2.47 | |
This annual shareholder report contains important information about the Integrity Dividend Harvest Fund.
Period covered: August 1, 2025 through July 31, 2026
(Based on a hypothetical $10,000 investment)
| Class Name | Cost of a $10,000 investment | Costs paid as a percentage of a $10,000 investment |
| Class I | $81 | 0.70% |
| How did the Fund perform last year? | ||
| • | For the 12 month period ended July 31, 2026, the Fund’s Class I shares returned 30.28%. | |
| • | In comparison, the S&P High Yield Dividend Aristocrats Index (the Benchmark) returned 16.59% for the same period. | |
| What affected the Fund’s performance? | ||
| • | During the period, the Federal Reserve (“the Fed”) reduced rates by 0.25% in September 2025, 0.25% in October 2025, and 0.25% in December 2025, bringing the Federal Funds Rate to 3.50%-3.75%. | |
| • | U.S. stocks rose over the period. Performance was supported by continued optimism surrounding artificial intelligence and solid corporate earnings, while the Fed’s rate cuts provided additional support. Markets experienced periods of volatility amid concerns over tariffs, inflation, interest rates, and geopolitical tensions. | |
| • | Energy and technology were the best performing sectors, while communication services and consumer discretionary performed the worst. | |
| • | The Fund outperformed the Benchmark, primarily driven by stock selection in technology, health care, and financials. | |
| • | Detracting from relative performance was an underweight allocation to industrials. | |
How did the Fund perform since inception?*
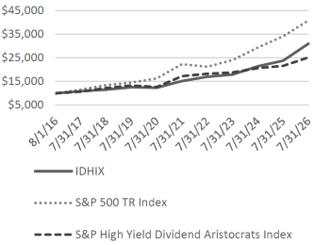
The chart below reflects a hypothetical $10,000 investment in the class of shares noted.
CUMULATIVE PERFORMANCE
AVERAGE ANNUAL TOTAL RETURN (%)
For the Periods Ended July 31, 2026
| 1 Year | 5 Years | Inception^ | |
| Class I | 30.28 | 15.35 | 11.96 |
| S&P 500 TR Index | 19.56 | 12.86 | 15.09 |
S&P High Yield Dividend Aristocrats Index | 16.59 | 7.87 | 9.67 |
| ^Inception Date of 8/1/2016 | |||
* The Fund’s past performance is not a good predictor of the Fund’s future performance. The graph and table do not reflect the deduction of taxes that a shareholder would pay on Fund distributions or redemptions of Fund shares.
What are some key Fund statistics?
(as of July 31, 2026)
| Total Net Assets (Millions) | $806 |
| Number of Holdings | 61 |
| Net Advisory Fee Paid | $1.98M |
| Annual Portfolio Turnover | 28% |
| Distribution Rate | 2.87% |
| Beta | 0.66 |
| 30-Day SEC Yield (IDHIX) | 2.50% |
Additional Fund Statistics Information
Distribution Rate is an annualized rate of dividend distributions for shareholders taking dividends in cash based on actual dividend
distributions and actual
number of days in the distribution period.
Beta is a volatility measure of the percentage price change of the Fund given a one percent change in a representative market index.
The Beta value is
determined by comparing the weekly price movements of the Fund and the S&P 500 Index over the last five years.
SEC yield of a fund is a standardized calculation of the fund's yield. This allows investors to compare funds from different issuers.
The SEC yield listed is subsidized, which means it reflects income earned during a 30-day period after the deduction of the fund's net
expenses. The yield is net of expense waivers and reimbursements.
What did the Fund invest in?
(as of July 31, 2026)
| Sectors | % Net Assets | ||
| Financials | 17.1 | ||
| Energy | 15.9 | ||
| Information Technology | 15.5 | ||
| Consumer Staples | 13.2 | ||
| Health Care | 12.7 | ||
| Utilities | 8.4 | ||
| Consumer Discretionary | 6.0 | ||
| Communication Services | 4.6 | ||
| Industrials | 3.1 | ||
| Cash Equivalents and Other | 2.4 | ||
| Materials | 1.1 |
| Top 10 Holdings | % Net Assets | |
| Broadcom Inc | 4.98 | |
| Chevron Corp | 3.81 | |
| Bristol Myers Squibb Co | 3.49 | |
| AbbVie Inc | 3.43 | |
| Hewlett Packard Enterprise Co | 2.97 | |
| TC Energy Corp | 2.93 | |
| NextEra Energy Inc | 2.70 | |
| Williams Cos Inc/The | 2.49 | |
| Morgan Stanley | 2.48 | |
| Genuine Parts Co | 2.47 | |
This annual shareholder report contains important information about the Integrity Dividend Summit Fund.
Period covered: August 1, 2025 through July 31, 2026
(Based on a hypothetical $10,000 investment)
| Class Name | Cost of a $10,000 investment | Costs paid as a percentage of a $10,000 investment |
| Class A | $113 | 0.99% |
| How did the Fund perform last year? | ||
| • | For the 12 month period ended July 31, 2026, the Fund’s Class A shares returned 28.99%. | |
| • | In comparison, the Dow Jones U.S. Select Dividend Index (the Benchmark) returned 24.30% for the same period. | |
| What affected the Fund’s performance? | ||
| • | During the period, the Federal Reserve (“the Fed”) reduced rates by 0.25% in September 2025, 0.25% in October 2025, and 0.25% in December 2025, bringing the Federal Funds Rate to 3.50%-3.75%. | |
| • | U.S. stocks rose over the period. Performance was supported by continued optimism surrounding artificial intelligence and solid corporate earnings, while the Fed’s rate cuts provided additional support. Markets experienced periods of volatility amid concerns over tariffs, inflation, interest rates, and geopolitical tensions. | |
| • | Energy and technology were the best performing sectors, while communication services and consumer discretionary performed the worst. | |
| • | The Fund outperformed the Benchmark, primarily driven by as stock selection in materials and an underweight allocation to utilities. | |
| • | Detracting from relative performance was an underweight allocation to technology. | |
How did the Fund perform since inception?*
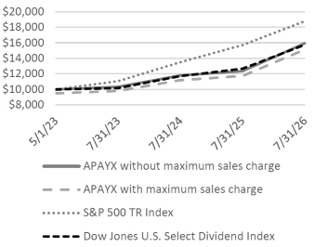
The chart below reflects a hypothetical $10,000 investment in the class of shares noted with and without sales charges.
CUMULATIVE PERFORMANCE
AVERAGE ANNUAL TOTAL RETURN (%)
For the Periods Ended July 31, 2026
| 1 Year | Inception^ | |
| Class A without sales charge | 28.99 | 15.41 |
| Class A with sales charge | 22.53 | 13.60 |
S&P 500 TR Index | 19.56 | 21.39 |
| Dow Jones U.S. Select Dividend Index | 24.30 | 14.99 |
| ^Inception Date of 5/1/2023 | ||
* The Fund’s past performance is not a good predictor of the Fund’s future performance. The graph and table do not reflect the deduction of taxes that a shareholder would pay on Fund distributions or redemptions of Fund shares.
What are some key Fund statistics?
(as of July 31, 2026)
| Total Net Assets (Millions) | $17 |
| Number of Holdings | 37 |
| Net Advisory Fee Paid | $0 |
| Annual Portfolio Turnover | 50% |
What did the Fund invest in?
(as of July 31, 2026)
| Sectors | % Net Assets | ||
| Energy | 18.3 | ||
| Financials | 17.0 | ||
| Consumer Staples | 15.2 | ||
| Health Care | 12.1 | ||
| Utilities | 9.4 | ||
| Communication Services | 7.3 | ||
| Cash Equivalents and Other | 5.9 | ||
| Materials | 4.3 | ||
| Consumer Discretionary | 4.1 | ||
| Information Technology | 4.0 | ||
Industrials | 2.4 |
| Top 10 Holdings | % Net Assets | |
| Dorian LPG Ltd | 5.83 | |
| Bristol Myers Squibb Co | 4.97 | |
| Altria Group Inc | 4.80 | |
| Verizon Communications Inc | 4.66 | |
| Sanofi SA ADR | 4.54 | |
| Kimberly Clark Corp | 4.48 | |
| Truist Financial Corp | 3.64 | |
| Prudential Financial Inc | 3.57 | |
| British American Tobacco PLC ADR | 3.55 | |
| UBS Group AG | 3.09 | |
This annual shareholder report contains important information about the Integrity Dividend Summit Fund.
Period covered: August 1, 2025 through July 31, 2026
(Based on a hypothetical $10,000 investment)
| Class Name | Cost of a $10,000 investment | Costs paid as a percentage of a $10,000 investment |
| Class C | $198 | 1.74% |
| How did the Fund perform last year? | ||
| • | For the 12 month period ended July 31, 2026, the Fund’s Class C shares returned 27.80%. | |
| • | In comparison, the Dow Jones U.S. Select Dividend Index (the Benchmark) returned 24.30% for the same period. | |
| What affected the Fund’s performance? | ||
| • | During the period, the Federal Reserve (“the Fed”) reduced rates by 0.25% in September 2025, 0.25% in October 2025, and 0.25% in December 2025, bringing the Federal Funds Rate to 3.50%-3.75%. | |
| • | U.S. stocks rose over the period. Performance was supported by continued optimism surrounding artificial intelligence and solid corporate earnings, while the Fed’s rate cuts provided additional support. Markets experienced periods of volatility amid concerns over tariffs, inflation, interest rates, and geopolitical tensions. | |
| • | Energy and technology were the best performing sectors, while communication services and consumer discretionary performed the worst. | |
| • | The Fund outperformed the Benchmark, primarily driven by as stock selection in materials and an underweight allocation to utilities. | |
| • | Detracting from relative performance was an underweight allocation to technology. | |
How did the Fund perform since inception?*
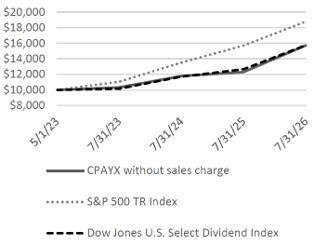
The chart below reflects a hypothetical $10,000 investment in the class of shares noted without sales charges. There is a 1% contingent deferred sales charge on any Class C shares you sell within 12 months of purchase. This would not apply to the chart below as the investment is held for over 12 months.
CUMULATIVE PERFORMANCE
AVERAGE ANNUAL TOTAL RETURN (%)
For the Periods Ended July 31, 2026
| 1 Year | Inception^ | |
| Class C without sales charge | 27.80 | 14.93 |
| Class C with sales charge | 26.80 | 14.93 |
| S&P 500 TR Index | 19.56 | 21.39 |
| Dow Jones U.S. Select Dividend Index | 24.30 | 14.99 |
| ^Inception Date of 5/1/2023 |
* The Fund’s past performance is not a good predictor of the Fund’s future performance. The graph and table do not reflect the deduction of taxes that a shareholder would pay on Fund distributions or redemptions of Fund shares.
What are some key Fund statistics?
(as of July 31, 2026)
| Total Net Assets (Millions) | $17 |
| Number of Holdings | 37 |
| Net Advisory Fee Paid | $0 |
| Annual Portfolio Turnover | 50% |
What did the Fund invest in?
(as of July 31, 2026)
| Sectors | % Net Assets | ||
| Energy | 18.3 | ||
| Financials | 17.0 | ||
| Consumer Staples | 15.2 | ||
| Health Care | 12.1 | ||
| Utilities | 9.4 | ||
| Communication Services | 7.3 | ||
| Cash Equivalents and Other | 5.9 | ||
| Materials | 4.3 | ||
| Consumer Discretionary | 4.1 | ||
| Information Technology | 4.0 | ||
| Industrials | 2.4 |
| Top 10 Holdings | % Net Assets | |
| Dorian LPG Ltd | 5.83 | |
| Bristol Myers Squibb Co | 4.97 | |
| Altria Group Inc | 4.80 | |
| Verizon Communications Inc | 4.66 | |
| Sanofi SA ADR | 4.54 | |
| Kimberly Clark Corp | 4.48 | |
| Truist Financial Corp | 3.64 | |
| Prudential Financial Inc | 3.57 | |
| British American Tobacco PLC ADR | 3.55 | |
| UBS Group AG | 3.09 |
This annual shareholder report contains important information about the Integrity Dividend Summit Fund.
Period covered: August 1, 2025 through July 31, 2026
(Based on a hypothetical $10,000 investment)
| Class Name | Cost of a $10,000 investment | Costs paid as a percentage of a $10,000 investment |
| Class I | $85 | 0.74% |
| How did the Fund perform last year? | ||
| • | For the 12 month period ended July 31, 2026, the Fund’s Class I shares returned 29.04%. | |
| • | In comparison, the Dow Jones U.S. Select Dividend Index (the Benchmark) returned 24.30% for the same period. | |
| What affected the Fund’s performance? | ||
| • | During the period, the Federal Reserve (“the Fed”) reduced rates by 0.25% in September 2025, 0.25% in October 2025, and 0.25% in December 2025, bringing the Federal Funds Rate to 3.50%-3.75%. | |
| • | U.S. stocks rose over the period. Performance was supported by continued optimism surrounding artificial intelligence and solid corporate earnings, while the Fed’s rate cuts provided additional support. Markets experienced periods of volatility amid concerns over tariffs, inflation, interest rates, and geopolitical tensions. | |
| • | Energy and technology were the best performing sectors, while communication services and consumer discretionary performed the worst. | |
| • | The Fund outperformed the Benchmark, primarily driven by as stock selection in materials and an underweight allocation to utilities. | |
| • | Detracting from relative performance was an underweight allocation to technology. | |
How did the Fund perform since inception?*
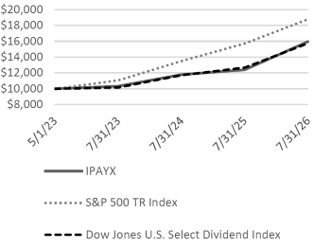
The chart below reflects a hypothetical $10,000 investment in the class of shares noted.
CUMULATIVE PERFORMANCE
AVERAGE ANNUAL TOTAL RETURN (%)
For the Periods Ended July 31, 2026
| 1 Year | Inception^ | |
| Class I | 29.04 | 15.50 |
| S&P 500 TR Index | 19.56 | 21.39 |
Dow Jones U.S. Select Dividend Index | 24.30 | 14.99 |
| ^Inception Date of 5/1/2023 | ||
* The Fund’s past performance is not a good predictor of the Fund’s future performance. The graph and table do not reflect the deduction of taxes that a shareholder would pay on Fund distributions or redemptions of Fund shares.
What are some key Fund statistics?
(as of July 31, 2026)
| Total Net Assets (Millions) | $17 |
| Number of Holdings | 37 |
| Net Advisory Fee Paid | $0 |
| Annual Portfolio Turnover | 50% |
What did the Fund invest in?
(as of July 31, 2026)
| Sectors | % Net Assets | ||
| Energy | 18.3 | ||
| Financials | 17.0 | ||
| Consumer Staples | 15.2 | ||
| Health Care | 12.1 | ||
| Utilities | 9.4 | ||
| Communication Services | 7.3 | ||
| Cash Equivalents and Other | 5.9 | ||
| Materials | 4.3 | ||
| Consumer Discretionary | 4.1 | ||
| Information Technology | 4.0 | ||
Industrials | 2.4 |
| Top 10 Holdings | % Net Assets | |
| Dorian LPG Ltd | 5.83 | |
| Bristol Myers Squibb Co | 4.97 | |
| Altria Group Inc | 4.80 | |
| Verizon Communications Inc | 4.66 | |
| Sanofi SA ADR | 4.54 | |
| Kimberly Clark Corp | 4.48 | |
| Truist Financial Corp | 3.64 | |
| Prudential Financial Inc | 3.57 | |
| British American Tobacco PLC ADR | 3.55 | |
| UBS Group AG | 3.09 | |
This annual shareholder report contains important information about the Integrity Growth & Income Fund.
Period covered: August 1, 2025 through July 31, 2026
(Based on a hypothetical $10,000 investment)
| Class Name | Cost of a $10,000 investment | Costs paid as a percentage of a $10,000 investment |
| Class A | $143 | 1.24% |
| How did the Fund perform last year? | ||
| • | For the 12 month period ended July 31, 2026, the Fund’s Class A shares returned 30.98%. | |
| • | In comparison, the S&P 500 Index (the Benchmark) returned 19.56% for the same period. | |
| What affected the Fund’s performance? | ||
| • | During the period, the Federal Reserve (“the Fed”) reduced rates by 0.25% in September 2025, 0.25% in October 2025, and 0.25% in December 2025, bringing the Federal Funds Rate to 3.50%-3.75%. | |
| • | U.S. stocks rose over the period. Performance was supported by continued optimism surrounding artificial intelligence and solid corporate earnings, while the Fed’s rate cuts provided additional support. Markets experienced periods of volatility amid concerns over tariffs, inflation, interest rates, and geopolitical tensions. | |
| • | Energy and technology were the best performing sectors, while communication services and consumer discretionary performed the worst. | |
| • | The Fund outperformed the Benchmark, primarily driven by stock selection in technology and an underweight allocation to consumer discretionary. | |
| • | Detracting from relative performance was selection within consumer discretionary. | |
How did the Fund perform over the past 10 years?*
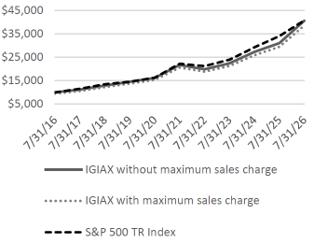
The chart below reflects a hypothetical $10,000 investment in the class of shares noted with and without sales charges.
CUMULATIVE PERFORMANCE
AVERAGE ANNUAL TOTAL RETURN (%)
For the Periods Ended July 31, 2026
| 1 Year | 5 Years | 10 Years | |
| Class A without sales charge | 30.98 | 13.42 | 15.04 |
| Class A with sales charge | 24.43 | 12.26 | 14.45 |
S&P 500 TR Index | 19.56 | 12.86 | 15.08 |
* The Fund’s past performance is not a good predictor of the Fund’s future performance. The graph and table do not reflect the deduction of taxes that a shareholder would pay on Fund distributions or redemptions of Fund shares.
What are some key Fund statistics?
(as of July 31, 2026)
| Total Net Assets (Millions) | $151 |
| Number of Holdings | 38 |
| Net Advisory Fee Paid | $652K |
| Annual Portfolio Turnover | 9% |
What did the Fund invest in?
(as of July 31, 2026)
| Sectors | % Net Assets | ||
| Information Technology | 41.0 | ||
| Financials | 13.4 | ||
| Industrials | 10.8 | ||
| Cash Equivalents and Other | 10.3 | ||
| Communication Services | 5.2 | ||
| Health Care | 4.7 | ||
| Consumer Staples | 4.3 | ||
| Utilities | 3.8 | ||
| Consumer Discretionary | 2.7 | ||
| Materials | 2.2 | ||
| Energy | 1.6 |
| Top 10 Holdings | % Net Assets | |
| Advanced Micro Devices Inc | 4.74 | |
| DigitalOcean Holdings Inc | 4.68 | |
| NVIDIA Corp | 4.66 | |
| Apple Inc | 4.31 | |
| Alphabet Inc | 4.26 | |
| Cloudflare Inc | 3.89 | |
| Visa Inc | 3.65 | |
| Broadcom Inc | 3.62 | |
| Trane Technologies PLC | 3.32 | |
| Lam Research Corp | 3.11 | |
This annual shareholder report contains important information about the Integrity Growth & Income Fund.
Period covered: August 1, 2025 through July 31, 2026
(Based on a hypothetical $10,000 investment)
| Class Name | Cost of a $10,000 investment | Costs paid as a percentage of a $10,000 investment |
| Class C | $229 | 1.99% |
| How did the Fund perform last year? | ||
| • | For the 12 month period ended July 31, 2026, the Fund’s Class C shares returned 30.02%. | |
| • | In comparison, the S&P 500 Index (the Benchmark) returned 19.56% for the same period. | |
| What affected the Fund’s performance? | ||
| • | During the period, the Federal Reserve (“the Fed”) reduced rates by 0.25% in September 2025, 0.25% in October 2025, and 0.25% in December 2025, bringing the Federal Funds Rate to 3.50%-3.75%. | |
| • | U.S. stocks rose over the period. Performance was supported by continued optimism surrounding artificial intelligence and solid corporate earnings, while the Fed’s rate cuts provided additional support. Markets experienced periods of volatility amid concerns over tariffs, inflation, interest rates, and geopolitical tensions. | |
| • | Energy and technology were the best performing sectors, while communication services and consumer discretionary performed the worst. | |
| • | The Fund outperformed the Benchmark, primarily driven by stock selection in technology and an underweight allocation to consumer discretionary. | |
| • | Detracting from relative performance was selection within consumer discretionary. | |
How did the Fund perform over the past 10 years?*
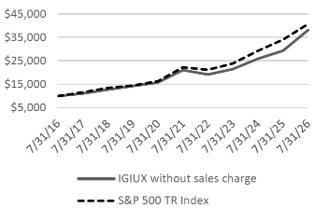
The chart below reflects a hypothetical $10,000 investment in the class of shares noted without sales charges. There is a 1% contingent deferred sales charge on any Class C shares you sell within 12 months of purchase. This would not apply to the chart below as the investment is held for over 12 months.
CUMULATIVE PERFORMANCE
AVERAGE ANNUAL TOTAL RETURN (%)
For the Periods Ended July 31, 2026
| 1 Year | 5 Years | 10 Years | |
| Class C without sales charge | 30.02 | 12.57 | 14.30 |
| Class C with sales charge | 29.02 | 12.57 | 14.30 |
| S&P 500 TR Index | 19.56 | 12.86 | 15.08 |
* The Fund’s past performance is not a good predictor of the Fund’s future performance. The graph and table do not reflect the deduction of taxes that a shareholder would pay on Fund distributions or redemptions of Fund shares.
What are some key Fund statistics?
(as of July 31, 2026)
| Total Net Assets (Millions) | $151 |
| Number of Holdings | 38 |
| Net Advisory Fee Paid | $652K |
| Annual Portfolio Turnover | 9% |
What did the Fund invest in?
(as of July 31, 2026)
| Sectors | % Net Assets | ||
| Information Technology | 41.0 | ||
| Financials | 13.4 | ||
| Industrials | 10.8 | ||
| Cash Equivalents and Other | 10.3 | ||
| Communication Services | 5.2 | ||
| Health Care | 4.7 | ||
| Consumer Staples | 4.3 | ||
| Utilities | 3.8 | ||
| Consumer Discretionary | 2.7 | ||
| Materials | 2.2 | ||
| Energy | 1.6 |
| Top 10 Holdings | % Net Assets | |
| Advanced Micro Devices Inc | 4.74 | |
| DigitalOcean Holdings Inc | 4.68 | |
| NVIDIA Corp | 4.66 | |
| Apple Inc | 4.31 | |
| Alphabet Inc | 4.26 | |
| Cloudflare Inc | 3.89 | |
| Visa Inc | 3.65 | |
| Broadcom Inc | 3.62 | |
| Trane Technologies PLC | 3.32 | |
| Lam Research Corp | 3.11 |
This annual shareholder report contains important information about the Integrity Growth & Income Fund.
Period covered: August 1, 2025 through July 31, 2026
(Based on a hypothetical $10,000 investment)
| Class Name | Cost of a $10,000 investment | Costs paid as a percentage of a $10,000 investment |
| Class I | $114 | 0.99% |
| How did the Fund perform last year? | ||
| • | For the 12 month period ended July 31, 2026, the Fund’s Class I shares returned 31.31%. | |
| • | In comparison, the S&P 500 Index (the Benchmark) returned 19.56% for the same period. | |
| What affected the Fund’s performance? | ||
| • | During the period, the Federal Reserve (“the Fed”) reduced rates by 0.25% in September 2025, 0.25% in October 2025, and 0.25% in December 2025, bringing the Federal Funds Rate to 3.50%-3.75%. | |
| • | U.S. stocks rose over the period. Performance was supported by continued optimism surrounding artificial intelligence and solid corporate earnings, while the Fed’s rate cuts provided additional support. Markets experienced periods of volatility amid concerns over tariffs, inflation, interest rates, and geopolitical tensions. | |
| • | Energy and technology were the best performing sectors, while communication services and consumer discretionary performed the worst. | |
| • | The Fund outperformed the Benchmark, primarily driven by stock selection in technology and an underweight allocation to consumer discretionary. | |
| • | Detracting from relative performance was selection within consumer discretionary. | |
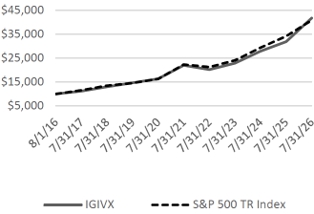
How did the Fund perform since inception?*
The chart below reflects a hypothetical $10,000 investment in the class of shares noted.
CUMULATIVE PERFORMANCE
AVERAGE ANNUAL TOTAL RETURN (%)
For the Periods Ended July 31, 2026
| 1 Year | 5 Years | Inception^ | |
| Class I | 31.31 | 13.71 | 15.36 |
S&P 500 TR Index | 19.56 | 12.86 | 15.09 |
| ^Inception Date of 8/1/2016 | |||
* The Fund’s past performance is not a good predictor of the Fund’s future performance. The graph and table do not reflect the deduction of taxes that a shareholder would pay on Fund distributions or redemptions of Fund shares.
What are some key Fund statistics?
(as of July 31, 2026)
| Total Net Assets (Millions) | $151 |
| Number of Holdings | 38 |
| Net Advisory Fee Paid | $652K |
| Annual Portfolio Turnover | 9% |
What did the Fund invest in?
(as of July 31, 2026)
| Sectors | % Net Assets | ||
| Information Technology | 41.0 | ||
| Financials | 13.4 | ||
| Industrials | 10.8 | ||
| Cash Equivalents and Other | 10.3 | ||
| Communication Services | 5.2 | ||
| Health Care | 4.7 | ||
| Consumer Staples | 4.3 | ||
| Utilities | 3.8 | ||
| Consumer Discretionary | 2.7 | ||
| Materials | 2.2 | ||
Energy | 1.6 |
| Top 10 Holdings | % Net Assets | |
| Advanced Micro Devices Inc | 4.74 | |
| DigitalOcean Holdings Inc | 4.68 | |
| NVIDIA Corp | 4.66 | |
| Apple Inc | 4.31 | |
| Alphabet Inc | 4.26 | |
| Cloudflare Inc | 3.89 | |
| Visa Inc | 3.65 | |
| Broadcom Inc | 3.62 | |
| Trane Technologies PLC | 3.32 | |
| Lam Research Corp | 3.11 | |
This annual shareholder report contains important information about the Integrity High Income Fund.
Period covered: August 1, 2025 through July 31, 2026
(Based on a hypothetical $10,000 investment)
| Class Name | Cost of a $10,000 investment | Costs paid as a percentage of a $10,000 investment |
| Class A | $112 | 1.09% |
| How did the Fund perform last year? | ||
| • | For the 12 month period ended July 31, 2026, the Fund's Class A shares returned 4.68%. | |
| • | In comparison, the Bloomberg U.S. Corporate High Yield Bond Index (the Benchmark) returned 5.17% for the same period. | |
| What affected the Fund’s performance? | ||
| • | The Fund’s relative underperformance during the period was driven largely by security selection in the Transportation Services, REITS - Other and Chemicals sectors. Conversely, security selection in the Media Entertainment, Cable Satellite and Technology sectors contributed to relative performance. | |
| • | Compared to the benchmark on July 31, 2026, the Integrity High Income Fund was overweight in Cable Satellite, Leisure and Consumer Products due to the Fund's view of relative value opportunities within those sectors. The Fund was underweight in Finance Companies, P&C and Retailers as the Fund did not find these sectors attractive due to challenging fundamental outlooks or rich valuations. Relative to the benchmark on July 31, 2026, the Fund had a lower yield, tighter spread and was more defensively positioned in duration. | |
| • | Specifically, relative weightings in Hertz Global, Trinseo, VICI Properties, Ardagh Group and The-Michaels detracted from the Fund's relative performance during the trailing 12 month period. Conversely, relative weightings in iHeartMedia, Clear Channel Outdoor, Cooper-Standard Holdings, Echostar and DISH Network contributed to the Fund's relative performance during the trailing 12 month period. | |
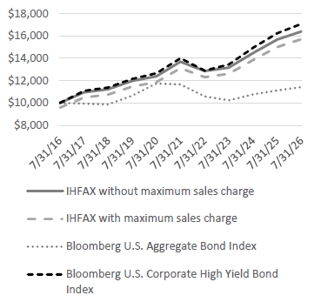
How did the Fund perform over the past 10 years?*
The chart below reflects a hypothetical $10,000 investment in the class of shares noted with and without sales charges.
CUMULATIVE PERFORMANCE
AVERAGE ANNUAL TOTAL RETURN (%)
For the Periods Ended July 31, 2026
| 1 Year | 5 Years | 10 Years | |
| Class A without sales charge | 4.68 | 3.67 | 5.07 |
Class A with sales charge | 0.21 | 2.77 | 4.63 |
Bloomberg U.S. Aggregate Bond Index | 2.71 | -0.40 | 1.35 |
Bloomberg U.S. Corporate High Yield Bond Index | 5.17 | 4.04 | 5.51 |
* The Fund’s past performance is not a good predictor of the Fund’s future performance. The graph and table do not reflect the deduction of taxes that a shareholder would pay on Fund distributions or redemptions of Fund shares.
What are some key Fund statistics?
(as of July 31, 2026)
| Total Net Assets (Millions) | $42 |
| Number of Holdings | 622 |
| Net Advisory Fee Paid | $117K |
| Annual Portfolio Turnover | 25% |
What did the Fund invest in?
(as of July 31, 2026)
| Sectors | % Net Assets | ||
| Consumer Discretionary | 18.9 | ||
| Communication Services | 18.6 | ||
| Industrials | 12.3 | ||
| Energy | 10.1 | ||
| Health Care | 8.8 | ||
| Materials | 8.5 | ||
| Information Technology | 6.5 | ||
| Cash Equivalents and Other | 4.9 | ||
| Utilities | 3.1 | ||
| Consumer Staples | 3.0 | ||
| Real Estate | 2.6 | ||
| Financials | 1.4 | ||
U.S. Treasury Obligations | 1.3 |
| Credit Rating Breakdown* | % Net Assets | |
| AA | 0.82 | |
| BBB | 5.65 | |
| BB | 57.90 | |
| B | 24.24 | |
| CCC | 8.15 | |
| CC | 0.13 | |
| D | 1.03 | |
| NR | 2.08 | |
* The ratings agencies that provided the ratings are Standard & Poor’s and Moody’s. When ratings vary, the higher rating is used. Credit quality ratings are measured on a scale that generally ranges from AAA (highest) to D (lowest). “NR” is used to classify securities for which a rating is not available. Ratings apply to the holdings in the Fund portfolio and not to the Fund or its shares. Ratings are subject to change.
This annual shareholder report contains important information about the Integrity High Income Fund.
Period covered: August 1, 2025 through July 31, 2026
(Based on a hypothetical $10,000 investment)
| Class Name | Cost of a $10,000 investment | Costs paid as a percentage of a $10,000 investment |
| Class C | $188 | 1.84% |
| How did the Fund perform last year? | ||
| • | For the 12 month period ended July 31, 2026, the Fund’s Class C shares returned 3.90%. | |
| • | In comparison, the Bloomberg U.S. Corporate High Yield Bond Index (the Benchmark) returned 5.17% for the same period. | |
| What affected the Fund’s performance? | ||
| • | The Fund’s relative underperformance during the period was driven largely by security selection in the Transportation Services, REITS - Other and Chemicals sectors. Conversely, security selection in the Media Entertainment, Cable Satellite and Technology sectors contributed to relative performance. | |
| • | Compared to the benchmark on July 31, 2026, the Integrity High Income Fund was overweight in Cable Satellite, Leisure and Consumer Products due to the Fund's view of relative value opportunities within those sectors. The Fund was underweight in Finance Companies, P&C and Retailers as the Fund did not find these sectors attractive due to challenging fundamental outlooks or rich valuations. Relative to the benchmark on July 31, 2026, the Fund had a lower yield, tighter spread and was more defensively positioned in duration. | |
| • | Specifically, relative weightings in Hertz Global, Trinseo, VICI Properties, Ardagh Group and The-Michaels detracted from the Fund's relative performance during the trailing 12 month period. Conversely, relative weightings in iHeartMedia, Clear Channel Outdoor, Cooper-Standard Holdings, Echostar and DISH Network contributed to the Fund's relative performance during the trailing 12 month period. | |
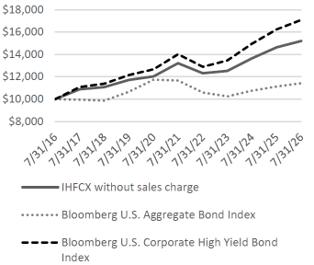
How did the Fund perform over the past 10 years?*
The chart below reflects a hypothetical $10,000 investment in the class of shares noted without sales charges. There is a 1% contingent deferred sales charge on any Class C shares you sell within 12 months of purchase. This would not apply to the chart below as the investment is held for over 12 months.
CUMULATIVE PERFORMANCE
AVERAGE ANNUAL TOTAL RETURN (%)
For the Periods Ended July 31, 2026
| 1 Year | 5 Years | 10 Years | |
| Class C without sales charge | 3.90 | 2.85 | 4.28 |
| Class C with sales charge | 2.91 | 2.85 | 4.28 |
Bloomberg U.S. Aggregate Bond Index | 2.71 | -0.40 | 1.35 |
| Bloomberg U.S. Corporate High Yield Bond Index | 5.17 | 4.04 | 5.51 |
* The Fund’s past performance is not a good predictor of the Fund’s future performance. The graph and table do not reflect the deduction of taxes that a shareholder would pay on Fund distributions or redemptions of Fund shares.
What are some key Fund statistics?
(as of July 31, 2026)
| Total Net Assets (Millions) | $42 |
| Number of Holdings | 622 |
| Net Advisory Fee Paid | $117K |
| Annual Portfolio Turnover | 25% |
What did the Fund invest in?
(as of July 31, 2026)
| Sectors | % Net Assets | ||
| Consumer Discretionary | 18.9 | ||
| Communication Services | 18.6 | ||
| Industrials | 12.3 | ||
| Energy | 10.1 | ||
| Health Care | 8.8 | ||
| Materials | 8.5 | ||
| Information Technology | 6.5 | ||
| Cash Equivalents and Other | 4.9 | ||
| Utilities | 3.1 | ||
| Consumer Staples | 3.0 | ||
| Real Estate | 2.6 | ||
| Financials | 1.4 | ||
| U.S. Treasury Obligations | 1.3 |
| Credit Rating Breakdown* | % Net Assets | |
| AA | 0.82 | |
| BBB | 5.65 | |
| BB | 57.90 | |
| B | 24.24 | |
| CCC | 8.15 | |
| CC | 0.13 | |
| D | 1.03 | |
| NR | 2.08 | |
* The ratings agencies that provided the ratings are Standard & Poor’s and Moody’s. When ratings vary, the higher rating is used. Credit quality ratings are measured on a scale that generally ranges from AAA (highest) to D (lowest). “NR” is used to classify securities for which a rating is not available. Ratings apply to the holdings in the Fund portfolio and not to the Fund or its shares. Ratings are subject to change.
This annual shareholder report contains important information about the Integrity High Income Fund.
Period covered: August 1, 2025 through July 31, 2026
(Based on a hypothetical $10,000 investment)
| Class Name | Cost of a $10,000 investment | Costs paid as a percentage of a $10,000 investment |
| Class I | $86 | 0.84% |
| How did the Fund perform last year? | ||
| • | For the 12 month period ended July 31, 2026, the Fund’s Class I shares returned 4.80%. | |
| • | In comparison, the Bloomberg U.S. Corporate High Yield Bond Index (the Benchmark) returned 5.17% for the same period. | |
| What affected the Fund’s performance? | ||
| • | The Fund’s relative underperformance during the period was driven largely by security selection in the Transportation Services, REITS - Other and Chemicals sectors. Conversely, security selection in the Media Entertainment, Cable Satellite and Technology sectors contributed to relative performance. | |
| • | Compared to the benchmark on July 31, 2026, the Integrity High Income Fund was overweight in Cable Satellite, Leisure and Consumer Products due to the Fund's view of relative value opportunities within those sectors. The Fund was underweight in Finance Companies, P&C and Retailers as the Fund did not find these sectors attractive due to challenging fundamental outlooks or rich valuations. Relative to the benchmark on July 31, 2026, the Fund had a lower yield, tighter spread and was more defensively positioned in duration. | |
| • | Specifically, relative weightings in Hertz Global, Trinseo, VICI Properties, Ardagh Group and The-Michaels detracted from the Fund's relative performance during the trailing 12 month period. Conversely, relative weightings in iHeartMedia, Clear Channel Outdoor, Cooper-Standard Holdings, Echostar and DISH Network contributed to the Fund's relative performance during the trailing 12 month period. | |
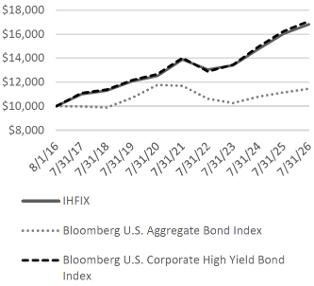
How did the Fund perform since inception?*
The chart below reflects a hypothetical $10,000 investment in the class of shares noted.
CUMULATIVE PERFORMANCE
AVERAGE ANNUAL TOTAL RETURN (%)
For the Periods Ended July 31, 2026
| 1 Year | 5 Years | Inception^ | |
| Class I | 4.80 | 3.90 | 5.34 |
| Bloomberg U.S. Aggregate Bond Index | 2.71 | -0.40 | 1.37 |
| Bloomberg U.S. Corporate High Yield Bond Index | 5.17 | 4.04 | 5.50 |
| ^Inception Date of 8/1/2016 | |||
* The Fund’s past performance is not a good predictor of the Fund’s future performance. The graph and table do not reflect the deduction of taxes that a shareholder would pay on Fund distributions or redemptions of Fund shares.
What are some key Fund statistics?
(as of July 31, 2026)
| Total Net Assets (Millions) | $42 |
| Number of Holdings | 622 |
| Net Advisory Fee Paid | $117K |
| Annual Portfolio Turnover | 25% |
What did the Fund invest in?
(as of July 31, 2026)
| Sectors | % Net Assets | ||
| Consumer Discretionary | 18.9 | ||
| Communication Services | 18.6 | ||
| Industrials | 12.3 | ||
| Energy | 10.1 | ||
| Health Care | 8.8 | ||
| Materials | 8.5 | ||
| Information Technology | 6.5 | ||
| Cash Equivalents and Other | 4.9 | ||
| Utilities | 3.1 | ||
| Consumer Staples | 3.0 | ||
| Real Estate | 2.6 | ||
| Financials | 1.4 | ||
| U.S. Treasury Obligations | 1.3 |
| Credit Rating Breakdown* | % Net Assets | |
| AA | 0.82 | |
| BBB | 5.65 | |
| BB | 57.90 | |
| B | 24.24 | |
| CCC | 8.15 | |
| CC | 0.13 | |
| D | 1.03 | |
| NR | 2.08 |
* The ratings agencies that provided the ratings are Standard & Poor’s and Moody’s. When ratings vary, the higher rating is used. Credit quality ratings are measured on a scale that generally ranges from AAA (highest) to D (lowest). “NR” is used to classify securities for which a rating is not available. Ratings apply to the holdings in the Fund portfolio and not to the Fund or its shares. Ratings are subject to change.
This annual shareholder report contains important information about the Integrity Mid-North American Resources Fund.
Period covered: August 1, 2025 through July 31, 2026
(Based on a hypothetical $10,000 investment)
| Class Name | Cost of a $10,000 investment | Costs paid as a percentage of a $10,000 investment |
| Class A | $177 | 1.50% |
| How did the Fund perform last year? | ||
| • | For the 12 month period ended July 31, 2026, the Fund’s Class A shares returned 35.85%. | |
| • | In comparison, the S&P 1500 Energy Index (the Benchmark) returned 41.88% for the same period. | |
| What affected the Fund’s performance? | ||
| • | During the period, the Federal Reserve (“the Fed”) reduced rates by 0.25% in September 2025, 0.25% in October 2025, and 0.25% in December 2025, bringing the Federal Funds Rate to 3.50%-3.75%. | |
| • | U.S. stocks rose over the period. Performance was supported by continued optimism surrounding artificial intelligence and solid corporate earnings, while the Fed’s rate cuts provided additional support. Markets experienced periods of volatility amid concerns over tariffs, inflation, interest rates, and geopolitical tensions. | |
| • | Crude oil prices experienced heightened volatility over the period, driven primarily by escalating geopolitical tensions surrounding Iran and regional supply disruption risks. Crude oil finished the period moderately higher. | |
| • | Detracting from relative performance versus the Benchmark over the period was an overweight allocation to utilities and independent power producers. | |
| • | Aiding relative performance was selection within midstream and oilfield service. | |
How did the Fund perform over the past 10 years?*
The chart below reflects a hypothetical $10,000 investment in the class of shares noted with and without sales charges.
CUMULATIVE PERFORMANCE
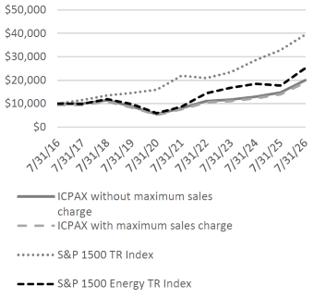
AVERAGE ANNUAL TOTAL RETURN (%)
For the Periods Ended July 31, 2026
| 1 Year | 5 Years | 10 Years | |
| Class A without sales charge | 35.85 | 20.02 | 7.20 |
| Class A with sales charge | 29.11 | 18.77 | 6.65 |
| S&P 1500 TR Index | 19.97 | 12.48 | 14.72 |
| S&P 1500 Energy TR Index | 41.88 | 23.67 | 9.68 |
* The Fund’s past performance is not a good predictor of the Fund’s future performance. The graph and table do not reflect the deduction of taxes that a shareholder would pay on Fund distributions or redemptions of Fund shares.
What are some key Fund statistics?
(as of July 31, 2026)
| Total Net Assets (Millions) | $197 |
| Number of Holdings | 47 |
| Net Advisory Fee Paid | $888K |
| Annual Portfolio Turnover | 64% |
What did the Fund invest in?
(as of July 31, 2026)
| Sectors | % Net Assets | ||
| Energy | 74.2 | ||
| Utilities | 12.0 | ||
| Industrials | 4.8 | ||
| Information Technology | 3.3 | ||
| Real Estate | 2.2 | ||
| Cash Equivalents and Other | 1.1 | ||
| Materials | 1.1 | ||
| Consumer Discretionary | 0.7 | ||
| Consumer Staples | 0.6 |
| Top 10 Holdings | % Net Assets | |
| Cheniere Energy Inc | 7.23 | |
| Williams Cos Inc/The | 6.32 | |
| Valero Energy Corp | 4.61 | |
| Targa Resources Corp | 4.39 | |
| Permian Resources Corp | 4.33 | |
| Diamondback Energy Inc | 4.12 | |
| Chevron Corp | 4.10 | |
| Baker Hughes a GE Co | 3.99 | |
| Phillips 66 | 3.76 | |
| Archrock Inc | 3.27 |
This annual shareholder report contains important information about the Integrity Mid-North American Resources Fund.
Period covered: August 1, 2025 through July 31, 2026
(Based on a hypothetical $10,000 investment)
| Class Name | Cost of a $10,000 investment | Costs paid as a percentage of a $10,000 investment |
| Class C | $235 | 2.00% |
| How did the Fund perform last year? | ||
| • | For the 12 month period ended July 31, 2026, the Fund’s Class C shares returned 35.35%. | |
| • | In comparison, the S&P 1500 Energy Index (the Benchmark) returned 41.88% for the same period. | |
| What affected the Fund’s performance? | ||
| • | During the period, the Federal Reserve (“the Fed”) reduced rates by 0.25% in September 2025, 0.25% in October 2025, and 0.25% in December 2025, bringing the Federal Funds Rate to 3.50%-3.75%. | |
| • | U.S. stocks rose over the period. Performance was supported by continued optimism surrounding artificial intelligence and solid corporate earnings, while the Fed’s rate cuts provided additional support. Markets experienced periods of volatility amid concerns over tariffs, inflation, interest rates, and geopolitical tensions. | |
| • | Crude oil prices experienced heightened volatility over the period, driven primarily by escalating geopolitical tensions surrounding Iran and regional supply disruption risks. Crude oil finished the period moderately higher. | |
| • | Detracting from relative performance versus the Benchmark over the period was an overweight allocation to utilities and independent power producers. | |
| • | Aiding relative performance was selection within midstream and oilfield service. | |
How did the Fund perform over the past 10 years?*
The chart below reflects a hypothetical $10,000 investment in the class of shares noted without sales charges. There is a 1% contingent deferred sales charge on any Class C shares you sell within 12 months of purchase. This would not apply to the chart below as the investment is held for over 12 months.
CUMULATIVE PERFORMANCE
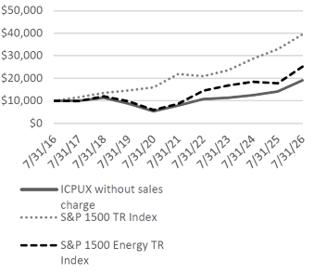
AVERAGE ANNUAL TOTAL RETURN (%)
For the Periods Ended July 31, 2026
| 1 Year | 5 Years | 10 Years | |
| Class C without sales charge | 35.35 | 19.42 | 6.67 |
| Class C with sales charge | 34.35 | 19.42 | 6.67 |
| S&P 1500 TR Index | 19.97 | 12.48 | 14.72 |
| S&P 1500 Energy TR Index | 41.88 | 23.67 | 9.68 |
* The Fund’s past performance is not a good predictor of the Fund’s future performance. The graph and table do not reflect the deduction of taxes that a shareholder would pay on Fund distributions or redemptions of Fund shares.
What are some key Fund statistics?
(as of July 31, 2026)
| Total Net Assets (Millions) | $197 |
| Number of Holdings | 47 |
| Net Advisory Fee Paid | $888K |
| Annual Portfolio Turnover | 64% |
What did the Fund invest in?
(as of July 31, 2026)
| Sectors | % Net Assets | ||
| Energy | 74.2 | ||
| Utilities | 12.0 | ||
| Industrials | 4.8 | ||
| Information Technology | 3.3 | ||
| Real Estate | 2.2 | ||
| Cash Equivalents and Other | 1.1 | ||
| Materials | 1.1 | ||
| Consumer Discretionary | 0.7 | ||
| Consumer Staples | 0.6 |
| Top 10 Holdings | % Net Assets | |
| Cheniere Energy Inc | 7.23 | |
| Williams Cos Inc/The | 6.32 | |
| Valero Energy Corp | 4.61 | |
| Targa Resources Corp | 4.39 | |
| Permian Resources Corp | 4.33 | |
| Diamondback Energy Inc | 4.12 | |
| Chevron Corp | 4.10 | |
| Baker Hughes a GE Co | 3.99 | |
| Phillips 66 | 3.76 | |
| Archrock Inc | 3.27 |
This annual shareholder report contains important information about the Integrity Mid-North American Resources Fund.
Period covered: August 1, 2025 through July 31, 2026
(Based on a hypothetical $10,000 investment)
| Class Name | Cost of a $10,000 investment | Costs paid as a percentage of a $10,000 investment |
| Class I | $118 | 1.00% |
How did the Fund perform last year?
| ||
| • | For the 12 month period ended July 31, 2026, the Fund's Class I shares returned 36.69%. | |
| • | In comparison, the S&P 1500 Energy Index (the Benchmark) returned 41.88% for the same period. | |
| What affected the Fund’s performance? | ||
| • | During the period, the Federal Reserve ("the Fed") reduced rates by 0.25% in September 2025, 0.25% in October 2025, and 0.25% in December 2025, bringing the Federal Funds Rate to 3.50%-3.75%. | |
| • | U.S. stocks rose over the period. Performance was supported by continued optimism surrounding artificial intelligence and solid corporate earnings, while the Fed's rate cuts provided additional support. Markets experienced periods of volatility amid concerns over tariffs, inflation, interest rates, and geopolitical tensions. | |
| • | Crude oil prices experienced heightened volatility over the period, driven primarily by escalating geopolitical tensions surrounding Iran and regional supply disruption risks. Crude oil finished the period moderately higher. | |
| • | Detracting from relative performance versus the Benchmark over the period was an overweight allocation to utilities and independent power producers. | |
| • | Aiding relative performance was selection within midstream and oilfield service. | |
How did the Fund perform since inception?*
The chart below reflects a hypothetical $10,000 investment in the class of shares noted.
CUMULATIVE PERFORMANCE
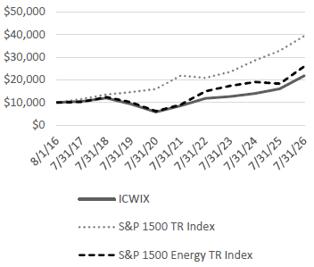
AVERAGE ANNUAL TOTAL RETURN (%)
For the Periods Ended July 31, 2026
| 1 Year | 5 Years | Inception^ | |
| Class I | 36.69 | 20.65 | 8.15 |
| S&P 1500 TR Index | 19.97 | 12.48 | 14.73 |
| S&P 1500 Energy TR Index | 41.88 | 23.67 | 10.05 |
| ^Inception Date of 8/1/2016 | |||
* The Fund’s past performance is not a good predictor of the Fund’s future performance. The graph and table do not reflect the deduction of taxes that a shareholder would pay on Fund distributions or redemptions of Fund shares.
What are some key Fund statistics?
(as of July 31, 2026)
| Total Net Assets (Millions) | $197 |
| Number of Holdings | 47 |
| Net Advisory Fee Paid | $888K |
| Annual Portfolio Turnover | 64% |
What did the Fund invest in?
(as of July 31, 2026)
| Sectors | % Net Assets | ||
| Energy | 74.2 | ||
| Utilities | 12.0 | ||
| Industrials | 4.8 | ||
| Information Technology | 3.3 | ||
| Real Estate | 2.2 | ||
| Cash Equivalents and Other | 1.1 | ||
| Materials | 1.1 | ||
| Consumer Discretionary | 0.7 | ||
| Consumer Staples | 0.6 |
| Top 10 Holdings | % Net Assets | |
| Cheniere Energy Inc | 7.23 | |
| Williams Cos Inc/The | 6.32 | |
| Valero Energy Corp | 4.61 | |
| Targa Resources Corp | 4.39 | |
| Permian Resources Corp | 4.33 | |
| Diamondback Energy Inc | 4.12 | |
| Chevron Corp | 4.10 | |
| Baker Hughes a GE Co | 3.99 | |
| Phillips 66 | 3.76 | |
| Archrock Inc | 3.27 |
This annual shareholder report contains important information about the Integrity Short Term Government Fund.
Period covered: August 1, 2025 through July 31, 2026
(Based on a hypothetical $10,000 investment)
| Class Name | Cost of a $10,000 investment | Costs paid as a percentage of a $10,000 investment |
| Class A | $82 | 0.80% |
| How did the Fund perform last year? | ||
| • | For the 12 month period ended July 31, 2026, the Fund’s Class A shares returned 5.23%. | |
| • | In comparison, the ICE BofA 1–3 Year U.S. Treasury Index (the Benchmark) returned 3.15% for the same period. | |
| What affected the Fund’s performance? | ||
| • | Fixed income markets experienced shifting Federal Reserve ("the Fed") expectations and significant changes in the shape of the Treasury yield curve during the 12 month period. The Fed reduced policy rates during the latter part of 2025, while persistent inflation and resilient economic activity subsequently led markets to reassess the pace and extent of additional easing in 2026. Geopolitical uncertainty also contributed to higher rate volatility, particularly during the first quarter of 2026. The Fund’s short-duration profile helped limit sensitivity to these fluctuations while allowing the portfolio to benefit from attractive front-end income. | |
| • | The Fund’s exposure to Agency mortgage-backed securities contributed positively to performance and relative returns. The sector benefited from attractive yields relative to comparable-duration Treasuries, favorable supply and demand technicals, and generally slower prepayment activity. The Fund’s emphasis on seasoned collateral, specified pools, and securities with favorable prepayment characteristics supported income generation and security selection. Agency MBS also benefited at times from lower interest-rate volatility and strong institutional demand. | |
| • | The Fund maintained a moderately longer duration than the Benchmark, while continuing to emphasize short- and intermediate-duration securities. This positioning allowed the portfolio to earn incremental carry without assuming significant long-term interest-rate exposure. Active management of duration and the yield curve also helped navigate periods of both falling rates and the subsequent backup in Treasury yields during 2026. | |
| • | Income was the primary driver of the Fund’s return, supported by a portfolio yield that generally exceeded that of the Benchmark. The combination of higher income, Agency MBS exposure, and security selection enabled the Fund to outperform the 1–3 Year Treasury Index by approximately 2.08 percentage points over the 12 month period. | |
How did the Fund perform since inception?*
The chart below reflects a hypothetical $10,000 investment in the class of shares noted with and without sales charges.
CUMULATIVE PERFORMANCE
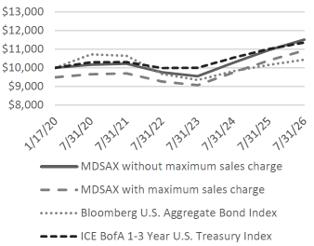
AVERAGE ANNUAL TOTAL RETURN (%)
For the Periods Ended July 31, 2026
| 1 Year | 5 Years | Inception^ | |
| Class A without sales charge | 5.23 | 2.42 | 2.18 |
| Class A with sales charge | 3.11 | 2.01 | 1.86 |
| Bloomberg U.S. Aggregate Bond Index | 2.71 | -0.40 | 0.65 |
| ICE BofA 1-3 Year U.S. Treasury Index | 3.15 | 1.94 | 1.96 |
| ^Inception Date of 1/17/2020 | |||
* The Fund’s past performance is not a good predictor of the Fund’s future performance. The graph and table do not reflect the deduction of taxes that a shareholder would pay on Fund distributions or redemptions of Fund shares.
What are some key Fund statistics?
(as of July 31, 2026)
| Total Net Assets (Millions) | $35 |
| Number of Holdings | 169 |
| Net Advisory Fee Paid | $4K |
| Annual Portfolio Turnover | 84% |
What did the Fund invest in?
(as of July 31, 2026)
| Assets | % Net Assets | ||
| Mortgage Backed Securities | 96.1 | ||
| Cash Equivalents and Other | 2.8 | ||
| U.S. Government Treasury Bills | 1.1 |
| Top 10 Holdings | % Net Assets | |
| Freddie Mac Pool, 5.5000% 12/01/2050 | 2.60 | |
| Fannie Mae Pool, 5.0000% 10/01/2050 | 2.34 | |
| Freddie Mac Real Estate Mortgage Investment Conduit, 5.0000% 08/25/2051 | 2.09 | |
| Ginnie Mae II Pool, 5.5000% 01/20/2056 (H15T 1 Year + 1.500%)* | 2.06 | |
| Government National Mortgage Association, 1.20382% 08/16/2063 | 1.83 | |
| Fannie Mae Real Estate Mortgage Investment Conduit, 5.0000% 07/25/2055 | 1.79 | |
| Government National Mortgage Association, 0.97478% 12/16/2062 | 1.78 | |
| Freddie Mac Pool, 5.0000% 03/01/2051 | 1.63 | |
| Fannie Mae Pool, 5.0000% 01/01/2056 | 1.62 | |
| Government National Mortgage Association, 0.57524% 08/16/2067 | 1.46 |
*H15T - US Treasury Yield Curve Rate T Note Constant Maturity 1 year rate disclosed as of July 31, 2026, based on the last reset date of the security.
(Based on a hypothetical $10,000 investment)
| Class Name | Cost of a $10,000 investment | Costs paid as a percentage of a $10,000 investment |
| Class I | $57 | 0.55% |
| How did the Fund perform last year? | ||
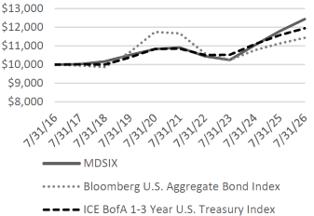
| • | For the 12 month period ended July 31, 2026, the Fund’s Class I shares returned 5.49%. | |
| In comparison, the ICE BofA 1–3 Year U.S. Treasury Index (the Benchmark) returned 3.15% for the same period. | ||
| What affected the Fund’s performance? | ||
| • | Fixed income markets experienced shifting Federal Reserve ("the Fed") expectations and significant changes in the shape of the Treasury yield curve during the 12 month period. The Fed reduced policy rates during the latter part of 2025, while persistent inflation and resilient economic activity subsequently led markets to reassess the pace and extent of additional easing in 2026. Geopolitical uncertainty also contributed to higher rate volatility, particularly during the first quarter of 2026. The Fund’s short-duration profile helped limit sensitivity to these fluctuations while allowing the portfolio to benefit from attractive front-end income. | |
| • | The Fund’s exposure to Agency mortgage-backed securities contributed positively to performance and relative returns. The sector benefited from attractive yields relative to comparable-duration Treasuries, favorable supply and demand technicals, and generally slower prepayment activity. The Fund’s emphasis on seasoned collateral, specified pools, and securities with favorable prepayment characteristics supported income generation and security selection. Agency MBS also benefited at times from lower interest-rate volatility and strong institutional demand. | |
| • | The Fund maintained a moderately longer duration than the Benchmark, while continuing to emphasize short- and intermediate-duration securities. This positioning allowed the portfolio to earn incremental carry without assuming significant long-term interest-rate exposure. Active management of duration and the yield curve also helped navigate periods of both falling rates and the subsequent backup in Treasury yields during 2026. | |
| • | Income was the primary driver of the Fund’s return, supported by a portfolio yield that generally exceeded that of the Benchmark. The combination of higher income, Agency MBS exposure, and security selection enabled the Fund to outperform the 1–3 Year Treasury Index by approximately 2.34 percentage points over the 12 month period. | |
How did the Fund perform over the past 10 years?*
The chart below reflects a hypothetical $10,000 investment in the class of shares noted.
CUMULATIVE PERFORMANCE
AVERAGE ANNUAL TOTAL RETURN (%)
For the Periods Ended July 31, 2026
| 1 Year | 5 Years | 10 Years | |
| Class I | 5.49 | 2.66 | 2.20 |
| Bloomberg U.S. Aggregate Bond Index | 2.71 | -0.40 | 1.35 |
| ICE BofA 1-3 Year U.S. Treasury Index | 3.15 | 1.94 | 1.79 |
* The Fund’s past performance is not a good predictor of the Fund’s future performance. The graph and table do not reflect the deduction of taxes that a shareholder would pay on Fund distributions or redemptions of Fund shares.
What are some key Fund statistics?
(as of July 31, 2026)
| Total Net Assets (Millions) | $35 |
| Number of Holdings | 169 |
| Net Advisory Fee Paid | $4K |
| Annual Portfolio Turnover | 84% |
What did the Fund invest in?
(as of July 31, 2026)
| Assets | % Net Assets | ||
| Mortgage Backed Securities | 96.1 | ||
| Cash Equivalents and Other | 2.8 | ||
| U.S. Government Treasury Bills | 1.1 |
| Top 10 Holdings | % Net Assets | |
| Freddie Mac Pool, 5.5000% 12/01/2050 | 2.60 | |
| Fannie Mae Pool, 5.0000% 10/01/2050 | 2.34 | |
| Freddie Mac Real Estate Mortgage Investment Conduit, 5.0000% 08/25/2051 | 2.09 | |
| Ginnie Mae II Pool, 5.5000% 01/20/2056 (H15T 1 Year + 1.500%)* | 2.06 | |
| Government National Mortgage Association, 1.20382% 08/16/2063 | 1.83 | |
| Fannie Mae Real Estate Mortgage Investment Conduit, 5.0000% 07/25/2055 | 1.79 | |
| Government National Mortgage Association, 0.97478% 12/16/2062 | 1.78 | |
| Freddie Mac Pool, 5.0000% 03/01/2051 | 1.63 | |
| Fannie Mae Pool, 5.0000% 01/01/2056 | 1.62 | |
| Government National Mortgage Association, 0.57524% 08/16/2067 | 1.46 |
*H15T - US Treasury Yield Curve Rate T Note Constant Maturity 1 year rate disclosed as of July 31, 2026, based on the last reset date of the security.
| [1] | The Fund’s past performance is not a good predictor of the Fund’s future performance. The graph and table do not reflect the deduction of taxes that a shareholder would pay on Fund distributions or redemptions of Fund shares. |
| [2] | The Fund’s past performance is not a good predictor of the Fund’s future performance. The graph and table do not reflect the deduction of taxes that a shareholder would pay on Fund distributions or redemptions of Fund shares. |
| [3] | The Fund’s past performance is not a good predictor of the Fund’s future performance. The graph and table do not reflect the deduction of taxes that a shareholder would pay on Fund distributions or redemptions of Fund shares. |
| [4] | The Fund’s past performance is not a good predictor of the Fund’s future performance. The graph and table do not reflect the deduction of taxes that a shareholder would pay on Fund distributions or redemptions of Fund shares. |
| [5] | The Fund’s past performance is not a good predictor of the Fund’s future performance. The graph and table do not reflect the deduction of taxes that a shareholder would pay on Fund distributions or redemptions of Fund shares. |
| [6] | The Fund’s past performance is not a good predictor of the Fund’s future performance. The graph and table do not reflect the deduction of taxes that a shareholder would pay on Fund distributions or redemptions of Fund shares. |
| [7] | The Fund’s past performance is not a good predictor of the Fund’s future performance. The graph and table do not reflect the deduction of taxes that a shareholder would pay on Fund distributions or redemptions of Fund shares. |
| [8] | The Fund’s past performance is not a good predictor of the Fund’s future performance. The graph and table do not reflect the deduction of taxes that a shareholder would pay on Fund distributions or redemptions of Fund shares. |
| [9] | The Fund’s past performance is not a good predictor of the Fund’s future performance. The graph and table do not reflect the deduction of taxes that a shareholder would pay on Fund distributions or redemptions of Fund shares. |
| [10] | The Fund’s past performance is not a good predictor of the Fund’s future performance. The graph and table do not reflect the deduction of taxes that a shareholder would pay on Fund distributions or redemptions of Fund shares. |
| [11] | The Fund’s past performance is not a good predictor of the Fund’s future performance. The graph and table do not reflect the deduction of taxes that a shareholder would pay on Fund distributions or redemptions of Fund shares. |
| [12] | The Fund’s past performance is not a good predictor of the Fund’s future performance. The graph and table do not reflect the deduction of taxes that a shareholder would pay on Fund distributions or redemptions of Fund shares. |
| [13] | The Fund’s past performance is not a good predictor of the Fund’s future performance. The graph and table do not reflect the deduction of taxes that a shareholder would pay on Fund distributions or redemptions of Fund shares. |
| [14] | The Fund’s past performance is not a good predictor of the Fund’s future performance. The graph and table do not reflect the deduction of taxes that a shareholder would pay on Fund distributions or redemptions of Fund shares. |
| [15] | The Fund’s past performance is not a good predictor of the Fund’s future performance. The graph and table do not reflect the deduction of taxes that a shareholder would pay on Fund distributions or redemptions of Fund shares. |
| [16] | The Fund’s past performance is not a good predictor of the Fund’s future performance. The graph and table do not reflect the deduction of taxes that a shareholder would pay on Fund distributions or redemptions of Fund shares. |