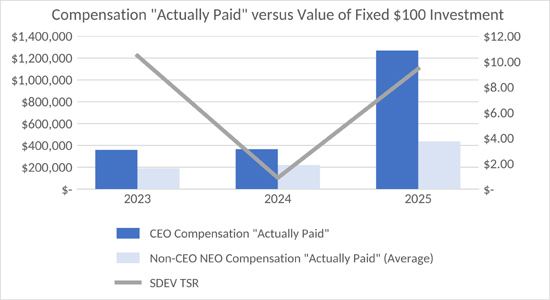
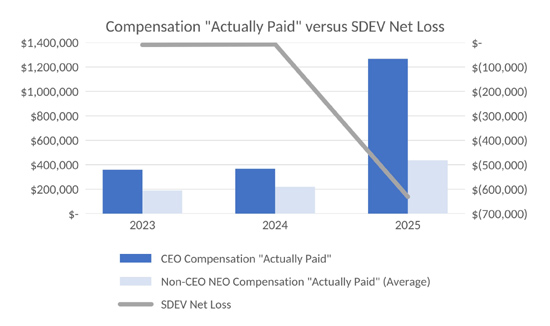
As required by Section 953(a) of the Dodd-Frank Wall Street Reform and Consumer Protection Act, and Item 402(v) of Regulation S-K, the Company is providing the following disclosure about the relationship between executive pay actually paid (as defined by SEC rules) and the Company’s financial performance.
Pay-Versus-Performance Table
In accordance with SEC rules, the table below sets forth the following information for the fiscal years ended December 31, 2025, 2024 and 2023: (i) the total compensation reported for the Company’s principal executive officer (“PEO”) and the non-PEO named executive officers (“NEOs”) in the “Summary Compensation Table” included in this Proxy Statement and, with respect to fiscal year 2023, the “Summary Compensation Table” included in the Company’s proxy statement for its 2025 Annual Meeting of Stockholders (the “2025 Proxy Statement”) filed with the SEC on September 23, 2025; (ii) the compensation “actually paid” to the PEO and the non-PEO NEOs, calculated in accordance with SEC rules and as described in the footnotes below; (iii) the Company’s total stockholder return (“TSR”); and (iv) the Company’s net income (loss). The amounts reported in the “Summary Compensation Table” and the compensation actually paid amounts do not reflect the actual amounts of compensation earned by, or paid to, our NEOs during the applicable years, but rather are amounts determined in accordance with Item 402(v) of Regulation S-K.
|
Fiscal Year |
Summary Compensation Table Total for PEO |
Compensation “Actually Paid” to PEO(1) |
Average Summary Compensation Table Total for Non-PEO Named Executive Officers(2) |
Average Compensation “Actually Paid” Total for Non PEO Named Executive Officers(3) |
Value of Initial Fixed $100 Investment based on SDEV TSR(4) |
Net Income (in thousands)(5) |
||||||||||||||||||
|
2025 |
$ | 1,267,154 | $ | 1,267,154 | $ | 436,797 | $ | 436,797 | $ | 9.44 | $ | (630,780 | ) | |||||||||||
|
2024 |
$ | 365,177 | $ | 366,461 | $ | 220,196 | $ | 220,295 | $ | 0.88 | $ | (7,223 | ) | |||||||||||
|
2023 |
$ | 364,146 | $ | 358,857 | $ | 190,840 | $ | 189,734 | $ | 10.46 | $ | (9,640 | ) | |||||||||||
|
(1) |
Compensation actually paid (as defined by SEC rules) to the CEO for each period presented reflects the amount set forth in column (1), adjusted as set forth below in the Reconciliation of Compensation Actually Paid Table. Mr. Hall served as PEO from January 1, 2025 through August 19, 2025, Mr. Lazar from August 19, 2025 through October 16, 2025 and Mr. Kazley from October 16, 2025 through December 31, 2025; Mr. Hall was the sole PEO in 2024 and 2023. Messrs. Lazar and Kazley received no compensation from the Company for their service in 2025, and the amounts reported for them are accordingly zero. |
|
(2) |
Mr. Law, our Chief Financial Officer, was the Company’s only non-CEO named executive officer (“NEO”) for fiscal years 2025 and 2024. Mr. Law, Dr. Kunin, our former Chief Product Officer, and Mr. Jones, our former Chief Financial Officer, were the Company’s non-CEO NEOs in fiscal year 2023. Dr. Kunin resigned effective November 5, 2023 and Mr. Jones resigned effective February 15, 2023. Amounts in 2023 for the NEOs other than the CEO are weighted averages based on the number of days the applicable NEOs served. |
|
(3) |
Average compensation actually paid (as defined by SEC rules) to the Company’s NEOs (except the CEO) for each period presented reflects the amount set forth in column (3), adjusted as set forth below in the Reconciliation of Compensation Actually Paid Table. |
|
(4) |
Reflects the TSR of a $100 investment in the Company from the beginning of fiscal year 2023 through each of the fiscal years ended December 31, 2025, 2024 and 2023. The Company’s TSR includes share price appreciation or depreciation and assumes reinvestment of dividends, including the Company’s one-time special cash dividend paid in 2025. |
|
(5) |
Reflects “Net loss” as reported in the Company’s Consolidated Statements of Operations included in the Company’s Annual Report on Form 10-K for the fiscal year ended December 31, 2025, as amended by Amendment No. 1 on Form 10-K/A filed with the SEC on April 29, 2026 to reflect the Restatement, and, with respect to fiscal year 2023, the Company’s Annual Report on Form 10-K for the fiscal year ended December 31, 2023, as amended. |
Reconciliation of Compensation Actually Paid Table
The following table details the applicable adjustments that were made to determine compensation actually paid (amounts are weighted-averages for the NEOs other than the CEO in 2023 based on the number of days served):
|
Fiscal Year |
Reported Summary ($) |
Deduct: Reported equity ($)(a) |
Add: Equity award adjustments |
Deduct: Reported the present value benefits ($)(c) |
Add: Pension adjustments |
Compensation |
||||||||||||||||||
|
CEO |
||||||||||||||||||||||||
|
2025 |
1,267,154 | - | - | - | - | 1,267,154 | ||||||||||||||||||
|
2024 |
365,177 | - | 1,284 | - | - | 366,461 | ||||||||||||||||||
|
2023 |
364,146 | - | (5,289 | ) | - | - | 358,857 | |||||||||||||||||
|
NEOs (except the Chief Executive Officer) |
||||||||||||||||||||||||
|
2025 |
436,797 | - | - | - | - | 436,797 | ||||||||||||||||||
|
2024 |
220,196 | - | 99 | - | - | 220,295 | ||||||||||||||||||
|
2023 |
190,840 | - | (1,106 | ) | - | - | 189,734 | |||||||||||||||||
|
(a) |
As provided in the “Summary Compensation Table” provided in this Proxy Statement and, as relates to the fiscal year ended December 31, 2023, the 2025 Proxy Statement. No equity awards were granted to any NEO in the fiscal years presented. |
|
(b) |
The equity award adjustments for each applicable period include the subtraction of the following (amounts are weighted-averages for the NEOs other than the CEO in 2023 based on the number of days served): |
|
Fiscal Year |
Period- end fair equity granted period ($) |
Changes in value years’ unvested at end ($) |
Fair value as awards granted and vested ($) |
Change in value years’ that vested reported ($) |
Fair value at the end of the prior period of equity awards that failed to meet vesting conditions in the period ($) |
Value of dividends or other earnings paid on stock or option awards not otherwise reflected in fair value or total compensation ($) |
Total equity award adjustments ($) |
|||||||||||||||||||||
|
CEO |
||||||||||||||||||||||||||||
|
2025 |
- | - | - | - | - | - | - | |||||||||||||||||||||
|
2024 |
- | - | - | 1,284 | - | - | 1,284 | |||||||||||||||||||||
|
2023 |
- | (2,974 | ) | - | (2,315 | ) | - | - | (5,289 | ) | ||||||||||||||||||
|
NEOs (except the Chief Executive Officer) |
||||||||||||||||||||||||||||
|
2025 |
- | - | - | - | - | - | - | |||||||||||||||||||||
|
2024 |
- | - | - | 99 | - | - | 99 | |||||||||||||||||||||
|
2023 |
- | (83 | ) | - | (1,023 | ) | - | - | (1,106 | ) | ||||||||||||||||||
|
(c) |
In the periods presented and consistent with the “Summary Compensation Table” provided in this Proxy Statement and, as relates to the fiscal year ended December 31, 2023, the 2025 Proxy Statement, the Company did not have: (i) a change in the actuarial present value of the accumulated benefit under any defined benefit or actuarial pension plans or (ii) any service cost or prior service cost related to any defined benefit or actuarial pension plans. |
Reconciliation of Compensation Actually Paid Table
The following table details the applicable adjustments that were made to determine compensation actually paid (amounts are weighted-averages for the NEOs other than the CEO in 2023 based on the number of days served):
|
Fiscal Year |
Reported Summary ($) |
Deduct: Reported equity ($)(a) |
Add: Equity award adjustments |
Deduct: Reported the present value benefits ($)(c) |
Add: Pension adjustments |
Compensation |
||||||||||||||||||
|
CEO |
||||||||||||||||||||||||
|
2025 |
1,267,154 | - | - | - | - | 1,267,154 | ||||||||||||||||||
|
2024 |
365,177 | - | 1,284 | - | - | 366,461 | ||||||||||||||||||
|
2023 |
364,146 | - | (5,289 | ) | - | - | 358,857 | |||||||||||||||||
|
NEOs (except the Chief Executive Officer) |
||||||||||||||||||||||||
|
2025 |
436,797 | - | - | - | - | 436,797 | ||||||||||||||||||
|
2024 |
220,196 | - | 99 | - | - | 220,295 | ||||||||||||||||||
|
2023 |
190,840 | - | (1,106 | ) | - | - | 189,734 | |||||||||||||||||
|
(a) |
As provided in the “Summary Compensation Table” provided in this Proxy Statement and, as relates to the fiscal year ended December 31, 2023, the 2025 Proxy Statement. No equity awards were granted to any NEO in the fiscal years presented. |
|
(b) |
The equity award adjustments for each applicable period include the subtraction of the following (amounts are weighted-averages for the NEOs other than the CEO in 2023 based on the number of days served): |
|
Fiscal Year |
Period- end fair equity granted period ($) |
Changes in value years’ unvested at end ($) |
Fair value as awards granted and vested ($) |
Change in value years’ that vested reported ($) |
Fair value at the end of the prior period of equity awards that failed to meet vesting conditions in the period ($) |
Value of dividends or other earnings paid on stock or option awards not otherwise reflected in fair value or total compensation ($) |
Total equity award adjustments ($) |
|||||||||||||||||||||
|
CEO |
||||||||||||||||||||||||||||
|
2025 |
- | - | - | - | - | - | - | |||||||||||||||||||||
|
2024 |
- | - | - | 1,284 | - | - | 1,284 | |||||||||||||||||||||
|
2023 |
- | (2,974 | ) | - | (2,315 | ) | - | - | (5,289 | ) | ||||||||||||||||||
|
NEOs (except the Chief Executive Officer) |
||||||||||||||||||||||||||||
|
2025 |
- | - | - | - | - | - | - | |||||||||||||||||||||
|
2024 |
- | - | - | 99 | - | - | 99 | |||||||||||||||||||||
|
2023 |
- | (83 | ) | - | (1,023 | ) | - | - | (1,106 | ) | ||||||||||||||||||
|
(c) |
In the periods presented and consistent with the “Summary Compensation Table” provided in this Proxy Statement and, as relates to the fiscal year ended December 31, 2023, the 2025 Proxy Statement, the Company did not have: (i) a change in the actuarial present value of the accumulated benefit under any defined benefit or actuarial pension plans or (ii) any service cost or prior service cost related to any defined benefit or actuarial pension plans. |
Pay-Versus-Performance Relationship
The table above and the charts below show, for the past three years, the relationship between the compensation “actually paid” to the CEO and to the other non-CEO NEOs and (i) the Company’s TSR and (ii) the Company’s net loss. Compensation actually paid to the CEO for 2025 consisted principally of the severance paid to Mr. Hall under the Settlement Agreement, and the Company’s net loss for 2025, as restated in the Annual Report, was driven primarily by non-cash losses related to the pre-funded warrants issued in October 2025 rather than by the Company’s operating results.