The Fund acquired all of the assets and liabilities of the FIS Christian Stock Fund, a series of NEOS ETF Trust (the “Predecessor Fund”), in a tax-free reorganization in December, 2025. In connection with this acquisition, shares of the Predecessor Fund were exchanged for shares of the Fund. The Predecessor Fund had an investment objective and strategies that were, in all material respects, the same as those of the Fund, and was managed in a manner that, in all material respects, complied with the investment guidelines and restrictions of the Fund. The Fund is a continuation of the Predecessor Fund, and therefore, the performance information includes the performance of the Predecessor Fund.
The performance information presented below provides some indication of the risks of investing in the Fund by showing the extent to which the Predecessor Fund’s performance can change from year to year and over time. The bar chart below shows the Predecessor Fund’s performance for calendar years set forth below. The table illustrates how the Fund’s average annual returns for the 1 year and since inception periods compare with those of the MSCI ACWI Index. The Predecessor Fund’s past performance, before and after taxes, does not necessarily indicate how it will perform in the future. Updated performance information and daily NAV per share information is available at no cost by visiting www.faithinvestorservices.com or by calling (833) 833-1311.
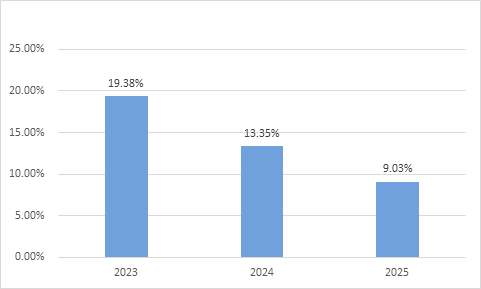
| Best Quarter: | 11.18% | |
| Worst Quarter: | -3.81% |
| One-year | Since inception (2/8/22) | |
| Return Before Taxes (No Load) | 9.03% | 6.76% |
| Return After Taxes on Distributions (No Load) | 8.85% | 6.53% |
| Return After Taxes on Distributions and Sale of Fund Shares (No Load) | 5.47% | 5.23% |
MSCI ACWI Index(1) (reflects no deduction for fees, expenses or taxes) |
22.34% | 11.08% |
MSCI WORLD Index Net (USD)(2) (reflects no deduction for fees, expenses or taxes) |
21.09% | 11.67% |
| (1) | Returns for net indices generally assume the reinvestment of dividends after the deduction of the maximum withholding tax in each country applicable to non-residents of the country as determined by the index provider. Such indices use withholding tax rates that are often at a higher rate than the rates to which the Fund is subject in each country, including for countries where the Fund is not subject to withholding taxes. When this is the case, index performance will be lower than if the index used the Fund's applicable withholding tax rates, if any. |
| (2) | Effective February 27, 2026, the Fund changed its primary benchmark from the MSCI WORLD Index Net (USD) to the MSCI ACWI Index. The Adviser believes the MSCI ACWI Index more closely reflects the Fund's current investment strategy and portfolio composition. Performance for the MSCI WORLD Index Net (USD), the Fund's former benchmark, is also shown for comparative purposes. |
The Fund acquired all of the assets and liabilities of the FIS Bright Portfolios Focused Equity ETF, a series of NEOS ETF Trust (the “Predecessor Fund”), in a tax-free reorganization in February, 2026. In connection with this acquisition, shares of the Predecessor Fund were exchanged for shares of the Fund. The Predecessor Fund had an investment objective and strategies that were, in all material respects, the same as those of the Fund, and was managed in a manner that, in all material respects, complied with the investment guidelines and restrictions of the Fund. The Fund is a continuation of the Predecessor Fund, and therefore, the performance information includes the performance of the Predecessor Fund.
The performance information presented below provides some indication of the risks of investing in the Fund by showing the extent to which the Predecessor Fund’s performance can change from year to year and over time. The bar chart below shows the Predecessor Fund’s performance for calendar years set forth below. The table illustrates how the Fund’s average annual returns for the 1 year and since inception periods compare with those of the MSCI USA Net Total Return USD Index. The Predecessor Fund’s past performance, before and after taxes, does not necessarily indicate how it will perform in the future. Updated performance information and daily NAV per share information is available at no cost by visiting www.faithinvestorservices.com or by calling (833) 833-1311.
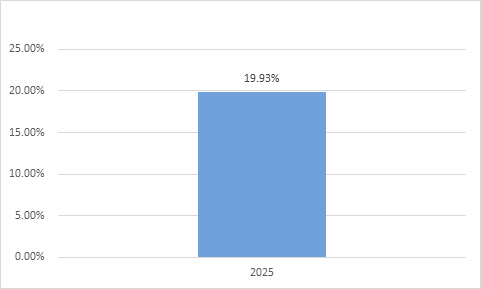
| Best Quarter: | 11.19% | |
| Worst Quarter: | -1.74% |
| One-year | Since inception (12/20/24) | |
| Return Before Taxes (No Load) | 19.93% | 19.95% |
| Return After Taxes on Distributions (No Load) | 19.78% | 19.80% |
| Return After Taxes on Distributions and Sale of Fund Shares (No Load) | 11.90% | 15.21% |
MSCI USA Net Total Return USD Index (1) (reflects no deduction for fees, expenses or taxes) |
17.31% | 16.96% |
| (1) | The MSCI USA Net Total Return USD Index is calculated using a net return methodology, which generally assumes the reinvestment of dividends after the deduction of applicable withholding taxes as determined by the index provider. The withholding tax rates used by the index provider may differ from the rates applicable to the Fund, and as a result, index performance may be lower than if the index used the Fund's applicable withholding tax rates, if any. |