Management discussion and analysis of financial
condition and results of operations for the
Fiscal Year ended June 30, 2026
TABLE OF CONTENTS
INTRODUCTION
As used in this Management Discussion and Analysis (“MD&A”), unless the context indicates or requires otherwise, all references to the “Company”, “Sangoma”, “we”, “us”, or “our” refer to Sangoma Technologies Corporation, together with our subsidiaries, on a consolidated basis as constituted on June 30, 2026. The MD&A is for the Fiscal Year ended June 30, 2026 as compared to the same periods in the previous year. This MD&A should be read in conjunction with Sangoma’s audited annual consolidated financial statements and related notes as at and for the year ended June 30, 2026 (“Financial Statements”), which have been prepared in accordance with International Financial Reporting Standards as issued by the International Accounting Standards Board (“IFRS Accounting Standards”), and the interim financial statements for the Fiscal Year ended June 30, 2026, prepared in accordance with IAS 34. All amounts are in thousands of United States dollars except where otherwise indicated.
Additional information about us, including copies of our continuous disclosure materials, is available on our website at www.sangoma.com, through the EDGAR website at www.sec.gov or through the SEDAR+ website at www.sedarplus.ca.
This MD&A is dated as of September 28, 2026.
NON-IFRS MEASURES
This MD&A contains references to certain non-IFRS financial measures such as Adjusted EBITDA and Free Cash Flow. These measures are used by management to evaluate the performance of the Company and do not have any meaning prescribed by IFRS and therefore may not be comparable to similar measures presented by other reporting issuers. Rather, these measures are provided as additional information to complement those IFRS measures by providing further understanding of our results of operations from management’s perspective should not be considered in isolation nor as a substitute for analysis of our financial information reported under IFRS. These non-IFRS measures are used to provide investors with alternative measures of our operating performance and liquidity and thus highlight trends in our business that may not otherwise be apparent when relying solely on IFRS measures. We also believe that securities analysts, investors and other interested parties frequently use non-IFRS measures to compare issuers. Management also uses non-IFRS measures to facilitate operating performance comparisons from period to period, the preparation of annual operating budgets and forecasts and to determine components of executive compensation. “Adjusted EBITDA” means earnings before income taxes, interest expense (net), share-based compensation, depreciation (including for right-of-use assets), amortization, restructuring and business integration costs, goodwill impairment, change in fair value of consideration payable and loss on sale divestiture of subsidiary. “Free Cash Flow” means cash flows from operating activities less cash used for purchases of property and equipment and capitalized development costs. The reconciliation of the closest IFRS measure to the non-IFRS measure is set out on pages 18 and 21 herein.
FORWARD-LOOKING STATEMENTS
This MD&A contains forward-looking statements, including statements regarding the future success of our business, development strategies and future opportunities. Forward-looking statements are provided for the purpose of presenting information about management’s current expectations and plans relating to the future, and readers are cautioned that such statements may not be appropriate for other purposes.
Forward-looking statements include, but are not limited to, statements relating to management’s guidance on revenue and Adjusted EBITDA, expectations regarding demand for the Company’s Products and Services, supply chain dynamics, foreign exchange impacts, cash flows, and other statements that are not historical facts. Words such as “believe”, “could”, “plan”, “estimate”, “expect”, “will”, “intend”, “may”, “potential”, “should”, and similar expressions are intended to identify forward-looking statements.
Although Sangoma believes that the expectations reflected in these forward-looking statements are reasonable, such statements involve known and unknown risks, uncertainties, and other factors that may cause actual results, performance, or achievements to differ materially from those expressed or implied by such forward-looking statements. These risks and uncertainties include, but are not limited to: changes in exchange rate between the Canadian dollar and other currencies (in particular the United States (“U.S.”) dollar), changes in technology, including with respect to artificial intelligence and machine learning, changes in the business climate, changes to macroeconomic conditions, including (i) inflationary pressures and potential recessionary conditions, as well as actions taken by central banks and regulators across the world in an attempt to reduce, curtail and address such pressures and conditions, and (ii) recent events in the world economy and global financial and credit markets as a consequence of global conflicts, uncertain economic conditions, macroeconomic changes and trade wars (such as the trade war between the U.S., on the one hand, and China, Mexico and Canada, on the other), including the potential use and effects of tariffs to address the U.S. presidential administration’s policy goals, the effects of adverse developments at financial institutions, including bank failures, that impact general sentiment regarding the stability and liquidity of banks (including the U.S. government’s debt ceiling policies and contemplated or actual budget and tax cuts), and the resulting impact on the stability of the global financial markets at large, our ability to identify and remediate material weaknesses and significant deficiencies in our internal controls, changes in the regulatory environment, the imposition of tariffs, impact of our disposition of VoIP Supply, LLC and internal reorganizations, the decline in the importance of the PSTN (as defined herein), impairment of goodwill and new competitive pressures, and acts of terrorism and war, hostilities and conflicts, including, but not limited to, Russia’s invasion of Ukraine in February 2022, the Israel-Hamas conflict, the U.S.-Iran conflict (and related broader geographic instability, including threats to the Strait of Hormuz and elevated energy prices), and associated changes in global trade policies and economic sanctions); and the risks and uncertainties described in the Company’s most recently filed Annual Information Form for the fiscal year ended June 30, 2026.
Forward-looking statements are based on the opinions, estimates, and assumptions of management as of the date of this press release and are inherently subject to significant business, economic, and competitive uncertainties and contingencies. Readers are cautioned not to place undue reliance on forward-looking statements, as there can be no assurance that the plans, intentions, or expectations upon which they are based will occur. Except as required by applicable securities laws, Sangoma undertakes no obligation to update or revise any forward-looking statements, whether as a result of new information, future events, or otherwise.
The forward-looking statements contained in this MD&A are expressly qualified by this cautionary statement. Sangoma undertakes no obligation to update forward-looking statements if circumstances or management’s estimates or opinions should change except as required by law.
OVERVIEW
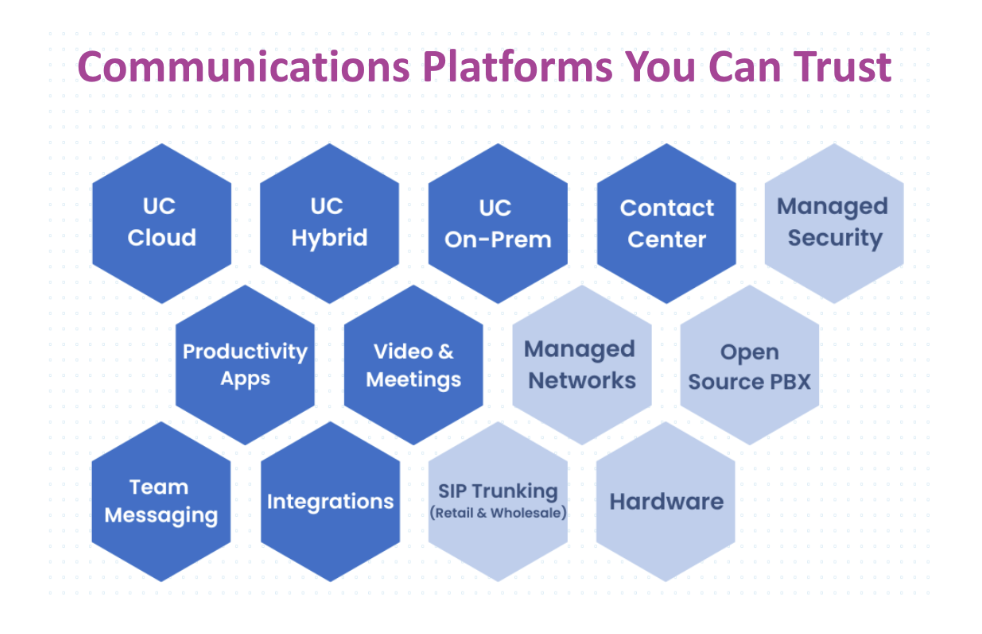
Sangoma is a leading business communications platform provider with solutions that include its award-winning UCaaS, CCaaS, CPaaS, and Trunking technologies. The enterprise-grade communications suite is developed in-house; available for cloud, hybrid, or on-premises deployments. Additionally, Sangoma’s integrated approach provides managed services for connectivity, network, and security. A trusted communications partner with over 40 years on the market, Sangoma has over 2.7 million UC seats across a diversified base of over 100,000 customers. Sangoma has been recognized for 11 years in the Gartner UCaaS Magic Quadrant. As the primary developer and sponsor of the open source Asterisk and FreePBX projects, Sangoma is determined to continuously drive innovation in communication technology.
Please refer to the Glossary of Terms for detailed definitions of terms used throughout this MD&A.
Unified Communications
Sangoma’s UC platforms are business communication systems (PBXs with advanced UC features, such as presence/chat, conferencing, mobility, fax, and more) that fully integrate with our phones, soft clients, and network interoperability products.
We build our platforms in-house to provide reliable, affordable Unified Communications services with strong security. This approach reduces third-party vulnerabilities and allows us to swiftly troubleshoot and customize solutions for customers.
Cloud-Based Business Phone Solution (UCaaS)
Sangoma UC Cloud
Our intuitive cloud solutions seamlessly integrate voice, video, messaging, and call center capabilities into a single platform, enhancing productivity and streamlining operations at a fraction of the cost. Experience true white-glove support.
Sangoma UC Hybrid
Our hybrid UCaaS is powered by our unique cloud architecture, which includes our on-premises StarBox® appliance and cloud-based network backbone components. This blend of cloud and on-premises ensures unparalleled scalability, flexibility, and reliability for your business communications. It provides local survivability, multiple failover options (4G LTE / POTS lines) and multi-location flexibility.
On-Premises Business Phone Solution
Sangoma UC Prem
Sangoma also offers the more traditional on-premise UC phone system, giving administrators complete control over updates and integrations, to deploy their business phone system on-premises. Whether deployed on a dedicated appliance or in the customer’s virtual environment, Sangoma provides the power and connectivity customers and partners can trust.
IP DeskPhone, headsets, UC Clients and Softphones
Sangoma offers a variety of IP deskphones and headsets for both cloud and on-premise systems, featuring HD Voice and seamless integration with UC systems. Their headsets support connectivity with phones or computers and allow roaming up to 325 feet. Additionally, Sangoma provides UC Clients and Softphones for making business calls via smartphone or computer, functioning as a primary phone or desk phone extension.
Additional Communications Products
Contact Center as a Service (CCaaS)
Sangoma CX is a cloud-based Contact Center as a Service (CCaaS) solution that enhances customer experience by integrating with UCaaS offerings. It enables businesses to manage inbound interactions across various channels and supports outbound call campaigns. With features like end-to-end encryption, AI automation, and an intuitive interface, it streamlines contact center operations for higher agent productivity and improved customer experience.
Communications Platform as a Service (CPaaS)
Sangoma CPaaS allows developers to create applications with real-time communication features like voice, video, chat, and SMS via the cloud. Sangoma provides a platform for developers and customers to build communication services using voice, APIs, WebRTC, and SMS. To ensure optimal performance, Sangoma offers its own SIP trunking service and sells communication apps based on their CPaaS product.
Video, meetings, and collaboration
Sangoma Meet is our video meetings, cloud-based service accessible from desktop or mobile. It enables file sharing on screen, integrates seamlessly with your calendar, and enables PSTN phone calls. TeamHub is Sangoma’s collaboration platform, which allows users to interact via chatting, calling, and video.
Trunking as a Service (Taas)
SIP trunks provide Internet-based telephony services using existing internet connections, eliminating the need for separate PSTN or digital connections. SIP trunking is increasingly popular for connecting an IP PBX system to a phone company due to cost efficiency and UC features. Sangoma offers two SIP trunking services: Retail SIP Trunking, with predictable monthly costs and easy integration into UC platforms, including a fax service; and Wholesale SIP Trunking, which is usage-based with a larger monthly minimum, suitable for large businesses. Additionally, Sangoma provides FaxStation, a hosted fax service with a telecom appliance for secure fax communication.
MSP Portfolio
Sangoma’s cloud-based Managed Service Provider (MSP) offerings deliver essential communication services that businesses rely on, enhancing our comprehensive suite of Communications as a Service solutions. This MSP product line is founded on a seamlessly integrated, enterprise-grade, end-to-end managed network, all backed by a dedicated 24/7 team of expert network engineers.The current MSP offering includes: SD-WAN, Internet, VPN, 5G, and WiFi access points. Sangoma also provides Managed Security solutions, which include anti-spam & antivirus, VPN, content filtering, data protection, and interaction detection.
Hardware
Sangoma provides network interconnection products that seamlessly link various types of networks. These products enable the connection of VoIP networks to PSTN, mobile networks, or even to other VoIP networks, ensuring versatile and efficient communication.
Sangoma provides solutions for secure and interoperable VoIP network connections, including Session Border Controllers (SBCs) and VoIP gateways. SBCs manage security and connectivity between various networks, available as hardware, software, or hybrid solutions. VoIP gateways facilitate voice traffic between VoIP and traditional PSTN networks. Additionally, Sangoma offers PSTN interface and media processing boards for developers needing to connect to the PSTN, maximizing flexibility and compatibility in various environments. All products have broad interoperability certifications.
Open-Source Software Products
Sangoma is the main developer and sponsor of the Asterisk project, the most widely used open-source communications software, and the FreePBX project, the most popular open-source PBX software. Sangoma also provides revenue-generating products and services beyond these open-source projects. These include software add-ons, IP phones, SIP trunking, cloud-based fax, training, technical support, maintenance, PSTN cards, VoIP gateways, session border controllers, and commercial versions of the PBX/UC software.
OVERALL PERFORMANCE
Operational
Sangoma is a trusted leader in developing technology platforms for essential business communications. Customers include companies in the SMB, mid-market and enterprise spaces looking for all the advantages of cloud-based communications at a fair price. Sangoma offers a wide range of products to complement its services, delivering high-quality solutions through a global network of partners and distributors.
Sangoma has always been operated and managed as a single economic entity. There is one management team that directs the activities of all aspects of the Company and it is managed globally by our executive team. As a result, we believe that we have one reporting segment, being the consolidated Company. Over time, this may change as the Company grows and when this occurs, we will reflect the change in our reporting practice.
Revenue
Sangoma generates revenue from both Services and Products. Our Services revenue is generated primarily from customers entering recurring revenue agreements for services such as our UCaaS platforms and MSP services. Product revenues are comprised of the sale of products and services that generate non-recurring revenue, including our UC on-prem platform and hardware.
Innovation
Sangoma is committed to advancing its AI capabilities by investing in and developing its proprietary AI platform and collaborating with leading third-party AI platforms.
By building on top of our existing CPaaS offerings and leveraging the low code/no code Studio workflow engine, we are delivering innovative Voice AI and Knowledge AI (RAG) Agent solutions that seamlessly integrate with our existing Cloud, Hybrid, and Prem products and services.
This approach ensures that our partners and customers benefit from both our in-house expertise and the broader AI ecosystem, enhancing their operations with cutting-edge, AI-driven services and insights.
Sales and marketing
Over the past year, Sangoma has undergone a transformation in its go-to-market strategy. We’ve embarked on a brand revitalization program with a strong focus on our digital properties, including new company positioning and refined messaging that reflects who we are as a company. We have established continuous education and training programs in collaboration with distributors and partners. Additionally, we have forged robust partnerships with key Technology Services Distributors (TSDs) like Telarus, Avant, App Direct, Intelisys, Jenne, and ScanSource to grow our business nationwide through the channel.
Sales
Sangoma utilizes a 100% channel-driven 'go to market' strategy, collaborating with diverse partners and market influencers. Our network includes individual agents, large technology service distributors (TSDs), and both national and regional distributors. Our customers span from mid-market enterprises needing distributed solutions to smaller SMBs that rely on our partners for digital infrastructure strategies.
Sangoma thrives in several sectors, notably healthcare, retail, and service providers. Through the Pinnacle Channel Partner Program, we offer extensive support to our partners, enabling them to deliver Sangoma's essential communication platform solutions to their end users. This support includes formal lead registration, training, quoting assistance, co-marketing efforts, and competitive commission structures and incentives.
Marketing
Sangoma's marketing goals are seamlessly aligned with its business objectives, which focus on driving revenue growth and delivering value to stakeholders. We also recognize the importance of increased brand visibility, recognition, and trust within the channel partner community and among end users.
Four key pillars anchor our marketing transformation: brand development and perception, channel marketing and enablement, lead generation, and fostering a culture of innovation and process efficiency.
For brand development, Sangoma has clarified its position as a leader in the communications industry, known for developing essential communication platforms with in-house software for all UC deployment types. This is complemented by offerings such as SIP trunking, hardware, managed services, and managed security.
Channel marketing and enablement are crucial for Sangoma, as we are dedicated to supporting our channel partners and distributors. Our multichannel strategy includes large and small events, webinars, trainings, online advertising, email marketing, public relations, promotional programs, and discounts.
In lead generation, our goal is to deliver more qualified leads to our partners, utilizing both outbound and inbound strategies. These are multichannel efforts targeting our Ideal Customer Profile with key messages about our solutions. Tactics include email, calls, content marketing, online advertising, social media, and public relations.
Lastly, cultivating a strong culture of trust and rapid experimentation, combined with robust CRM and email automation processes, is vital to our marketing transformation.
RESULTS OF OPERATIONS
All amounts are in thousands of United States dollars except where otherwise indicated.
ITEMS AFFECTING COMPARABILITY OF RESULTS
Revision of Previously Reported Quarterly Financial Information
During the fourth quarter of fiscal 2026, the Company identified and corrected an error in service revenue recognized on cancelled contracts subsequent to the date of cancellation. The error was caused by incomplete data migration between the Company's Salesforce and NetSuite systems (the "ERP Revenue Matter"), as a result of the Company’s ERP implementation on July 1, 2025. The ERP Revenue Matter did not have any impact on any periods prior to July 1, 2025 as the error occurred on transition of our ERP in the current fiscal year. The error had no impact on reported cash flow from operating activities in any reported period. The error overstated the Company’s revenue and understated deferred revenue in each period, the Company has corrected the previously reported revenue and related amounts for the first three quarters of fiscal 2026. Management assessed the materiality of the ERP Revenue Matter on the Q1/26, Q2/26 and Q3/26 interim financial statements for fiscal 2026, individually and in the aggregate, and concluded that the impact was not material to any period. The correction to each period, noted in the table below, will be reflected in the 2026 comparative period interim financial statements when we issue our fiscal 2027 interim financial statements. The correct amounts for the Q1, Q2 and Q3 interim periods have been re-presented below. These updated figures are being used by the Company for comparative purposes herein and will be used for comparative purposes going forward.
The change in general and administration expense in each period also reflects the retrospective allocation, to the quarters to which it relates, of a reduction in the Company's accrual for performance-based compensation. The Company accrues performance-based bonus expense throughout the year based on then-current projections of annual performance against target. As the ERP Revenue Matter reduced the Company's projected annual revenue and Adjusted EBITDA, the related bonus accrual has been correspondingly reduced, with the reduction allocated to the first three quarters of fiscal 2026. This reduction to general and administration expense partially offsets the effect of the revenue correction on Adjusted EBITDA and net loss in each period.
| | | | | | | | | | | | | | | | | | | | | | | | | | | | | |
| | | | | | | | | |
| Three month period ended
September 30, 2025 | Three month period ended
December 31, 2025 | Three month period ended
March 31, 2026 |
| Reported | Adjustment | As Adjusted | Reported | Adjustment | As Adjusted | Reported | Adjustment | As Adjusted |
| $ | $ | $ | $ | $ | $ | $ | $ | $ |
| Service revenue | $ | 46,878 | $ | (486) | $ | 46,392 | $ | 47,579 | $ | (1,246) | $ | 46,333 | $ | 46,775 | $ | (1,282) | $ | 45,493 |
| % of total revenue | 92% | | 92% | 92% | | 92% | 92% | | 92% |
| Product revenue | $ | 3,940 | — | $ | 3,940 | $ | 3,871 | — | $ | 3,871 | $ | 4,220 | — | $ | 4,220 |
| % of total revenue | 8% | | 8% | 8% | | 8% | 8% | | 8% |
| Total revenue | $ | 50,818 | $ | (486) | $ | 50,332 | $ | 51,450 | $ | (1,246) | $ | 50,204 | $ | 50,995 | $ | (1,282) | $ | 49,713 |
| Gross profit | $ | 36,805 | $ | (486) | $ | 36,319 | $ | 38,246 | $ | (1,246) | $ | 37,000 | $ | 36,361 | $ | (1,282) | $ | 35,079 |
| General & administration | $ | 7,246 | $ | (176) | $ | 7,070 | $ | 8,807 | $ | (456) | $ | 8,351 | $ | 7,266 | $ | (472) | $ | 6,794 |
| Net loss | $ | (2,337) | $ | (310) | $ | (2,647) | $ | (1,996) | $ | (790) | $ | (2,786) | $ | (2,335) | $ | (810) | $ | (3,145) |
| Adjusted EBITDA | $ | 8,297 | $ | (310) | $ | 7,987 | $ | 8,335 | $ | (790) | $ | 7,545 | $ | 7,475 | $ | (810) | $ | 6,665 |
Exit from Legacy Connectivity Products
During the fourth quarter of fiscal 2026, the Company made the decision to exit its Legacy Connectivity Hardware product line, a declining product category within the Company's broader Products portfolio, as part of its ongoing strategy to focus investment and resources on its higher-margin Services and software offerings. As a result of this decision, the Company recorded a non-cash inventory write-down of $3,000 in the fourth quarter of fiscal 2026, reflecting the reduction of the related inventory to net realizable value in accordance with IAS 2, Inventories. The write-down primarily relates to raw materials and component inventory that the Company no longer expects to sell or utilize as a result of the exit decision. The write-down was recognized in Q4 FY2026. In connection with this exit, during the first quarter of 2027, the Company has approved a detailed plan to restructure the associated operations, including headcount reductions and facility rationalization, to be implemented over the next two fiscal quarters. No restructuring costs have been incurred in fiscal 2026 related to this restructuring plan. The Company expects the restructuring to be Adjusted EBITDA accretive on a run-rate basis once completed, as it eliminates a lower-margin product line and the associated fixed cost base.
SUMMARY
The following table outlines our consolidated statements of loss and comprehensive loss for the periods indicated:
| | | | | | | | | | | | | | | | | | | | | | | | | | |
| Three month period ended June 30 | Years ended June 30 |
| 2026 | 2025 | Change | Change | 2026 | 2025 | Change | Change |
| $ | $ | $ | % | $ | $ | $ | % |
| | | | | | | | |
| Revenue | 49,816 | | 59,362 | | (9,546) | | (16)% | 200,065 | | 236,692 | | (36,627) | | (15)% |
| Cost of sales | 14,551 | | 19,321 | | (4,770) | | (25)% | 56,402 | | 74,943 | | (18,541) | | (25)% |
| Inventory write-down | 3,000 | | — | | 3,000 | | 100% | 3,000 | | — | | 3,000 | | 100% |
| Gross profit | 32,265 | | 40,041 | | (7,776) | | (19)% | 140,663 | | 161,749 | | (21,086) | | (13)% |
| | | | | | | | |
| Expenses | | | | | | | | |
| Sales and marketing | 11,923 | | 12,870 | | (947) | | (7)% | 48,866 | | 50,974 | | (2,108) | | (4)% |
| Research and development | 10,408 | | 10,018 | | 390 | | 4% | 42,904 | | 42,149 | | 755 | | 2% |
| General and administration | 8,191 | | 8,003 | | 188 | | 2% | 30,406 | | 37,129 | | (6,723) | | (18)% |
| Amortization of intangible assets | 7,974 | | 8,172 | | (198) | | (2)% | 32,112 | | 32,768 | | (656) | | (2)% |
| | | | | | | | |
| | | | | | | | |
| | | | | | | | |
| | | | | | | | |
| Interest expense (net) | 449 | | 658 | | (209) | | (32)% | 2,024 | | 4,012 | | (1,988) | | (50)% |
| | | | | | | | |
| Restructuring and business integration costs | 1,449 | | 447 | | 1,002 | | 224% | 2,506 | | 961 | | 1,545 | | 161% |
| | | | | | | | |
| | | | | | | | |
| | | | | | | | |
| Goodwill impairment | 68,394 | | — | | 68,394 | | 100% | 68,394 | | — | | 68,394 | | 100% |
| Loss on sale, divestiture of subsidiary | — | | 99 | | (99) | | (100)% | — | | 99 | | (99) | | (100)% |
| | | | | | | | |
| Loss before income tax | (76,523) | | (226) | | (76,297) | | 33760% | (86,549) | | (6,343) | | (80,206) | | 1264% |
| Provision for income taxes | | | | | | | | |
| Current | (226) | | 1,387 | | (1,613) | | (116)% | 563 | | 3,853 | | (3,290) | | (85)% |
| Deferred | (3,781) | | (1,822) | | (1,959) | | 108% | (6,018) | | (5,186) | | (832) | | 16% |
| Net income (loss) | (72,516) | | 209 | | (72,725) | | (34797)% | (81,094) | | (5,010) | | (76,084) | | 1519% |
| | | | | | | | |
Other comprehensive income (loss) | | | | | | | | |
Items to be reclassified to net income (loss) | | | | | | | | |
| Loss in fair value of interest rate swaps, net of tax | (28) | | (51) | | 23 | | (45)% | (173) | | (561) | | 388 | | (69)% |
| Foreign currency translation gain | 10 | | — | | 10 | | 100% | 120 | | — | | 120 | | 100% |
| Comprehensive Income (loss) | (72,534) | | 158 | | (72,692) | | (46008)% | (81,147) | | (5,571) | | (75,576) | | 1357% |
Loss per share | | | | | | | | |
| Basic and diluted | $ | (2.19) | | $ | 0.01 | | $ | (2.20) | | (21961)% | $ | (2.44) | | $ | (0.15) | | $ | (2.29) | | 1527% |
| | | | | | | | |
| Weighted average shares outstanding (thousands) | | | | | | | | |
| Basic and diluted | 33,172 | | 33,233 | | (61) | | — | | 33,245 | | 33,497 | | (252) | | (1)% |
| Diluted | 33,172 | | 34,547 | | (1,376) | | (4)% | 33,245 | | 33,497 | | (252) | | (1)% |
| Other pertinent information | | | | | | | | |
| Total assets | | | | | 235,511 | | 346,545 | | (111,034) | | (32.04) | % |
| Non-current financial liabilities | | | | | 15,824 | | 35,882 | | (20,058) | | (55.90) | % |
REVIEW OF OPERATIONS
For the year ended June 30, 2025, the Company’s results include VoIP Supply, LLC (“VS”) as the Company owned and operated VS for the entirety of Fiscal 2025. To facilitate comparability to Fiscal 2026, Sangoma has also provided certain supplemental metrics including revenue, cost of sales, gross profit and margin, and Adjusted EBITDA excluding VS, as further described within the MD&A.
Revenue Product vs Service
| | | | | | | | | | | | | | | | | | | | | | | | | | | | | | | | | | | |
| | | | | | | | | | | |
| Three month period ended
June 30 | Three month period ended March 31, * | Years ended
June 30 |
| 2026 | 2025 | Change | Change | 2026 | Change | Change | 2026 | 2025 | Change | Change |
| $ | $ | $ | % | $ | $ | % | $ | $ | $ | % |
| Service revenue | $ | 45,727 | 48,057 | (2,330) | (5)% | 45,493 | 234 | 1% | 183,945 | 195,100 | (11,155) | (6)% |
| % of total revenue | 92% | 81% | | 11% | 92% | | —% | 92% | 82% | | 10% |
| Product revenue | $ | 4,089 | $ | 11,305 | $ | (7,216) | (64)% | 4,220 | (131) | (3)% | 16,120 | 41,592 | (25,472) | (61)% |
| % of total revenue | 8% | 19% | | (11)% | 8% | | —% | 8% | 18% | | (10)% |
| Total revenue | $ | 49,816 | $ | 59,362 | $ | (9,546) | (16)% | 49,713 | 103 | —% | 200,065 | 236,692 | (36,627) | (15)% |
•Refer to section “ Revision of Previously Reported Quarterly Financial Information”
Quarterly Comparison
Service revenue for the fourth quarter of fiscal 2026 was $45,727 at 92% of total revenue, lower compared to $47,337 at 91% of total revenue in the equivalent quarter of the prior year without VS. On a quarter-over-quarter basis, Service revenue was 1% higher compared to $45,493 in the third quarter of fiscal 2026. The increase was primarily from cloud services revenue.
Product revenue for the fourth quarter of fiscal 2026 was $4,089 compared to $4,532 of Product revenue without VS in the equivalent quarter of the prior year. On a quarter-over-quarter basis, Product revenue was 3% lower compared to $4,220 in the third quarter of fiscal 2026. The decrease was primarily from a decrease in sales of the Company’s legacy connectivity products as described above under "Exit from Legacy Connectivity Products and the impact of macroeconomic factors on customer buying patterns.
Total revenue for the fourth quarter of fiscal 2026 was $49,816, lower as compared to $51,869 of total revenue in the equivalent quarter of the prior year without VS. On a quarter-over-quarter basis, total revenue was relatively flat compared to $49,713 in the third quarter of fiscal 2026. Revenue mix for the quarter was in line with the Company’s expectations.
Fiscal Year Comparison
For the full year, service revenue was $183,945 at 92% of total revenue, lower compared to $192,928 at 92% of total revenue in the the same period a year ago without VS. The decline in service revenue was primarily the result of longer sales cycles and onboarding for larger, multi-location deals.
For fiscal 2026, product revenue was $16,120 at 8% of total revenue, higher compared to $15,944 at 8% of total revenue in the the same period a year ago without VS, driven by an increase in one-time hardware purchases tied to new service revenue orders.
Cost of sales and gross profit
| | | | | | | | | | | | | | | | | | | | | | | | | | | | | | | | | | | | | | |
| | | | | | | | | | | | |
| Three month period ended June 30 | Three month period ended March 31, * | Years ended June 30 | |
| 2026 | 2025 | Change | Change | 2026 | Change | Change | 2026 | 2025 | Change | Change | | | |
| $ | $ | $ | % | $ | $ | % | $ | $ | $ | % | | | |
| Cost of sales | 14,551 | 19,321 | (4,770) | (25)% | 14,634 | (83) | (1)% | 56,402 | 74,943 | (18,541) | (25)% | | | |
| Inventory write-down | 3,000 | — | 3,000 | 100% | — | 3,000 | 100% | 3,000 | — | 3,000 | 100% | | | |
| Gross profit | 32,265 | 40,041 | (7,776) | (19)% | 35,079 | (2,814) | (8)% | 140,663 | 161,749 | (21,086) | (13)% | | | |
| Gross margin | 65% | 67% | | (2)% | 71% | | (6)% | 70% | 68% | | 2% | | | |
| Gross profit without Inventory write-down | 35,265 | 40,041 | (4,776) | (12)% | 35,079 | 186 | 1% | 143,663 | 161,749 | (18,086) | (11)% | | | |
| Gross margin without Inventory write-down | 71% | 67% | | 4% | 71% | | —% | 72% | 68% | | 4% | | | |
•Refer to section “ Revision of Previously Reported Quarterly Financial Information”
Quarterly Comparison
Cost of sales for the fourth quarter of fiscal 2026 was $14,551 compared to $13,141 without VS in the equivalent quarter of the prior year. On a quarter-over-quarter basis, cost of sales was lower compared to $14,634 in the third quarter of fiscal 2026 as the Company saw a decrease in product revenue.
Gross profit and margin for the fourth quarter of fiscal 2026, were $32,265 and 65% respectively, lower than $38,728 and 75% in the equivalent quarter of the prior year without VS and $35,079 and 71% in the third quarter of fiscal 2026, reflecting an increase in the Company’s lower margin TaaS revenue. The fourth quarter fiscal 2026 gross margin also reflects a $3.0 million write-down of legacy connectivity hardware inventory to net realizable value, recognized in connection with management's decision to exit this product line. See “Exit from Legacy Connectivity Products” above. Excluding this write-down, gross profit and margin for the fourth quarter of fiscal 2026, would have been $35,265 and 71% respectively, consistent with the underlying margin trajectory of the business.
Fiscal Year Comparison
For the full year of fiscal 2026, cost of sales was $56,402, higher compared to $52,172 in the same period a year ago without VS.
For the full year of fiscal 2026, gross profit and margin were $140,663 and 70%, compared to $156,700 and 75% in the same period a year ago without VS and $143,663 and 72%, excluding the inventory write-down.
Expenses
Costs are allocated to four main categories as follow:
| | | | | | | | | | | | | | | | | | | | | | | | | | | | | | | | | | | |
| Three month periods ended June 30 | Three month periods ended March 31, * | Years ended June 30 |
| 2026 | 2025 | Change | Change | 2026 | Change | Change | 2026 | 2025 | Change | Change |
| $ | $ | $ | % | $ | $ | % | $ | $ | $ | % |
| Sales and marketing | 11,923 | | 12,870 | | (947) | | (7)% | 12,466 | | (543) | | (4)% | 48,866 | | 50,974 | | (2,108) | | (4)% |
| Research and development | 10,408 | | 10,018 | | 390 | | 4% | 10,771 | | (363) | | (3)% | 42,904 | | 42,149 | | 755 | | 2% |
| General and administration | 8,191 | | 8,003 | | 188 | | 2% | 6,794 | | 1,397 | | 21% | 30,406 | | 37,129 | | (6,723) | | (18)% |
| Amortization of intangible assets | 7,974 | | 8,172 | | (198) | | (2)% | 7,974 | | — | | —% | 32,112 | | 32,768 | | (656) | | (2)% |
| | | | | | | | | | | |
| | | | | | | | | | | |
•Refer to section “ Revision of Previously Reported Quarterly Financial Information”, including an explanation of the change to general and administration.
Sales and marketing
Quarterly Comparison
Sales and marketing expense was $11,923 for the fourth quarter of fiscal 2026, decreased by 7% from the $12,870 incurred in the equivalent quarter of the prior year, at 24% of revenue compared to 22% the same quarter a year ago. The decrease was mainly attributed to continuing efforts to refine and focus the marketing efforts with our Go-To-Market strategy. The increase as a percentage of revenue reflects the decline in total revenue rather than an increase in spending, as absolute costs decreased in both the quarter and year-to-date periods. On a quarter-over-quarter basis, sales and marketing decreased by 4% compared to $12,466 in the third quarter of fiscal 2026 in line with the Company’s Go-To-Market efforts, and marketing resources focused on lead generation.
Fiscal Year Comparison
For the full year of fiscal 2026, sales and marketing expense was $48,866 decreased from the $50,974 in the equivalent period of the prior year, at 24% of revenue compared to 22% of revenue a year ago.
Research and development
A portion of the Company’s R&D costs are capitalized each period and amortized on a straight-line basis over three years (see the audited consolidated financial statements and related notes for the fiscal year ended June 30, 2026, available at www.sedarplus.ca and www.sec.gov).
Quarterly Comparison
The research and development costs incurred and amortized during the fourth quarter of fiscal 2026 were $10,408 up 4% from the $10,018 incurred in the equivalent quarter of the prior year, at approximately
21% of revenue compared to 17% a year ago. On a quarter-over-quarter basis, research and development was down 3% compared to $10,771 in the third quarter of fiscal 2026, at approximately 22% of revenue. Overall, the Company’s research and development costs have remained fairly consistent on an absolute dollar basis.
Fiscal Year Comparison
For the full year of fiscal 2026, the research and development cost was $42,904, up marginally from the $42,149 in the equivalent period of the prior year, at approximately 21% of revenue compared to 18% a year ago. The increase was mainly due to higher amortization of development costs, which is from the capitalization of those costs relating to new products and services.
For the year ended June 30, 2026, the Company did not have any significant projects that have not yet generated revenue, nor did it have any products or services that are not fully developed, and which are material to the Company, therefore no impairment was assessed on any projects.
General and administration
Quarterly Comparison
During the fourth quarter of fiscal 2026, general and administration expenses were $8,191 at approximately 16% of revenue, which increased by 2% from the $8,003 at approximately 13% of revenue in the equivalent quarter of the prior year. On a quarter-over-quarter basis, general and administration increased by 21% compared to $6,794 in the third quarter of fiscal 2026. The majority of this increase relates to (i) the difference between the reduction to the Company's performance-based compensation accrual recorded in each period, representing the full-year reduction to that accrual described under "Revision of Previously Reported Quarterly Financial Information" above, (ii) a standard annual true-up recorded in the third quarter to correct the annual accrual of the Federal Universal Service Fund ("FUSF") contributions earlier in the fiscal year, with the fourth quarter reflecting FUSF expense at the Company's normal quarterly rate, and (iii) severance and other restructuring costs incurred by the Company during the fourth quarter, partially offset by the Company's ongoing cost management initiatives.
Fiscal Year Comparison
For the full year of fiscal 2026, general and administration expenses were $30,406, decreased by 18% compared to the $37,129 in the equivalent period of the prior year, at approximately 15% of revenue compared to 16%, respectively. This decrease in the Company’s general and administration spending is primarily a result of savings and prudent and careful management of overhead costs.
Amortization of intangible assets
Quarterly Comparison
Amortization of intangible assets was $7,974 for the fourth quarter of fiscal 2026, decreased by 2% compared to the $8,172 incurred in the equivalent quarter of the prior year, at approximately 16% of revenue compared to 14%, respectively. On a quarter-over-quarter basis, Amortization of intangible assets was consistent compared to $7,974 in the third quarter of fiscal 2026.
Fiscal Year Comparison
For the full year of fiscal 2026, it was $32,112, decreased by 2% compared to the $32,768 in the equivalent period of the prior year, at approximately 16% of revenue compared to 14%, respectively.
Other expenses are allocated as follow:
| | | | | | | | | | | | | | | | | | | | | | | | | | | | | | | | | | | |
| Three month periods ended June 30 | Three month periods ended March 31, | Years ended June 30 |
| 2026 | 2025 | Change | Change | 2026 | Change | Change | 2026 | 2025 | Change | Change |
| $ | $ | $ | % | $ | $ | % | $ | $ | $ | % |
| | | | | | | | | | | |
| | | | | | | | | | | |
| | | | | | | | | | | |
| | | | | | | | | | | |
| Interest expense (net) | 449 | 658 | (209) | | (32)% | 450 | | (1) | | —% | 2,024 | | 4,012 | | (1,988) | | (50)% |
| | | | | | | | | | | |
| Restructuring and business integration costs | 1,449 | 447 | 1,002 | 224% | 355 | 1,094 | 308% | 2,506 | | 961 | | 1,545 | | 161% |
| | | | | | | | | | | |
| | | | | | | | | | | |
| | | | | | | | | | | |
| | | | | | | | | | | |
| | | | | | | | | | | |
Interest expense (net)
Quarterly Comparison
Net interest expense was $449 for the fourth quarter of fiscal 2026, a savings of $209 from the $658 incurred in the equivalent quarter of the prior year. The savings of 32% on the interest expense was primarily driven by the quarterly repayments of the term loans, the repayments of the first term loan and revolving credit facility in full, and interest income from its liquidable money market deposit account. On a quarter-over-quarter basis, net interest expense decreased slightly compared to $450 in the third quarter of fiscal 2026.
Fiscal Year Comparison
For the full year of fiscal 2026, it was $2,024, decreased by 50% from the $4,012 in the equivalent period of the prior year. The savings of $1,988 in interest expense is as a result of lower interest rates and the repayments of $20,600 in the term loans in the full year of fiscal 2026. As at June 30, 2026, the total outstanding debt decreased to $27,300 from $47,900 as at June 30, 2025.
Goodwill Impairment
Sangoma undertakes an annual assessment of potential impairment, as required by IFRS. IFRS considers the recoverable amount to be the higher of fair value less costs to sell and value-in-use. See the Company’s annual audited consolidated financial statements available on SEDAR and EDGAR for more information.
Sangoma performed the valuation of the recoverable amount of the Company’s single cash generating unit (CGU). The assessment determined that the recoverable amount was less than the carrying value as of June 30, 2026. Accordingly, the Company recorded a non-cash $68,394 write down of the goodwill, to bring down the carrying value to the recoverable amount. This goodwill impairment resulted primarily from, among other factors, a significant increase in the discount rate as a result of macroeconomic factors, which other companies in our industry sector have also experienced, during the latter months of fiscal 2026. The company recorded a goodwill impairment of nil for the fiscal year ended June 30, 2025.
Net loss
Quarterly Comparison
Net loss for the fourth quarter of fiscal 2026 was $72,516 ($2.19 loss per share fully diluted), compared to a net income of $209 ($0.01 income per share fully diluted) incurred in the equivalent quarter of the prior year.
Fiscal Year Comparison
For the full year of fiscal 2026, it was a net loss $81,094 ($2.44 loss per share fully diluted), compared to a net loss of $5,010 ($0.15 loss per share fully diluted), in the equivalent period of the prior year.
Adjusted EBITDA
The derivation of Adjusted EBITDA and the reconciliation of net (loss) income to Adjusted EBITDA for the comparable periods are shown in the table below.
| | | | | | | | | | | | | | | | | | | | | | | | | | |
| Three month periods ended June 30 | Years ended June 30 |
| 2026 | 2025 | Change | Change | 2026 | 2025 | Change | Change |
| $ | $ | $ | % | $ | $ | $ | % |
| Net (loss) income | (72,516) | | 209 | | (72,725) | | (34797)% | (81,094) | | (5,010) | | (76,084) | | 1519% |
| Tax recovery | (4,007) | | (435) | | (3,572) | | 821% | (5,455) | | (1,333) | | (4,122) | | 309% |
| Interest expense (net) | 449 | | 658 | | (209) | | (32)% | 2,024 | | 4,012 | | (1,988) | | (50)% |
| Share-based compensation | 696 | | 625 | | 71 | | 11% | 2,486 | | 2,908 | | (422) | | (15)% |
| Depreciation of property and equipment | 721 | | 993 | | (272) | | (27)% | 3,250 | | 4,066 | | (816) | | (20)% |
| Depreciation of right-of-use assets | 374 | | 593 | | (219) | | (37)% | 1,508 | | 2,564 | | (1,056) | | (41)% |
| Amortization of intangibles | 7,974 | | 8,172 | | (198) | | (2)% | 32,112 | | 32,768 | | (656) | | (2)% |
| | | | | | | | |
| Restructuring and business integration costs | 1,449 | | 447 | | 1,002 | | 224% | 2,506 | | 961 | | 1,545 | | 161% |
| Inventory write-down | 3,000 | | — | | 3,000 | | 100% | 3,000 | | — | | 3,000 | | 100% |
| | | | | | | | |
| | | | | | | | |
| Goodwill Impairment | 68,394 | | — | | 68,394 | | 100% | 68,394 | | — | | 68,394 | | 100% |
| Loss on sale, divestiture of subsidiary | — | | 99 | | (99) | | (100)% | — | | 99 | | (99) | | (100)% |
| Adjusted EBITDA | 6,534 | | 11,361 | | (4,827) | | (42)% | 28,731 | | 41,035 | | (12,304) | | (30)% |
| AEBITDA as a % of revenue | 13% | 19% | | (6)% | 14% | 17% | | (3)% |
| | | | | | | | |
| | | | | | | | |
Restructuring and business integration costs
Quarterly Comparison
The restructuring cost was $1,449 for the fourth quarter of fiscal 2026 compared to $447 incurred in the equivalent quarter of the prior year, and $355 in the third quarter of fiscal 2026. The increase reflects a reduction in headcount, primarily within the Company's sales and marketing and customer onboarding and support functions, undertaken to align the Company's cost structure with its current scale and forecasted growth trajectory. The restructuring cost incurred in fiscal 2026 does not include any restructuring costs to be incurred in fiscal 2027 as noted in the section “Exit from Legacy Connectivity Products”.
Fiscal Year Comparison
For the full year of fiscal 2026, the restructuring cost was $2,506, up from the $961 in the equivalent period of the prior year. These costs are directly related to actions taken as to better align resources with strategic priorities.
Quarterly Comparison
Adjusted EBITDA for the fourth quarter of fiscal 2026 was $6,534, lower than the $11,361 in the equivalent quarter of the prior year, at 13% and 19% of revenue in each period respectively. The decrease was primarily driven by lower revenue, gross margin compression, lower cash from operating activities as compared to the prior year period.
Fiscal Year Comparison
For the full year of fiscal 2026, it was 14% of revenue, lower than the 17% in the equivalent period of the prior year, coming in slightly below the Company’s expectation, consistent with the reasons listed above.
QUARTERLY RESULTS OF OPERATIONS
Selected financial information over the prior eight quarters is shown in the table below.
| | | | | | | | | | | | | | | | | | | | | | | | | | |
| First | Second | Third | Fourth | First | Second | Third | Fourth |
| quarter | quarter | quarter | quarter | quarter 2 | quarter 2 | quarter 2 | quarter |
| 2025 | 2025 | 2025 | 2025 | 2026 | 2026 | 2026 | 2026 |
| Product Revenue | $10,457 | $10,306 | $9,524 | $11,305 | $3,940 | $3,871 | $4,220 | $4,089 |
| Product Revenue % Total Revenue | 17% | 17% | 16% | 19% | 8% | 8% | 8% | 8% |
| Service Revenue | $49,693 | $48,807 | $48,543 | $48,057 | $46,392 | $46,333 | $45,493 | $45,727 |
| Service Revenue % Total Revenue | 83% | 83% | 84% | 81% | 92% | 92% | 92% | 92% |
| Total Revenue | $60,150 | $59,113 | $58,067 | $59,362 | $50,332 | $50,204 | $49,713 | $49,816 |
| Gross Profit | $41,181 | $40,488 | $40,039 | $40,041 | $36,319 | $37,000 | $35,079 | $32,265 |
Operating Expenses1 | $42,056 | $41,296 | $40,605 | $39,063 | $38,280 | $39,507 | $38,005 | $38,496 |
| | | | | | | | |
| Net (loss) income | $(1,910) | $(1,881) | $(1,428) | $209 | $(2,647) | $(2,786) | $(3,145) | $(72,516) |
| | | | | | | | |
| Earnings (loss) per share - basic and diluted | $(0.06) | $(0.06) | $(0.04) | $0.01 | $(0.08) | $(0.08) | $(0.09) | $(2.19) |
| | | | | | | | |
| Cash from Operating Activities | $12,127 | $11,913 | $10,620 | $7,126 | $4,628 | $9,341 | $5,165 | $4,568 |
| Free Cash Flow | $10,012 | $9,786 | $8,355 | $4,794 | $2,920 | $7,248 | $2,767 | $2,737 |
| | | | | | | | |
| Free Cash Flow per share - basic and diluted | $0.30 | $0.29 | $0.25 | $0.14 | $0.09 | $0.22 | $0.08 | $0.08 |
| | | | | | | | |
| | | | | | | | |
| Adjusted EBITDA | $9,814 | $10,088 | $9,772 | $11,361 | $7,987 | $7,545 | $6,665 | $6,534 |
| AEBITDA as a % Revenue | 16% | 17% | 17% | 19% | 16% | 15% | 13% | 13% |
| AEBITDA as a % Revenue quarterly change | | 1% | —% | 2% | (3)% | (1)% | (2)% | —% |
| | | | | | | | |
| | | | | | | | |
| | | | | | | | |
1 Operating Expenses consist of sales and marketing, research and development, general and administration and amortization of intangible assets.
2 Refer to section “ Revision of Previously Reported Quarterly Financial Information”
Sales and Net Loss by Quarter
As discussed in the Company's fiscal 2025 MD&A, the Company completed a transformation of its go-to-market approach during fiscal 2025, which contributed to extended sales cycles, particularly for larger enterprise accounts, and temporarily slowed revenue growth. Following completion of this transition, the Company expected sequential quarterly revenue growth to resume beginning in the second quarter of fiscal 2026. Due to continued sales cycle elongation and the factors described under "Guidance" below, sequential growth was delayed and started in the fourth quarter of fiscal 2026. Revenue for fiscal 2026 was fairly flat quarter over quarter, with service revenue continues to account for the majority of total revenue at 92% this quarter.
LIQUIDITY AND CAPITAL RESOURCES
As at June 30, 2026, the Company had current assets of $33,713 and current liabilities of $43,139, compared with $42,622 and $49,476 at June 30, 2025, respectively. The decrease in current assets is mainly due to cash, inventories, trade and other receivables, while the decrease in current liabilities is primarily due to sales tax payable and operating facility and loans.
Cash of $10,431 on June 30, 2026 was 23% lower than the $13,494 on June 30, 2025. The Company used a portion of its cash to continue servicing the debts and buyback of common shares. During the full year of fiscal 2026, the Company repaid $20,600 in term loan payments compared to $21,325 in term loan and $8,600 in revolving credit facility in fiscal 2025. As at June 30, 2026, the total outstanding debt was reduced to $27,300 from $47,900 as at June 30, 2025.
Trade receivables of $11,305 on June 30, 2026, were higher than the $10,631 on June 30, 2025. The proceeds of $4,500 for the sale of VoIP Supply LLC included in the other receivables on June 30, 2025 was received in the first quarter of fiscal 2026.
Inventories of $4,762 on June 30, 2026, were $3,465 lower than the $8,227 on June 30, 2025. The decrease primarily reflects a one-time, non-cash inventory write-down of $3,000 associated with the exit of legacy connectivity products, specifically IP telephony cards and session border controllers. The change was recorded in Inventory write-down in the consolidated statements of loss and comprehensive loss. See “Exit from Legacy Connectivity Products” above.
The Company’s net cash flows from operating activities in the fourth quarter of fiscal 2026 was $4,568, lower than the $7,126 incurred in the equivalent quarter of the prior year primarily driven by lower-than-anticipated revenue, compressed gross margins resulting from softer international demand and the impact of current macroeconomic conditions in the quarter. Net cash provided by operating activities as a percentage of Adjusted EBITDA for the fourth quarter of fiscal 2026 was 70%, compared to 63% from the prior year period.
The Company’s net cash flows from operating activities in the full year of fiscal 2026 was $23,702, lower than the $41,786 incurred in the equivalent period of the prior year. Net cash provided by operating activities as a percentage of Adjusted EBITDA for the full year of fiscal 2026 was 82% compared to 102% in the equivalent period of the prior year, falling in line with the Company’s expectation of an annual range of 80-100%.
Free Cash Flow
The derivation of Free Cash Flow and the reconciliation of net cash from operating activities to Free Cash Flow for the comparable periods are shown in the table below.
| | | | | | | | | | | | | | | | | | | | | | | | | | |
| Three month periods ended
June 30 | Years ended
June 30 |
| 2026 | 2025 | Change | Change | 2026 | 2025 | Change | Change |
| $ | $ | $ | % | $ | $ | $ | % |
| Net cash provided by operating activities | 4,568 | | 7,126 | | (2,558) | | (36)% | 23,702 | | 41,786 | | (18,084) | | (43)% |
| Purchase of property and equipment | (221) | | (822) | | 601 | | (73)% | (1,784) | | (2,391) | | 607 | | (25)% |
| Development costs | (1,610) | | (1,510) | | (100) | | 7% | (6,246) | | (6,448) | | 202 | | (3)% |
| Free Cash Flow | 2,737 | | 4,794 | | (2,057) | | (43)% | 15,672 | | 32,947 | | (17,275) | | (52)% |
| | | | | | | | |
| Free Cash Flow per share - basic & diluted | $ | 0.08 | | $ | 0.14 | | $ | (0.06) | | (43) | % | $ | 0.47 | | $ | 0.98 | | $ | (0.51) | | (52)% |
| | | | | | | | |
| | | | | | | | |
| Weighted average shares outstanding - basic & diluted | 33,172 | 33,233 | (61) | | —% | 33,245 | 33,497 | (252) | | (1)% |
| | | | | | | | |
| | | | | | | | |
Free Cash Flow for the fourth quarter of fiscal 2026 was $2,737 ($0.08 per share fully diluted), lower than the $4,794 ($0.14 per share fully diluted) incurred in the equivalent quarter of the prior year.
For the full year of fiscal 2026, it was $15,672 ($0.47 per share fully diluted) compared to $32,947 ($0.98 per share fully diluted) in the equivalent period of the prior year.
Credit Facility
On October 18, 2019, the Company entered into a new credit agreement (the “Original Credit Agreement”) in favour of its subsidiaries, Sangoma Technologies Inc. and Sangoma US Inc. (the “Borrowers”) with inter alia The Toronto-Dominion Bank and The Bank of Montreal, as lenders (the “Lenders”). Under the terms of the Original Credit Agreement, the Lenders provided the Borrowers with a term loan facility to refinance the Company’s existing credit facilities and to fund part of the purchase of Voip Innovation Acquisition.
On March 31, 2021, the Company entered into an amended and restated credit agreement (the “Amended and Restated Credit Agreement”) which amended and restated the Original Credit Agreement to allow the Company to fund part of the StarBlue Acquisition.
On March 28, 2022, the Company entered into the Second Amended and Restated Credit Agreement (the “Second Amended and Restated Credit Agreement”) which amended and restated the Amended and Restated Credit Agreement to allow the Company to fund part of the NetFortris Acquisition. The Second Amended and Restated Credit Agreement is comprised of: (i) a $6,000 revolving credit facility, (ii) a $21,750 term credit facility, which was used to partially fund the Voip Innovation Acquisition (iii) a $52,500 term credit facility, which was used to partially fund the StarBlue Acquisition, (iv) a $45,000 term credit facility, which was used to partially fund the NetFortris Acquisition (the “Term 3 Facility”), and (v) a $1,500 swingline credit facility.
On June 28, 2022, the Company entered into the first amendment to the Second Amended and Restated Credit Agreement to reflect certain administrative amendments and to amend the amount of the Term 3 Facility quarterly principal installments.
On October 19, 2022 and January 31, 2023 the Company drew down $3,000 and $2,300 from the revolving credit facility, respectively which were fully repaid on June 28, 2024.
On April 6, 2023 the Company entered into a second amendment to the Second Amended and Restated Credit Agreement to reflect certain administrative amendments and to amend the amount of the revolving credit facility from $6,000 to $20,000 and the amount of the swingline credit facility from $1,500 to $5,000. Both the first term loan and the the revolving credit facility were fully repaid in fiscal 2025.
On June 4, 2024, the Company entered into the third amendment to the Second Amended and Restated Credit Agreement to reflect certain administrative amendments. As at June 30, 2026, the total debt outstanding is $27,300 compared to $47,900 as at June 30, 2025.
Under its Second Amended and Restated Credit Agreement with its lenders, the Company must satisfy certain financial covenants, principally in respect of total funded debt to earnings before interest, taxes and amortization, and debt service coverage ratio. As at June 30, 2026, the Company was in compliance with all covenants related to its Credit Agreement.
CONTRACTUAL OBLIGATIONS
The following table shows the movement in contractual liabilities from July 1, 2025 to June 30, 2026:
| | | | | |
| $ |
Opening balance, July 1, 2024 | 12,654 | |
Revenue deferred during the year | 36,627 | |
Deferred revenue recognized as revenue during the year | (39,549) | |
| |
Ending balance, June 30, 2025 | 9,732 | |
Revenue deferred during the year | 113,524 | |
Deferred revenue recognized as revenue during the year | (114,651) | |
| |
Ending balance, June 30, 2026 | 8,605 | |
| |
| Contract liabilities - Current | 6,711 | |
| Contract liabilities - Non-current | 1,894 | |
| 8,605 | |
Commitments
The table below outlines our contractual commitments as of June 30, 2026:
| | | | | | | | | | | | | | | | | |
| within 12 months | 13-24 months | 25-36 months | >36 months | Total |
| $ | $ | $ | $ | $ |
| Accounts payable and accrued liabilities | 14,557 | | — | | — | | — | | 14,557 | |
| Sales tax payable | 1,365 | | — | | — | | — | | 1,365 | |
| | | | | |
| Operating facility and loans | 18,412 | | 8,888 | | — | | — | | 27,300 | |
| Lease obligations on right of use assets | 1,772 | | 1,282 | | 1,162 | | 3,315 | | 7,531 | |
| Other non-current liabilities | — | | — | | — | | 1,628 | | 1,628 | |
| 36,106 | | 10,170 | | 1,162 | | 4,943 | | 52,381 | |
OFF-BALANCE SHEET ARRANGEMENTS
There are no off-balance sheet arrangements that have, or are reasonably likely to have, a current or future effect on the results of operations or financial condition of Sangoma.
RELATED PARTY TRANSACTIONS
Except as disclosed in the notes to the consolidated financial statements, the Company is not party to any material transactions with related parties.
CRITICAL ACCOUNTING POLICIES AND ESTIMATES
The preparation of our consolidated financial statements in conformity with IFRS requires management to make estimates and assumptions that affect the amounts reported in the consolidated financial statements and accompanying notes. We review these estimates on an ongoing basis based on management’s best
knowledge of current events and actions that we may undertake in the future. Actual results could differ from these estimates. All significant estimates and critical judgments, estimates, and assumptions are described in Note 3 of the Company’s Financial Statements.
FINANCIAL INSTRUMENTS AND OTHER INSTRUMENTS
The fair values of the cash and cash equivalents, trade and other receivables, contract assets, other current assets, accounts payable and accrued liabilities, approximate their carrying values due to the relatively short-term nature of these financial instruments or as these financial instruments are fair valued at each reporting period. The fair values of operating facility and loans approximate their carrying values due to variable interest loans or fixed rate loan, which represent market rate. Derivative assets and liabilities and consideration payable are recorded at fair value. Further details relating to our financial instruments, the risks associated with the financial instruments and how we manage those risks, are described in Note 4 of the Company’s Financial Statements.
SIGNIFICANT EVENTS
Normal Course Issuer Bid
On March 25, 2025, the Company announced its intention to make an Normal Course Issuer Bid (“NCIB”) with respect to its Shares. Pursuant to the NCIB, during the 12-month period commencing March 27, 2025 and ending no later than March 26, 2026, the Company was authorized to purchase up to 1,679,720 shares, representing 5% of the total number of 33,594,409 shares outstanding as of March 17, 2025, through the facilities of the TSX, the Nasdaq Global Select Market or alternative Canadian trading systems.
Under the term of the NCIB, during the year ended June 30, 2026, the Company purchased a total of 195,949 common shares (June 30, 2025 – 514,486) at an average price of $5.02 per share (June 30, 2025 - $5.56), for total consideration of $985 (June 30, 2025 - $2,859). During the year ended June 30, 2026, the Company cancelled a total of 270,694 (June 30, 2025 – 507,357) common shares including 195,949 purchased in fiscal 2026 and 74,745 purchased at the end of fiscal 2025. the Company recorded a total reduction of $1,028 (June 30, 2025 - $2,872) in share capital for the value of the common shares settled and cancelled in the periods.
Subsequent to the quarter end, on April 1, 2026, the TSX accepted the Company's notice to renew its NCIB for a further 12-month period commencing April 6, 2026 and ending no later than April 5, 2027, under which the Company may purchase up to 1,663,939 Shares, representing approximately 5% of the 33,278,790 Shares outstanding as of March 24, 2026, through the facilities of the TSX, the Nasdaq Global Select Market, or alternative Canadian trading systems. The Company has not yet purchased any shares under the current NCIB.
In connection with the NCIB, the Company entered into an automatic share purchase plan ("ASPP") with a designated broker for the purpose of allowing the Company to purchase its common shares under the NCIB during self-imposed trading blackout periods. Under the ASPP, the broker is authorized to repurchase common shares during blackout periods, without consultation with the Company, on predefined terms, including share price, time period and subject to other limitations imposed by the Company and subject to rules and policies of the TSX and applicable securities laws, such as a daily purchase restriction.
The Company did not provide its Broker with instructions to continue purchasing under its NCIB during the blackout period following the end of fiscal 2026. As at June 30, 2026, the Company had no liability and was not required to pay the designated broker under the ASPP.
SUBSEQUENT EVENTS
As a result of the strategic review process, on September 28, 2026, the Board has approved the sale of the Company, subject to certain closing conditions.
OUTSTANDING SHARE INFORMATION
We are currently authorized to issue an unlimited number of common shares. As of the date hereof, 33,503,340 common shares, 94,000 stock options and 912,704 share units are issued and outstanding.
GUIDANCE
Fiscal 2026 Results Against Guidance
Sangoma provided guidance for Fiscal 2026 on September 17, 2025, which it reaffirmed on November 5, 2025. That guidance included total revenue in the range of $200 - $210 million, with sequential growth expected in the second quarter of Fiscal 2026, and an Adjusted EBITDA² margin in the range of 17%-19%, inclusive of incremental go-to-market investments to stimulate organic growth. Sangoma narrowed its Fiscal 2026 guidance on February 4, 2026, providing total revenue in the range of $205–$208 million and an Adjusted EBITDA² margin in the range of 17-18%, and further narrowed the guidance on May 13, 2026 to a revenue range of $204 - $205 million and an Adjusted EBITDA² margin of 15 - 16%.
Actual fiscal 2026 revenue was $200 million and actual Adjusted EBITDA margin was 14%. Several factors contributed to the variance between guidance and actual results, including the ERP Revenue Matter described above under "Revision of Previously Reported Quarterly Financial Information," continued macroeconomic softness affecting the Company's Products business, and longer sales cycles resulting in delays between bookings and revenue recognition. The Company's guidance throughout fiscal 2026 was based on revenue as originally reported for the first three quarters of the year, prior to identification of the ERP Revenue Matter. Had the Company's guidance been based on revenue reflecting the subsequent downward revision, the Company's guidance ranges as reaffirmed or narrowed at each applicable date would have been
correspondingly lower, though the ERP Revenue Matter was not the sole driver of the variance between the Company's final narrowed guidance and its actual results.
Guidance for Fiscal 2027
In light of the ongoing strategic review, the Company is not providing guidance for Fiscal 2027.
EVALUATION OF DISCLOSURE CONTROLS AND PROCEDURES
Management of the Company, under the supervision of the Chief Executive Officer and interim Chief Financial Officer, is responsible for establishing and maintaining disclosure controls and procedures and internal control over financial reporting (“ICFR”) (as defined under applicable Canadian securities laws and by the United States Securities and Exchange Commission (“SEC”) in Rule 13a-15(e) and 15d-15(e) under the Securities Exchange Act of 1934, as amended (the “Exchange Act”)) for the Company to ensure that (i) material information relating to the Company is made known to management by others, particularly during the period in which the annual and interim filings are being prepared; and (ii) information required to be disclosed by the Company in its annual and interim filings or other reports filed or submitted under securities legislation is recorded, processed, summarized and reported within the time period specified in securities legislation. Our certifying officers concluded that, as a result of the material weakness in internal control over financial reporting described below, our disclosure controls and procedures were not effective as of June 30, 2026.
Management’s Report on Internal Control over Financial Reporting
Internal control over financial reporting (“ICFR”), as defined under the rules of the Canadian Securities Administrators and under Rules 13a-15(f) and 15d-15(f) under the Exchange Act, is a process designed to provide reasonable assurance regarding the reliability of financial reporting and the preparation of financial statements for external purposes in accordance with IFRS. ICFR includes those policies and procedures that establish the following:
a.maintenance of records in reasonable detail, that accurately and fairly reflect the transactions and dispositions of assets;
b.reasonable assurance that transactions are recorded as necessary to permit preparation of financial statements in accordance with applicable IFRS;
c.receipts and expenditures are only being made in accordance with authorizations of management or the Board of Directors; and
d.reasonable assurance regarding prevention or timely detection of unauthorized acquisition, use or disposition of the Company’s assets that could have a material effect on the financial statements.
Because of its inherent limitations, ICFR may not prevent or detect misstatements. Also, projections of any evaluation of effectiveness to future periods are subject to the risk that controls may become inadequate because of changes in conditions or that the degree of compliance with the policies or procedures may deteriorate.
A material weakness is a deficiency, or a combination of deficiencies, in ICFR, such that there is a reasonable possibility that a material misstatement of the Company’s annual or interim financial statements will not be prevented or detected on a timely basis.
Management, under the supervision and with the participation of our Chief Executive Officer and interim Chief Financial Officer and oversight of the Board of Directors, evaluated the effectiveness of our ICFR as of June 30, 2026 against the criteria set forth in Internal Control – Integrated Framework (2013) issued by the Committee of Sponsoring Organizations of the Treadway Commission. Based upon the evaluation, our Chief Executive Officer and Chief Financial Officer have concluded that, because of the material weakness described below, the Company’s ICFR was not effective as at June 30, 2026. This annual report does not include an attestation report of the Company’s registered public accounting firm due to the established rules of the Securities and Exchange Commission.
Management has concluded that the consolidated financial statements for fiscal year 2026 present fairly, in all material respects, the financial position of the Company at June 30, 2026 in conformity with IFRS and our external auditors have issued an unqualified opinion on our consolidated financial statements as of and for the year ended June 30, 2026.
Material Weakness in ICFR
Management did not maintain effective process-level controls over the Company’s revenue recognition and deferred revenue reconciliation processes. Specifically, (a) the Company’s review control over revenue was not designed with sufficient precision to identify misstatements arising from customer cancellations that were not correctly reflected in revenue recognized, and (b) the Company did not consistently perform its manual detective controls for reconciling billing activity, revenue recognized, and deferred revenue.
The material weakness resulted from the Company’s risk assessment process not identifying, at a sufficient level of precision, the incremental controls needed as the Company transitioned to a new enterprise resource planning system during the year.
These control deficiencies resulted in immaterial misstatements of revenue and deferred revenue in certain prior interim periods of fiscal 2026, which management has since revised in the Company’s MD&A and is correctly recorded in the Company’s annual financial statements. .
Remediation of Material Weakness in ICFR
Management is committed to the planning and implementation of remediation efforts to address the material weakness, as well as to foster improvement in the Company’s internal controls. These remediation efforts are underway and are intended to address the identified material weakness and enhance the overall financial control environment. We have taken certain measures to remediate the material weakness described above, including correcting the underlying system defect that caused customer cancellations not to be reflected across the Company’s systems; implementing automated exception-reporting to monitor the flow of cancellation and contract-status data between the Company’s billing systems, Salesforce, and NetSuite; implementing a new reconciliation between billing activity and revenue recognized; restricting the ability to manually change contract dates or cancellation status in Salesforce; retraining the control owners responsible for the Company’s manual detective controls; and introducing a supervisory monitoring layer under which a member of management independently confirms, on a monthly basis, that those controls were performed.
While we believe that the efforts taken to date and those planned for remediation will improve the effectiveness of our internal control over financial reporting, these remediation efforts will require a sufficient period of time to operate for management to be able to conclude that the design is effective to
address the risks of material misstatement and that such controls are operating effectively through testing of such controls.
Changes in Internal Control over Financial Reporting
Aside from the material weakness described above and the related remediation activities, no changes in our internal control over financial reporting occurred during the quarter ended June 30, 2026 that have materially affected, or are reasonably likely to materially affect, our internal control over financial reporting.
GLOSSARY OF TERMS
Analog
Analog telephony is the telephone system that dates back to the original experiments by Alexander Graham Bell. The voice signal is picked up by a microphone and transmitted to the central office. Voice signals from the central office consist of voltages that drive a headset to produce sound. Analog means that the voice pressure signals are represented by voltages levels on the line.
API
Application Program Interface: An API is a purpose-built interface that allows fourth party software to interact with a particular application. A typical API is the user interface for Windows that allows programmers to write programs for Windows that use all its built-in utilities. APIs do not depend on revealing source code, in general. They are usually well documented and include sample programs that make development easy.
Codec
In the telephony context a codec is a mechanism of digitally encoding voice. On the PSTN a voice channel takes up 64kbps in a codec standard called G.711. Cell phones use a codec called GSM that compresses the voice further so that a GSM call consumes about 24kbps. Other compressed codecs are used in VoIP to conserve bandwidth. These include standards such as G.729, G.723. Most audio codecs are lossy, in that some of the voice quality is degraded by the compression. On the other hand, as bandwidth becomes cheaper, VoIP allows one to use other codecs that in fact use more bandwidth than the PSTN, the so-called broadband codecs that have DVD-like voice quality.
Digital telephony
In the modern PSTN only the “last mile” line to the customer is still analog, all other internal parts of the network are digital. Digital in this case means that at the central office the analog signal from the subscriber’s telephone is sampled digitally, converting the line voltages to a series of numbers that can be easily transmitted error free over long distances. See T1, E1 below.
DID
Direct Inward Dialing (“DID”) is a virtual phone number that uses the existing phone lines to route incoming calls. Callers can connect to a phone extension directly without an operator. This offers convenience for both employees and callers alike. DID offers a cost saving on its own and is less expensive when purchased with a SIP trunk.
Gateway
In the telephony context this is typically a separate unit with its own case and power supply that provides VoIP-to-PSTN services for a VoIP network. Almost all gateway devices use SIP interfaces to the VoIP system over Ethernet and have analog or digital telephony interfaces that connect to the PSTN. VoIP gateways are available from many manufacturers including Audiocodes, Cisco, Grandstream, Patton Electronics and many others.
ISDN
Integrated Services Digital Network (“ISDN”) is a set of communications standards for simultaneous digital transmission of voice, video, data, and other network services over the traditional circuits of the public switched telephone network. Of the many
variations of ISDN, Sangoma supports BRI (Basic Rate Interface) which is essentially an all-digital replacement for ordinary analog lines and PRI (Primary Rate Interface) which is used over T1 and E1 lines. BRI is very popular outside of North America. PRI is used worldwide.
IoT
Internet of Things (“IoT”) refers to a system of interrelated, internet-connected objects that are able to collect and transfer data over a wireless network without human intervention.
IP
The Internet Protocol (“IP”) is the primary protocol in the internet layer of the Internet protocol suite, and delivers data packets from the source host to the destination host solely based on the IP address.
ISP
Internet Service Provider
ITSP
Internet Telephony Service Provider who offer telecommunications service including voice over internet type connections.
IVR
Interactive Voice Response: IVR systems use the phone to navigate a menu, for example those used by banks to allow access to customer’s account information. IVR systems have typically been driven by dial tones as the buttons on your phone are pressed, but increasingly they are using voice recognition for navigation.
Open Source
Open Source software is distributed free subject to certain conditions. Open Source licenses usually stipulate that source code must always be distributed or made available, and any improvements in the code have to be donated back to the community. It is possible to have dual licensing: Open Source to the community and also a closed, commercial license of the same or similar software.
NetBorder
This is the trade name of a Sangoma SIP to PSTN gateway product. It includes several other functions in addition to the PSTN gateway function. The mass marketed version is known as NetBorder Express or NBE.
PBX
Private branch exchange. A PBX is a premised basis device to deliver calls from the PSTN or VOIP network to phones in a single or multiple locations.
PSTN
Public Switched Telephone Network: This is the standard telephone network that has been in operation for many decades. A telephone or FAX or PBX or other telephony device is generally connected to an analog line at a wall plug, which is connected by “last mile” cabling to the central office. The analog signal from the device is converted to a digital signal at the Telco central office and is multiplexed, 24 simultaneous voice channels per line (in North America) onto a T1 for onward transmission. At the other end of the line the digital channel is reconverted to analog for transmission over the “last mile” to the receiving phone or other device.
SBC
A Session Border Controller (“SBC”) is a device deployed in Voice over Internet Protocol (“VoIP”) networks to exert control over the signaling and usually also the media streams involved in setting up, conducting, and tearing down telephone calls or other interactive media communications. SBCs are deployed as demarcation points between enterprises and service providers and between service provider networks.
SD-WAN
A Software-defined Wide Area Network (“SD-WAN”) uses software to control and manage connectivity across a customers wide area network. While traditional wide area networks rely on physical routers to connect remote users, this centralized software solution can help customers monitor their performance of the network and manage traffic.
Signaling
Call setup and tear down is remarkably complicated, involving such things as responding to the different tones as well as generating them, caller identification, and handling the different features like hook-flash and voicemail properly. There are
different signaling mechanisms for different types of circuits. Analog circuits use tones such as out-of-order, busy, ringing as well as the dialing tones. T1 lines often use a data protocol called ISDN PRI, where packets of control data are exchanged on a separate data channel. ISDN PRI is a simplification of the general signaling protocol used internally by the telecommunications networks known as SS7. In all cases, signaling must be exactly compatible with what the Telco expects, so interoperability and standards are important.
SIP
Session Initiation Protocol: SIP is the emerging standard signaling protocol for VoIP, though it has much broader applications. SIP is responsible for setting up and teardown of two party and multiparty calls, as well as a host of management features. To a great and increasing extent, VoIP calls are SIP based. The term SIP Trunk is used to describe the provision of a SIP line to an end customer.
T1, E1
A T1 line is a circuit that simultaneously carries 24 digital telephone calls. At higher densities, 28 T1s are aggregated into a T3 line carrying 672 calls. Larger offices can also connect to the central office via T1 directly, so as to have only one circuit for up to 24 calls. T1 is standard in North America and Japan while E1 is the standard in the rest of the world. E1 carries 30 channels of digitized voice per line.
TDM
Time Division Multiplexing (“TDM”) is used in circuit switched networks to increase the number of calls carried simultaneously on any one circuit and formed the basis for the digital telephony networks.
TSD
A Technology Services Distributor (TSD) is a company that connects technology vendors and selling partners, and provides technology service solutions to IT sales agents. TSDs are also known as "master agents" or "telecom agents or brokers". TSDs play a key role in the technology advisory channel, and offer many benefits, including: quick access to solutions, generating sales volume, collecting commissions, industry experience and business solutions, enablement training, and marketing activities.
Unified Communications
Unified communications is a concept in which voice, email, messaging, video, and any other type of communication are all considered forms of data that can be combined, manipulated, and used in intelligent applications seamlessly.
VoIP
Voice over IP is the transfer of voice traffic over the Internet Protocol. IP is used universally for all networking, including local area networks and private networks, not just the Internet. VoIP is not necessarily voice over the Internet, but voice over general data networks.