Capital appreciation and income.
This table describes the fees and expenses that you may pay if you buy, hold, and sell Fund shares. You may pay other fees, such as brokerage commissions and other fees to financial intermediaries, which are not reflected in this table and examples below.
(expenses that you pay each year as a percentage of the value of your investment) | Class A Shares | |||
Management Fees | 0.45% | |||
Distribution (12b‑1) Fees | None | |||
Other Expenses | 0.11% | |||
Total Annual Fund Operating Expenses | 0.56% | |||
This Example is intended to help you compare the cost of investing in the Fund with the cost of investing in other mutual funds. The Example assumes that you invest $10,000 in the Fund for the time periods indicated and then redeem or hold all of your shares at the end of those periods. The Example also assumes that your investment has a 5% return each year and that the Fund’s operating expenses remain the same.
1 Year | 3 Years | 5 Years | 10 Years | |
Opportunistic Income Fund — Class A Shares | $57 | $179 | $313 | $701 |
The Fund pays transaction costs, such as commissions, when it buys and sells securities (or “turns over” its portfolio). A higher portfolio turnover rate may indicate higher transaction costs and may result in higher taxes when Fund shares are held in a taxable account. These costs, which are not reflected in annual Fund operating expenses or in the Example, affect the Fund’s performance. During the most recent fiscal year, the Fund’s portfolio turnover rate was 47% of the average value of its portfolio.
The Opportunistic Income Fund invests primarily in a diversified portfolio of investment grade and non-investment grade fixed-income securities (junk bonds), including: (i) securities issued or guaranteed by the U.S. Government and its agencies and instrumentalities and obligations of U.S. and foreign commercial banks, such as certificates of deposit, time deposits, bankers’ acceptances and bank notes; (ii) obligations of foreign
governments; (iii) U.S. and foreign corporate debt securities, including commercial paper, and fully-collateralized repurchase agreements with counterparties deemed credit-worthy by the Fund’s sub-advisers (each, a Sub-Adviser and collectively, the Sub-Advisers); and (iv) securitized issues, such as residential and commercial mortgage-backed securities, asset-backed securities, mortgage dollar rolls, when issued/delayed delivery securities and collateralized debt obligations. These securities may be fixed-, variable- or floating-rate obligations and will primarily be rated CCC- or higher at the time of purchase by at least one ratings agency, although the Fund may also invest in lower rated securities. There are no restrictions on the maturity of any individual securities or on the Fund’s average portfolio maturity, although the average portfolio duration of the Fund will typically vary between zero and two years. Duration is a measure of the expected life of a fixed income security that is used to determine the sensitivity of a security’s price to changes in interest rates.
The Fund uses a multi-manager approach under the general supervision of SEI Investments Management Corporation (SIMC or the Adviser), allocating the assets among multiple Sub-Advisers that use different investment strategies designed to produce a total return that exceeds the total return of the Secured Overnight Financing Rate (SOFR), which measures the cost of borrowing cash overnight collateralized by U.S. Treasury securities.
The Sub-Advisers may seek to enhance the Fund’s return by actively managing the Fund’s foreign currency exposure. Up to 10% of the Fund’s assets may be invested in foreign currencies. In managing the Fund’s currency exposure, the Sub-Advisers buy and sell currencies (i.e., take long or short positions) using derivatives, principally futures, foreign currency forward contracts, swaps and options. The Fund may take long and short positions in foreign currencies in excess of the value of the Fund’s assets denominated in a particular currency or when the Fund does not own assets denominated in that currency. In managing the Fund’s currency exposure for foreign securities, the Sub-Advisers may buy and sell currencies for hedging or for speculative purposes.
The Fund also invests a portion of its assets in bank loans, which are generally non-investment grade (junk bond) floating rate instruments. Up to 100% of the bank loans in which the Fund invests may be junk bonds. The Fund may invest in bank loans in the form of participations in the loans (participations) and assignments of all or a portion of the loans from third parties (assignments). The Fund may also invest in other financial instruments or use other investment techniques, such as reverse repurchase agreements, to seek to obtain market exposure to the securities in which the Fund primarily invests.
The Fund may also invest in futures contracts and swaps for speculative or hedging purposes. Futures and swaps are used to synthetically obtain exposure to securities or baskets of securities and to manage the Fund’s interest rate duration and yield curve exposure. These derivatives are also used to mitigate the Fund’s overall level of risk and/or the Fund’s risk to particular types of securities or market segments. Interest rate swaps are further used to manage the Fund’s yield spread sensitivity. When the Fund seeks to take an active long or short position with respect to the likelihood of an event of default of a security or basket of securities, the Fund may use credit default swaps. The Fund may buy credit default swaps in an attempt to manage credit risk where the Fund has credit exposure to an issuer, and the Fund may sell credit default swaps to more efficiently gain credit exposure to such security or basket of securities.
The bar chart and the performance table below provide some indication of the risks of investing in the Fund by showing changes in the Fund’s performance from year to year for the past ten calendar years and by showing how the Fund’s average annual returns for 1, 5 and 10 years, and since the Fund’s inception compare with those of a broad measure of market performance. The performance information shown is based on full calendar years. The Fund’s past performance (before and after taxes) is not necessarily an indication of how the Fund will perform in the future. For current performance information, please call 1‑800-DIAL-SEI.
Best Quarter: 6.68% (6/30/20) Worst Quarter: ‑7.71% (3/31/20) The Fund’s total return from January 1, 2026 to June 30, 2026 was 1.77%. |
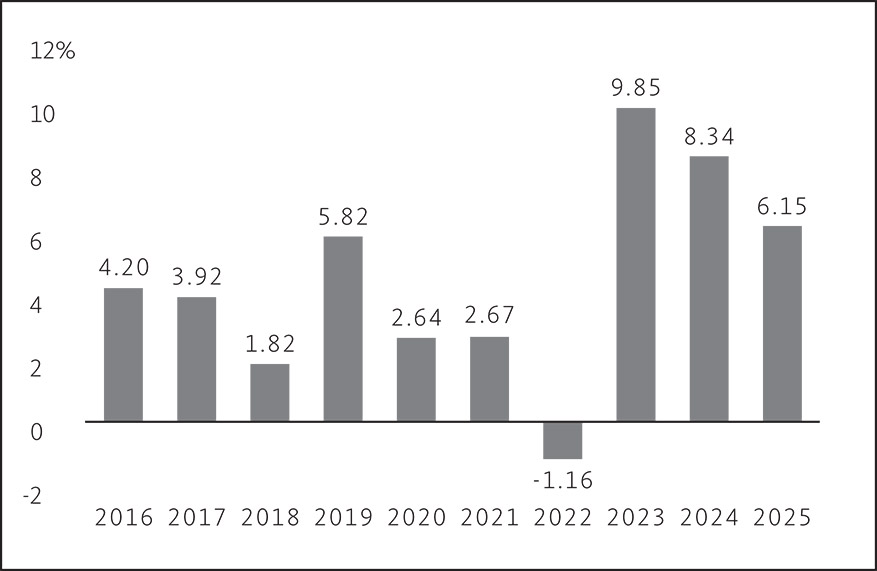
Best Quarter: 6.68% (6/30/20)
Worst Quarter: -7.71% (3/31/20)
The Fund's total return from January 1, 2026 to June 30, 2026 was 1.77%.
This table compares the Fund’s average annual total returns to those of a broad-based securities market index and an additional index with characteristics relevant to the Fund’s investment strategy.
After-tax returns are calculated using the historical highest individual federal marginal income tax rates and do not reflect the impact of state and local taxes. Your actual after-tax returns will depend on your tax
situation and may differ from those shown. After-tax returns shown are not relevant to investors who hold their Fund shares through tax-deferred arrangements, such as 401(k) plans or individual retirement accounts.
Opportunistic Income Fund | 1 Year | 5 Years | 10 Years | Since | |||
Return Before Taxes | 6.15 | % | 5.09 | % | 4.38 | % | 2.35% |
Return After Taxes on Distributions | 3.61 | % | 2.86 | % | 2.53 | % | 0.95% |
Return After Taxes on Distributions and Sale of Fund Shares | 3.60 | % | 2.92 | % | 2.54 | % | 1.16% |
Bloomberg U.S. Aggregate Bond Index Return (reflects no deductions for | 7.30 | % | ‑0.36 | % | 2.01 | % | 3.17% |
ICE BofA USD 3-Month Deposit Offered Rate Constant Maturity Index Return | 4.42 | % | 3.26 | % | 2.38 | % | 1.89% |