Long-term capital appreciation.
This table describes the fees and expenses that you may pay if you buy, hold, and sell Fund shares. You may pay other fees, such as brokerage commissions and other fees to financial intermediaries, which are not reflected in this table and examples below.
(expenses that you pay each year as a percentage of the value of your investment) | Class A Shares | |||
Management Fees | 0.65% | |||
Distribution (12b‑1) Fees | None | |||
Other Expenses | 0.07% | |||
Total Annual Fund Operating Expenses | 0.72% | |||
This Example is intended to help you compare the cost of investing in the Fund with the cost of investing in other mutual funds. The Example assumes that you invest $10,000 in the Fund for the time periods indicated and then redeem or hold all of your shares at the end of those periods. The Example also assumes that your investment has a 5% return each year and that the Fund’s operating expenses remain the same.
1 Year | 3 Years | 5 Years | 10 Years | |
Small/Mid Cap Equity Fund — Class A Shares | $74 | $230 | $401 | $894 |
The Fund pays transaction costs, such as commissions, when it buys and sells securities (or “turns over” its portfolio). A higher portfolio turnover rate may indicate higher transaction costs and may result in higher taxes when Fund shares are held in a taxable account. These costs, which are not reflected in annual Fund operating expenses or in the Example, affect the Fund’s performance. During the most recent fiscal year, the Fund’s portfolio turnover rate was 76% of the average value of its portfolio.
Under normal circumstances, the Small/Mid Cap Equity Fund will invest at least 80% of its net assets (plus the amount of any borrowings for investment purposes) in equity securities (including common and preferred stocks) of small and medium-sized companies, exchange-traded funds (ETFs) based on small and medium-sized capitalization indexes and securities of real estate investment trusts (REITs). The Fund will invest primarily in common stocks of U.S. companies with market capitalizations in the range of companies in the Russell 2500 Index (between $6.99 million and $25.78 billion as of July 31, 2026) at the time of purchase. The
market capitalization range and the composition of the Russell 2500 Index are subject to change. The Fund’s investments in equity securities may include, to a lesser extent, securities of large capitalization companies.
The Fund uses a multi-manager approach, relying upon one or more sub-advisers (each, a Sub-Adviser and collectively, the Sub-Advisers) with differing investment philosophies to manage portions of the Fund’s portfolio under the general supervision of SEI Investments Management Corporation (SIMC or the Adviser). Each Sub-Adviser, in managing its portion of the Fund’s assets, generally applies a growth-oriented, a value-oriented or a blended approach to selecting investments. Growth-oriented managers generally select stocks they believe have attractive growth and appreciation potential in light of such characteristics as revenue and earnings growth, expectations from sell-side analysts and relative valuation, while value-oriented managers generally select stocks they believe are attractively valued in light of fundamental characteristics such as earnings, capital structure and/or return on invested capital.
The bar chart and the performance table below provide some indication of the risks of investing in the Fund by showing changes in the Fund’s performance from year to year for the past ten calendar years and by showing how the Fund’s average annual returns for 1, 5 and 10 years, and since the Fund’s inception compare with those of a broad measure of market performance. The performance information shown is based on full calendar years. The Fund’s past performance (before and after taxes) is not necessarily an indication of how the Fund will perform in the future. For current performance information, please call 1‑800-DIAL-SEI.
Best Quarter: 24.37% (6/30/20) Worst Quarter: ‑30.34% (3/31/20) The Fund’s total return from January 1, 2026 to June 30, 2026 was 16.37%. |
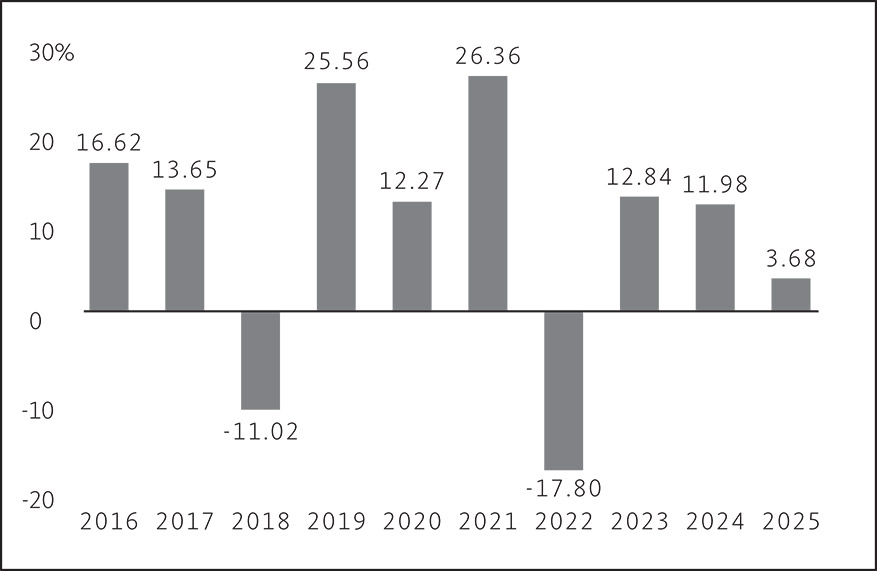
Best Quarter: 24.37% (6/30/20)
Worst Quarter: -30.34% (3/31/20)
The Fund's total return from January 1, 2026 to June 30, 2026 was 16.37%.
This table compares the Fund’s average annual total returns to those of a broad-based securities market index and an additional index with characteristics relevant to the Fund’s investment strategy.
After-tax returns are calculated using the historical highest individual federal marginal income tax rates and do not reflect the impact of state and local taxes. Your actual after-tax returns will depend on your tax situation and may differ from those shown. After-tax returns shown are not relevant to investors who hold their Fund shares through tax-deferred arrangements, such as 401(k) plans or individual retirement accounts.
Small/Mid Cap Equity Fund | 1 Year | 5 Years | 10 Years | Since | |||
Return Before Taxes | 3.68 | % | 6.35 | % | 8.50 | % | 8.26% |
Return After Taxes on Distributions | 1.90 | % | 3.63 | % | 5.75 | % | 6.06% |
Return After Taxes on Distributions and Sale of Fund Shares | 3.45 | % | 4.46 | % | 6.11 | % | 6.20% |
S&P 500 Index Return (reflects no deduction for fees, expenses or taxes) | 17.88 | % | 14.42 | % | 14.82 | % | 10.89% |
Russell 2500 Index Return (reflects no deduction for fees, expenses or taxes) | 11.91 | % | 7.26 | % | 10.40 | % | 9.50% |