The following bar chart and table provide an indication of the risks of investing in the Fund by showing changes in the Fund’s performance from year to year and by showing how the average annual total returns for the Fund compared to that of a broad-based securities market index. The Fund acquired all of the assets and liabilities of the Adaptive Growth Opportunities Fund, a series of Starboard Investment Trust (the “Trust”), (the “Predecessor Fund”) in a tax-free reorganization on May 7, 2021. In connection with this acquisition, shares of the Predecessor Fund’s Institutional Class shares, Class A shares, and Class C shares were exchanged for Shares. The Predecessor Fund had an investment objective and strategies that were, in all material respects, the same as those of the Fund, and was managed in a manner that, in all material respects, complied with the investment guidelines and restrictions of the Fund. The performance information set forth below reflects the historical performance of the Predecessor Fund shares. Prior to July 31, 2015, the Fund had a different investment advisor. The Fund changed its investment strategy effective June 9, 2023. The performance information set forth below does not reflect the Fund’s current strategy or ETF structure. The Fund’s past performance is not necessarily an indication of how the Fund will perform in the future. Updated performance information is available online at https://etfpages.com/AGOX.
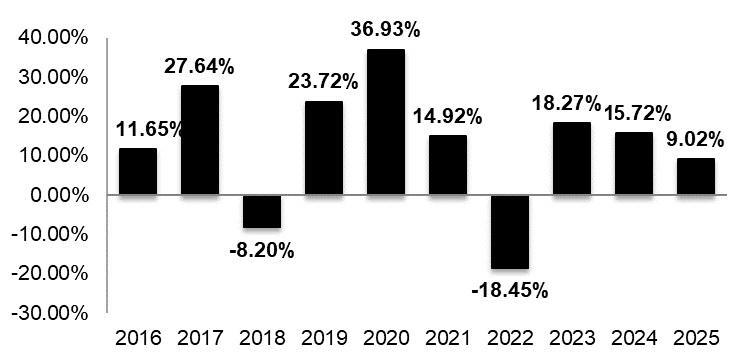
During the periods shown in the bar chart above the Fund’s highest quarterly return was 27.40% (quarter ended June 30, 2020) and lowest quarterly return was -15.95% (quarter ended March 31, 2020). The Fund’s year-to-date return as of June 30, 2026, was 21.82%.
| Average
Annual Total Returns Periods Ended December 31, 2025 |
Past
1 Year |
Past
5 |
Past 10 Years |
Since Inception (9/20/2012) |
| Adaptive
Alpha Opportunities ETF Before taxes After taxes on distributions After taxes on distributions and sale of shares |
9.02% 7.63% 5.34% |
6.93% 5.89% 5.02% |
11.97% 11.06% 9.55% |
10.77% 9.94% 8.70% |
| Average
Annual Total Returns Periods Ended December 31, 2025 |
Past
1 Year |
Past
5 |
Past 10 Years |
Since Inception (9/20/2012) |
| MSCI
ACWI Index (reflects no deductions for fees and expenses) |
22.87% | 11.70% | 12.27% | 11.22% |
Morningstar Moderate Aggressive Target Risk TR Index (reflects no deductions for fees and expenses) |
18.45% | 7.93% | 9.58% | 8.90% |
After-tax returns are calculated using the historical highest individual federal marginal income tax rates and do not reflect the impact of state and local taxes. Actual after-tax returns depend on an investor’s tax situation and may differ from those shown and are not applicable to investors who hold Shares through tax-deferred arrangements such as a 401(k) plan or an individual retirement account (IRA).
The following bar chart and table provide an indication of the risks of investing in the Fund by showing changes in the Fund’s performance from year to year and by showing how the average annual total returns compared to that of a broad-based securities market index. The Fund acquired all of the assets and liabilities of the Adaptive Hedged Multi-Asset Income Fund (formerly, Adaptive Hedged Income Fund), a series of Starboard Investment Trust (the “Trust”), (the “Predecessor Fund”) in a tax-free reorganization on November 12, 2021. In connection with this acquisition, shares of the Predecessor Fund’s Institutional Class shares, Class A shares, and Class C shares were exchanged for Shares. The Predecessor Fund had an investment objective and strategies that were, in all material respects, the same as those of the Fund, and was managed in a manner that, in all material respects, complied with the investment guidelines and restrictions of the Fund. The performance information set forth below reflects the historical performance of the Predecessor Fund’s Institutional Class shares. Prior to July 31, 2015, the Fund had a different investment advisor. The Fund changed its investment strategy and removed its sub-adviser effective October 1, 2020. The Fund changed its investment strategy effective June 9, 2023. The performance information set forth below does not reflect the Fund’s current strategy or ETF structure. The Fund’s past performance is not necessarily an indication of how the Fund will perform in the future. Updated performance information is available online at https://etfpages.com/AMAX.
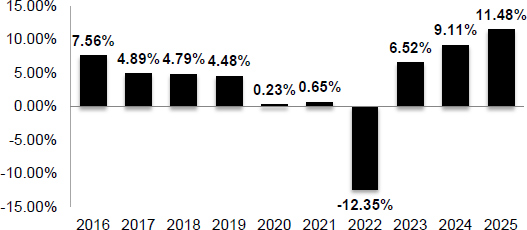
During the periods shown in the bar chart above, the Fund’s highest quarterly return was 8.96% (quarter ended June 30, 2025), and the Fund’s lowest quarterly return was -7.56% (quarter ended March 31, 2020). The Fund’s year-to-date return as of June 30, 2026, was 0.64%.
| Average
Annual Total Returns Periods Ended December 31, 2025 |
Past
1 Year |
Past 5 Years |
Past 10 Years |
Since Inception (10/02/2009) |
| Adaptive
Hedged Multi-Asset Income ETF Before taxes After taxes on distributions After taxes on distributions and sale of shares |
11.48% 7.38% 6.69% |
2.71% 0.93% 1.49% |
3.53% 2.07% 2.29% |
2.77% 1.57% 1.75% |
| Bloomberg
Capital U.S. Aggregate Bond Index (reflects no deductions for fees and expenses) |
7.30% | -0.36% | 2.01% | 2.63% |
After-tax returns are calculated using the historical highest individual federal marginal income tax rates and do not reflect the impact of state and local taxes. Actual after-tax returns depend on an investor’s tax situation and may differ from those shown and are not applicable to investors who hold Shares through tax-deferred arrangements such as a 401(k) plan or an individual retirement account (IRA).
The following bar chart and tables provide an indication of the risks of investing in the Fund by showing changes in the Fund’s performance from year to year and by showing how the average annual total returns for the Fund compared to that of a broad-based securities market index. The Fund acquired all of the assets and liabilities of the Adaptive Tactical Outlook Fund (formerly, Adaptive Tactical Economic Fund), a series of Starboard Investment Trust (the “Trust”), (the “Predecessor Fund”) in a tax-free reorganization on November 5, 2021. In connection with this acquisition, shares of the Predecessor Fund’s Institutional Class shares, Class A shares, and Class C shares were exchanged for Shares. The Predecessor Fund had an investment objective and strategies that were, in all material respects, the same as those of the Fund, and was managed in a manner that, in all material respects, complied with the investment guidelines and restrictions of the Fund. The performance information set forth below reflects the historical performance of the Predecessor Fund’s Institutional Class shares. Prior to July 31, 2015, the Fund had a different investment advisor. The Fund changed its investment strategy effective June 9, 2023. The performance information set forth below does not reflect the Fund’s current strategy or ETF structure. The Fund’s past performance is not necessarily an indication of how the Fund will perform in the future. Updated performance information is available online at https://etfpages.com/RHTX.
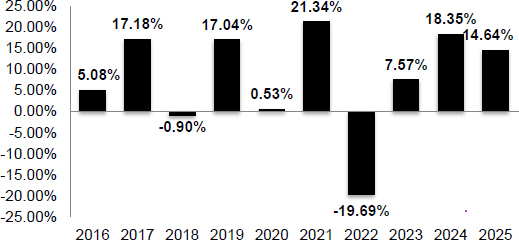
During the periods shown in the bar chart above, the Fund’s highest quarterly return was 11.55% (quarter ended December 31, 2020), and the Fund’s lowest quarterly return was -20.67% (quarter ended March 31, 2020). The Fund’s year-to-date return as of June 30, 2026, was 6.28%.
| Average
Annual Total Returns Periods Ended December 31, 2025 |
Past
1 Year |
Past 5 Years |
Past 10 Years |
Since Inception (9/20/2012) |
| RH
Tactical Outlook ETF Before taxes After taxes on distributions After taxes on distributions and sale of shares |
14.64% 14.64% 8.66% |
7.29% 7.29% 5.73% |
7.28% 6.67% 5.59% |
7.13% 6.36% 5.45% |
| Average
Annual Total Returns Periods Ended December 31, 2025 |
Past
1 Year |
Past 5 Years |
Past 10 Years |
Since Inception (9/20/2012) |
| CRSP
US Total Market Index (reflects no deductions for fees and expenses) |
15.71% | 11.51% | 12.39% | -- |
Morningstar Moderate Aggressive Target Risk TR Index (reflects no deductions for fees and expenses) |
18.45% | 7.93% | 9.58% | 8.90% |
After-tax returns are calculated using the historical highest individual federal marginal income tax rates and do not reflect the impact of state and local taxes. Actual after-tax returns depend on an investor’s tax situation and may differ from those shown and are not applicable to investors who hold Shares through tax-deferred arrangements such as a 401(k) plan or an individual retirement account (IRA). After-tax returns are shown for only one class of Shares and after-tax returns will vary for other classes.
The following bar chart and table provide an indication of the risks of investing in the Fund by showing changes in the Fund’s performance from year to year and by showing how the average annual total returns compared to that of a broad-based securities market index. The Fund acquired all of the assets and liabilities of the Adaptive Tactical Rotation Fund, a series of Starboard Investment Trust (the “Trust”), (the “Predecessor Fund”) in a tax-free reorganization on November 5, 2021. In connection with this acquisition, shares of the Predecessor Fund’s Institutional Class shares, Class A shares, and Class C shares were exchanged for Shares. The Predecessor Fund had an investment objective and strategies that were, in all material respects, the same as those of the Fund, and was managed in a manner that, in all material respects, complied with the investment guidelines and restrictions of the Fund. The performance information set forth below reflects the historical performance of the Predecessor Fund’s Institutional Class shares. Prior to July 31, 2015, the Fund had a different investment advisor. The Fund changed its investment strategy effective October 1, 2022. The Fund changed its investment strategy effective June 9, 2023. The Fund changed its investment strategy effective October 1, 2024. The performance information set forth below does not reflect the Fund’s current strategy or ETF structure. The Fund’s past performance is not necessarily an indication of how the Fund will perform in the future. Updated performance information is available online at https://etfpages.com/RHRX.
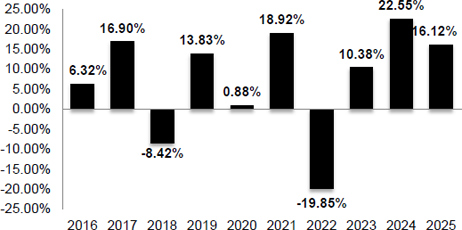
During the periods shown in the bar chart above, the Fund’s highest quarterly return was 12.38% (quarter ended March 31, 2024) and the Fund’s lowest quarterly return was -19.76% (quarter ended March 31, 2020). The Fund’s year-to-date return as of June 30, 2026, was 20.58%.
| Average
Annual Total Returns Periods Ended December 31, 2025 |
Past
1 Year |
Past 5 Years |
10 Years |
Since Inception (09/20/2012) |
| Adaptive
Tactical Rotation ETF Before taxes After taxes on distributions After taxes on distributions and sale of shares |
16.12% 9.54% |
8.40% 8.40% 6.63% |
6.94% 6.49% 5.45% |
7.17% 6.38% 5.49% |
| Average
Annual Total Returns Periods Ended December 31, 2025 |
Past
1 Year |
Past 5 Years |
10 Years |
Since Inception (09/20/2012) |
| S&P
500 TR Index (reflects no deductions for fees and expenses) |
17.88% | 14.42% | 14.81% | 14.40% |
Morningstar Moderate Aggressive Target Risk TR Index (reflects no deductions for fees and expenses) |
18.45% | 7.93% | 9.58% | 8.90% |
After-tax returns are calculated using the historical highest individual federal marginal income tax rates and do not reflect the impact of state and local taxes. Actual after-tax returns depend on an investor’s tax situation and may differ from those shown and are not applicable to investors who hold Shares through tax-deferred arrangements such as a 401(k) plan or an individual retirement account (IRA).