Shareholder Report
Jul. 31, 2026
USD ($)
Holding
What were the Fund expenses for the last year?
(Based on a hypothetical $10,000 investment)
| Fund (Class) | Costs of $10,000 investment | Costs paid as a percentage of a $10,000 investment |
| Davis New York Venture Fund (Class Y) |
$77 | 0.67% |
Management’s Discussion of Fund Performance
Summary of Results
The Fund outperformed the Standard & Poor’s 500 Index (“S&P 500” or the “Index”) for the period. The Fund’s Class Y shares delivered a total return of 30.82%, versus a 19.56% return for the S&P 500. The Fund invests principally in common stocks (including American Depositary Receipts) issued by large companies with market capitalizations of at least $10 billion. The Fund continues to invest a significant portion of its assets in financial services and foreign companies.
Market Overview
-
S&P 500
-
Strongest performing sectors - Energy (+41%), Health Care (+27%), and Information Technology (+26%)
-
Weakest performing sectors - Utilities (+6%), Consumer Discretionary (+8%), and Consumer Staples (+10%)
-
Contributors to Performance
-
Information Technology - significantly outperformed the Index sector (+168% vs +26%)
-
Samsung Electronics (+262%) and Applied Materials (+167%) - two largest individual contributors
-
Texas Instruments (+56%)
-
Applied Materials - no longer a Fund holding
-
-
Health Care - outperformed the Index sector (+59% vs +27%) and overweight (average weighting 14% vs 9%)
-
Viatris (+109%) and CVS Health (+73%)
-
-
Financials - outperformed the Index sector (+17% vs +11%)
-
U.S. Bancorp (+46%) and Danske Bank (+58%)
-
-
Overweight in Energy (average weighting 7% vs 3%), the strongest performing sector of the Index
-
Devon Energy (+33%) - completed merger with Coterra in May 2026 and includes Coterra performance prior to merger
-
-
Individual holdings
-
Alphabet (+86%) and Teck Resources (+87%)
-
Detractors from Performance
-
Communication Services - underperformed the Index sector (flat vs +19%)
-
Meta Platforms (-28%) and Pinterest (-38%) - two largest individual detractors
-
Angi (-65%)
-
-
Significantly underweight in Information Technology (average weighting 11% vs 35%), a stronger performing sector of the Index
-
Overweight in Financials (average weighting 30% vs 13%)
-
Markel Group (-6%) and Capital One Financial (-1%)
-
-
Industrials - underperformed the Index sector (-13% vs +20%)
-
DiDi Global (-30%) and AGCO (-13%)
-
-
Energy - underperformed the Index sector (+27% vs +41%)
-
Individual Consumer Discretionary holdings
-
Prosus (-20%), Trip.com Group (-24%), and Naspers (-16%)
-
Fund Performance
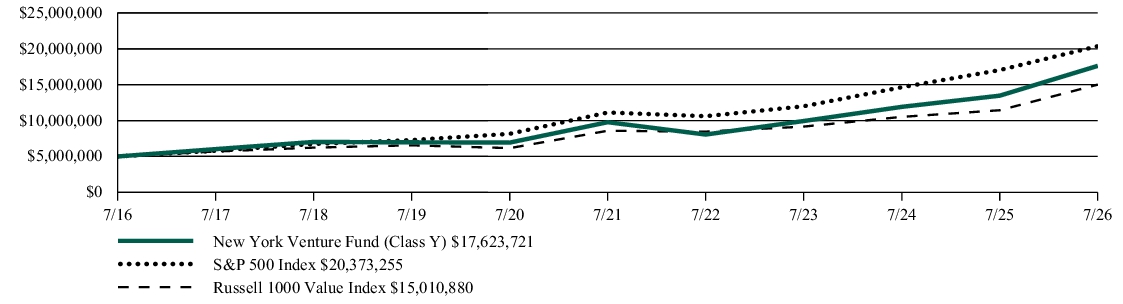
The following graph compares the initial and subsequent account values of a $5,000,000 investment in the Fund, the S&P 500 Index, and the Russell 1000 Value Index over 10 fiscal years for an investment made on July 31, 2016.
GROWTH OF $5,000,000
| AVERAGE ANNUAL TOTAL RETURN FOR PERIODS ENDED 07/31/26 | 1 Year | 5 Years | 10 Years |
| Davis New York Venture Fund (Class Y) | 30.82% | 12.50% | 13.42% |
| S&P 500 Index | 19.56% | 12.85% | 15.07% |
| Russell 1000 Value Index | 31.19% | 11.82% | 11.61% |
Key Fund Statistics
| Fund net assets as of 07/31/26 (in billions) | $7.7 |
| Total number of portfolio holdings as of 07/31/26 | 46 |
| Portfolio turnover rate for the period | 18% |
| Total advisory fees paid for the period (in millions) | $38.2 |
Top Sectors as of 07/31/26 Net Assets
| Financials | 27.07% |
| Health Care | 17.40% |
| Consumer Discretionary | 12.88% |
| Communication Services | 9.69% |
| Information Technology | 8.60% |
What were the Fund expenses for the last year?
(Based on a hypothetical $10,000 investment)
| Fund (Class) | Costs of $10,000 investment | Costs paid as a percentage of a $10,000 investment |
| Davis New York Venture Fund (Class R) |
$138 | 1.20% |
Management’s Discussion of Fund Performance
Summary of Results
The Fund outperformed the Standard & Poor’s 500 Index (“S&P 500” or the “Index”) for the period. The Fund’s Class R shares delivered a total return of 30.15%, versus a 19.56% return for the S&P 500. The Fund invests principally in common stocks (including American Depositary Receipts) issued by large companies with market capitalizations of at least $10 billion. The Fund continues to invest a significant portion of its assets in financial services and foreign companies.
Market Overview
-
S&P 500
-
Strongest performing sectors - Energy (+41%), Health Care (+27%), and Information Technology (+26%)
-
Weakest performing sectors - Utilities (+6%), Consumer Discretionary (+8%), and Consumer Staples (+10%)
-
Contributors to Performance
-
Information Technology - significantly outperformed the Index sector (+168% vs +26%)
-
Samsung Electronics (+262%) and Applied Materials (+167%) - two largest individual contributors
-
Texas Instruments (+56%)
-
Applied Materials - no longer a Fund holding
-
-
Health Care - outperformed the Index sector (+59% vs +27%) and overweight (average weighting 14% vs 9%)
-
Viatris (+109%) and CVS Health (+73%)
-
-
Financials - outperformed the Index sector (+17% vs +11%)
-
U.S. Bancorp (+46%) and Danske Bank (+58%)
-
-
Overweight in Energy (average weighting 7% vs 3%), the strongest performing sector of the Index
-
Devon Energy (+33%) - completed merger with Coterra in May 2026 and includes Coterra performance prior to merger
-
-
Individual holdings
-
Alphabet (+86%) and Teck Resources (+87%)
-
Detractors from Performance
-
Communication Services - underperformed the Index sector (flat vs +19%)
-
Meta Platforms (-28%) and Pinterest (-38%) - two largest individual detractors
-
Angi (-65%)
-
-
Significantly underweight in Information Technology (average weighting 11% vs 35%), a stronger performing sector of the Index
-
Overweight in Financials (average weighting 30% vs 13%)
-
Markel Group (-6%) and Capital One Financial (-1%)
-
-
Industrials - underperformed the Index sector (-13% vs +20%)
-
DiDi Global (-30%) and AGCO (-13%)
-
-
Energy - underperformed the Index sector (+27% vs +41%)
-
Individual Consumer Discretionary holdings
-
Prosus (-20%), Trip.com Group (-24%), and Naspers (-16%)
-
Fund Performance
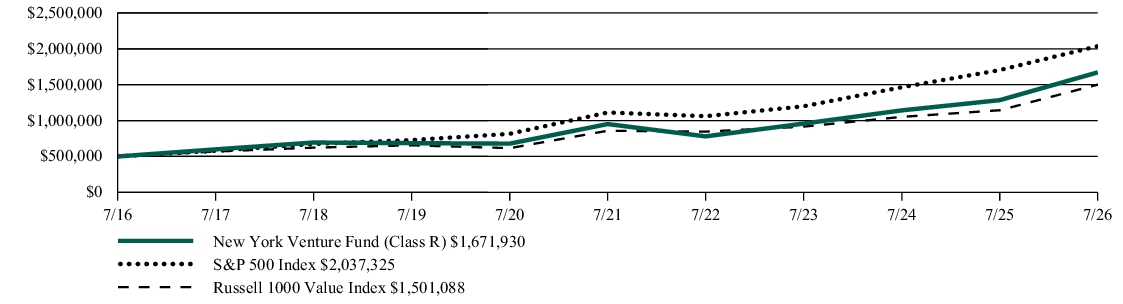
The following graph compares the initial and subsequent account values of a $500,000 investment in the Fund, the S&P 500 Index, and the Russell 1000 Value Index over 10 fiscal years for an investment made on July 31, 2016.
GROWTH OF $500,000
| AVERAGE ANNUAL TOTAL RETURN FOR PERIODS ENDED 07/31/26 | 1 Year | 5 Years | 10 Years |
| Davis New York Venture Fund (Class R) | 30.15% | 11.93% | 12.82% |
| S&P 500 Index | 19.56% | 12.85% | 15.07% |
| Russell 1000 Value Index | 31.19% | 11.82% | 11.61% |
Key Fund Statistics
| Fund net assets as of 07/31/26 (in billions) | $7.7 |
| Total number of portfolio holdings as of 07/31/26 | 46 |
| Portfolio turnover rate for the period | 18% |
| Total advisory fees paid for the period (in millions) | $38.2 |
Top Sectors as of 07/31/26 Net Assets
| Financials | 27.07% |
| Health Care | 17.40% |
| Consumer Discretionary | 12.88% |
| Communication Services | 9.69% |
| Information Technology | 8.60% |
What were the Fund expenses for the last year?
(Based on a hypothetical $10,000 investment)
| Fund (Class) | Costs of $10,000 investment | Costs paid as a percentage of a $10,000 investment |
| Davis New York Venture Fund (Class C) |
$200 | 1.74% |
Management’s Discussion of Fund Performance
Summary of Results
The Fund outperformed the Standard & Poor’s 500 Index (“S&P 500” or the “Index”) for the period. The Fund’s Class C shares delivered a total return on net asset value of 29.45%, versus a 19.56% return for the S&P 500. The Fund invests principally in common stocks (including American Depositary Receipts) issued by large companies with market capitalizations of at least $10 billion. The Fund continues to invest a significant portion of its assets in financial services and foreign companies.
Market Overview
-
S&P 500
-
Strongest performing sectors - Energy (+41%), Health Care (+27%), and Information Technology (+26%)
-
Weakest performing sectors - Utilities (+6%), Consumer Discretionary (+8%), and Consumer Staples (+10%)
-
Contributors to Performance
-
Information Technology - significantly outperformed the Index sector (+168% vs +26%)
-
Samsung Electronics (+262%) and Applied Materials (+167%) - two largest individual contributors
-
Texas Instruments (+56%)
-
Applied Materials - no longer a Fund holding
-
-
Health Care - outperformed the Index sector (+59% vs +27%) and overweight (average weighting 14% vs 9%)
-
Viatris (+109%) and CVS Health (+73%)
-
-
Financials - outperformed the Index sector (+17% vs +11%)
-
U.S. Bancorp (+46%) and Danske Bank (+58%)
-
-
Overweight in Energy (average weighting 7% vs 3%), the strongest performing sector of the Index
-
Devon Energy (+33%) - completed merger with Coterra in May 2026 and includes Coterra performance prior to merger
-
-
Individual holdings
-
Alphabet (+86%) and Teck Resources (+87%)
-
Detractors from Performance
-
Communication Services - underperformed the Index sector (flat vs +19%)
-
Meta Platforms (-28%) and Pinterest (-38%) - two largest individual detractors
-
Angi (-65%)
-
-
Significantly underweight in Information Technology (average weighting 11% vs 35%), a stronger performing sector of the Index
-
Overweight in Financials (average weighting 30% vs 13%)
-
Markel Group (-6%) and Capital One Financial (-1%)
-
-
Industrials - underperformed the Index sector (-13% vs +20%)
-
DiDi Global (-30%) and AGCO (-13%)
-
-
Energy - underperformed the Index sector (+27% vs +41%)
-
Individual Consumer Discretionary holdings
-
Prosus (-20%), Trip.com Group (-24%), and Naspers (-16%)
-
Fund Performance
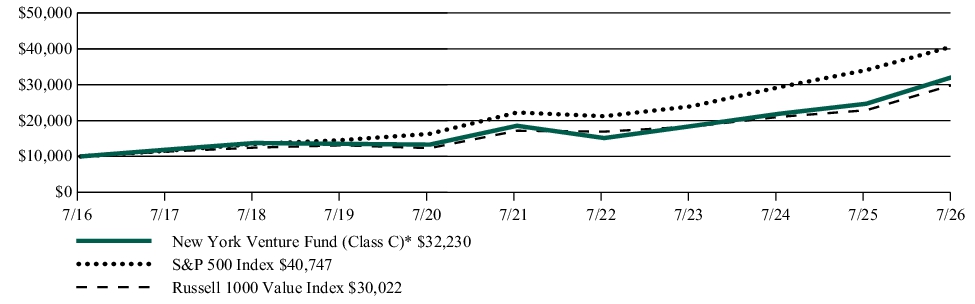
The following graph compares the initial and subsequent account values of a $10,000 investment in the Fund, the S&P 500 Index, and the Russell 1000 Value Index over 10 fiscal years for an investment made on July 31, 2016.
GROWTH OF $10,000
| AVERAGE ANNUAL TOTAL RETURN FOR PERIODS ENDED 07/31/26 | 1 Year | 5 Years | 10 Years |
| Davis New York Venture Fund (Class C) — Without CDSC* | 29.45% | 11.30% | 12.41% |
| Davis New York Venture Fund (Class C) — With CDSC*,** | 28.45% | 11.30% | 12.41% |
| S&P 500 Index | 19.56% | 12.85% | 15.07% |
| Russell 1000 Value Index | 31.19% | 11.82% | 11.61% |
|
*
|
Because Class C shares automatically convert to Class A shares after 8 years, the “10-Year” returns for Class C reflect Class A performance for the period after conversion.
|
|
**
|
Includes any applicable contingent deferred sales charge (“CDSC”).
|
Key Fund Statistics
| Fund net assets as of 07/31/26 (in billions) | $7.7 |
| Total number of portfolio holdings as of 07/31/26 | 46 |
| Portfolio turnover rate for the period | 18% |
| Total advisory fees paid for the period (in millions) | $38.2 |
Top Sectors as of 07/31/26 Net Assets
| Financials | 27.07% |
| Health Care | 17.40% |
| Consumer Discretionary | 12.88% |
| Communication Services | 9.69% |
| Information Technology | 8.60% |
What were the Fund expenses for the last year?
(Based on a hypothetical $10,000 investment)
| Fund (Class) | Costs of $10,000 investment | Costs paid as a percentage of a $10,000 investment |
| Davis New York Venture Fund (Class A) |
$104 | 0.90% |
Management’s Discussion of Fund Performance
Summary of Results
The Fund outperformed the Standard & Poor’s 500 Index (“S&P 500” or the “Index”) for the period. The Fund’s Class A shares delivered a total return on net asset value of 30.53%, versus a 19.56% return for the S&P 500. The Fund invests principally in common stocks (including American Depositary Receipts) issued by large companies with market capitalizations of at least $10 billion. The Fund continues to invest a significant portion of its assets in financial services and foreign companies.
Market Overview
-
S&P 500
-
Strongest performing sectors - Energy (+41%), Health Care (+27%), and Information Technology (+26%)
-
Weakest performing sectors - Utilities (+6%), Consumer Discretionary (+8%), and Consumer Staples (+10%)
-
Contributors to Performance
-
Information Technology - significantly outperformed the Index sector (+168% vs +26%)
-
Samsung Electronics (+262%) and Applied Materials (+167%) - two largest individual contributors
-
Texas Instruments (+56%)
-
Applied Materials - no longer a Fund holding
-
-
Health Care - outperformed the Index sector (+59% vs +27%) and overweight (average weighting 14% vs 9%)
-
Viatris (+109%) and CVS Health (+73%)
-
-
Financials - outperformed the Index sector (+17% vs +11%)
-
U.S. Bancorp (+46%) and Danske Bank (+58%)
-
-
Overweight in Energy (average weighting 7% vs 3%), the strongest performing sector of the Index
-
Devon Energy (+33%) - completed merger with Coterra in May 2026 and includes Coterra performance prior to merger
-
-
Individual holdings
-
Alphabet (+86%) and Teck Resources (+87%)
-
Detractors from Performance
-
Communication Services - underperformed the Index sector (flat vs +19%)
-
Meta Platforms (-28%) and Pinterest (-38%) - two largest individual detractors
-
Angi (-65%)
-
-
Significantly underweight in Information Technology (average weighting 11% vs 35%), a stronger performing sector of the Index
-
Overweight in Financials (average weighting 30% vs 13%)
-
Markel Group (-6%) and Capital One Financial (-1%)
-
-
Industrials - underperformed the Index sector (-13% vs +20%)
-
DiDi Global (-30%) and AGCO (-13%)
-
-
Energy - underperformed the Index sector (+27% vs +41%)
-
Individual Consumer Discretionary holdings
-
Prosus (-20%), Trip.com Group (-24%), and Naspers (-16%)
-
Fund Performance
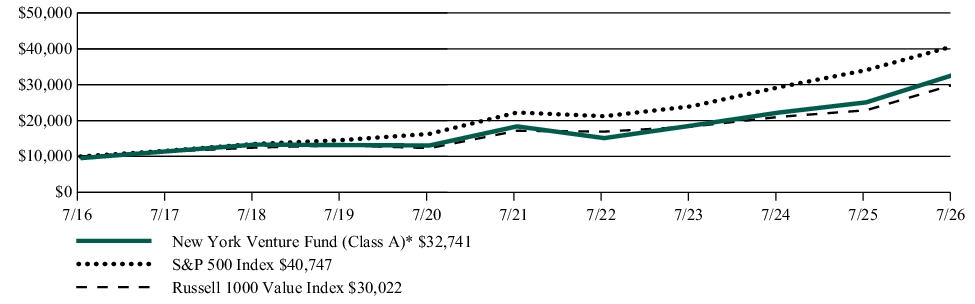
The following graph compares the initial and subsequent account values of a $10,000 investment in the Fund, the S&P 500 Index, and the Russell 1000 Value Index over 10 fiscal years for an investment made on July 31, 2016.
GROWTH OF $10,000
|
* |
Reflects 4.75% front-end sales charge. |
| AVERAGE ANNUAL TOTAL RETURN FOR PERIODS ENDED 07/31/26 | 1 Year | 5 Years | 10 Years |
| Davis New York Venture Fund (Class A) — Without sales charge | 30.53% | 12.23% | 13.13% |
| Davis New York Venture Fund (Class A) — With sales charge* | 24.33% | 11.15% | 12.59% |
| S&P 500 Index | 19.56% | 12.85% | 15.07% |
| Russell 1000 Value Index | 31.19% | 11.82% | 11.61% |
|
* |
Reflects 4.75% front-end sales charge. |
Key Fund Statistics
| Fund net assets as of 07/31/26 (in billions) | $7.7 |
| Total number of portfolio holdings as of 07/31/26 | 46 |
| Portfolio turnover rate for the period | 18% |
| Total advisory fees paid for the period (in millions) | $38.2 |
Top Sectors as of 07/31/26 Net Assets
| Financials | 27.07% |
| Health Care | 17.40% |
| Consumer Discretionary | 12.88% |
| Communication Services | 9.69% |
| Information Technology | 8.60% |