Shareholder Report
Jul. 31, 2026
USD ($)
$ / shares
WHAT WERE THE FUND COSTS FOR THE LAST YEAR? (based on a hypothetical $10,000 investment)
|
Class Name
|
Costs of a $10,000 investment
|
Costs paid as a percentage of a $10,000 investment
|
|
Class A
|
$92
|
0.86%
|
HOW DID THE FUND PERFORM LAST YEAR AND WHAT AFFECTED ITS PERFORMANCE?
For the twelve months ended July 31, 2026, Class A shares of George Putnam Balanced Fund returned 15.02%. The Fund compares its performance to the George Putnam Blended Index†, which returned 12.72% for the same period.
PERFORMANCE HIGHLIGHTS
|
Top contributors to performance:
|
|
|
↑
|
Overweight position in Marvell Technology, a semiconductor company.
|
|
↑
|
Overweight position in Lam Research, a semiconductor equipment company.
|
|
↑
|
In fixed income, overweight in investment-grade corporate credit, security selection in Carnival Corp and Meta, and certain issuers in the banking sector.
|
|
Top detractors from performance:
|
|
|
↓
|
Underweight position in Micron Technology, a memory chip company.
|
|
↓
|
Overweight position in Microsoft, a software company.
|
|
↓
|
In fixed income, overweight in FMC, a chemicals company that was downgraded to high yield.
|
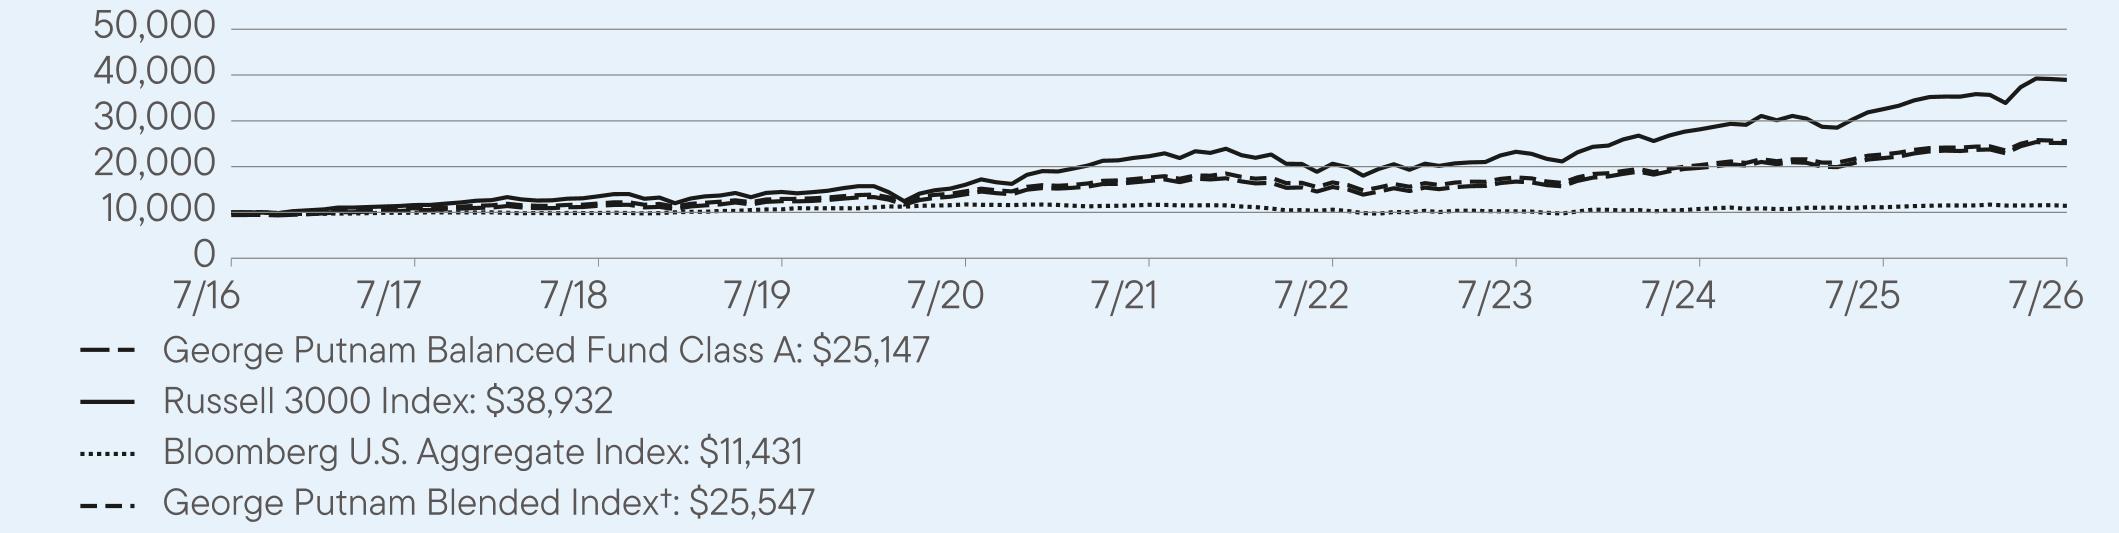
AVERAGE ANNUAL TOTAL RETURNS (%) Period Ended July 31, 2026
|
|
1 Year
|
5 Year
|
10 Year
|
|
Class A
|
15.02
|
8.31
|
10.31
|
|
Class A (with sales charge)
|
8.40
|
7.04
|
9.66
|
|
Russell 3000 Index
|
19.60
|
11.82
|
14.56
|
|
Bloomberg U.S. Aggregate Index
|
2.71
|
-0.40
|
1.35
|
|
George Putnam Blended Index†
|
12.72
|
7.73
|
9.83
|
For current month-end performance, please call Franklin Templeton at (800) 225-1581 or visit
https://www.franklintempleton.com/investments/options/mutual-funds.
https://www.franklintempleton.com/investments/options/mutual-funds.
Important data provider notices and terms available at www.franklintempletondatasources.com.
KEY FUND STATISTICS (as of July 31, 2026)
|
Total Net Assets
|
$2,395,526,534
|
|
Total Number of Portfolio Holdings (excludes derivatives, except purchased options, if any)
|
770
|
|
Total Management Fee Paid
|
$11,248,225
|
|
Portfolio Turnover Rate
|
104%
|
WHAT DID THE FUND INVEST IN? (as of July 31, 2026)
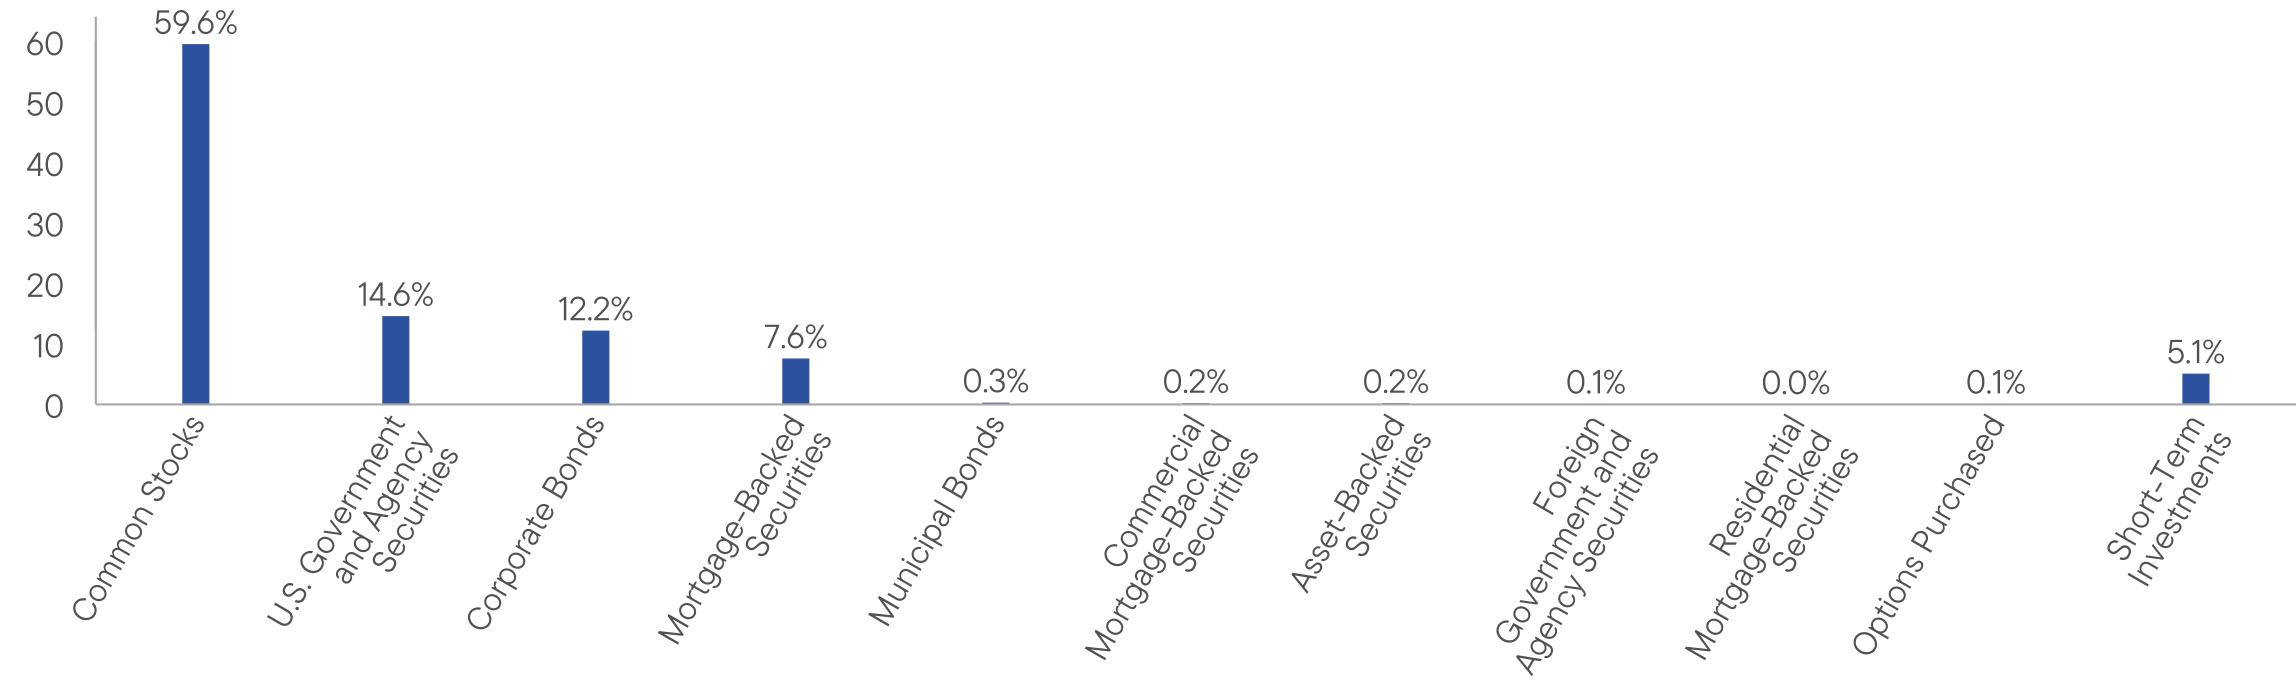
Portfolio Composition*,† (% of Total Investments)
WHAT WERE THE FUND COSTS FOR THE LAST YEAR? (based on a hypothetical $10,000 investment)
|
Class Name
|
Costs of a $10,000 investment
|
Costs paid as a percentage of a $10,000 investment
|
|
Class C
|
$172
|
1.61%
|
HOW DID THE FUND PERFORM LAST YEAR AND WHAT AFFECTED ITS PERFORMANCE?
For the twelve months ended July 31, 2026, Class C shares of George Putnam Balanced Fund returned 14.15%. The Fund compares its performance to the George Putnam Blended Index†, which returned 12.72% for the same period.
PERFORMANCE HIGHLIGHTS
|
Top contributors to performance:
|
|
|
↑
|
Overweight position in Marvell Technology, a semiconductor company.
|
|
↑
|
Overweight position in Lam Research, a semiconductor equipment company.
|
|
↑
|
In fixed income, overweight in investment-grade corporate credit, security selection in Carnival Corp and Meta, and certain issuers in the banking sector.
|
|
Top detractors from performance:
|
|
|
↓
|
Underweight position in Micron Technology, a memory chip company.
|
|
↓
|
Overweight position in Microsoft, a software company.
|
|
↓
|
In fixed income, overweight in FMC, a chemicals company that was downgraded to high yield.
|
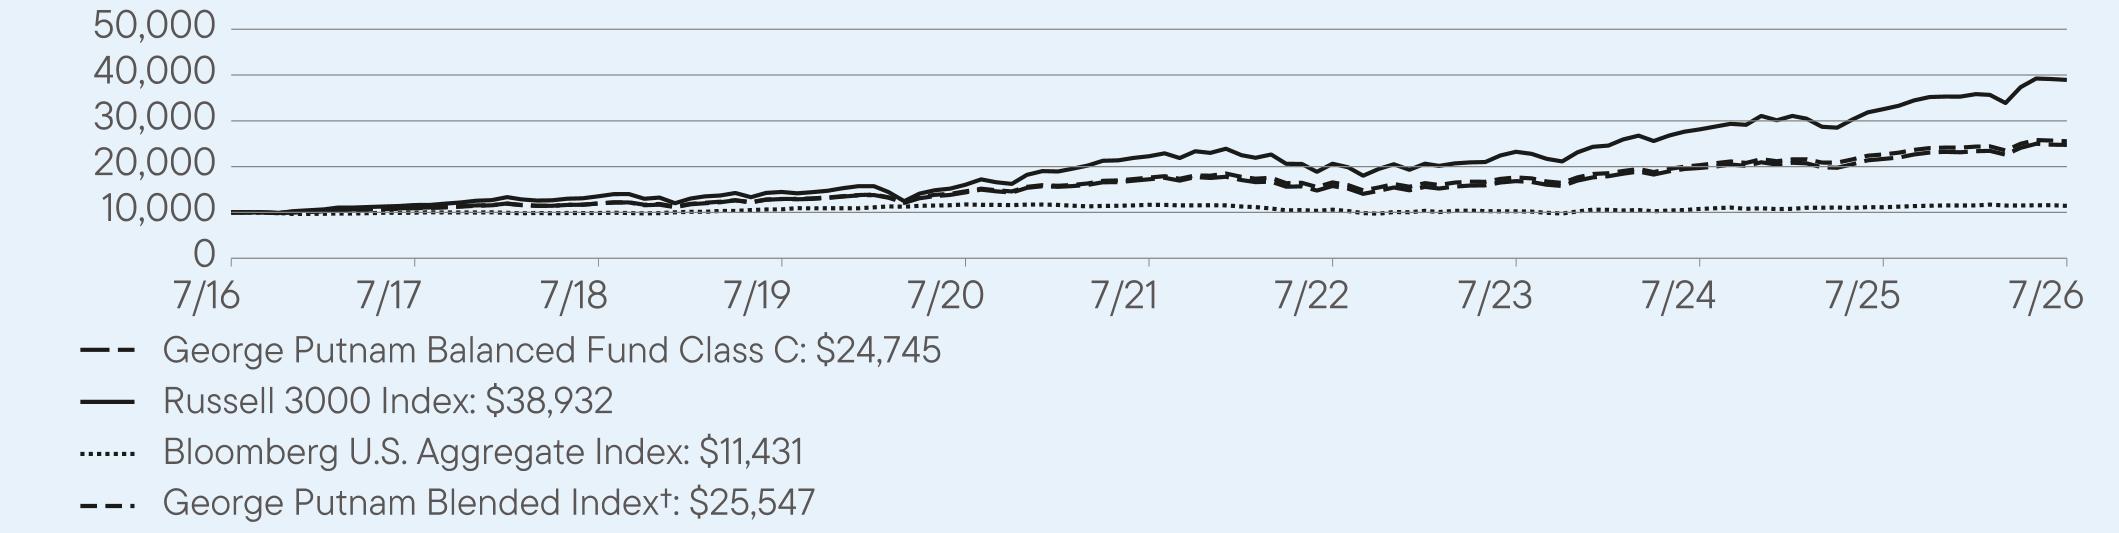
AVERAGE ANNUAL TOTAL RETURNS (%) Period Ended July 31, 2026
|
|
1 Year
|
5 Year
|
10 Year
|
|
Class C
|
14.15
|
7.50
|
9.64
|
|
Class C (with sales charge)
|
13.15
|
7.50
|
9.64
|
|
Russell 3000 Index
|
19.60
|
11.82
|
14.56
|
|
Bloomberg U.S. Aggregate Index
|
2.71
|
-0.40
|
1.35
|
|
George Putnam Blended Index†
|
12.72
|
7.73
|
9.83
|
For current month-end performance, please call Franklin Templeton at (800) 225-1581 or visit
https://www.franklintempleton.com/investments/options/mutual-funds.
https://www.franklintempleton.com/investments/options/mutual-funds.
Important data provider notices and terms available at www.franklintempletondatasources.com.
KEY FUND STATISTICS (as of July 31, 2026)
|
Total Net Assets
|
$2,395,526,534
|
|
Total Number of Portfolio Holdings (excludes derivatives, except purchased options, if any)
|
770
|
|
Total Management Fee Paid
|
$11,248,225
|
|
Portfolio Turnover Rate
|
104%
|
WHAT DID THE FUND INVEST IN? (as of July 31, 2026)
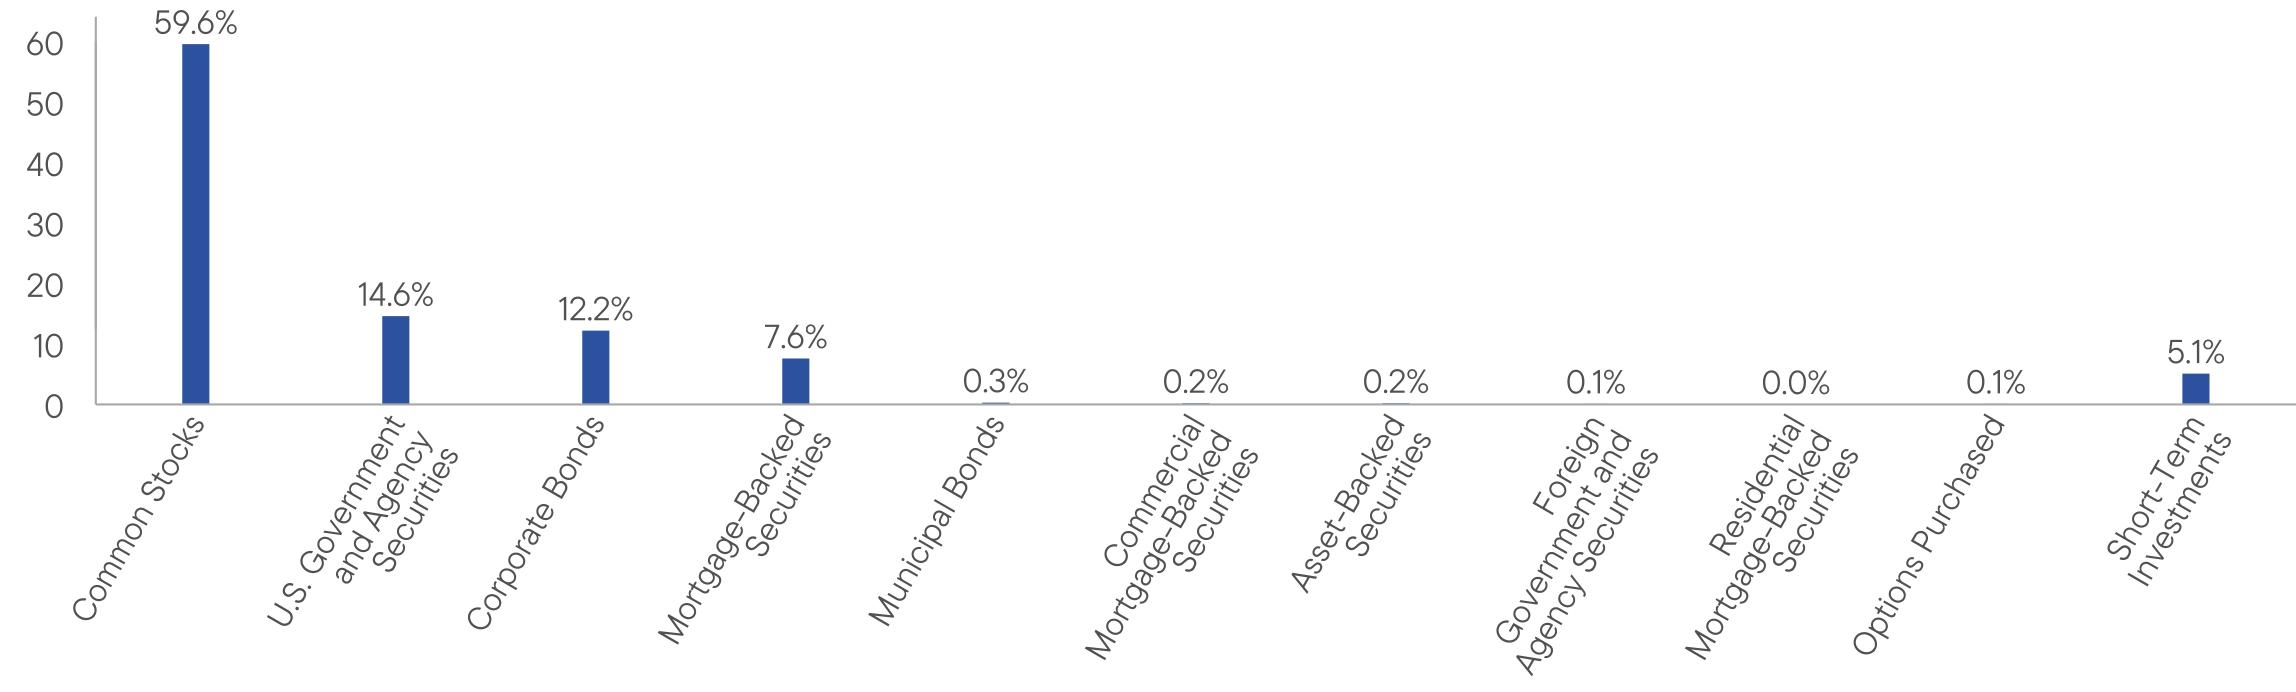
Portfolio Composition*,† (% of Total Investments)
WHAT WERE THE FUND COSTS FOR THE LAST YEAR? (based on a hypothetical $10,000 investment)
|
Class Name
|
Costs of a $10,000 investment
|
Costs paid as a percentage of a $10,000 investment
|
|
Class M
|
$146
|
1.36%
|
HOW DID THE FUND PERFORM LAST YEAR AND WHAT AFFECTED ITS PERFORMANCE?
For the twelve months ended July 31, 2026, Class M shares of George Putnam Balanced Fund returned 14.41%. The Fund compares its performance to the George Putnam Blended Index†, which returned 12.72% for the same period.
PERFORMANCE HIGHLIGHTS
|
Top contributors to performance:
|
|
|
↑
|
Overweight position in Marvell Technology, a semiconductor company.
|
|
↑
|
Overweight position in Lam Research, a semiconductor equipment company.
|
|
↑
|
In fixed income, overweight in investment-grade corporate credit, security selection in Carnival Corp and Meta, and certain issuers in the banking sector.
|
|
Top detractors from performance:
|
|
|
↓
|
Underweight position in Micron Technology, a memory chip company.
|
|
↓
|
Overweight position in Microsoft, a software company.
|
|
↓
|
In fixed income, overweight in FMC, a chemicals company that was downgraded to high yield.
|
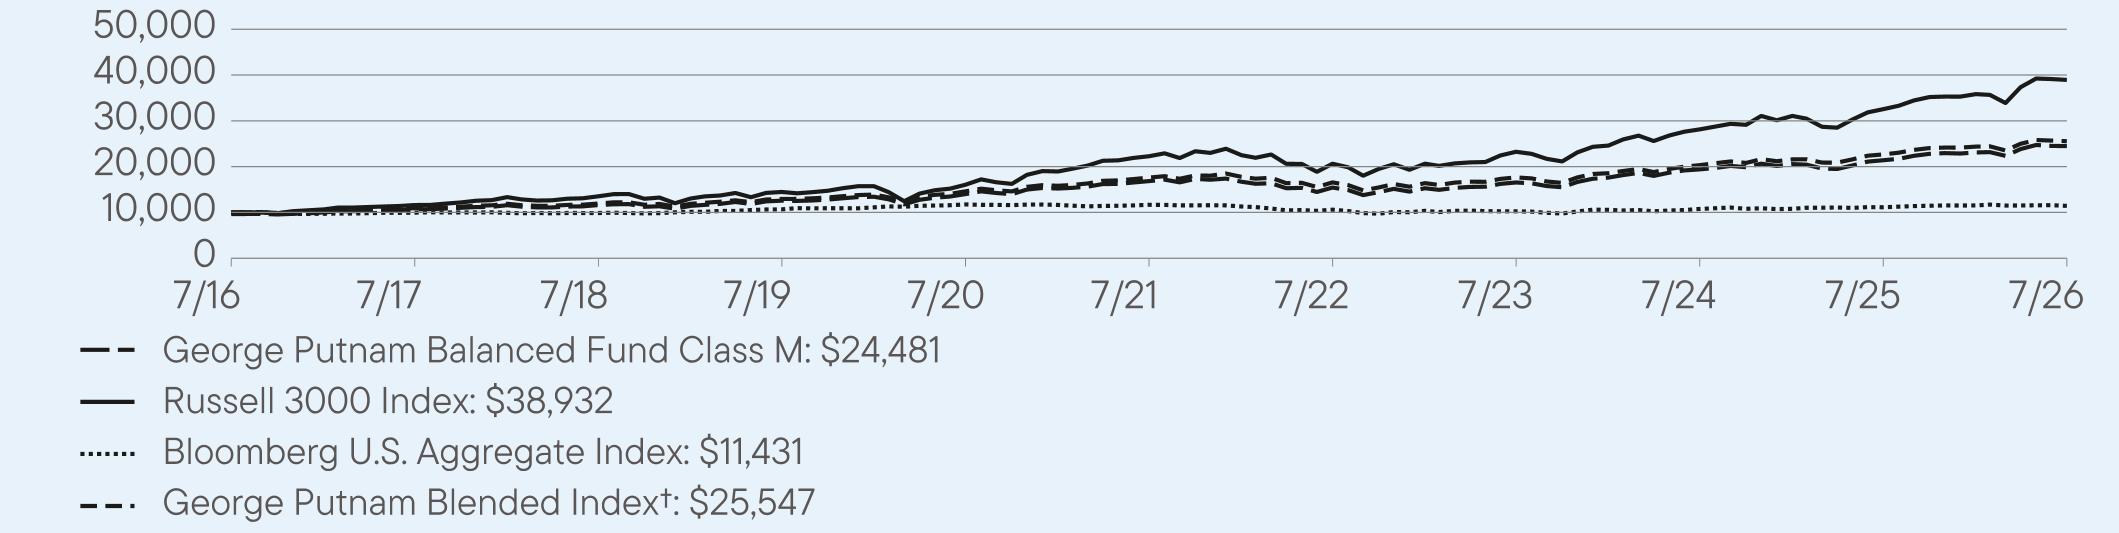
AVERAGE ANNUAL TOTAL RETURNS (%) Period Ended July 31, 2026
|
|
1 Year
|
5 Year
|
10 Year
|
|
Class M
|
14.41
|
7.77
|
9.76
|
|
Class M (with sales charge)
|
10.41
|
7.01
|
9.37
|
|
Russell 3000 Index
|
19.60
|
11.82
|
14.56
|
|
Bloomberg U.S. Aggregate Index
|
2.71
|
-0.40
|
1.35
|
|
George Putnam Blended Index†
|
12.72
|
7.73
|
9.83
|
For current month-end performance, please call Franklin Templeton at (800) 225-1581 or visit
https://www.franklintempleton.com/investments/options/mutual-funds.
https://www.franklintempleton.com/investments/options/mutual-funds.
Important data provider notices and terms available at www.franklintempletondatasources.com.
KEY FUND STATISTICS (as of July 31, 2026)
|
Total Net Assets
|
$2,395,526,534
|
|
Total Number of Portfolio Holdings (excludes derivatives, except purchased options, if any)
|
770
|
|
Total Management Fee Paid
|
$11,248,225
|
|
Portfolio Turnover Rate
|
104%
|
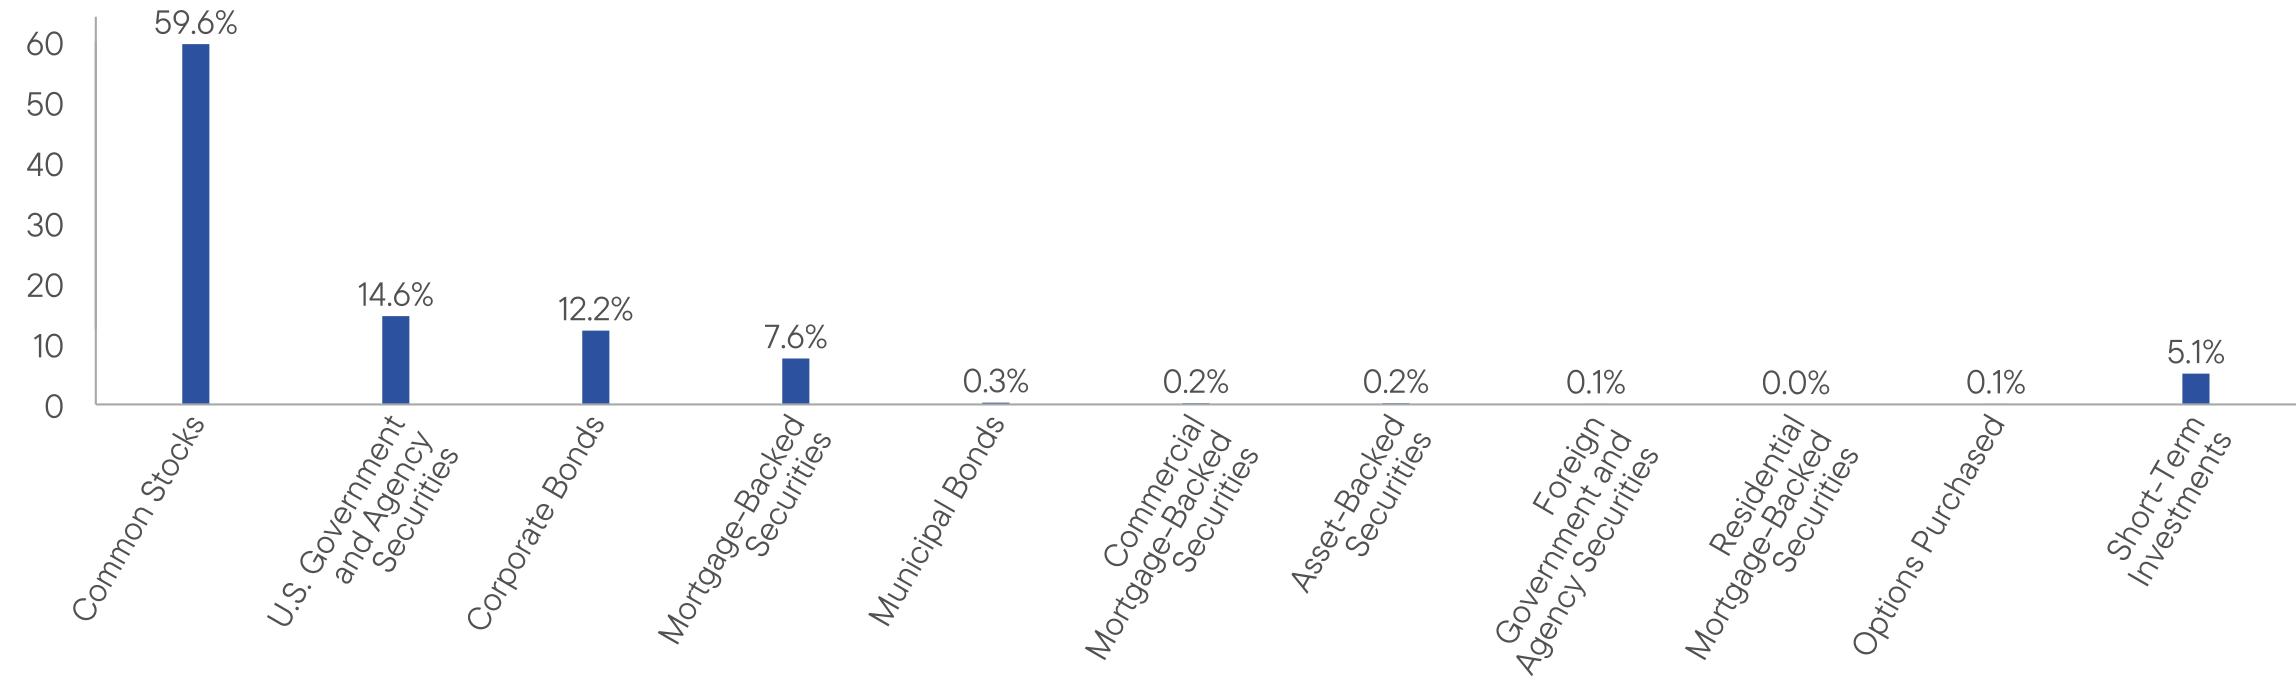
WHAT DID THE FUND INVEST IN? (as of July 31, 2026)
Portfolio Composition*,† (% of Total Investments)
WHAT WERE THE FUND COSTS FOR THE LAST YEAR? (based on a hypothetical $10,000 investment)
|
Class Name
|
Costs of a $10,000 investment
|
Costs paid as a percentage of a $10,000 investment
|
|
Class R
|
$119
|
1.11%
|
HOW DID THE FUND PERFORM LAST YEAR AND WHAT AFFECTED ITS PERFORMANCE?
For the twelve months ended July 31, 2026, Class R shares of George Putnam Balanced Fund returned 14.73%. The Fund compares its performance to the George Putnam Blended Index†, which returned 12.72% for the same period.
PERFORMANCE HIGHLIGHTS
|
Top contributors to performance:
|
|
|
↑
|
Overweight position in Marvell Technology, a semiconductor company.
|
|
↑
|
Overweight position in Lam Research, a semiconductor equipment company.
|
|
↑
|
In fixed income, overweight in investment-grade corporate credit, security selection in Carnival Corp and Meta, and certain issuers in the banking sector.
|
|
Top detractors from performance:
|
|
|
↓
|
Underweight position in Micron Technology, a memory chip company.
|
|
↓
|
Overweight position in Microsoft, a software company.
|
|
↓
|
In fixed income, overweight in FMC, a chemicals company that was downgraded to high yield.
|
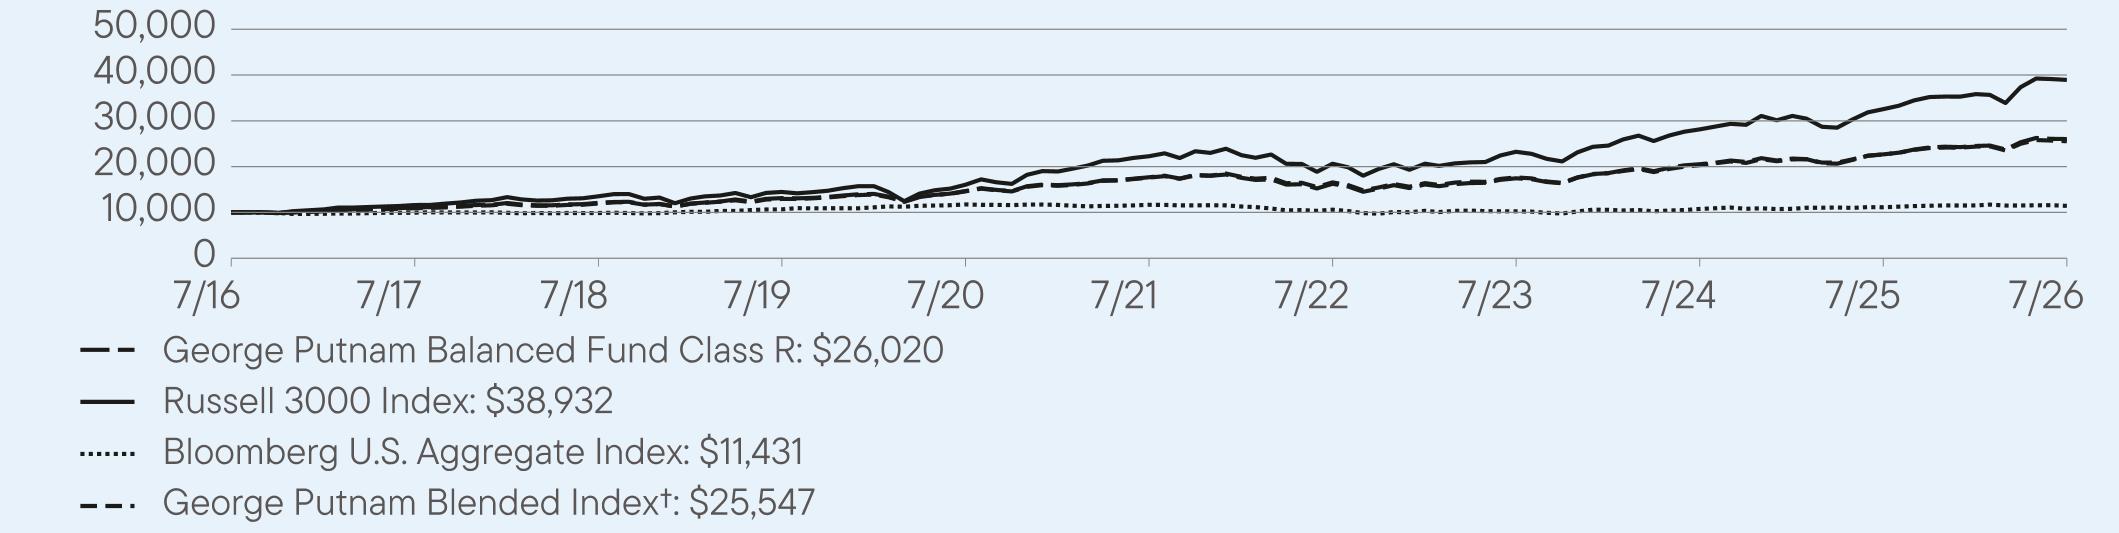
AVERAGE ANNUAL TOTAL RETURNS (%) Period Ended July 31, 2026
|
|
1 Year
|
5 Year
|
10 Year
|
|
Class R
|
14.73
|
8.04
|
10.04
|
|
Russell 3000 Index
|
19.60
|
11.82
|
14.56
|
|
Bloomberg U.S. Aggregate Index
|
2.71
|
-0.40
|
1.35
|
|
George Putnam Blended Index†
|
12.72
|
7.73
|
9.83
|
For current month-end performance, please call Franklin Templeton at (800) 225-1581 or visit
https://www.franklintempleton.com/investments/options/mutual-funds.
https://www.franklintempleton.com/investments/options/mutual-funds.
Important data provider notices and terms available at www.franklintempletondatasources.com.
KEY FUND STATISTICS (as of July 31, 2026)
|
Total Net Assets
|
$2,395,526,534
|
|
Total Number of Portfolio Holdings (excludes derivatives, except purchased options, if any)
|
770
|
|
Total Management Fee Paid
|
$11,248,225
|
|
Portfolio Turnover Rate
|
104%
|
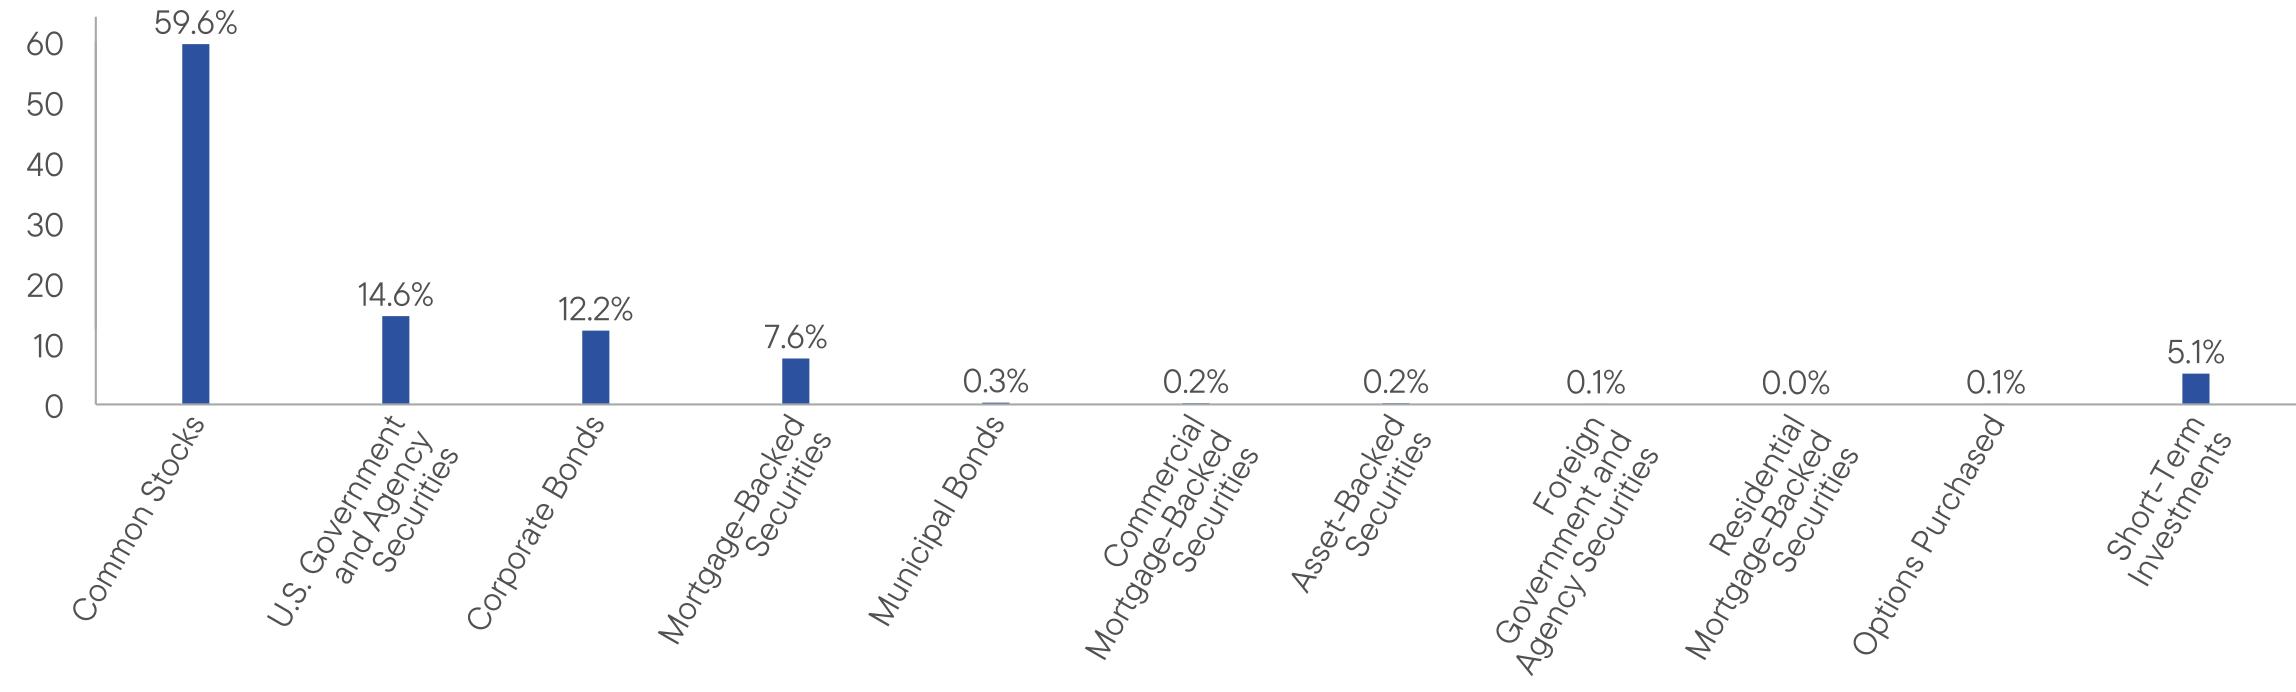
WHAT DID THE FUND INVEST IN? (as of July 31, 2026)
Portfolio Composition*,† (% of Total Investments)
WHAT WERE THE FUND COSTS FOR THE LAST YEAR? (based on a hypothetical $10,000 investment)
|
Class Name
|
Costs of a $10,000 investment
|
Costs paid as a percentage of a $10,000 investment
|
|
Class R5
|
$71
|
0.66%
|
HOW DID THE FUND PERFORM LAST YEAR AND WHAT AFFECTED ITS PERFORMANCE?
For the twelve months ended July 31, 2026, Class R5 shares of George Putnam Balanced Fund returned 15.28%. The Fund compares its performance to the George Putnam Blended Index†, which returned 12.72% for the same period.
PERFORMANCE HIGHLIGHTS
|
Top contributors to performance:
|
|
|
↑
|
Overweight position in Marvell Technology, a semiconductor company.
|
|
↑
|
Overweight position in Lam Research, a semiconductor equipment company.
|
|
↑
|
In fixed income, overweight in investment-grade corporate credit, security selection in Carnival Corp and Meta, and certain issuers in the banking sector.
|
|
Top detractors from performance:
|
|
|
↓
|
Underweight position in Micron Technology, a memory chip company.
|
|
↓
|
Overweight position in Microsoft, a software company.
|
|
↓
|
In fixed income, overweight in FMC, a chemicals company that was downgraded to high yield.
|
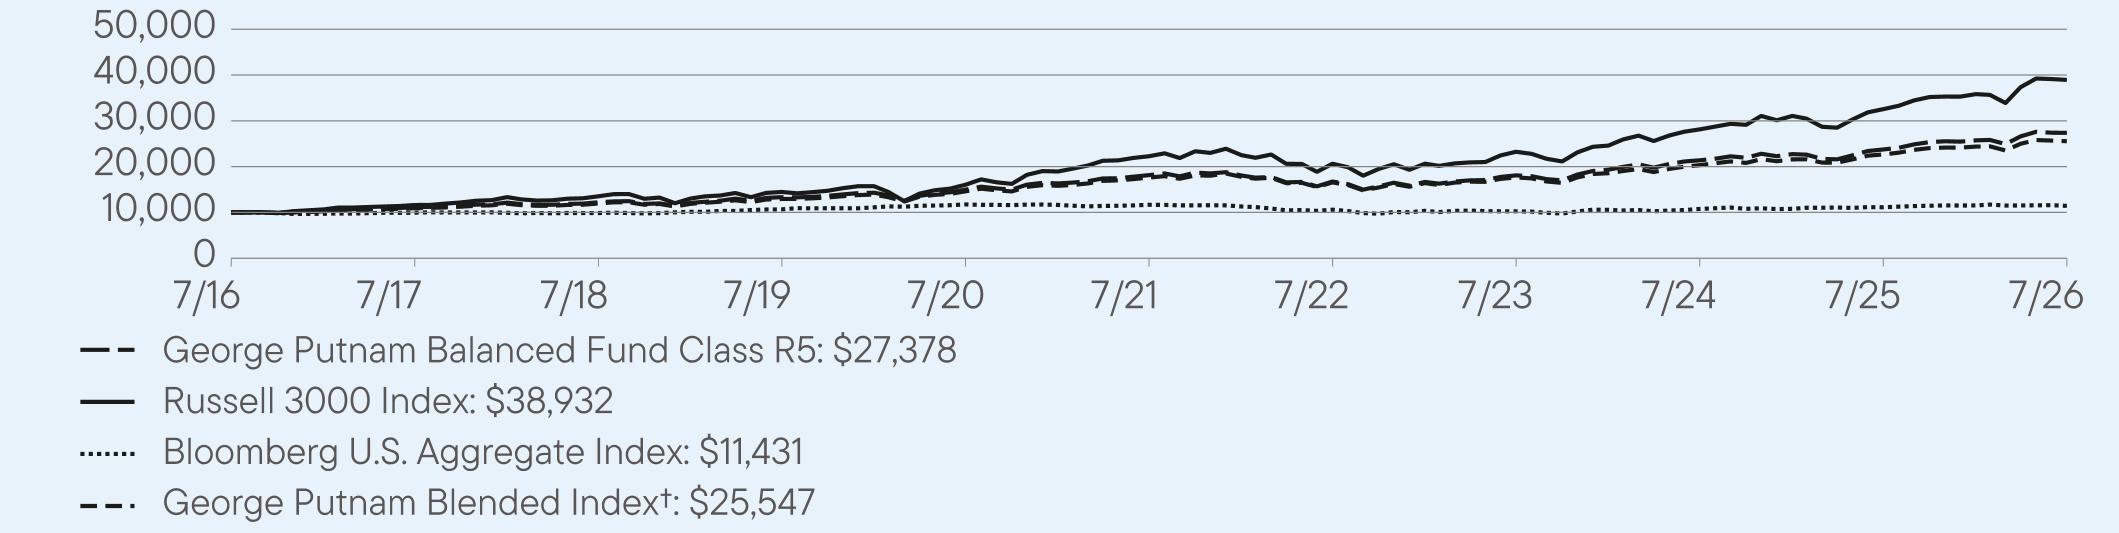
AVERAGE ANNUAL TOTAL RETURNS (%) Period Ended July 31, 2026
|
|
1 Year
|
5 Year
|
10 Year
|
|
Class R5
|
15.28
|
8.58
|
10.60
|
|
Russell 3000 Index
|
19.60
|
11.82
|
14.56
|
|
Bloomberg U.S. Aggregate Index
|
2.71
|
-0.40
|
1.35
|
|
George Putnam Blended Index†
|
12.72
|
7.73
|
9.83
|
For current month-end performance, please call Franklin Templeton at (800) 225-1581 or visit
https://www.franklintempleton.com/investments/options/mutual-funds.
https://www.franklintempleton.com/investments/options/mutual-funds.
Important data provider notices and terms available at www.franklintempletondatasources.com.
KEY FUND STATISTICS (as of July 31, 2026)
|
Total Net Assets
|
$2,395,526,534
|
|
Total Number of Portfolio Holdings (excludes derivatives, except purchased options, if any)
|
770
|
|
Total Management Fee Paid
|
$11,248,225
|
|
Portfolio Turnover Rate
|
104%
|
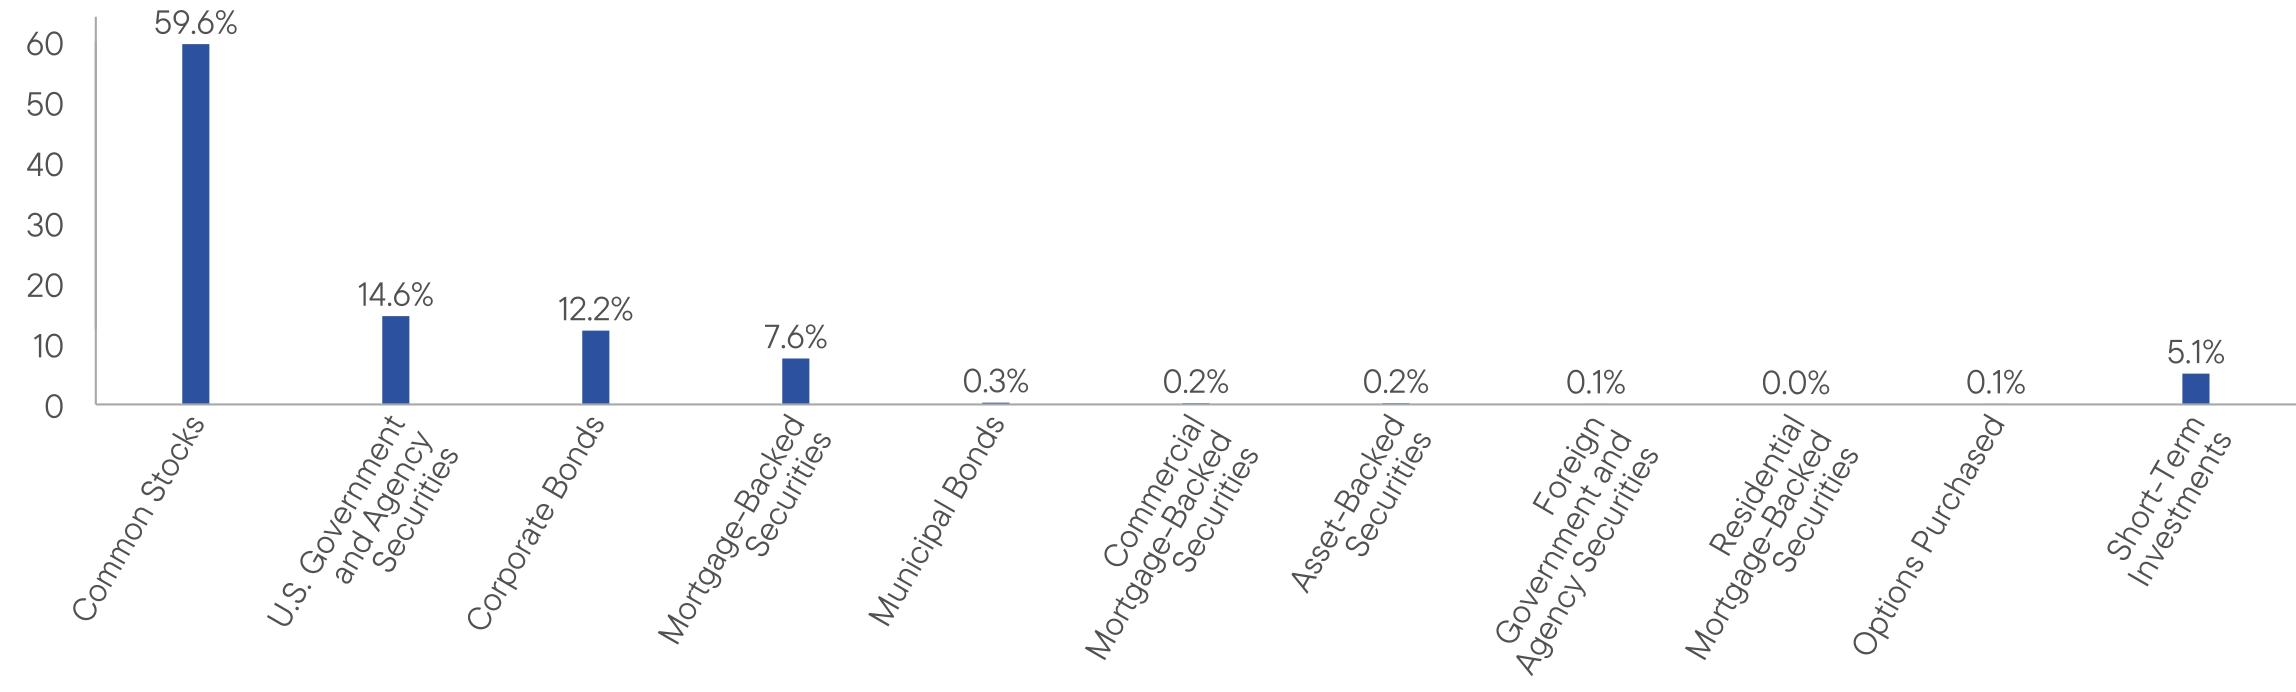
WHAT DID THE FUND INVEST IN? (as of July 31, 2026)
Portfolio Composition*,† (% of Total Investments)
WHAT WERE THE FUND COSTS FOR THE LAST YEAR? (based on a hypothetical $10,000 investment)
|
Class Name
|
Costs of a $10,000 investment
|
Costs paid as a percentage of a $10,000 investment
|
|
Class R6
|
$60
|
0.56%
|
HOW DID THE FUND PERFORM LAST YEAR AND WHAT AFFECTED ITS PERFORMANCE?
For the twelve months ended July 31, 2026, Class R6 shares of George Putnam Balanced Fund returned 15.35%. The Fund compares its performance to the George Putnam Blended Index†, which returned 12.72% for the same period.
PERFORMANCE HIGHLIGHTS
|
Top contributors to performance:
|
|
|
↑
|
Overweight position in Marvell Technology, a semiconductor company.
|
|
↑
|
Overweight position in Lam Research, a semiconductor equipment company.
|
|
↑
|
In fixed income, overweight in investment-grade corporate credit, security selection in Carnival Corp and Meta, and certain issuers in the banking sector.
|
|
Top detractors from performance:
|
|
|
↓
|
Underweight position in Micron Technology, a memory chip company.
|
|
↓
|
Overweight position in Microsoft, a software company.
|
|
↓
|
In fixed income, overweight in FMC, a chemicals company that was downgraded to high yield.
|
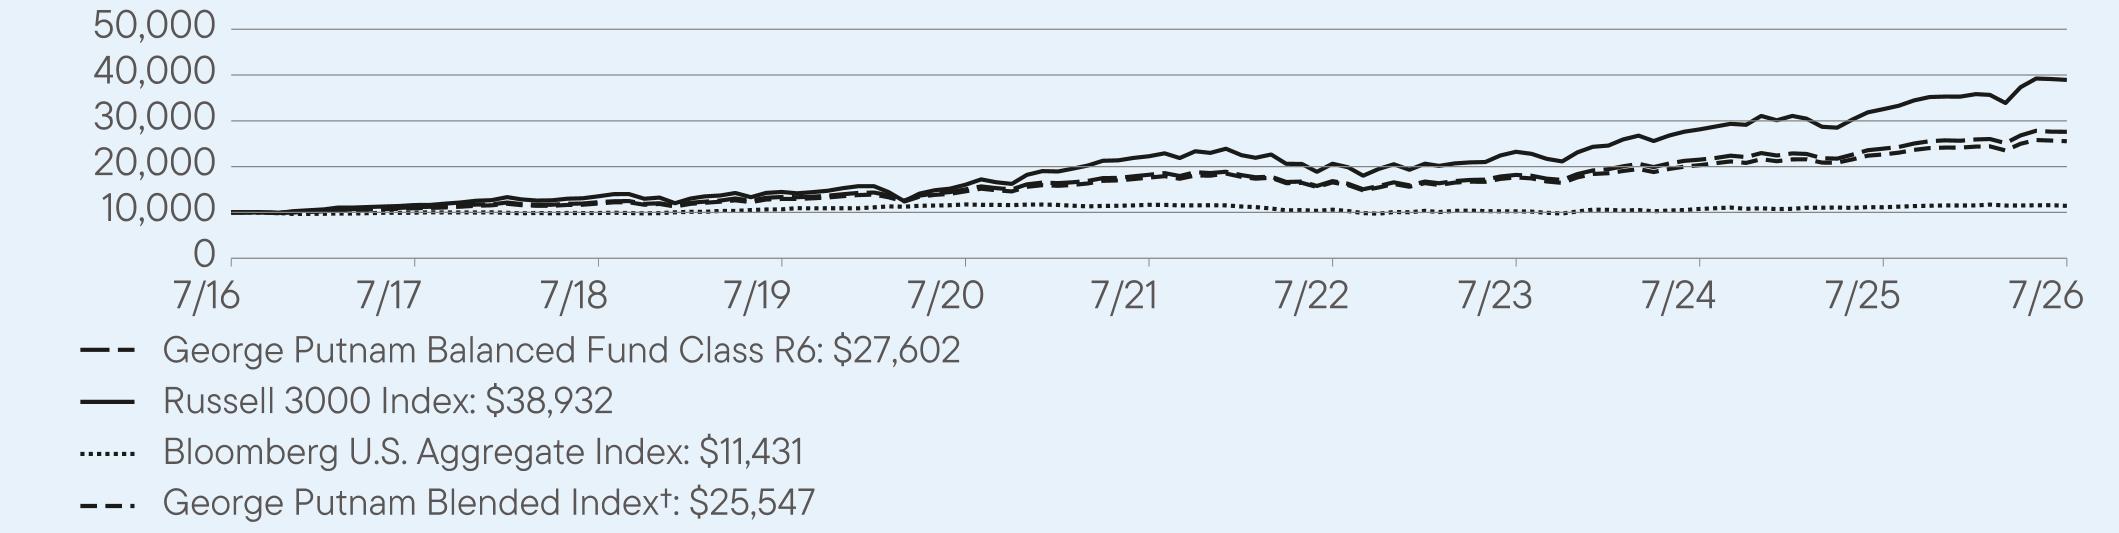
AVERAGE ANNUAL TOTAL RETURNS (%) Period Ended July 31, 2026
|
|
1 Year
|
5 Year
|
10 Year
|
|
Class R6
|
15.35
|
8.66
|
10.69
|
|
Russell 3000 Index
|
19.60
|
11.82
|
14.56
|
|
Bloomberg U.S. Aggregate Index
|
2.71
|
-0.40
|
1.35
|
|
George Putnam Blended Index†
|
12.72
|
7.73
|
9.83
|
For current month-end performance, please call Franklin Templeton at (800) 225-1581 or visit
https://www.franklintempleton.com/investments/options/mutual-funds.
https://www.franklintempleton.com/investments/options/mutual-funds.
Important data provider notices and terms available at www.franklintempletondatasources.com.
KEY FUND STATISTICS (as of July 31, 2026)
|
Total Net Assets
|
$2,395,526,534
|
|
Total Number of Portfolio Holdings (excludes derivatives, except purchased options, if any)
|
770
|
|
Total Management Fee Paid
|
$11,248,225
|
|
Portfolio Turnover Rate
|
104%
|
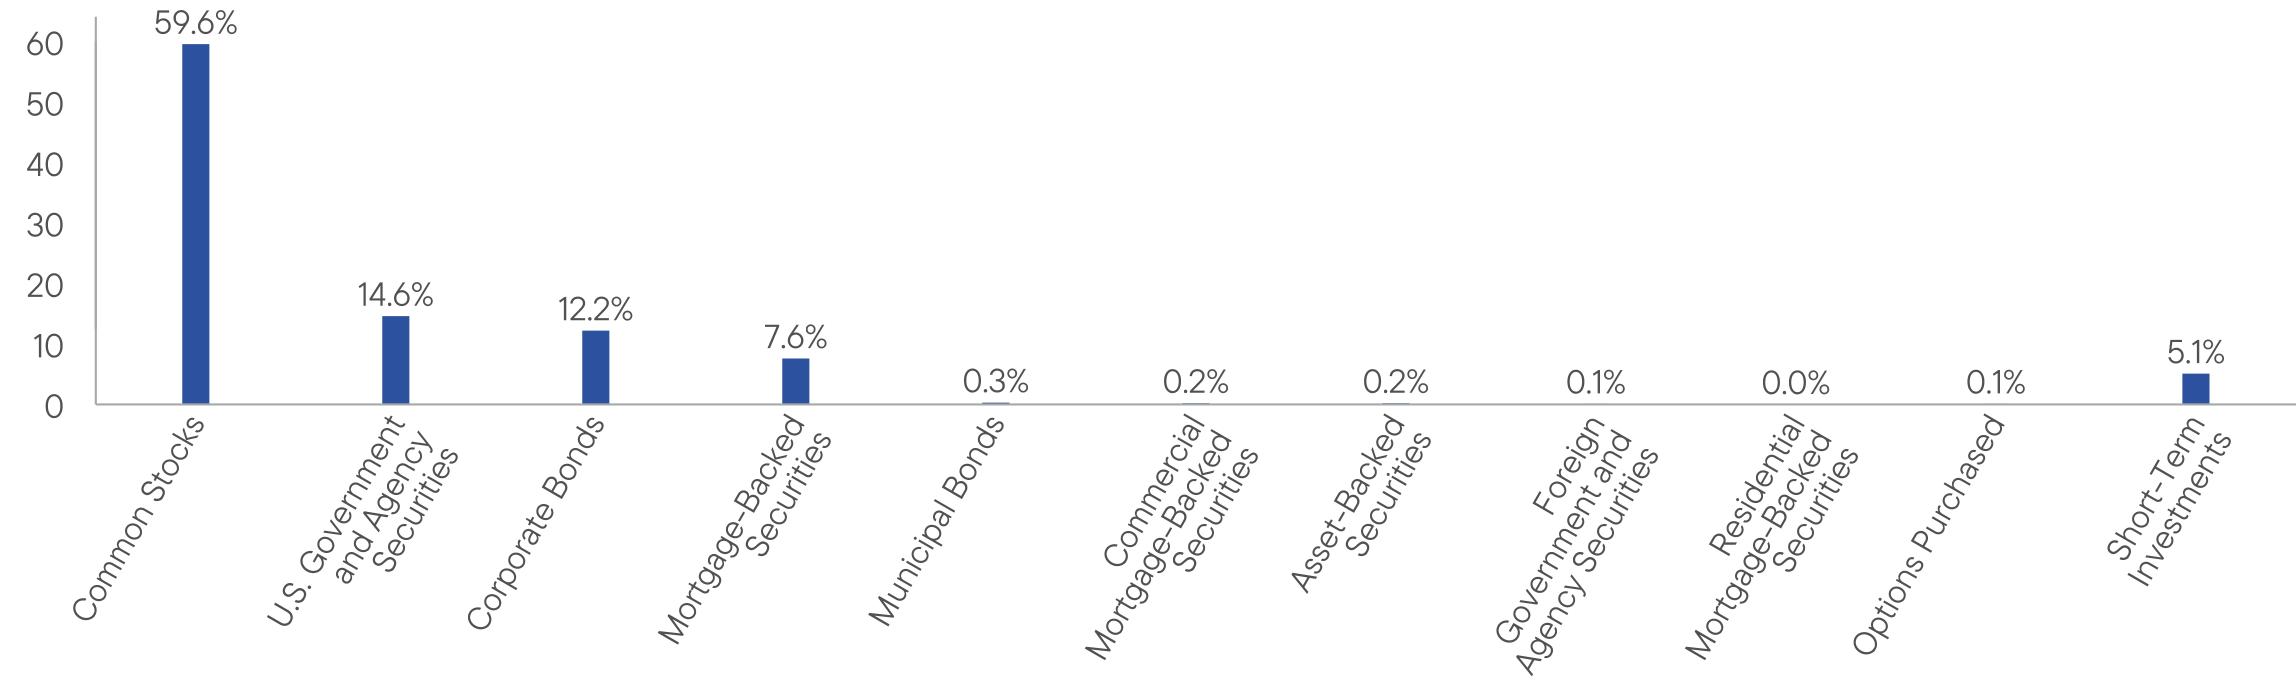
WHAT DID THE FUND INVEST IN? (as of July 31, 2026)
Portfolio Composition*,† (% of Total Investments)
WHAT WERE THE FUND COSTS FOR THE LAST YEAR? (based on a hypothetical $10,000 investment)
|
Class Name
|
Costs of a $10,000 investment
|
Costs paid as a percentage of a $10,000 investment
|
|
Class Y
|
$66
|
0.61%
|
HOW DID THE FUND PERFORM LAST YEAR AND WHAT AFFECTED ITS PERFORMANCE?
For the twelve months ended July 31, 2026, Class Y shares of George Putnam Balanced Fund returned 15.31%. The Fund compares its performance to the George Putnam Blended Index†, which returned 12.72% for the same period.
PERFORMANCE HIGHLIGHTS
|
Top contributors to performance:
|
|
|
↑
|
Overweight position in Marvell Technology, a semiconductor company.
|
|
↑
|
Overweight position in Lam Research, a semiconductor equipment company.
|
|
↑
|
In fixed income, overweight in investment-grade corporate credit, security selection in Carnival Corp and Meta, and certain issuers in the banking sector.
|
|
Top detractors from performance:
|
|
|
↓
|
Underweight position in Micron Technology, a memory chip company.
|
|
↓
|
Overweight position in Microsoft, a software company.
|
|
↓
|
In fixed income, overweight in FMC, a chemicals company that was downgraded to high yield.
|
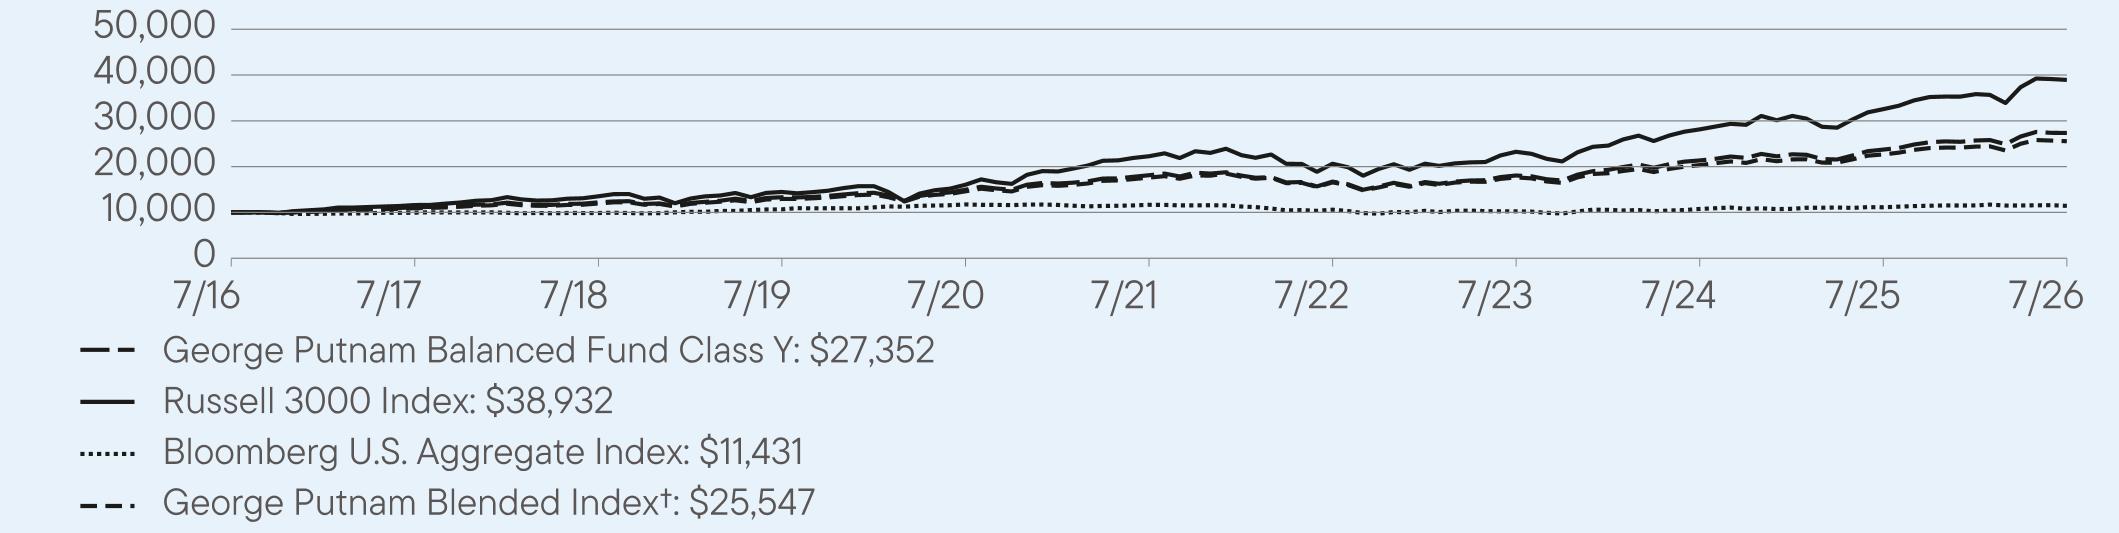
AVERAGE ANNUAL TOTAL RETURNS (%) Period Ended July 31, 2026
|
|
1 Year
|
5 Year
|
10 Year
|
|
Class Y
|
15.31
|
8.58
|
10.59
|
|
Russell 3000 Index
|
19.60
|
11.82
|
14.56
|
|
Bloomberg U.S. Aggregate Index
|
2.71
|
-0.40
|
1.35
|
|
George Putnam Blended Index†
|
12.72
|
7.73
|
9.83
|
For current month-end performance, please call Franklin Templeton at (800) 225-1581 or visit
https://www.franklintempleton.com/investments/options/mutual-funds.
https://www.franklintempleton.com/investments/options/mutual-funds.
Important data provider notices and terms available at www.franklintempletondatasources.com.
KEY FUND STATISTICS (as of July 31, 2026)
|
Total Net Assets
|
$2,395,526,534
|
|
Total Number of Portfolio Holdings (excludes derivatives, except purchased options, if any)
|
770
|
|
Total Management Fee Paid
|
$11,248,225
|
|
Portfolio Turnover Rate
|
104%
|
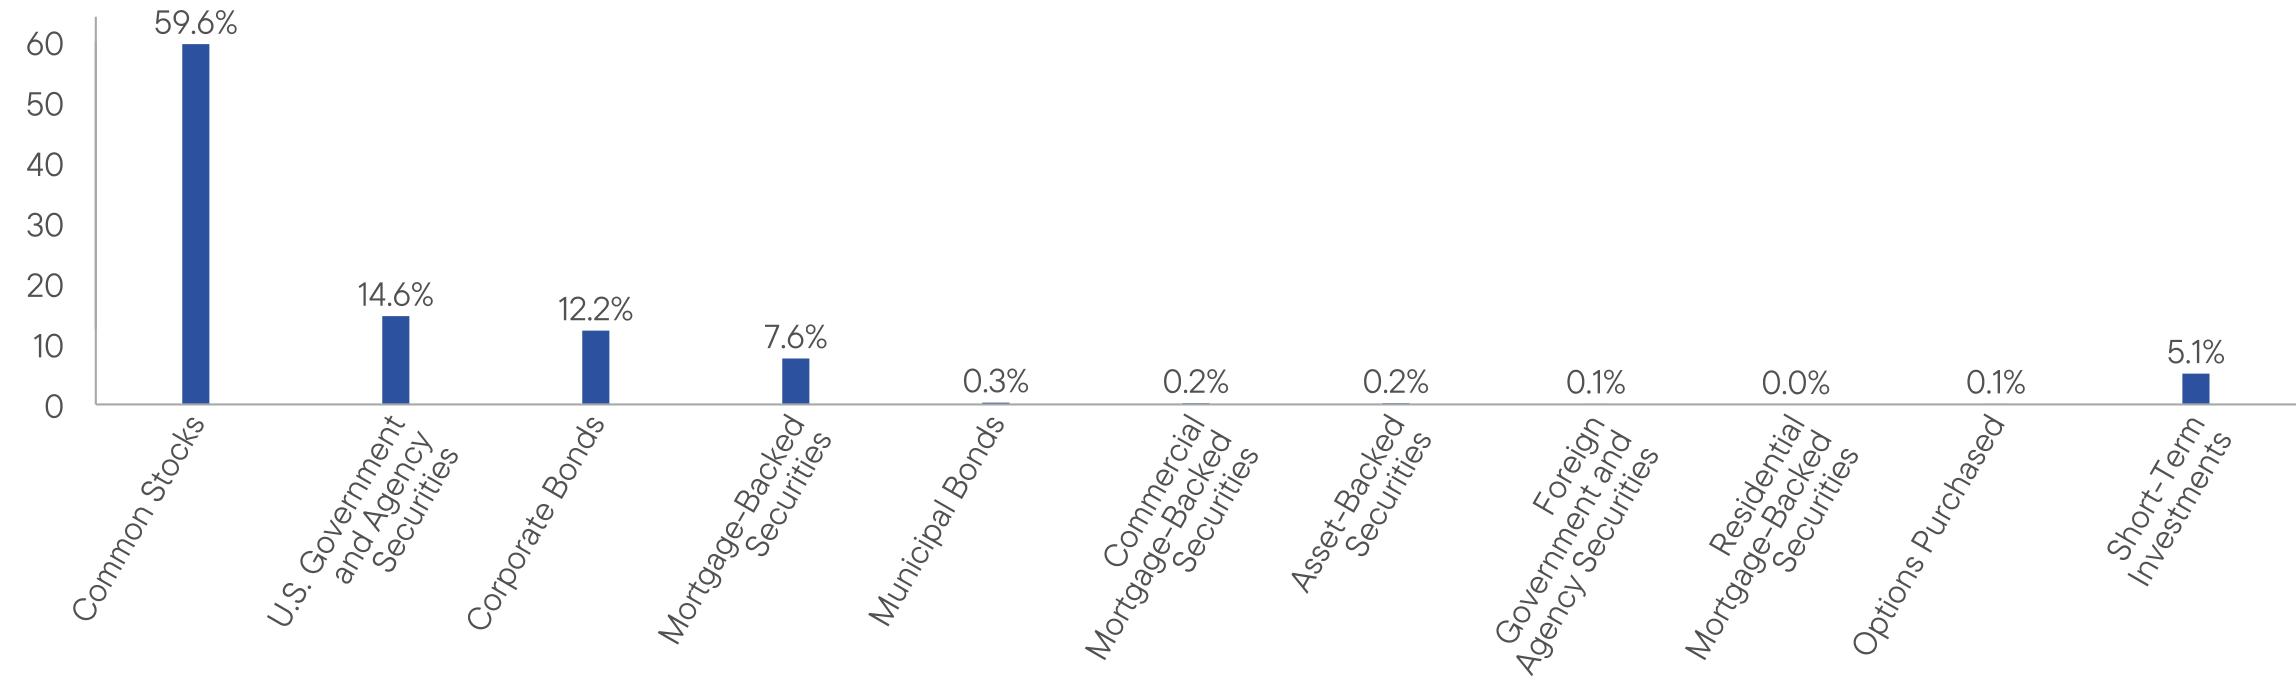
WHAT DID THE FUND INVEST IN? (as of July 31, 2026)
Portfolio Composition*,† (% of Total Investments)
| [1] |
|
||
| [2] |
|
||
| [3] |
|
||
| [4] |
|
||
| [5] |
|
||
| [6] |
|
||
| [7] |
|
||
| [8] |
|
||
| [9] |
|
||
| [10] |
|
||
| [11] |
|
||
| [12] |
|
||
| [13] |
|
||
| [14] |
|
||
| [15] |
|
||
| [16] |
|
||
| [17] |
|
||
| [18] |
|
||
| [19] |
|
||
| [20] |
|
||
| [21] |
|