
KeyCorp Investor Meetings: Europe September 2026 Chris Gorman Chairman & Chief Executive Officer Tim Schmidt Corporate Treasurer Troy Gates Director of Investor Relations
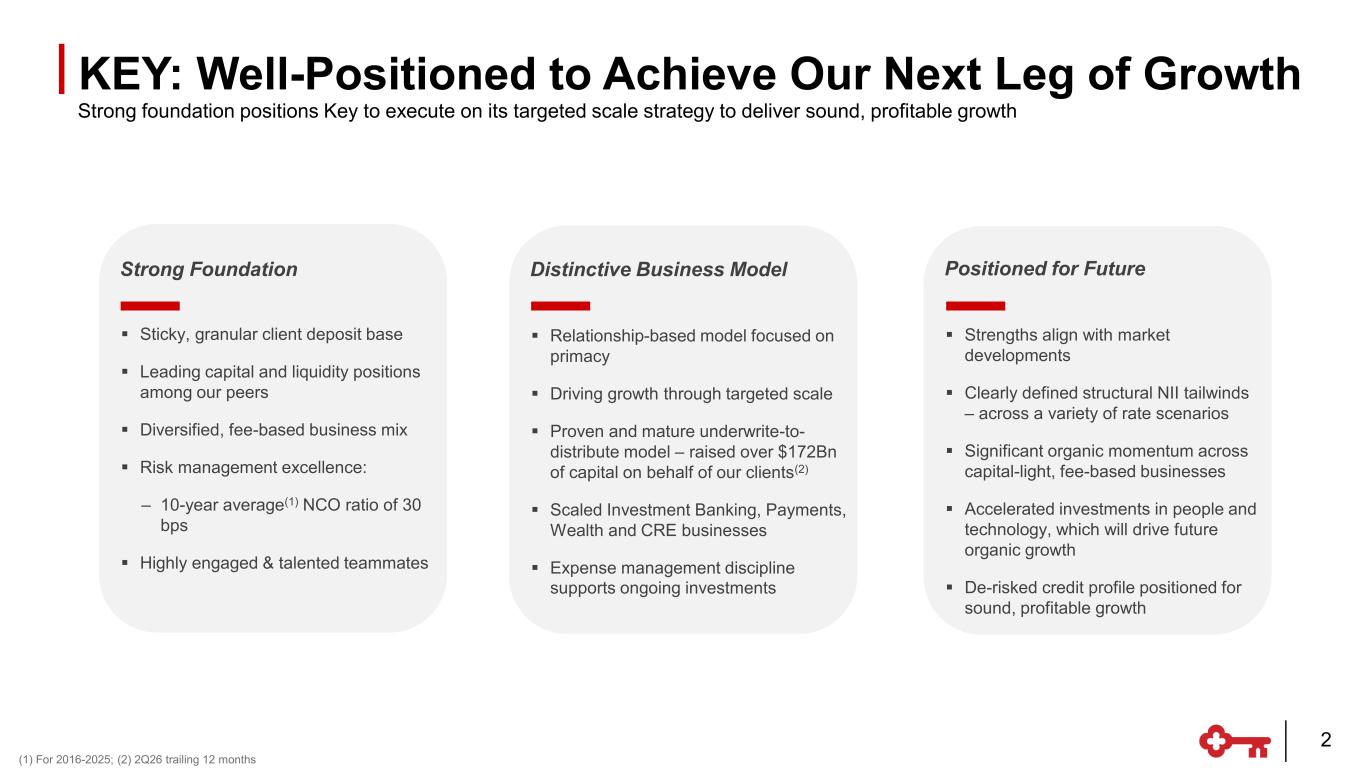
Strong Foundation ▪ Sticky, granular client deposit base ▪ Leading capital and liquidity positions among our peers ▪ Diversified, fee-based business mix ▪ Risk management excellence: ‒ 10-year average(1) NCO ratio of 30 bps ▪ Highly engaged & talented teammates Distinctive Business Model ▪ Relationship-based model focused on primacy ▪ Driving growth through targeted scale ▪ Proven and mature underwrite-to- distribute model – raised over $172Bn of capital on behalf of our clients(2) ▪ Scaled Investment Banking, Payments, Wealth and CRE businesses ▪ Expense management discipline supports ongoing investments Positioned for Future ▪ Strengths align with market developments ▪ Clearly defined structural NII tailwinds – across a variety of rate scenarios ▪ Significant organic momentum across capital-light, fee-based businesses ▪ Accelerated investments in people and technology, which will drive future organic growth ▪ De-risked credit profile positioned for sound, profitable growth Strong foundation positions Key to execute on its targeted scale strategy to deliver sound, profitable growth (1) For 2016-2025; (2) 2Q26 trailing 12 months 2 KEY: Well-Positioned to Achieve Our Next Leg of Growth
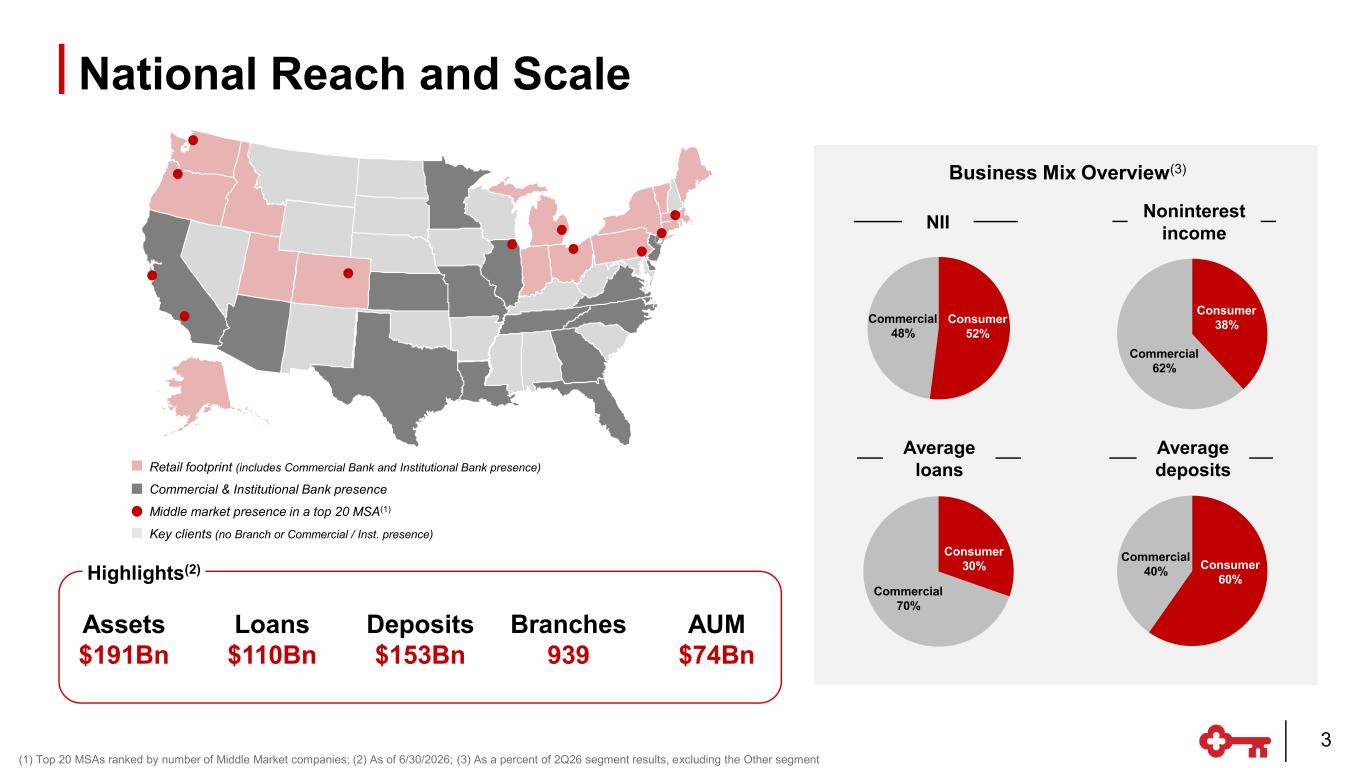
Business Mix Overview(3) Assets $191Bn Deposits $153Bn Loans $110Bn Branches 939 AUM $74Bn Consumer 52% Commercial 48% NII Commercial 62% Consumer 38% Noninterest income Consumer 30% Commercial 70% Average loans Consumer 60% Commercial 40% Average depositsRetail footprint (includes Commercial Bank and Institutional Bank presence) Key clients (no Branch or Commercial / Inst. presence) Commercial & Institutional Bank presence Middle market presence in a top 20 MSA(1) National Reach and Scale (1) Top 20 MSAs ranked by number of Middle Market companies; (2) As of 6/30/2026; (3) As a percent of 2Q26 segment results, excluding the Other segment 3 Highlights(2)
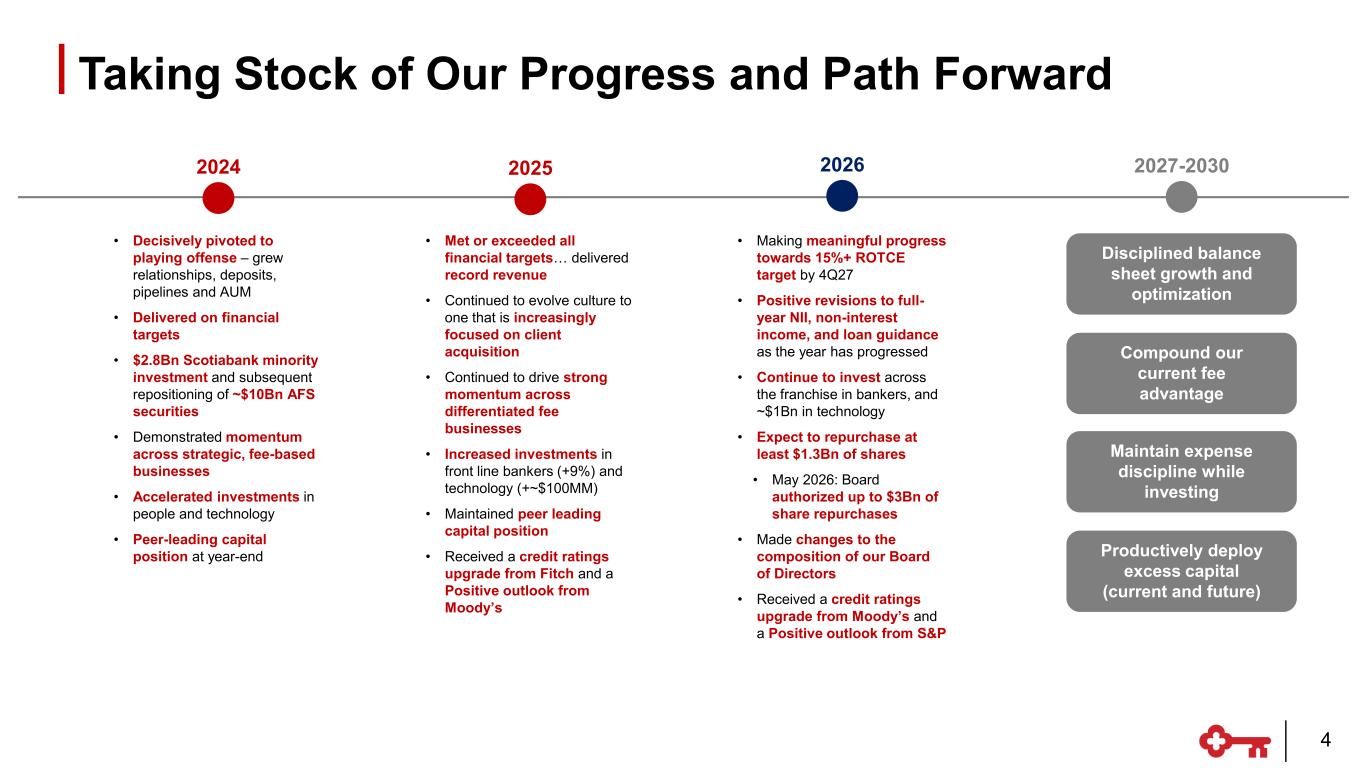
2024 2025 2026 2027-2030 • Decisively pivoted to playing offense – grew relationships, deposits, pipelines and AUM • Delivered on financial targets • $2.8Bn Scotiabank minority investment and subsequent repositioning of ~$10Bn AFS securities • Demonstrated momentum across strategic, fee-based businesses • Accelerated investments in people and technology • Peer-leading capital position at year-end • Met or exceeded all financial targets… delivered record revenue • Continued to evolve culture to one that is increasingly focused on client acquisition • Continued to drive strong momentum across differentiated fee businesses • Increased investments in front line bankers (+9%) and technology (+~$100MM) • Maintained peer leading capital position • Received a credit ratings upgrade from Fitch and a Positive outlook from Moody’s Disciplined balance sheet growth and optimization Maintain expense discipline while investing Compound our current fee advantage Productively deploy excess capital (current and future) • Making meaningful progress towards 15%+ ROTCE target by 4Q27 • Positive revisions to full- year NII, non-interest income, and loan guidance as the year has progressed • Continue to invest across the franchise in bankers, and ~$1Bn in technology • Expect to repurchase at least $1.3Bn of shares • May 2026: Board authorized up to $3Bn of share repurchases • Made changes to the composition of our Board of Directors • Received a credit ratings upgrade from Moody’s and a Positive outlook from S&P Taking Stock of Our Progress and Path Forward 4
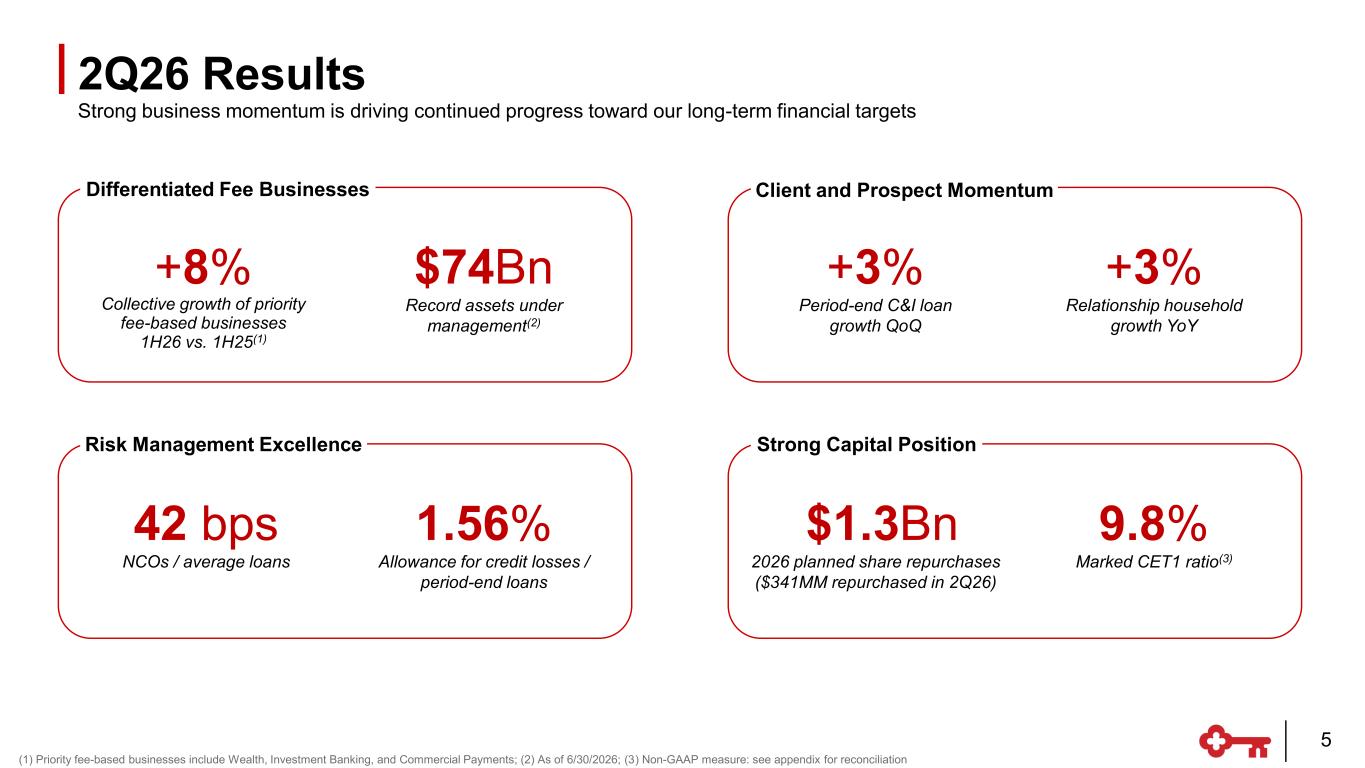
2Q26 Results +8% Collective growth of priority fee-based businesses 1H26 vs. 1H25(1) $74Bn Record assets under management(2) +3% Relationship household growth YoY 42 bps NCOs / average loans 9.8% Marked CET1 ratio(3) (1) Priority fee-based businesses include Wealth, Investment Banking, and Commercial Payments; (2) As of 6/30/2026; (3) Non-GAAP measure: see appendix for reconciliation +3% Period-end C&I loan growth QoQ 1.56% Allowance for credit losses / period-end loans $1.3Bn 2026 planned share repurchases ($341MM repurchased in 2Q26) Client and Prospect Momentum Strong Capital PositionRisk Management Excellence Differentiated Fee Businesses 5 Strong business momentum is driving continued progress toward our long-term financial targets
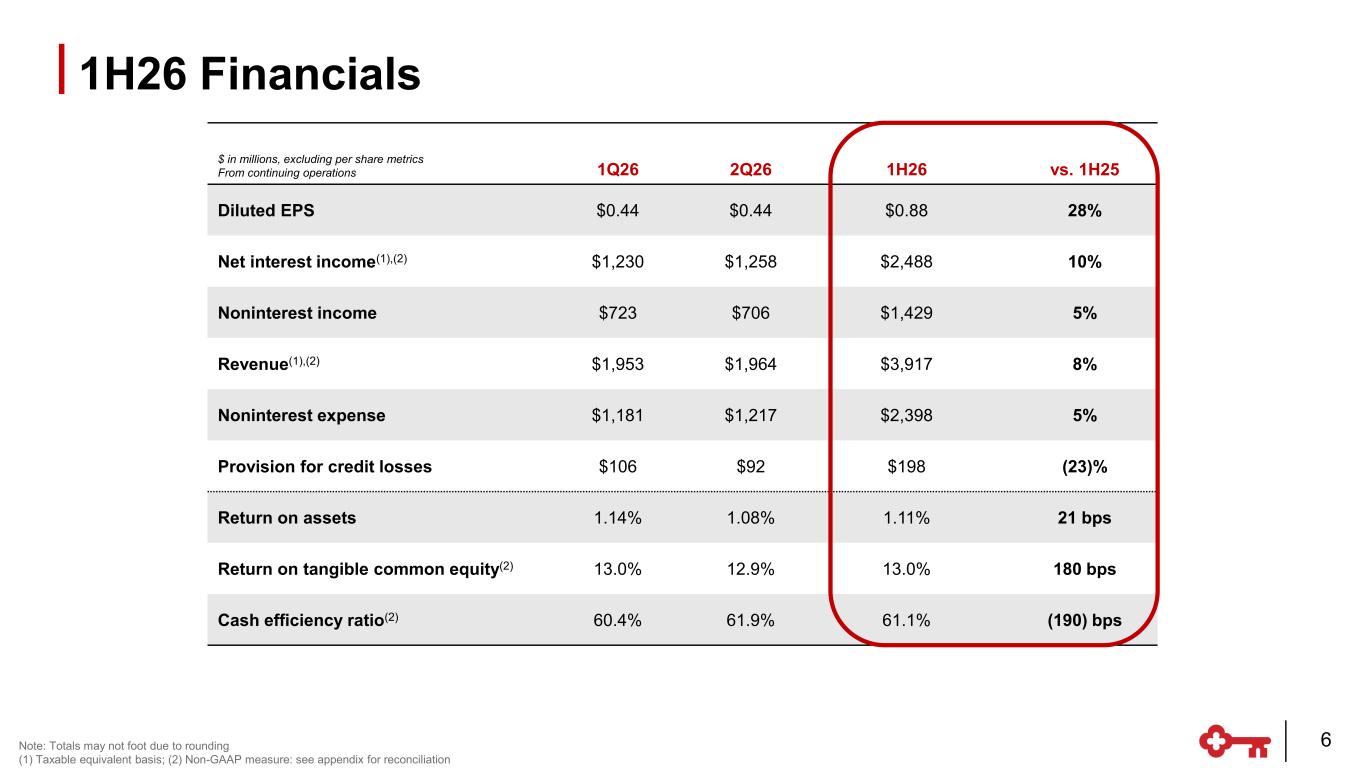
$ in millions, excluding per share metrics From continuing operations 1Q26 2Q26 1H26 vs. 1H25 Diluted EPS $0.44 $0.44 $0.88 28% Net interest income(1),(2) $1,230 $1,258 $2,488 10% Noninterest income $723 $706 $1,429 5% Revenue(1),(2) $1,953 $1,964 $3,917 8% Noninterest expense $1,181 $1,217 $2,398 5% Provision for credit losses $106 $92 $198 (23)% Return on assets 1.14% 1.08% 1.11% 21 bps Return on tangible common equity(2) 13.0% 12.9% 13.0% 180 bps Cash efficiency ratio(2) 60.4% 61.9% 61.1% (190) bps 1H26 Financials Note: Totals may not foot due to rounding (1) Taxable equivalent basis; (2) Non-GAAP measure: see appendix for reconciliation 6
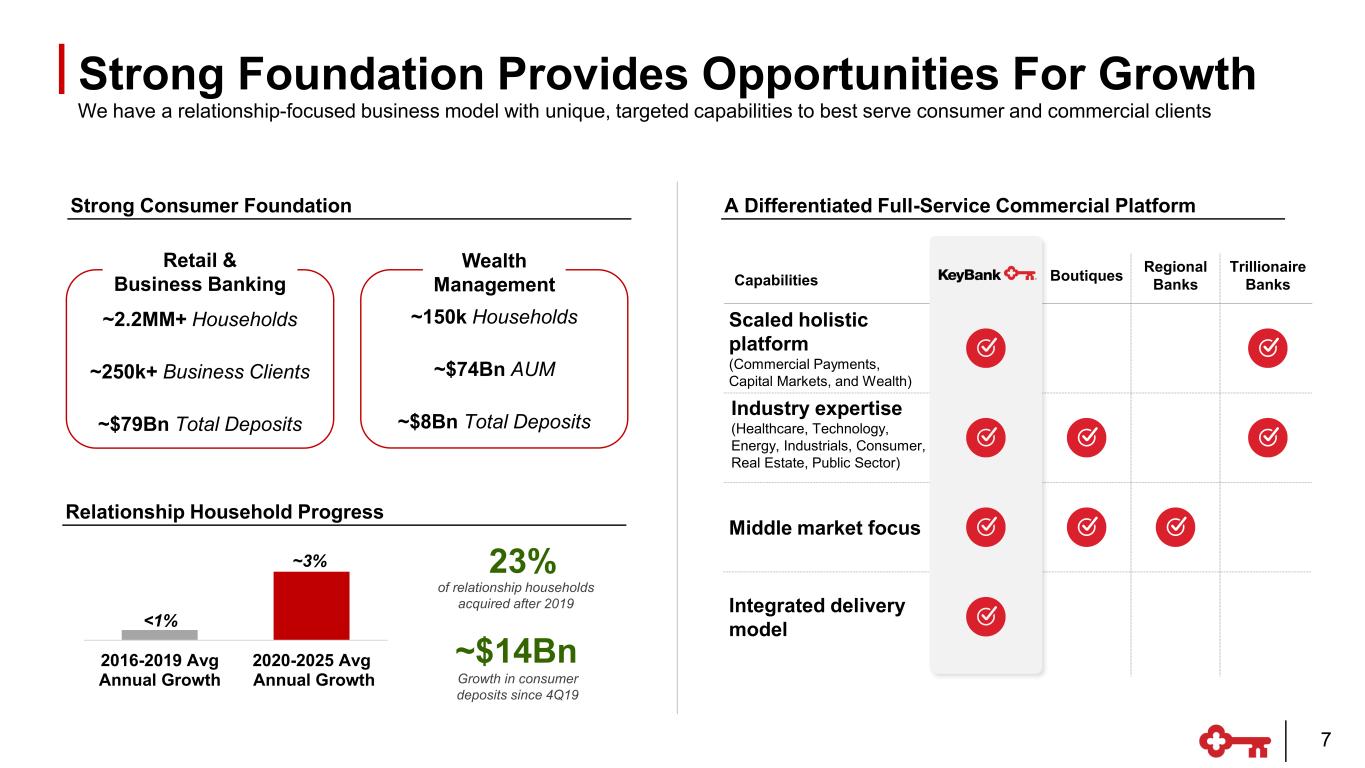
2016-2019 Avg Annual Growth 2020-2025 Avg Annual Growth We have a relationship-focused business model with unique, targeted capabilities to best serve consumer and commercial clients Capabilities Scaled holistic platform (Commercial Payments, Capital Markets, and Wealth) Industry expertise (Healthcare, Technology, Energy, Industrials, Consumer, Real Estate, Public Sector) Integrated delivery model Regional Banks Trillionaire Banks Boutiques Middle market focus <1% ~3% of relationship households acquired after 2019 23% Growth in consumer deposits since 4Q19 ~$14Bn ~2.2MM+ Households ~250k+ Business Clients ~$79Bn Total Deposits Retail & Business Banking ~150k Households ~$74Bn AUM ~$8Bn Total Deposits Wealth Management Strong Foundation Provides Opportunities For Growth 7 Relationship Household Progress Strong Consumer Foundation A Differentiated Full-Service Commercial Platform
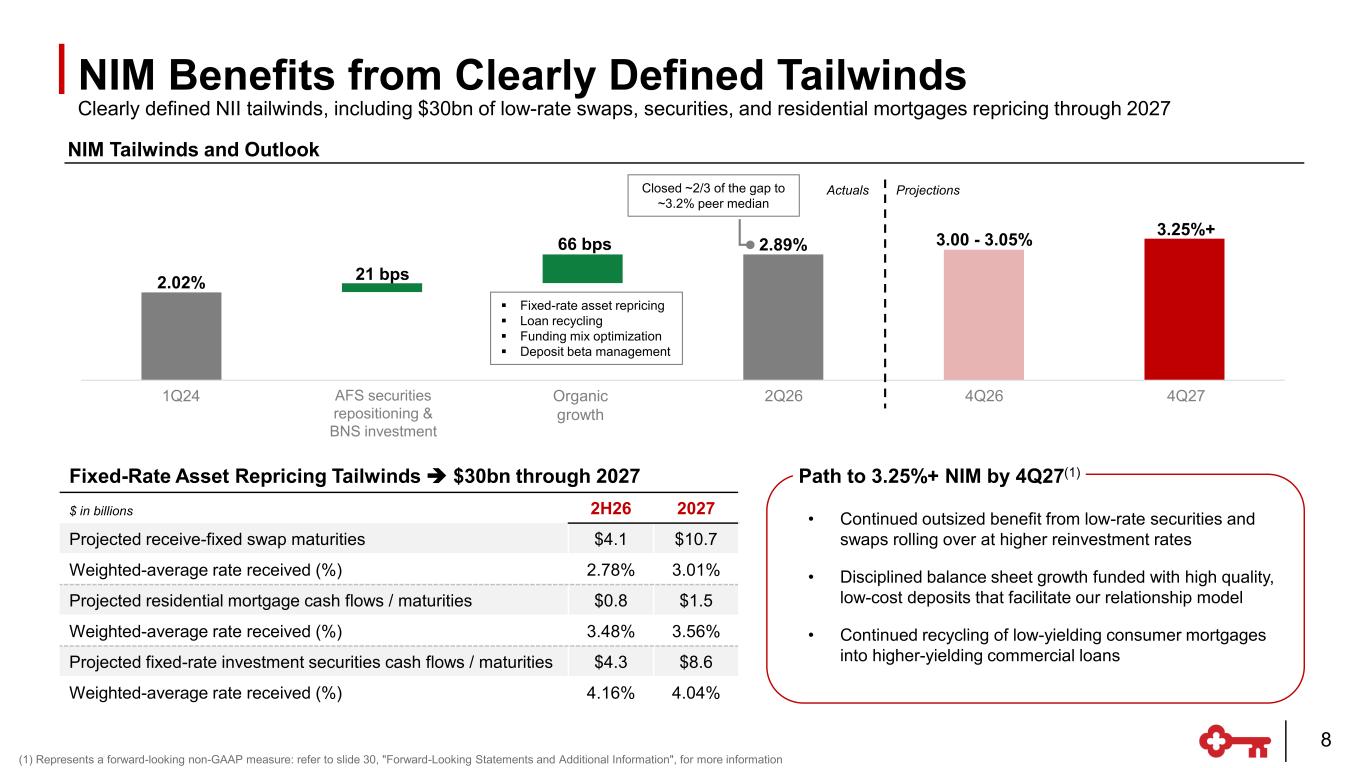
2.02% 2.89% 1Q24 AFS repositioning & BNS … Organic growth 2Q26 4Q26 4Q27 NIM Benefits from Clearly Defined Tailwinds 1Q24 AFS securities repositioning & BNS investment Organic growth 21 bps 66 bps Clearly defined NII tailwinds, including $30bn of low-rate swaps, securities, and residential mortgages repricing through 2027 Closed ~2/3 of the gap to ~3.2% peer median 3.25%+ 4Q26 ▪ Fixed-rate asset repricing ▪ Loan recycling ▪ Funding mix optimization ▪ Deposit beta management ProjectionsActuals 3.00 - 3.05% 8 (1) Represents a forward-looking non-GAAP measure: refer to slide 30, "Forward-Looking Statements and Additional Information", for more information NIM Tailwinds and Outlook Fixed-Rate Asset Repricing Tailwinds ➔ $30bn through 2027 $ in billions 2H26 2027 Projected receive-fixed swap maturities $4.1 $10.7 Weighted-average rate received (%) 2.78% 3.01% Projected residential mortgage cash flows / maturities $0.8 $1.5 Weighted-average rate received (%) 3.48% 3.56% Projected fixed-rate investment securities cash flows / maturities $4.3 $8.6 Weighted-average rate received (%) 4.16% 4.04% • Continued outsized benefit from low-rate securities and swaps rolling over at higher reinvestment rates • Disciplined balance sheet growth funded with high quality, low-cost deposits that facilitate our relationship model • Continued recycling of low-yielding consumer mortgages into higher-yielding commercial loans Path to 3.25%+ NIM by 4Q27(1)
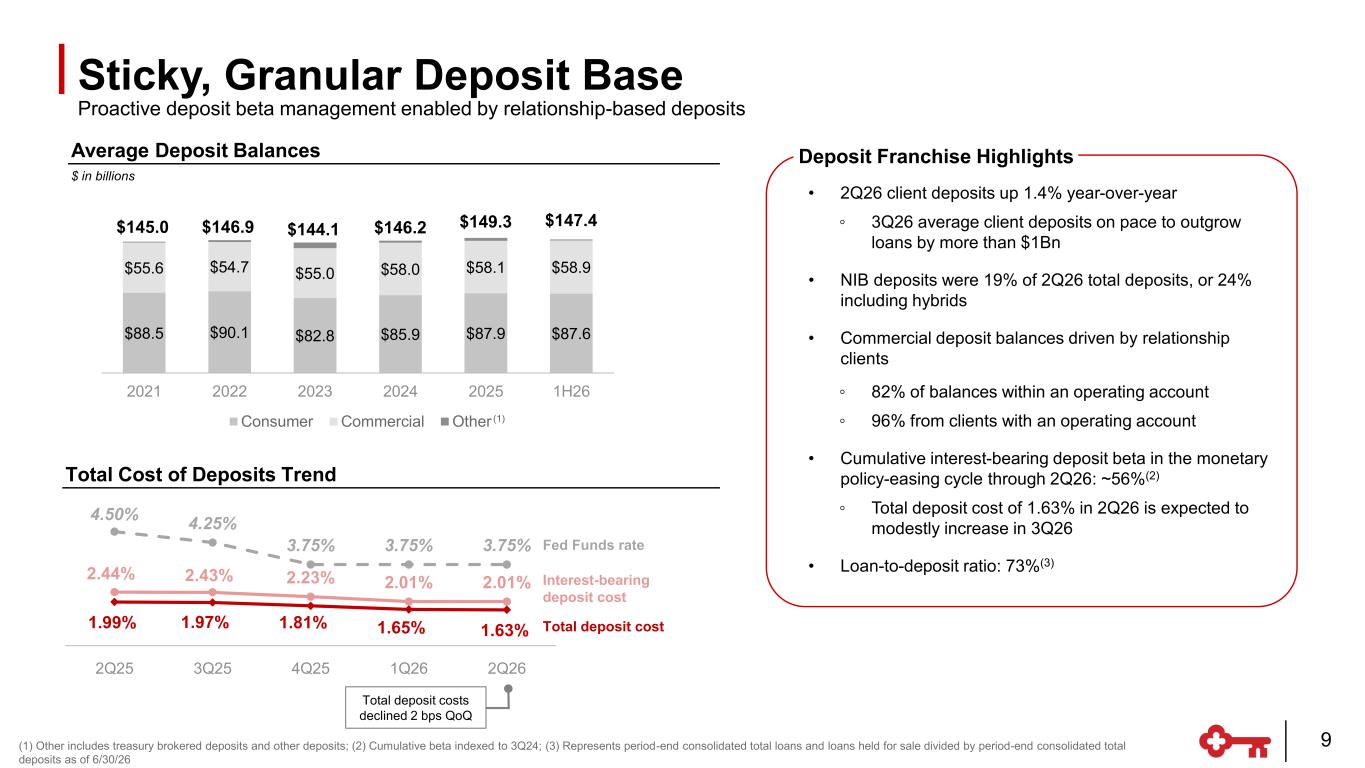
Sticky, Granular Deposit Base 1.99% 1.97% 1.81% 1.65% 1.63% 2.44% 2.43% 2.23% 2.01% 2.01% 4.50% 4.25% 3.75% 3.75% 3.75% 1.80% 2.30% 2.80% 3.30% 3.80% 4.30% 4.80% -0.20% 0.80% 1.80% 2.80% 3.80% 4.80% 5.80% 2Q25 3Q25 4Q25 1Q26 2Q26 $88.5 $90.1 $82.8 $85.9 $87.9 $87.6 $55.6 $54.7 $55.0 $58.0 $58.1 $58.9 $145.0 $146.9 $144.1 $146.2 $149.3 $147.4 2021 2022 2023 2024 2025 1H26 Consumer Commercial Other Proactive deposit beta management enabled by relationship-based deposits Total deposit cost Fed Funds rate Interest-bearing deposit cost 9(1) Other includes treasury brokered deposits and other deposits; (2) Cumulative beta indexed to 3Q24; (3) Represents period-end consolidated total loans and loans held for sale divided by period-end consolidated total deposits as of 6/30/26 Total deposit costs declined 2 bps QoQ (1) • 2Q26 client deposits up 1.4% year-over-year ◦ 3Q26 average client deposits on pace to outgrow loans by more than $1Bn • NIB deposits were 19% of 2Q26 total deposits, or 24% including hybrids • Commercial deposit balances driven by relationship clients ◦ 82% of balances within an operating account ◦ 96% from clients with an operating account • Cumulative interest-bearing deposit beta in the monetary policy-easing cycle through 2Q26: ~56%(2) ◦ Total deposit cost of 1.63% in 2Q26 is expected to modestly increase in 3Q26 • Loan-to-deposit ratio: 73%(3) Deposit Franchise Highlights Total Cost of Deposits Trend Average Deposit Balances $ in billions
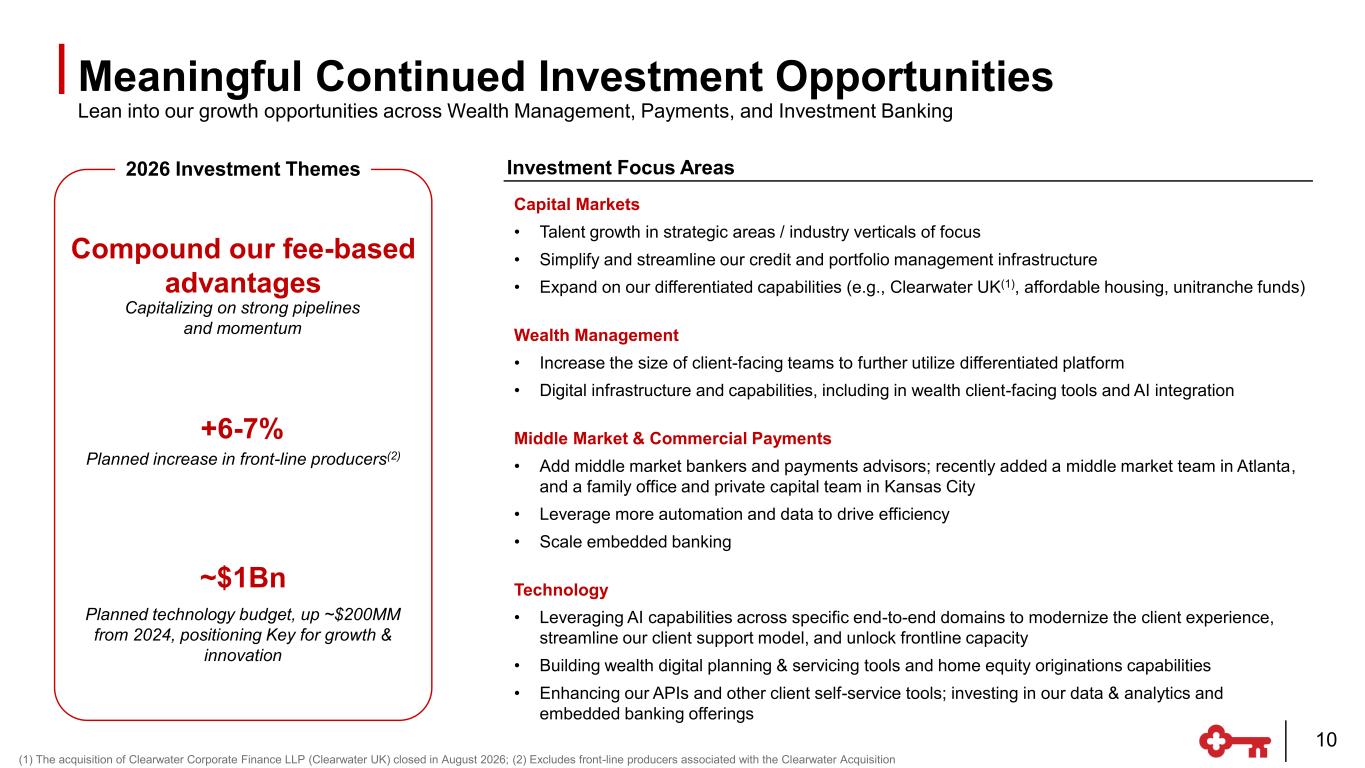
Capital Markets • Talent growth in strategic areas / industry verticals of focus • Simplify and streamline our credit and portfolio management infrastructure • Expand on our differentiated capabilities (e.g., Clearwater UK(1), affordable housing, unitranche funds) Wealth Management • Increase the size of client-facing teams to further utilize differentiated platform • Digital infrastructure and capabilities, including in wealth client-facing tools and AI integration Middle Market & Commercial Payments • Add middle market bankers and payments advisors; recently added a middle market team in Atlanta, and a family office and private capital team in Kansas City • Leverage more automation and data to drive efficiency • Scale embedded banking Technology • Leveraging AI capabilities across specific end-to-end domains to modernize the client experience, streamline our client support model, and unlock frontline capacity • Building wealth digital planning & servicing tools and home equity originations capabilities • Enhancing our APIs and other client self-service tools; investing in our data & analytics and embedded banking offerings Compound our fee-based advantages Capitalizing on strong pipelines and momentum ~$1Bn Planned technology budget, up ~$200MM from 2024, positioning Key for growth & innovation Meaningful Continued Investment Opportunities Lean into our growth opportunities across Wealth Management, Payments, and Investment Banking 2026 Investment Themes +6-7% Planned increase in front-line producers(2) 10 (1) The acquisition of Clearwater Corporate Finance LLP (Clearwater UK) closed in August 2026; (2) Excludes front-line producers associated with the Clearwater Acquisition Investment Focus Areas
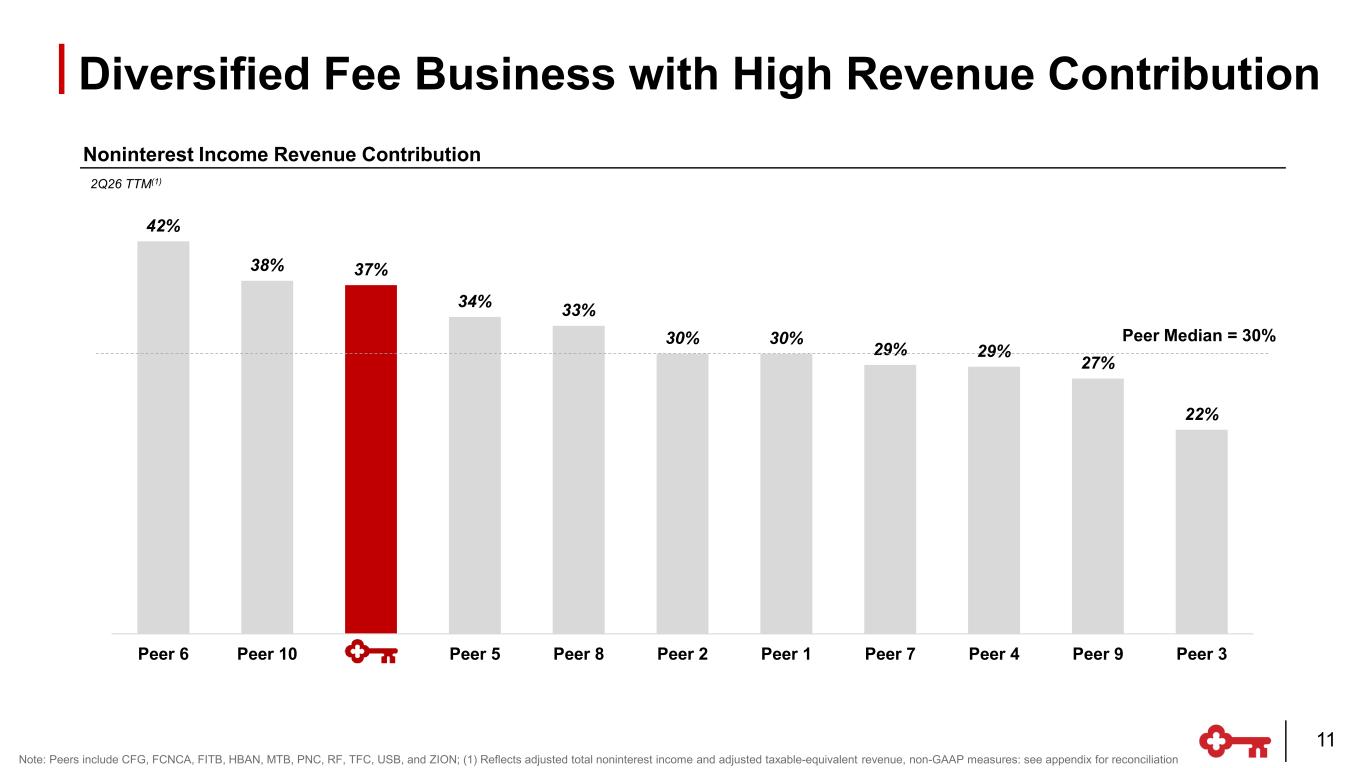
42% 38% 37% 34% 33% 30% 30% 29% 29% 27% 22% Peer 6 Peer 10 Peer 5 Peer 8 Peer 2 Peer 1 Peer 7 Peer 4 Peer 9 Peer 3 Peer Median = 30% 2Q26 TTM(1) Diversified Fee Business with High Revenue Contribution Note: Peers include CFG, FCNCA, FITB, HBAN, MTB, PNC, RF, TFC, USB, and ZION; (1) Reflects adjusted total noninterest income and adjusted taxable-equivalent revenue, non-GAAP measures: see appendix for reconciliation Noninterest Income Revenue Contribution 11
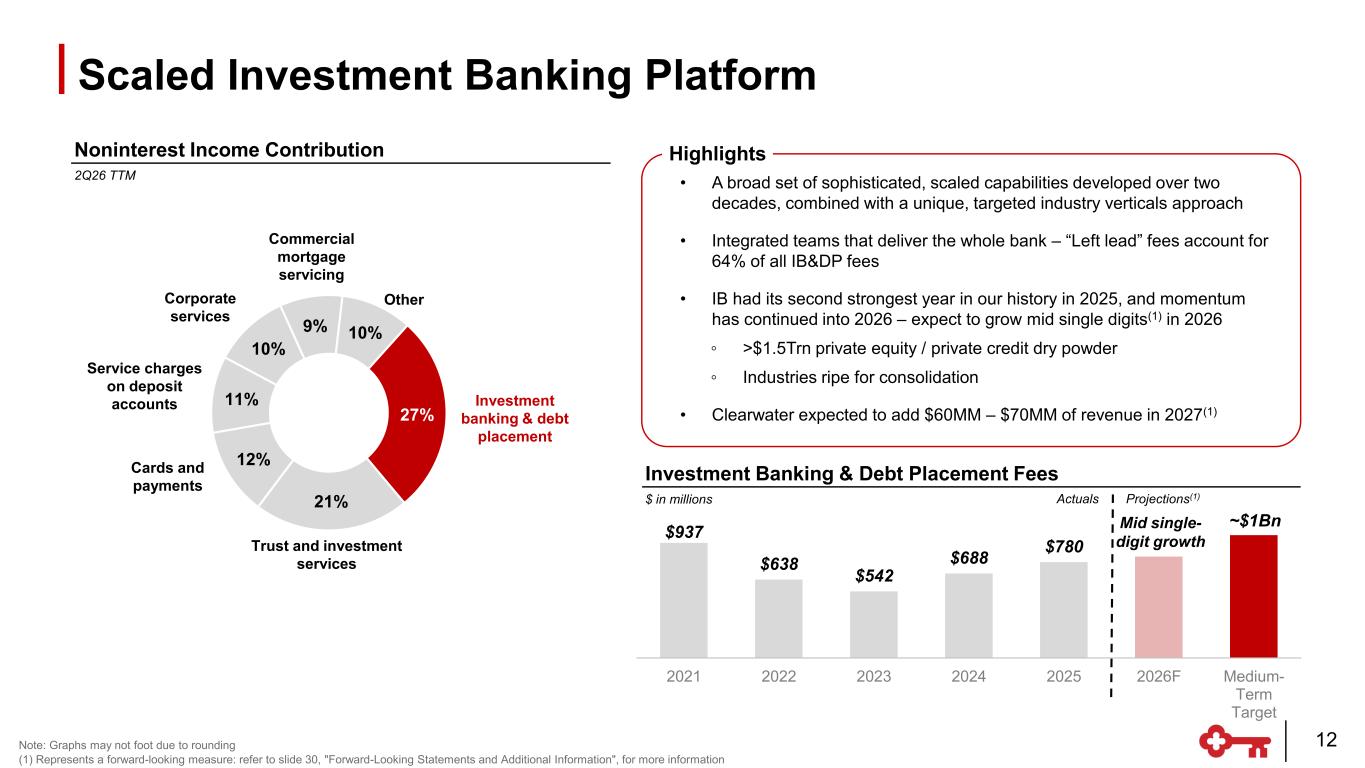
• A broad set of sophisticated, scaled capabilities developed over two decades, combined with a unique, targeted industry verticals approach • Integrated teams that deliver the whole bank – “Left lead” fees account for 64% of all IB&DP fees • IB had its second strongest year in our history in 2025, and momentum has continued into 2026 – expect to grow mid single digits(1) in 2026 ◦ >$1.5Trn private equity / private credit dry powder ◦ Industries ripe for consolidation • Clearwater expected to add $60MM – $70MM of revenue in 2027(1) Highlights Scaled Investment Banking Platform 27% 21% 12% 11% 10% 9% 10% Investment banking & debt placement Trust and investment services Cards and payments Service charges on deposit accounts Corporate services Commercial mortgage servicing Other $937 $638 $542 $688 $780 2021 2022 2023 2024 2025 2026F Medium- Term Target Mid single- digit growth ~$1Bn Actuals 12Note: Graphs may not foot due to rounding (1) Represents a forward-looking measure: refer to slide 30, "Forward-Looking Statements and Additional Information", for more information Investment Banking & Debt Placement Fees $ in millions Noninterest Income Contribution 2Q26 TTM Projections(1)
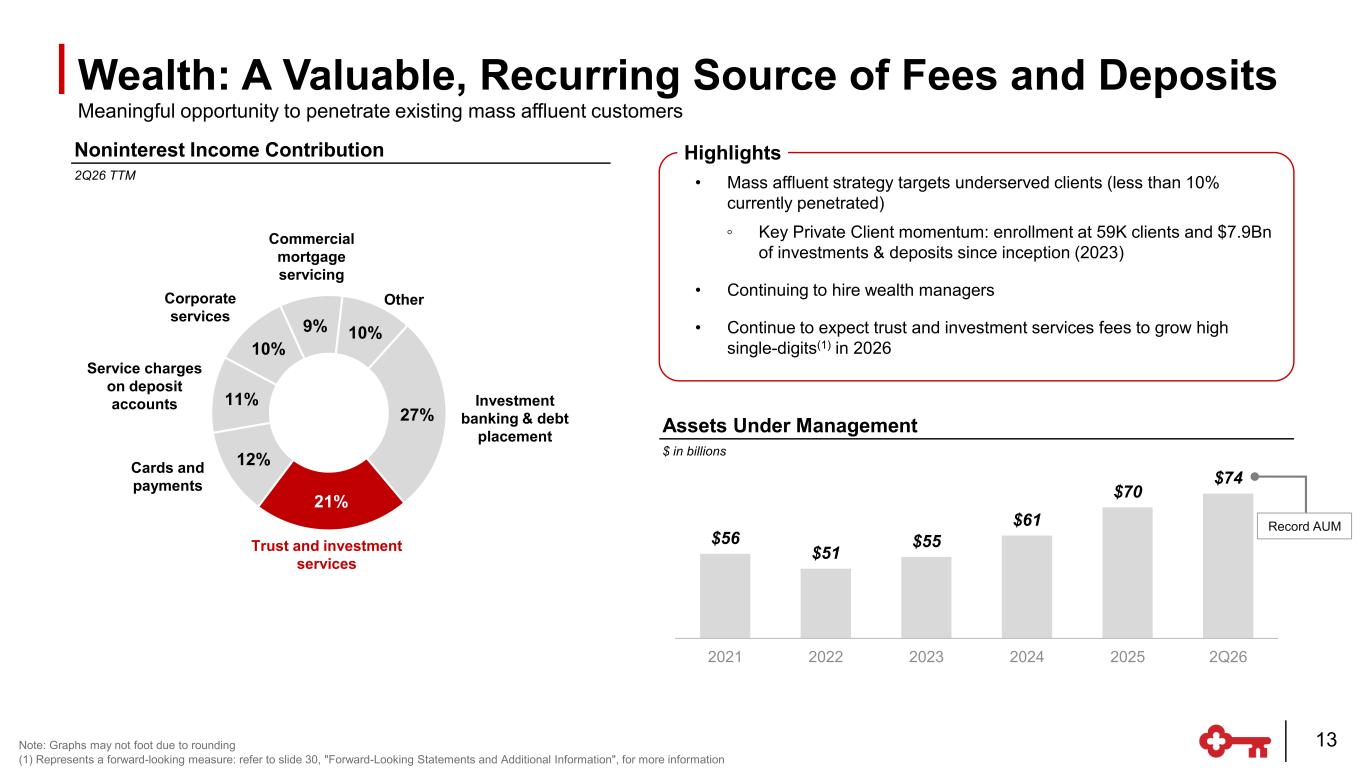
Assets Under Management $ in billions Wealth: A Valuable, Recurring Source of Fees and Deposits $56 $51 $55 $61 $70 $74 2021 2022 2023 2024 2025 2Q26 Meaningful opportunity to penetrate existing mass affluent customers 13 Record AUM • Mass affluent strategy targets underserved clients (less than 10% currently penetrated) ◦ Key Private Client momentum: enrollment at 59K clients and $7.9Bn of investments & deposits since inception (2023) • Continuing to hire wealth managers • Continue to expect trust and investment services fees to grow high single-digits(1) in 2026 HighlightsNoninterest Income Contribution 2Q26 TTM Note: Graphs may not foot due to rounding (1) Represents a forward-looking measure: refer to slide 30, "Forward-Looking Statements and Additional Information", for more information 27% 21% 12% 11% 10% 9% 10% Investment banking & debt placement Trust and investment services Cards and payments Service charges on deposit accounts Corporate services Commercial mortgage servicing Other
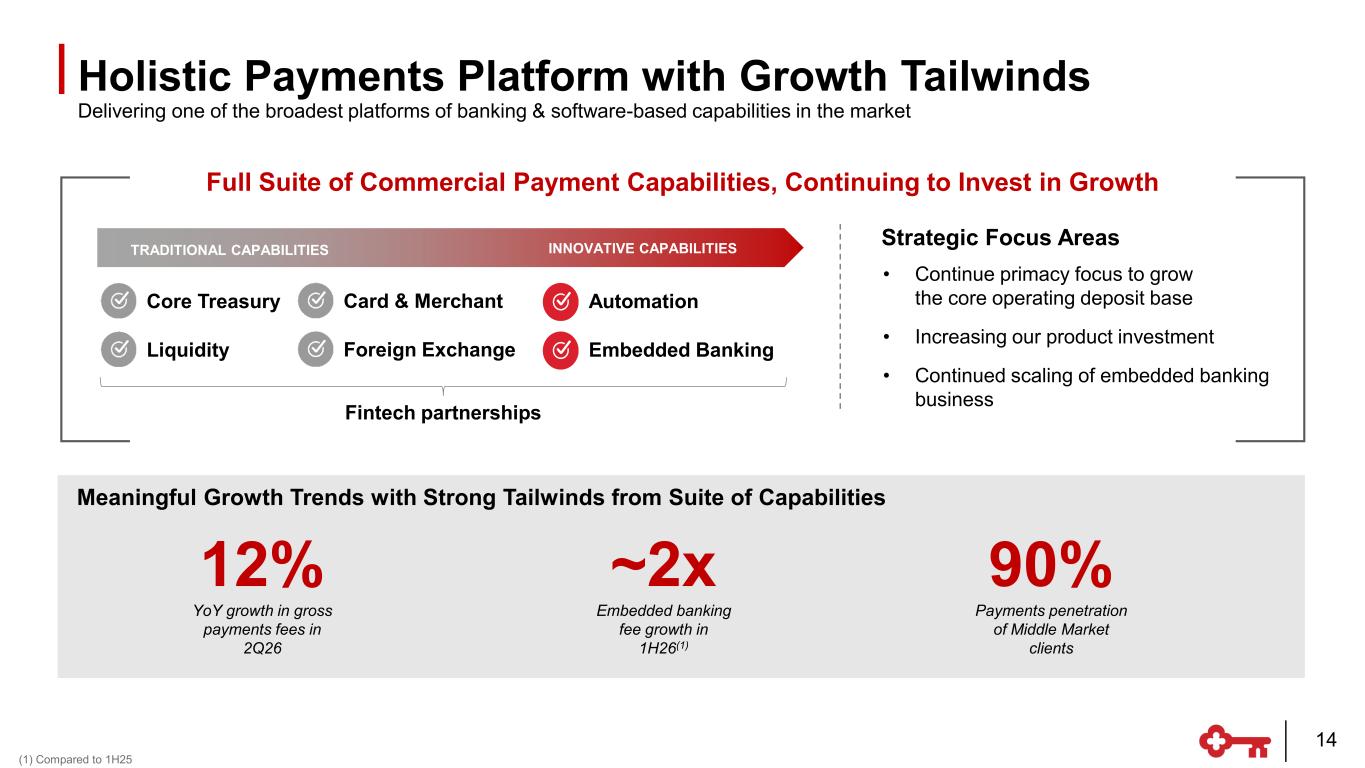
Fintech partnerships TRADITIONAL CAPABILITIES INNOVATIVE CAPABILITIES Core Treasury Liquidity Card & Merchant Foreign Exchange Automation Embedded Banking Strategic Focus Areas • Continue primacy focus to grow the core operating deposit base • Increasing our product investment • Continued scaling of embedded banking business ~2x 90% Payments penetration of Middle Market clients Embedded banking fee growth in 1H26(1) Full Suite of Commercial Payment Capabilities, Continuing to Invest in Growth Holistic Payments Platform with Growth Tailwinds Delivering one of the broadest platforms of banking & software-based capabilities in the market 14 (1) Compared to 1H25 12% YoY growth in gross payments fees in 2Q26 Meaningful Growth Trends with Strong Tailwinds from Suite of Capabilities
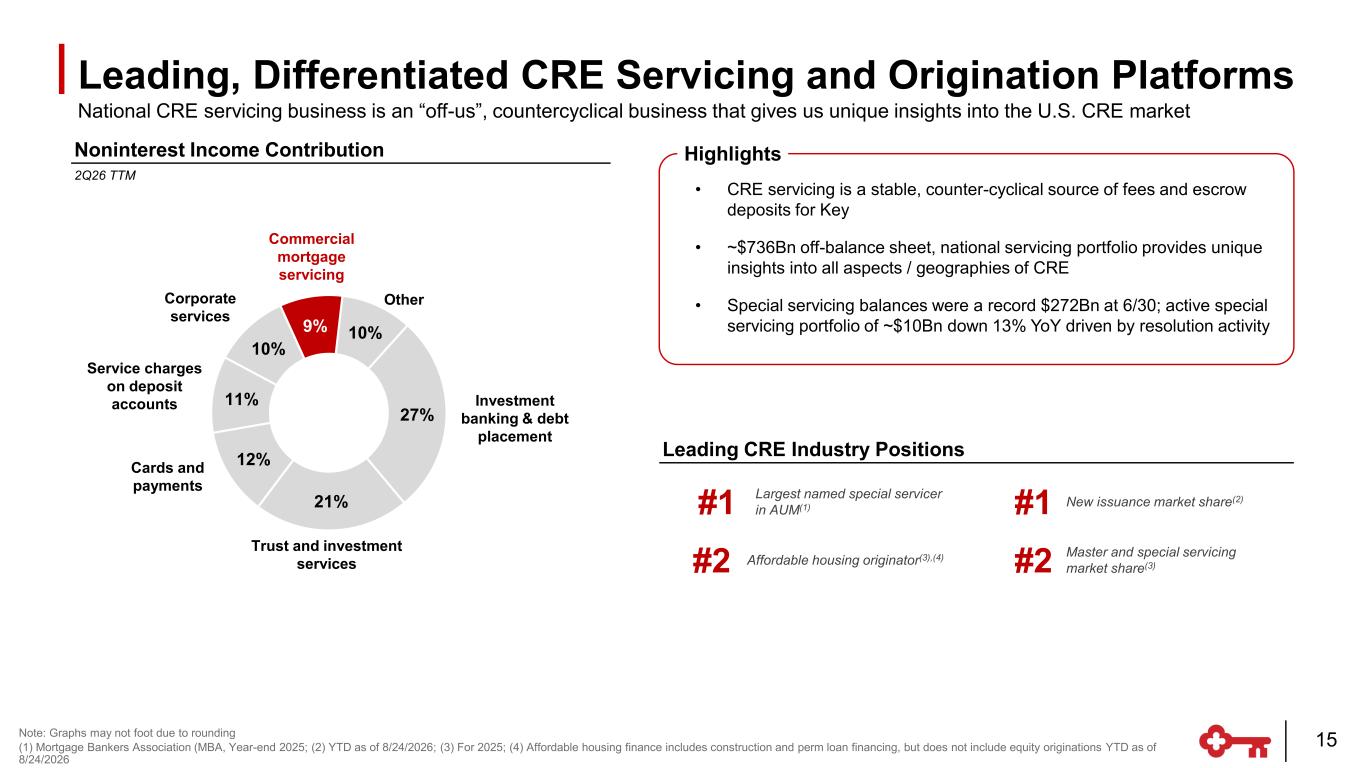
Leading, Differentiated CRE Servicing and Origination Platforms Largest named special servicer in AUM(1)#1 #2 Affordable housing originator(3),(4) Master and special servicing market share(3)#2 New issuance market share(2)#1 National CRE servicing business is an “off-us”, countercyclical business that gives us unique insights into the U.S. CRE market 15 Note: Graphs may not foot due to rounding (1) Mortgage Bankers Association (MBA, Year-end 2025; (2) YTD as of 8/24/2026; (3) For 2025; (4) Affordable housing finance includes construction and perm loan financing, but does not include equity originations YTD as of 8/24/2026 • CRE servicing is a stable, counter-cyclical source of fees and escrow deposits for Key • ~$736Bn off-balance sheet, national servicing portfolio provides unique insights into all aspects / geographies of CRE • Special servicing balances were a record $272Bn at 6/30; active special servicing portfolio of ~$10Bn down 13% YoY driven by resolution activity Leading CRE Industry Positions HighlightsNoninterest Income Contribution 2Q26 TTM 27% 21% 12% 11% 10% 9% 10% Investment banking & debt placement Trust and investment services Cards and payments Service charges on deposit accounts Corporate services Commercial mortgage servicing Other
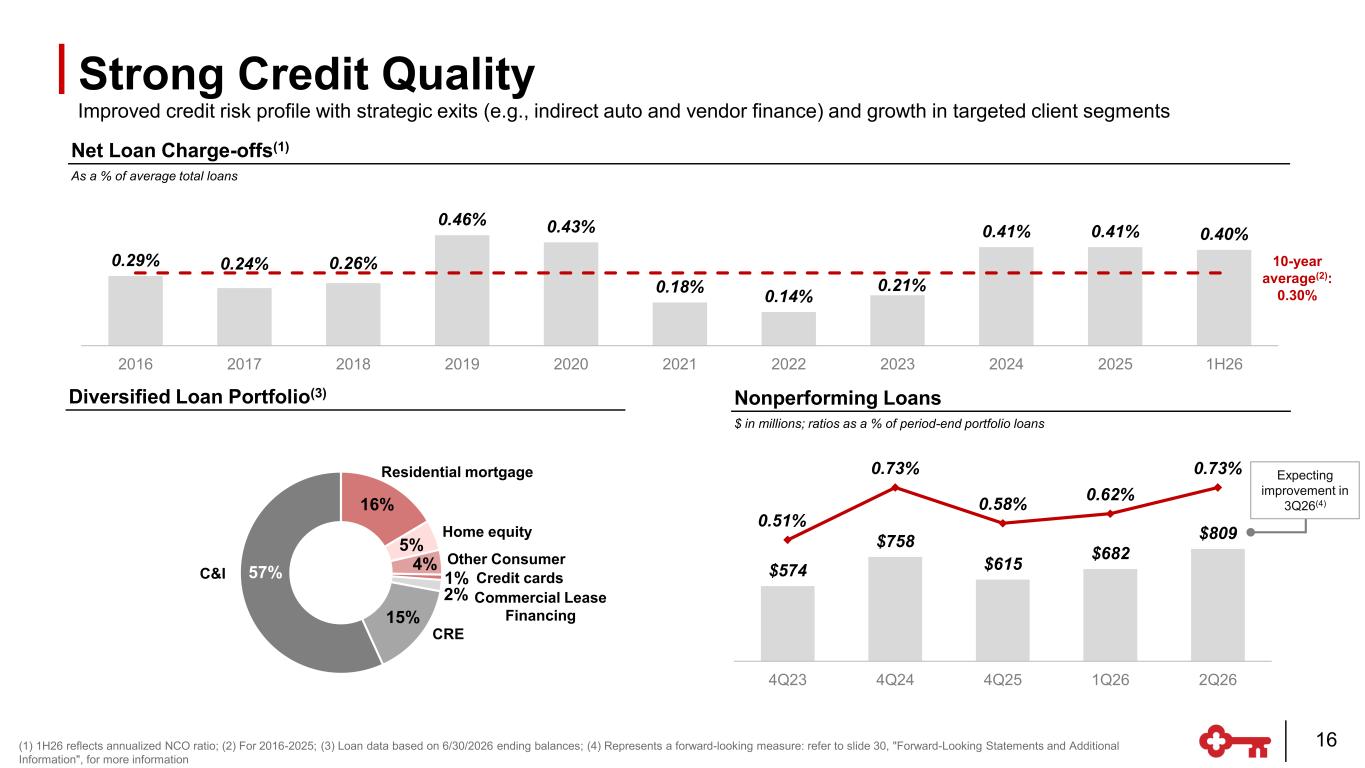
Diversified Loan Portfolio(3) Strong Credit Quality 16% 5% 4% 1% 2% 15% 57% 0.29% 0.24% 0.26% 0.46% 0.43% 0.18% 0.14% 0.21% 0.41% 0.41% 0.40% 2016 2017 2018 2019 2020 2021 2022 2023 2024 2025 1H26 Home equity C&I Credit cards Commercial Lease Financing Other Consumer Residential mortgage CRE 10-year average(2): 0.30% $574 $758 $615 $682 $809 0.51% 0.73% 0.58% 0.62% 0.73% 100 300 500 700 900 1100 1300 0.00% 0.20% 0.40% 0.60% 0.80% 4Q23 4Q24 4Q25 1Q26 2Q26 Improved credit risk profile with strategic exits (e.g., indirect auto and vendor finance) and growth in targeted client segments (1) 1H26 reflects annualized NCO ratio; (2) For 2016-2025; (3) Loan data based on 6/30/2026 ending balances; (4) Represents a forward-looking measure: refer to slide 30, "Forward-Looking Statements and Additional Information", for more information Net Loan Charge-offs(1) As a % of average total loans Nonperforming Loans $ in millions; ratios as a % of period-end portfolio loans 16 Expecting improvement in 3Q26(4)
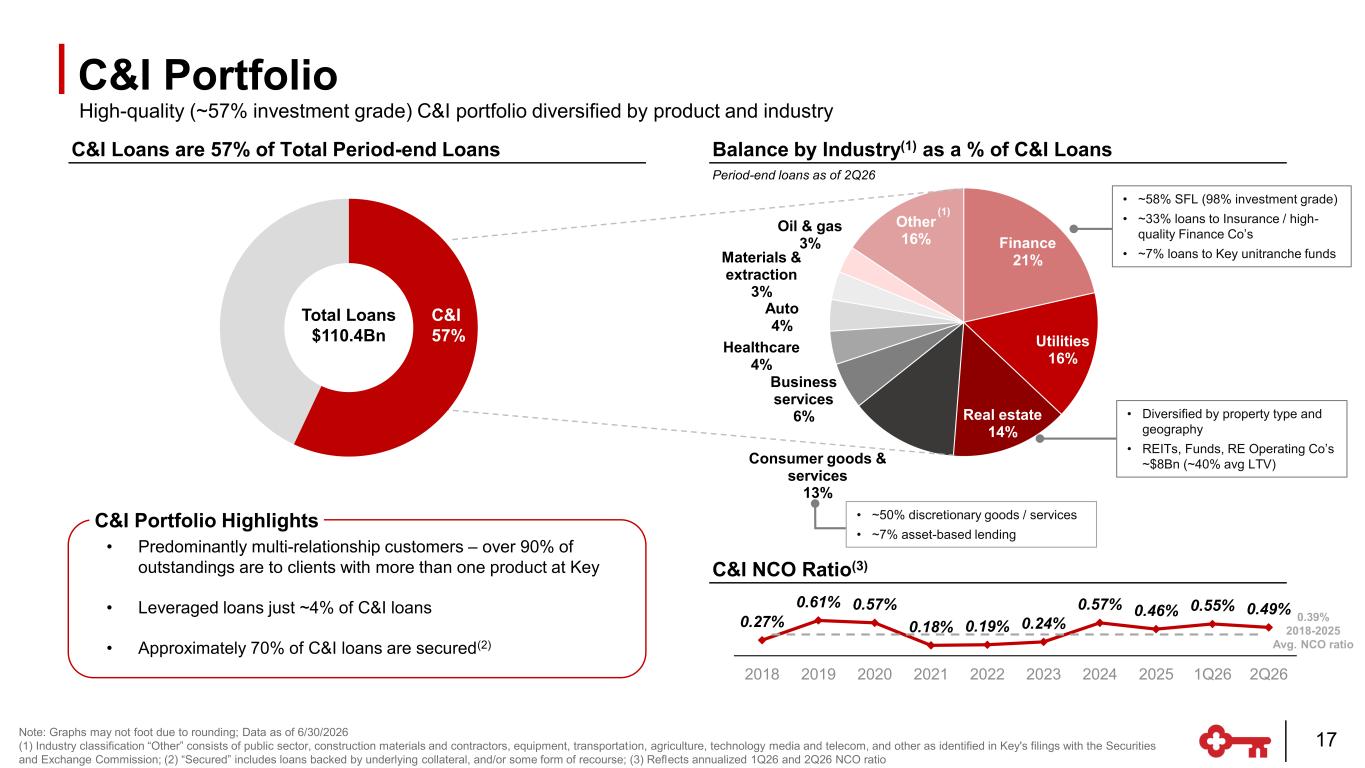
High-quality (~57% investment grade) C&I portfolio diversified by product and industry Finance 21% Utilities 16% Real estate 14% Consumer goods & services 13% Business services 6% Healthcare 4% Auto 4% Materials & extraction 3% Oil & gas 3% Other 16% (1) 0.27% 0.61% 0.57% 0.18% 0.19% 0.24% 0.57% 0.46% 0.55% 0.49% 2018 2019 2020 2021 2022 2023 2024 2025 1Q26 2Q26 Total Loans $110.4Bn C&I 57% 0.39% 2018-2025 Avg. NCO ratio • ~58% SFL (98% investment grade) • ~33% loans to Insurance / high- quality Finance Co’s • ~7% loans to Key unitranche funds • Diversified by property type and geography • REITs, Funds, RE Operating Co’s ~$8Bn (~40% avg LTV) • ~50% discretionary goods / services • ~7% asset-based lending C&I Portfolio Note: Graphs may not foot due to rounding; Data as of 6/30/2026 (1) Industry classification “Other” consists of public sector, construction materials and contractors, equipment, transportat ion, agriculture, technology media and telecom, and other as identified in Key's filings with the Securities and Exchange Commission; (2) “Secured” includes loans backed by underlying collateral, and/or some form of recourse; (3) Reflects annualized 1Q26 and 2Q26 NCO ratio • Predominantly multi-relationship customers – over 90% of outstandings are to clients with more than one product at Key • Leveraged loans just ~4% of C&I loans • Approximately 70% of C&I loans are secured(2) C&I Portfolio Highlights C&I Loans are 57% of Total Period-end Loans Balance by Industry(1) as a % of C&I Loans Period-end loans as of 2Q26 C&I NCO Ratio(3) 17
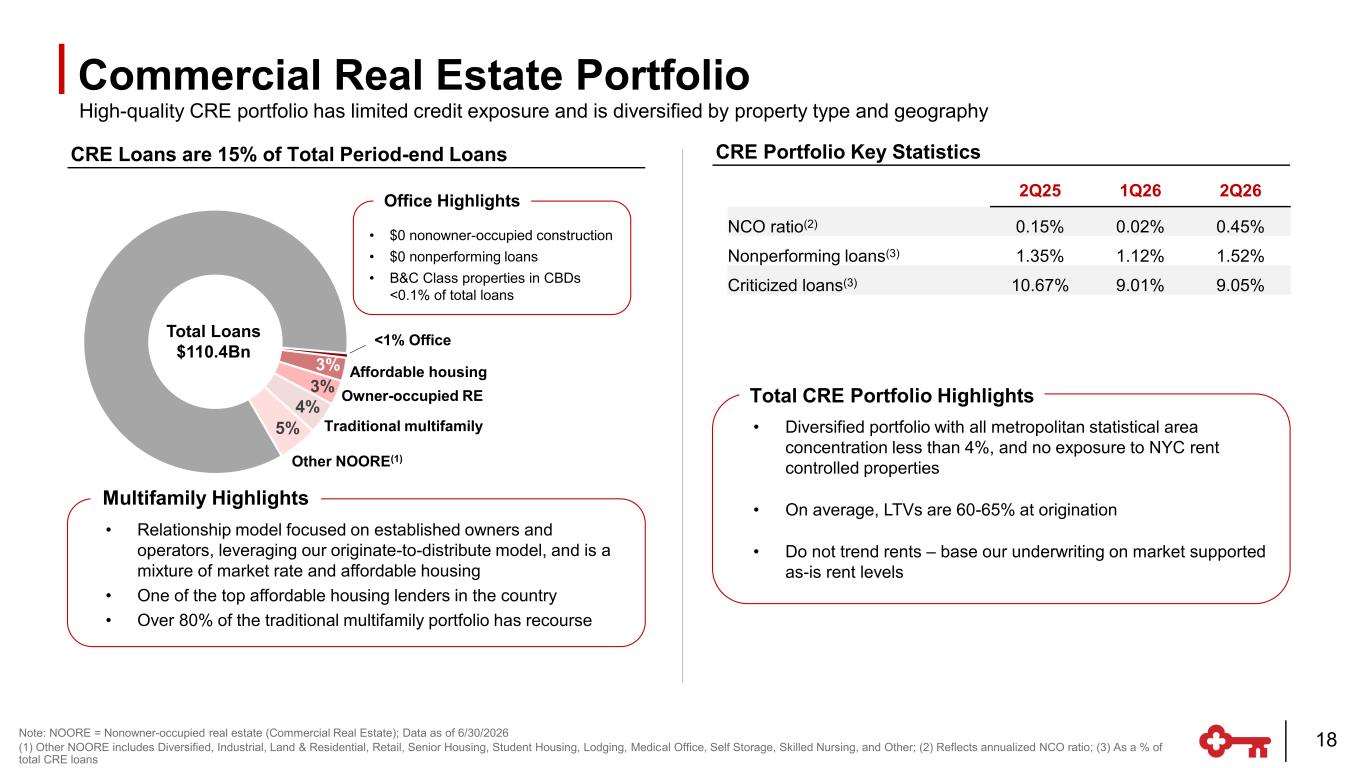
• Diversified portfolio with all metropolitan statistical area concentration less than 4%, and no exposure to NYC rent controlled properties • On average, LTVs are 60-65% at origination • Do not trend rents – base our underwriting on market supported as-is rent levels All other loans • $0 nonowner-occupied construction • $0 nonperforming loans • B&C Class properties in CBDs <0.1% of total loans • Relationship model focused on established owners and operators, leveraging our originate-to-distribute model, and is a mixture of market rate and affordable housing • One of the top affordable housing lenders in the country • Over 80% of the traditional multifamily portfolio has recourse Office Highlights Multifamily Highlights Affordable housing Other NOORE(1) Traditional multifamily 2Q25 1Q26 2Q26 NCO ratio(2) 0.15% 0.02% 0.45% Nonperforming loans(3) 1.35% 1.12% 1.52% Criticized loans(3) 10.67% 9.01% 9.05% <1% Office Owner-occupied RE Commercial Real Estate Portfolio High-quality CRE portfolio has limited credit exposure and is diversified by property type and geography Note: NOORE = Nonowner-occupied real estate (Commercial Real Estate); Data as of 6/30/2026 (1) Other NOORE includes Diversified, Industrial, Land & Residential, Retail, Senior Housing, Student Housing, Lodging, Medical Office, Self Storage, Skilled Nursing, and Other; (2) Reflects annualized NCO ratio; (3) As a % of total CRE loans Total CRE Portfolio Highlights CRE Portfolio Key StatisticsCRE Loans are 15% of Total Period-end Loans 18 3% 3% 4% 5% Total Loans $110.4Bn
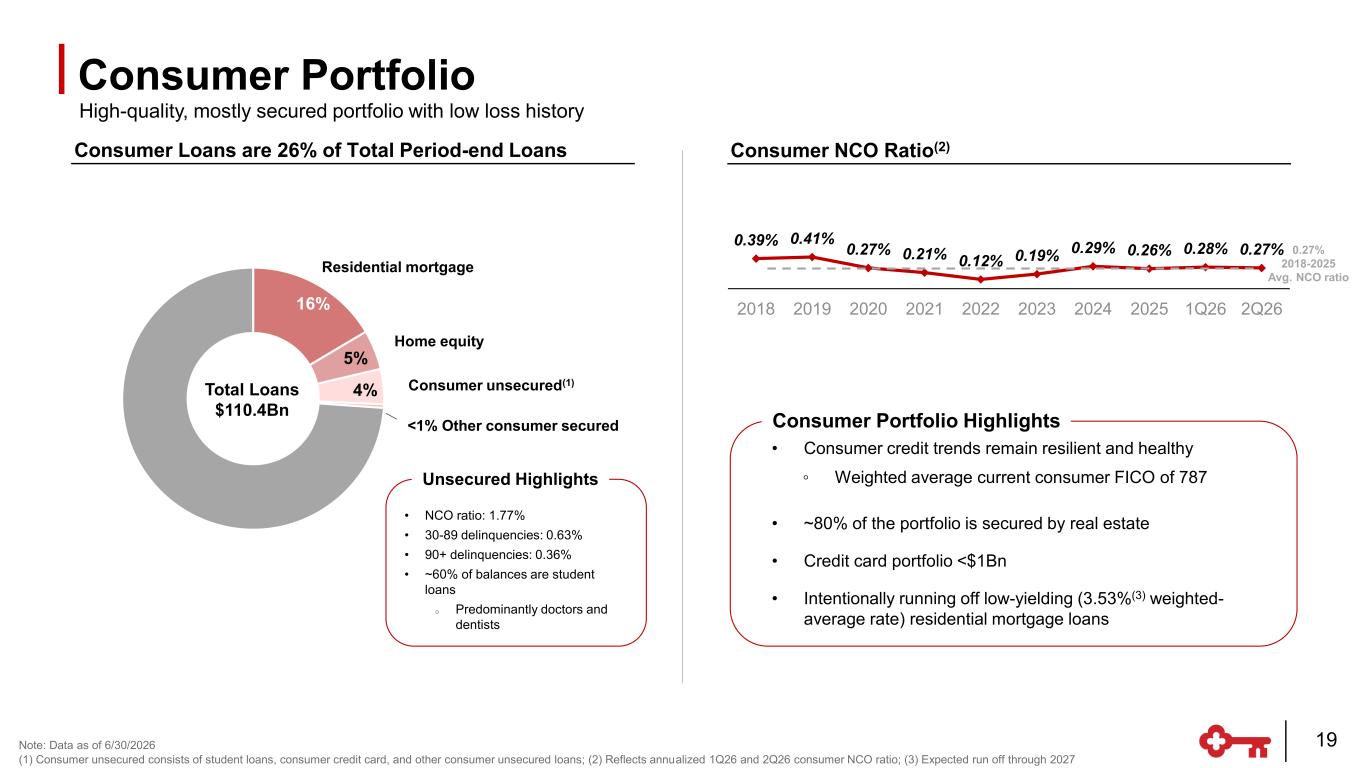
Consumer NCO Ratio(2)Consumer Loans are 26% of Total Period-end Loans High-quality, mostly secured portfolio with low loss history 16% 5% 4% Residential mortgage Home equity Consumer unsecured(1) <1% Other consumer secured • NCO ratio: 1.77% • 30-89 delinquencies: 0.63% • 90+ delinquencies: 0.36% • ~60% of balances are student loans o Predominantly doctors and dentists Unsecured Highlights 0.39% 0.41% 0.27% 0.21% 0.12% 0.19% 0.29% 0.26% 0.28% 0.27% 2018 2019 2020 2021 2022 2023 2024 2025 1Q26 2Q26 0.27% 2018-2025 Avg. NCO ratio Consumer Portfolio Note: Data as of 6/30/2026 Note: Data as of 3/31/2026 (1) Consumer unsecured consists of student loans, consumer credit card, and other consumer unsecured loans; (2) Reflects annualized 1Q26 and 2Q26 consumer NCO ratio; (3) Expected run off through 2027 • Consumer credit trends remain resilient and healthy ◦ Weighted average current consumer FICO of 787 • ~80% of the portfolio is secured by real estate • Credit card portfolio <$1Bn • Intentionally running off low-yielding (3.53%(3) weighted- average rate) residential mortgage loans Consumer Portfolio Highlights 19 Total Loans $110.4Bn
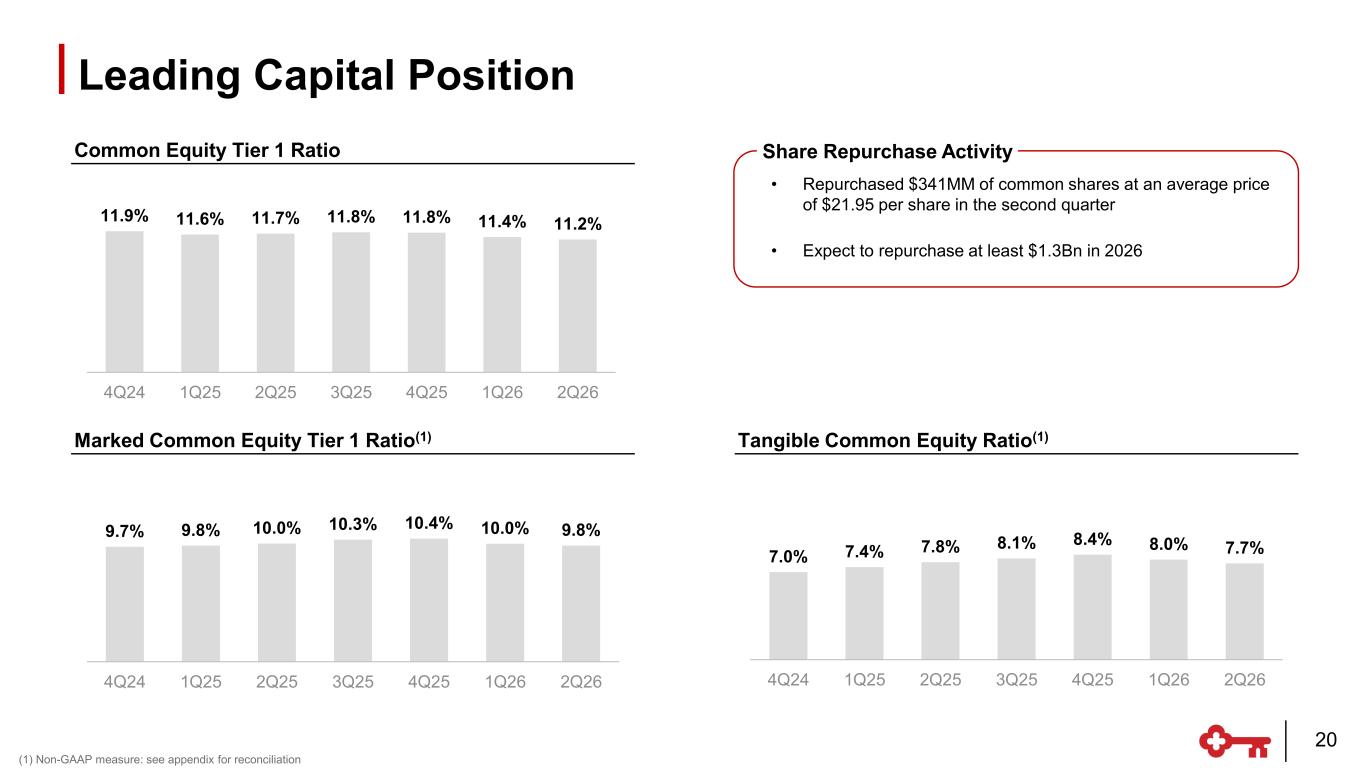
Common Equity Tier 1 Ratio Marked Common Equity Tier 1 Ratio(1) 9.7% 9.8% 10.0% 10.3% 10.4% 10.0% 9.8% 4Q24 1Q25 2Q25 3Q25 4Q25 1Q26 2Q26 7.0% 7.4% 7.8% 8.1% 8.4% 8.0% 7.7% 4Q24 1Q25 2Q25 3Q25 4Q25 1Q26 2Q26 11.9% 11.6% 11.7% 11.8% 11.8% 11.4% 11.2% 4Q24 1Q25 2Q25 3Q25 4Q25 1Q26 2Q26 Leading Capital Position • Repurchased $341MM of common shares at an average price of $21.95 per share in the second quarter • Expect to repurchase at least $1.3Bn in 2026 Share Repurchase Activity 20 (1) Non-GAAP measure: see appendix for reconciliation Tangible Common Equity Ratio(1)
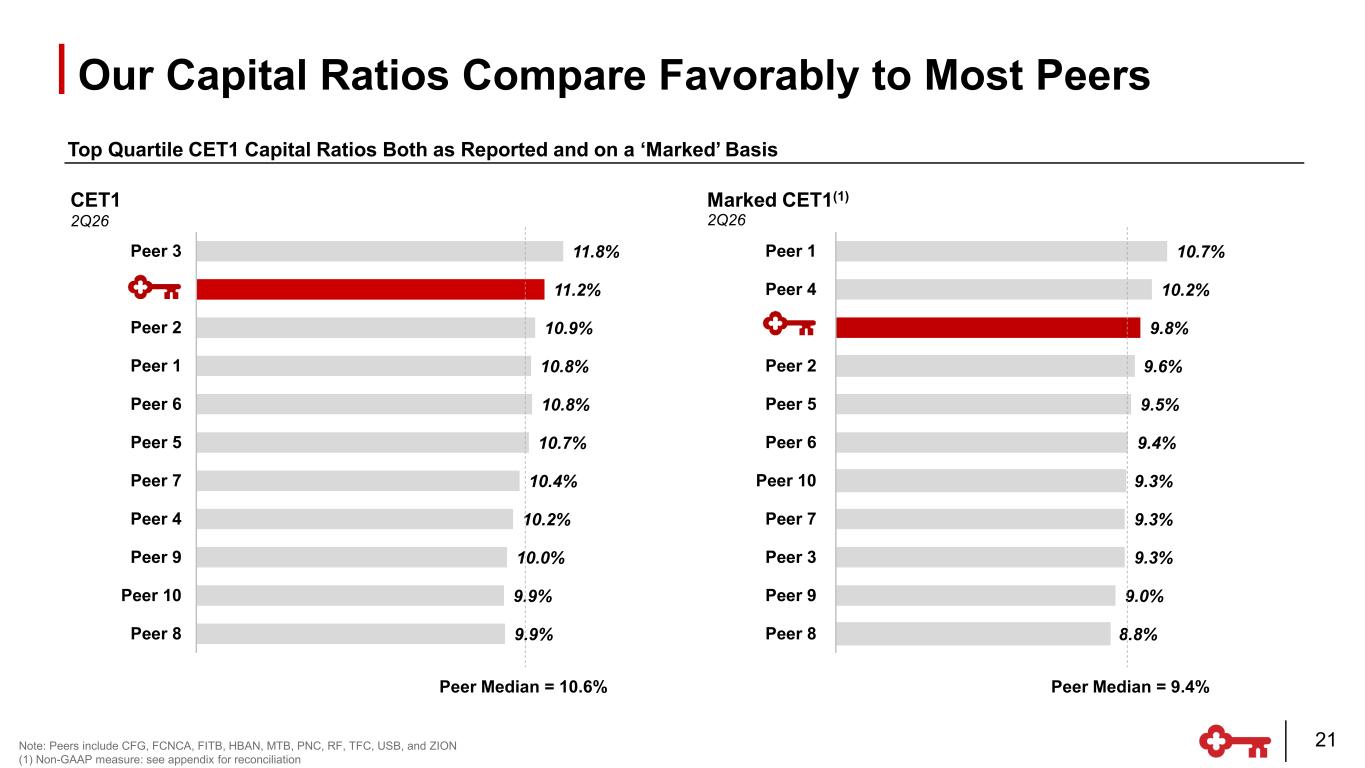
10.7% 10.2% 9.8% 9.6% 9.5% 9.4% 9.3% 9.3% 9.3% 9.0% 8.8% Peer 1 Peer 4 Peer 2 Peer 5 Peer 6 Peer 10 Peer 7 Peer 3 Peer 9 Peer 8 2Q26 2Q26 CET1 Marked CET1(1) Peer Median = 9.4%Peer Median = 10.6% 11.8% 11.2% 10.9% 10.8% 10.8% 10.7% 10.4% 10.2% 10.0% 9.9% 9.9% Peer 3 Peer 2 Peer 1 Peer 6 Peer 5 Peer 7 Peer 4 Peer 9 Peer 10 Peer 8 Our Capital Ratios Compare Favorably to Most Peers 21Note: Peers include CFG, FCNCA, FITB, HBAN, MTB, PNC, RF, TFC, USB, and ZION (1) Non-GAAP measure: see appendix for reconciliation Top Quartile CET1 Capital Ratios Both as Reported and on a ‘Marked’ Basis
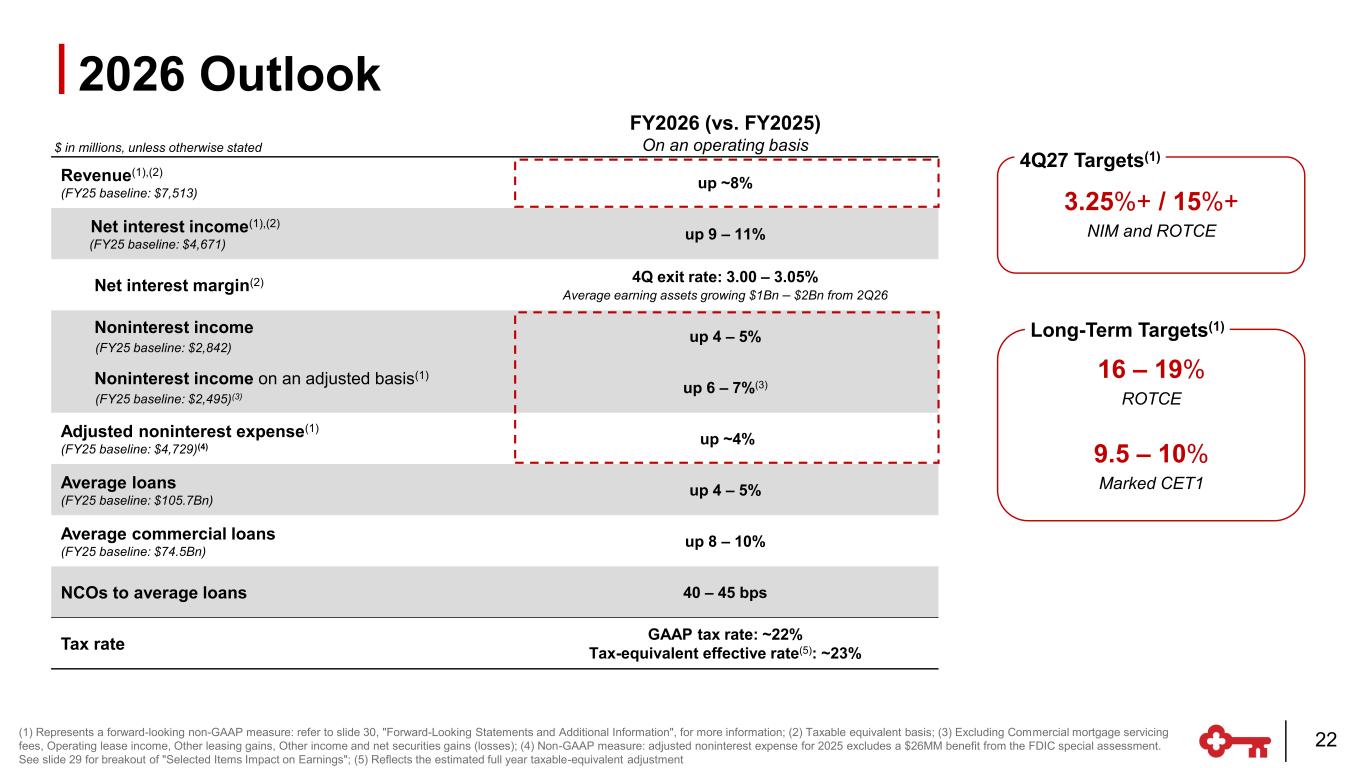
16 – 19% ROTCE 9.5 – 10% Marked CET1 3.25%+ / 15%+ NIM and ROTCE (1) Represents a forward-looking non-GAAP measure: refer to slide 30, "Forward-Looking Statements and Additional Information", for more information; (2) Taxable equivalent basis; (3) Excluding Commercial mortgage servicing fees, Operating lease income, Other leasing gains, Other income and net securities gains (losses); (4) Non-GAAP measure: adjusted noninterest expense for 2025 excludes a $26MM benefit from the FDIC special assessment. See slide 29 for breakout of "Selected Items Impact on Earnings"; (5) Reflects the estimated full year taxable-equivalent adjustment 2026 Outlook Long-Term Targets(1) 4Q27 Targets(1) 22 $ in millions, unless otherwise stated FY2026 (vs. FY2025) On an operating basis Revenue(1),(2) (FY25 baseline: $7,513) up ~8% Net interest income(1),(2) (FY25 baseline: $4,671) up 9 – 11% Net interest margin(2) 4Q exit rate: 3.00 – 3.05% Average earning assets growing $1Bn – $2Bn from 2Q26 Noninterest income (FY25 baseline: $2,842) up 4 – 5% Noninterest income on an adjusted basis(1) (FY25 baseline: $2,495)(3) up 6 – 7%(3) Adjusted noninterest expense(1) (FY25 baseline: $4,729)(4) up ~4% Average loans (FY25 baseline: $105.7Bn) up 4 – 5% Average commercial loans (FY25 baseline: $74.5Bn) up 8 – 10% NCOs to average loans 40 – 45 bps Tax rate GAAP tax rate: ~22% Tax-equivalent effective rate(5): ~23%
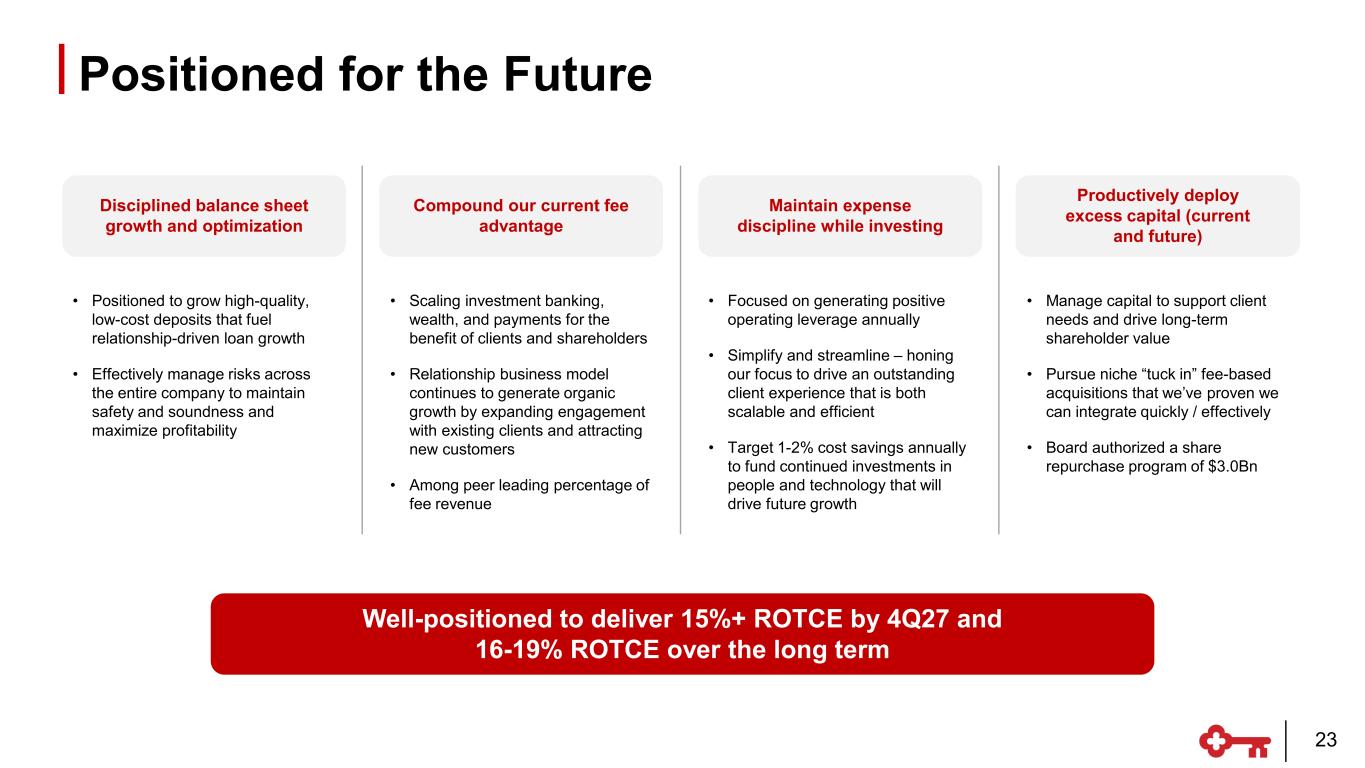
• Positioned to grow high-quality, low-cost deposits that fuel relationship-driven loan growth • Effectively manage risks across the entire company to maintain safety and soundness and maximize profitability • Scaling investment banking, wealth, and payments for the benefit of clients and shareholders • Relationship business model continues to generate organic growth by expanding engagement with existing clients and attracting new customers • Among peer leading percentage of fee revenue • Focused on generating positive operating leverage annually • Simplify and streamline – honing our focus to drive an outstanding client experience that is both scalable and efficient • Target 1-2% cost savings annually to fund continued investments in people and technology that will drive future growth • Manage capital to support client needs and drive long-term shareholder value • Pursue niche “tuck in” fee-based acquisitions that we’ve proven we can integrate quickly / effectively • Board authorized a share repurchase program of $3.0Bn Disciplined balance sheet growth and optimization Maintain expense discipline while investing Compound our current fee advantage Productively deploy excess capital (current and future) Well-positioned to deliver 15%+ ROTCE by 4Q27 and 16-19% ROTCE over the long term Positioned for the Future 23

Appendix
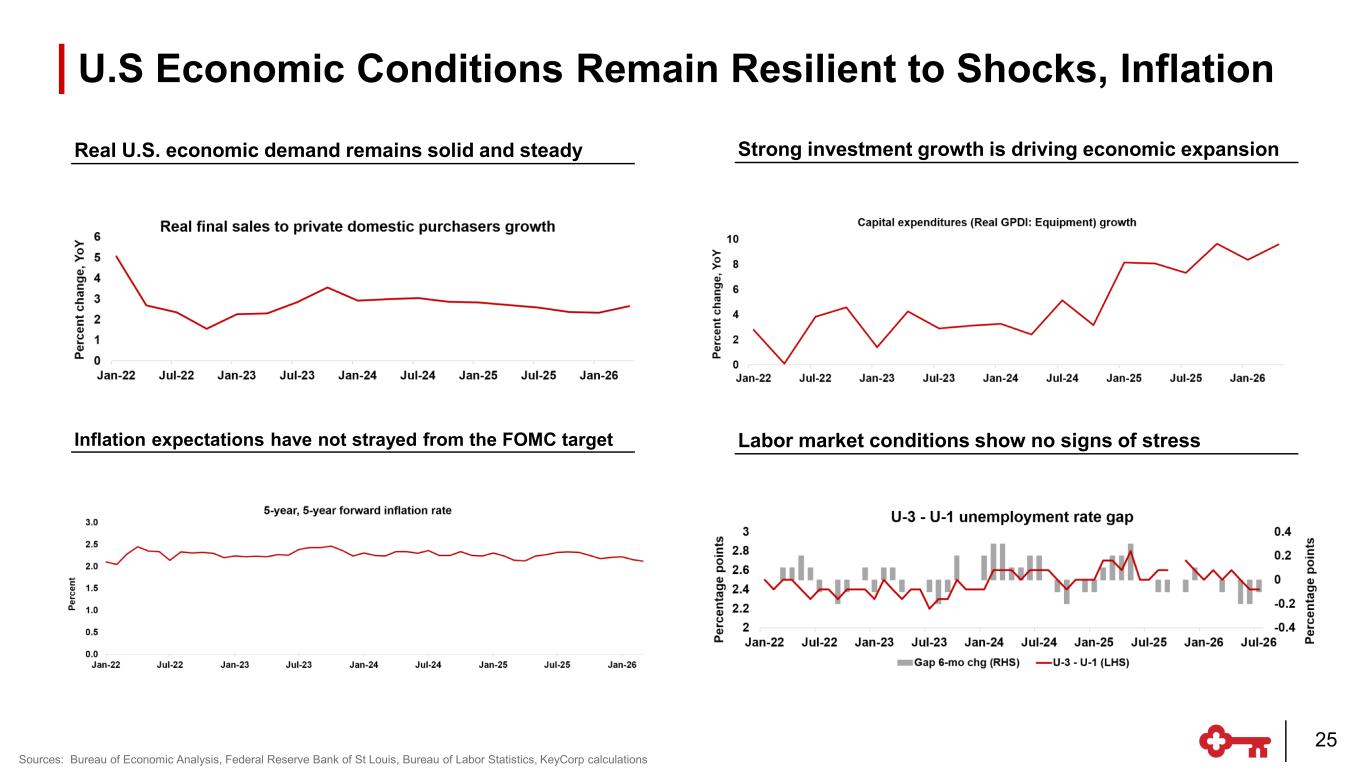
U.S Economic Conditions Remain Resilient to Shocks, Inflation 25 Sources: Bureau of Economic Analysis, Federal Reserve Bank of St Louis, Bureau of Labor Statistics, KeyCorp calculations Inflation expectations have not strayed from the FOMC target Real U.S. economic demand remains solid and steady Labor market conditions show no signs of stress Strong investment growth is driving economic expansion
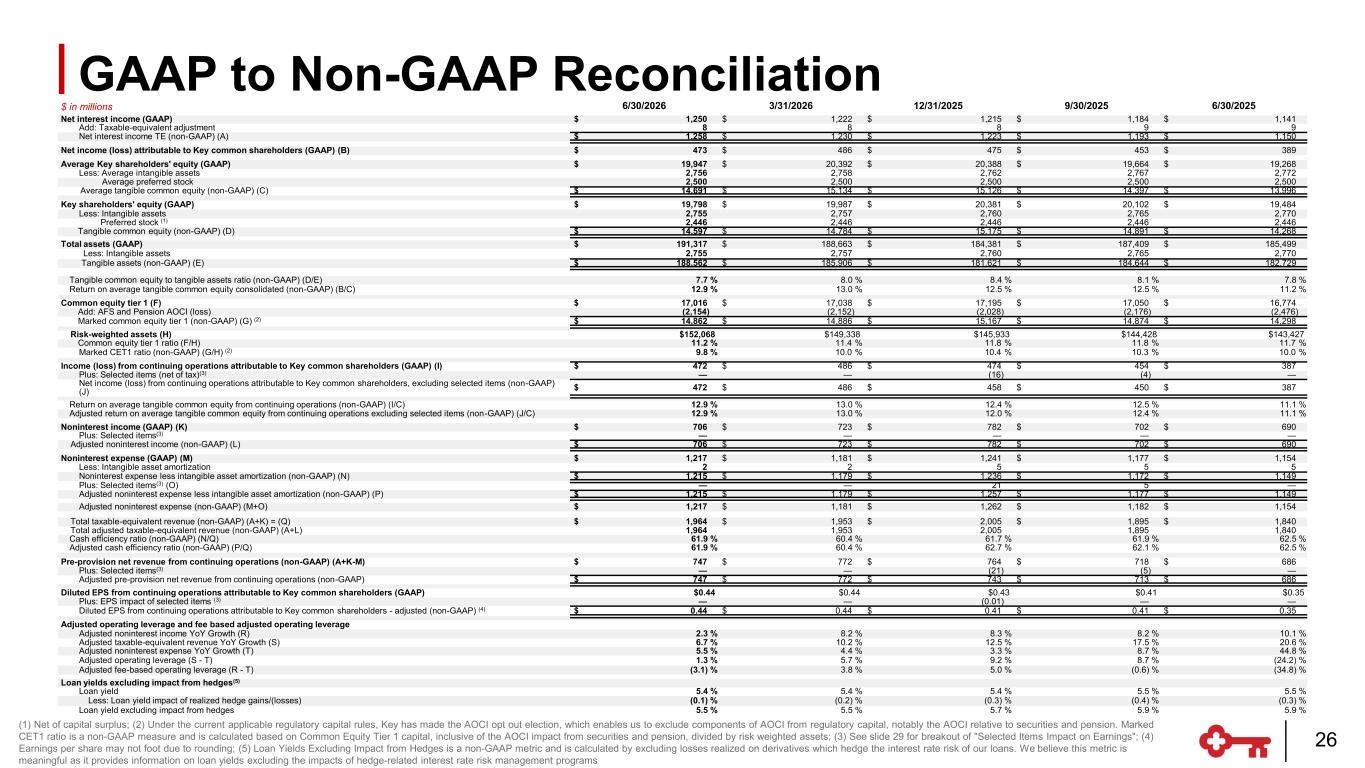
$ in millions 6/30/2026 3/31/2026 12/31/2025 9/30/2025 6/30/2025 Net interest income (GAAP) $ 1,250 $ 1,222 $ 1,215 $ 1,184 $ 1,141 Add: Taxable-equivalent adjustment 8 8 8 9 9 Net interest income TE (non-GAAP) (A) $ 1,258 $ 1,230 $ 1,223 $ 1,193 $ 1,150 Net income (loss) attributable to Key common shareholders (GAAP) (B) $ 473 $ 486 $ 475 $ 453 $ 389 Average Key shareholders' equity (GAAP) $ 19,947 $ 20,392 $ 20,388 $ 19,664 $ 19,268 Less: Average intangible assets 2,756 2,758 2,762 2,767 2,772 Average preferred stock 2,500 2,500 2,500 2,500 2,500 Average tangible common equity (non-GAAP) (C) $ 14,691 $ 15,134 $ 15,126 $ 14,397 $ 13,996 Key shareholders' equity (GAAP) $ 19,798 $ 19,987 $ 20,381 $ 20,102 $ 19,484 Less: Intangible assets 2,755 2,757 2,760 2,765 2,770 Preferred stock (1) 2,446 2,446 2,446 2,446 2,446 Tangible common equity (non-GAAP) (D) $ 14,597 $ 14,784 $ 15,175 $ 14,891 $ 14,268 Total assets (GAAP) $ 191,317 $ 188,663 $ 184,381 $ 187,409 $ 185,499 Less: Intangible assets 2,755 2,757 2,760 2,765 2,770 Tangible assets (non-GAAP) (E) $ 188,562 $ 185,906 $ 181,621 $ 184,644 $ 182,729 Tangible common equity to tangible assets ratio (non-GAAP) (D/E) 7.7 % 8.0 % 8.4 % 8.1 % 7.8 % Return on average tangible common equity consolidated (non-GAAP) (B/C) 12.9 % 13.0 % 12.5 % 12.5 % 11.2 % Common equity tier 1 (F) $ 17,016 $ 17,038 $ 17,195 $ 17,050 $ 16,774 Add: AFS and Pension AOCI (loss) (2,154) (2,152) (2,028) (2,176) (2,476) Marked common equity tier 1 (non-GAAP) (G) (2) $ 14,862 $ 14,886 $ 15,167 $ 14,874 $ 14,298 Risk-weighted assets (H) $152,068 $149,338 $145,933 $144,428 $143,427 Common equity tier 1 ratio (F/H) 11.2 % 11.4 % 11.8 % 11.8 % 11.7 % Marked CET1 ratio (non-GAAP) (G/H) (2) 9.8 % 10.0 % 10.4 % 10.3 % 10.0 % Income (loss) from continuing operations attributable to Key common shareholders (GAAP) (I) $ 472 $ 486 $ 474 $ 454 $ 387 Plus: Selected items (net of tax)(3) — — (16) (4) — Net income (loss) from continuing operations attributable to Key common shareholders, excluding selected items (non-GAAP) (J) $ 472 $ 486 $ 458 $ 450 $ 387 Return on average tangible common equity from continuing operations (non-GAAP) (I/C) 12.9 % 13.0 % 12.4 % 12.5 % 11.1 % Adjusted return on average tangible common equity from continuing operations excluding selected items (non-GAAP) (J/C) 12.9 % 13.0 % 12.0 % 12.4 % 11.1 % Noninterest income (GAAP) (K) $ 706 $ 723 $ 782 $ 702 $ 690 Plus: Selected items(3) — — — — — Adjusted noninterest income (non-GAAP) (L) $ 706 $ 723 $ 782 $ 702 $ 690 Noninterest expense (GAAP) (M) $ 1,217 $ 1,181 $ 1,241 $ 1,177 $ 1,154 Less: Intangible asset amortization 2 2 5 5 5 Noninterest expense less intangible asset amortization (non-GAAP) (N) $ 1,215 $ 1,179 $ 1,236 $ 1,172 $ 1,149 Plus: Selected items(3) (O) — — 21 5 — Adjusted noninterest expense less intangible asset amortization (non-GAAP) (P) $ 1,215 $ 1,179 $ 1,257 $ 1,177 $ 1,149 Adjusted noninterest expense (non-GAAP) (M+O) $ 1,217 $ 1,181 $ 1,262 $ 1,182 $ 1,154 Total taxable-equivalent revenue (non-GAAP) (A+K) = (Q) $ 1,964 $ 1,953 $ 2,005 $ 1,895 $ 1,840 Total adjusted taxable-equivalent revenue (non-GAAP) (A+L) 1,964 1,953 2,005 1,895 1,840 Cash efficiency ratio (non-GAAP) (N/Q) 61.9 % 60.4 % 61.7 % 61.9 % 62.5 % Adjusted cash efficiency ratio (non-GAAP) (P/Q) 61.9 % 60.4 % 62.7 % 62.1 % 62.5 % Pre-provision net revenue from continuing operations (non-GAAP) (A+K-M) $ 747 $ 772 $ 764 $ 718 $ 686 Plus: Selected items(3) — — (21) (5) — Adjusted pre-provision net revenue from continuing operations (non-GAAP) $ 747 $ 772 $ 743 $ 713 $ 686 Diluted EPS from continuing operations attributable to Key common shareholders (GAAP) $0.44 $0.44 $0.43 $0.41 $0.35 Plus: EPS impact of selected items (3) — — (0.01) — — Diluted EPS from continuing operations attributable to Key common shareholders - adjusted (non-GAAP) (4) $ 0.44 $ 0.44 $ 0.41 $ 0.41 $ 0.35 Adjusted operating leverage and fee based adjusted operating leverage Adjusted noninterest income YoY Growth (R) 2.3 % 8.2 % 8.3 % 8.2 % 10.1 % Adjusted taxable-equivalent revenue YoY Growth (S) 6.7 % 10.2 % 12.5 % 17.5 % 20.6 % Adjusted noninterest expense YoY Growth (T) 5.5 % 4.4 % 3.3 % 8.7 % 44.8 % Adjusted operating leverage (S - T) 1.3 % 5.7 % 9.2 % 8.7 % (24.2) % Adjusted fee-based operating leverage (R - T) (3.1) % 3.8 % 5.0 % (0.6) % (34.8) % Loan yields excluding impact from hedges(5) Loan yield 5.4 % 5.4 % 5.4 % 5.5 % 5.5 % Less: Loan yield impact of realized hedge gains/(losses) (0.1) % (0.2) % (0.3) % (0.4) % (0.3) % Loan yield excluding impact from hedges 5.5 % 5.5 % 5.7 % 5.9 % 5.9 % (1) Net of capital surplus; (2) Under the current applicable regulatory capital rules, Key has made the AOCI opt out election, which enables us to exclude components of AOCI from regulatory capital, notably the AOCI relative to securities and pension. Marked CET1 ratio is a non-GAAP measure and is calculated based on Common Equity Tier 1 capital, inclusive of the AOCI impact from securities and pension, divided by risk weighted assets; (3) See slide 29 for breakout of "Selected Items Impact on Earnings"; (4) Earnings per share may not foot due to rounding; (5) Loan Yields Excluding Impact from Hedges is a non-GAAP metric and is calculated by excluding losses realized on derivatives which hedge the interest rate risk of our loans. We believe this metric is meaningful as it provides information on loan yields excluding the impacts of hedge-related interest rate risk management programs GAAP to Non-GAAP Reconciliation 26
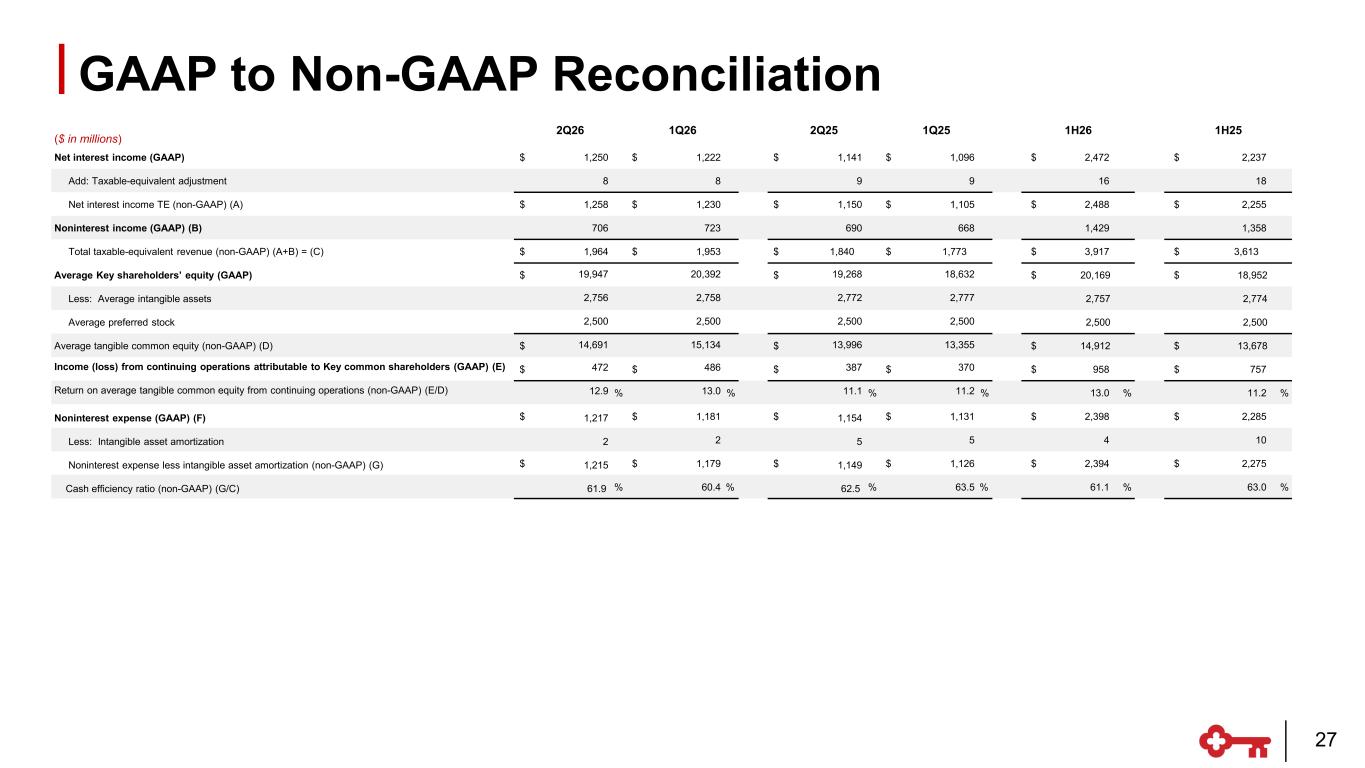
($ in millions) 2Q26 1Q26 2Q25 1Q25 1H26 1H25 Net interest income (GAAP) $ 1,250 $ 1,222 $ 1,141 $ 1,096 $ 2,472 $ 2,237 Add: Taxable-equivalent adjustment 8 8 9 9 16 18 Net interest income TE (non-GAAP) (A) $ 1,258 $ 1,230 $ 1,150 $ 1,105 $ 2,488 $ 2,255 Noninterest income (GAAP) (B) 706 723 690 668 1,429 1,358 Total taxable-equivalent revenue (non-GAAP) (A+B) = (C) $ 1,964 $ 1,953 $ 1,840 $ 1,773 $ 3,917 $ 3,613 Average Key shareholders’ equity (GAAP) $ 19,947 20,392 $ 19,268 18,632 $ 20,169 $ 18,952 Less: Average intangible assets 2,756 2,758 2,772 2,777 2,757 2,774 Average preferred stock 2,500 2,500 2,500 2,500 2,500 2,500 Average tangible common equity (non-GAAP) (D) $ 14,691 15,134 $ 13,996 13,355 $ 14,912 $ 13,678 Income (loss) from continuing operations attributable to Key common shareholders (GAAP) (E) $ 472 $ 486 $ 387 $ 370 $ 958 $ 757 Return on average tangible common equity from continuing operations (non-GAAP) (E/D) 12.9 % 13.0 % 11.1 % 11.2 % 13.0 % 11.2 % Noninterest expense (GAAP) (F) $ 1,217 $ 1,181 $ 1,154 $ 1,131 $ 2,398 $ 2,285 Less: Intangible asset amortization 2 2 5 5 4 10 Noninterest expense less intangible asset amortization (non-GAAP) (G) $ 1,215 $ 1,179 $ 1,149 $ 1,126 $ 2,394 $ 2,275 Cash efficiency ratio (non-GAAP) (G/C) 61.9 % 60.4 % 62.5 % 63.5 % 61.1 % 63.0 % GAAP to Non-GAAP Reconciliation 27
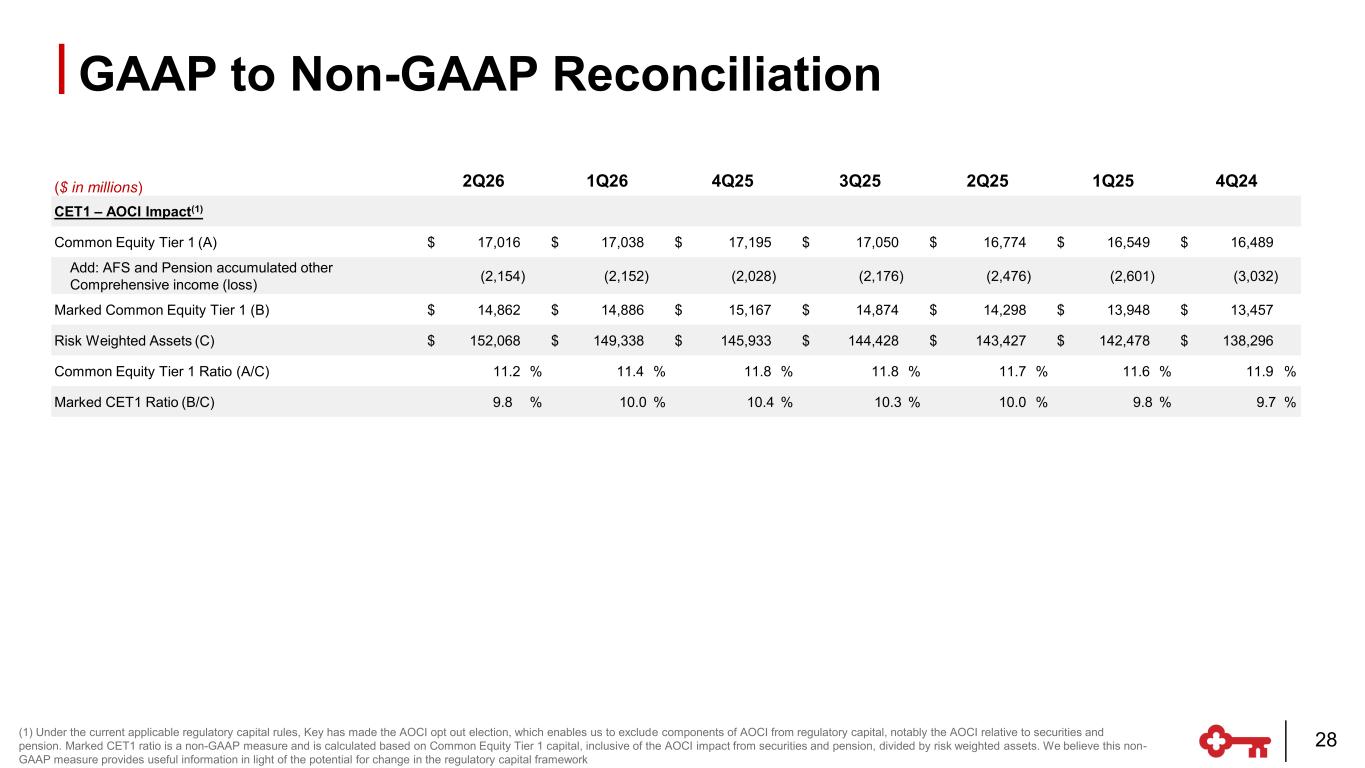
($ in millions) 2Q26 1Q26 4Q25 3Q25 2Q25 1Q25 4Q24 CET1 – AOCI Impact(1) Common Equity Tier 1 (A) $ 17,016 $ 17,038 $ 17,195 $ 17,050 $ 16,774 $ 16,549 $ 16,489 Add: AFS and Pension accumulated other Comprehensive income (loss) (2,154) (2,152) (2,028) (2,176) (2,476) (2,601) (3,032) Marked Common Equity Tier 1 (B) $ 14,862 $ 14,886 $ 15,167 $ 14,874 $ 14,298 $ 13,948 $ 13,457 Risk Weighted Assets (C) $ 152,068 $ 149,338 $ 145,933 $ 144,428 $ 143,427 $ 142,478 $ 138,296 Common Equity Tier 1 Ratio (A/C) 11.2 % 11.4 % 11.8 % 11.8 % 11.7 % 11.6 % 11.9 % Marked CET1 Ratio (B/C) 9.8 % 10.0 % 10.4 % 10.3 % 10.0 % 9.8 % 9.7 % GAAP to Non-GAAP Reconciliation 28 (1) Under the current applicable regulatory capital rules, Key has made the AOCI opt out election, which enables us to exclude components of AOCI from regulatory capital, notably the AOCI relative to securities and pension. Marked CET1 ratio is a non-GAAP measure and is calculated based on Common Equity Tier 1 capital, inclusive of the AOCI impact from securities and pension, divided by risk weighted assets. We believe this non- GAAP measure provides useful information in light of the potential for change in the regulatory capital framework
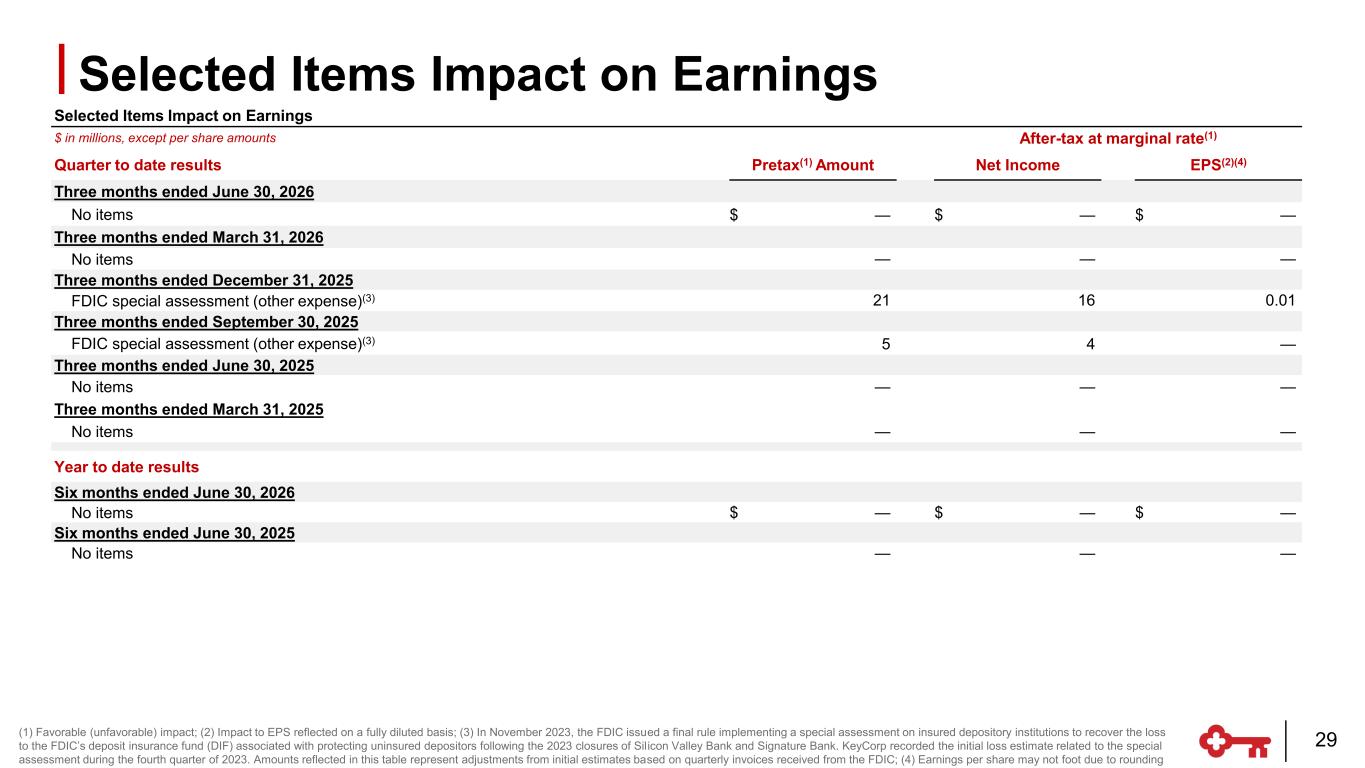
(1) Favorable (unfavorable) impact; (2) Impact to EPS reflected on a fully diluted basis; (3) In November 2023, the FDIC issued a final rule implementing a special assessment on insured depository institutions to recover the loss to the FDIC’s deposit insurance fund (DIF) associated with protecting uninsured depositors following the 2023 closures of Silicon Valley Bank and Signature Bank. KeyCorp recorded the initial loss estimate related to the special assessment during the fourth quarter of 2023. Amounts reflected in this table represent adjustments from initial estimates based on quarterly invoices received from the FDIC; (4) Earnings per share may not foot due to rounding Selected Items Impact on Earnings $ in millions, except per share amounts After-tax at marginal rate(1) Quarter to date results Pretax(1) Amount Net Income EPS(2)(4) Three months ended June 30, 2026 No items $ — $ — $ — Three months ended March 31, 2026 No items — — — Three months ended December 31, 2025 FDIC special assessment (other expense)(3) 21 16 0.01 Three months ended September 30, 2025 FDIC special assessment (other expense)(3) 5 4 — Three months ended June 30, 2025 No items — — — Three months ended March 31, 2025 No items — — — Year to date results Six months ended June 30, 2026 No items $ — $ — $ — Six months ended June 30, 2025 No items — — — Selected Items Impact on Earnings 29
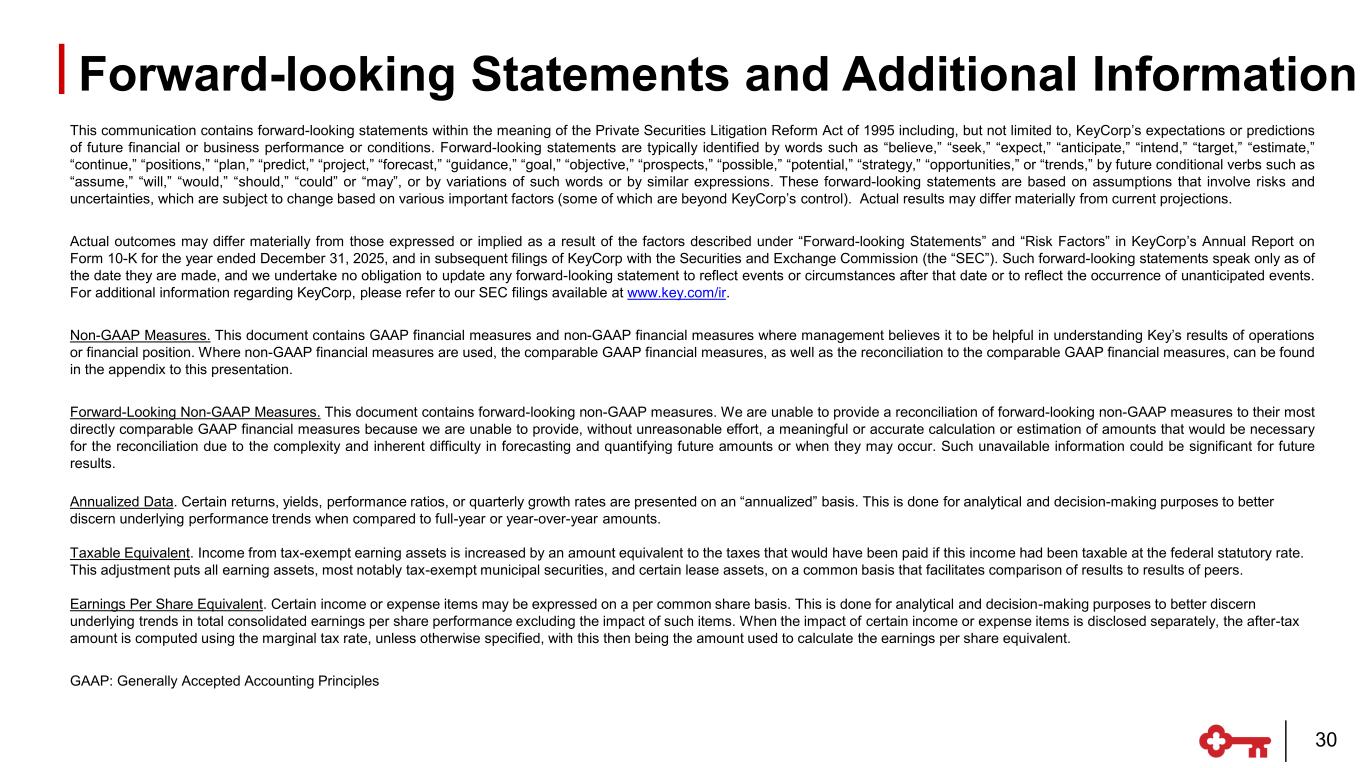
This communication contains forward-looking statements within the meaning of the Private Securities Litigation Reform Act of 1995 including, but not limited to, KeyCorp’s expectations or predictions of future financial or business performance or conditions. Forward-looking statements are typically identified by words such as “believe,” “seek,” “expect,” “anticipate,” “intend,” “target,” “estimate,” “continue,” “positions,” “plan,” “predict,” “project,” “forecast,” “guidance,” “goal,” “objective,” “prospects,” “possible,” “potential,” “strategy,” “opportunities,” or “trends,” by future conditional verbs such as “assume,” “will,” “would,” “should,” “could” or “may”, or by variations of such words or by similar expressions. These forward-looking statements are based on assumptions that involve risks and uncertainties, which are subject to change based on various important factors (some of which are beyond KeyCorp’s control). Actual results may differ materially from current projections. Actual outcomes may differ materially from those expressed or implied as a result of the factors described under “Forward-looking Statements” and “Risk Factors” in KeyCorp’s Annual Report on Form 10-K for the year ended December 31, 2025, and in subsequent filings of KeyCorp with the Securities and Exchange Commission (the “SEC”). Such forward-looking statements speak only as of the date they are made, and we undertake no obligation to update any forward-looking statement to reflect events or circumstances after that date or to reflect the occurrence of unanticipated events. For additional information regarding KeyCorp, please refer to our SEC filings available at www.key.com/ir. Non-GAAP Measures. This document contains GAAP financial measures and non-GAAP financial measures where management believes it to be helpful in understanding Key’s results of operations or financial position. Where non-GAAP financial measures are used, the comparable GAAP financial measures, as well as the reconciliation to the comparable GAAP financial measures, can be found in the appendix to this presentation. Forward-Looking Non-GAAP Measures. This document contains forward-looking non-GAAP measures. We are unable to provide a reconciliation of forward-looking non-GAAP measures to their most directly comparable GAAP financial measures because we are unable to provide, without unreasonable effort, a meaningful or accurate calculation or estimation of amounts that would be necessary for the reconciliation due to the complexity and inherent difficulty in forecasting and quantifying future amounts or when they may occur. Such unavailable information could be significant for future results. Annualized Data. Certain returns, yields, performance ratios, or quarterly growth rates are presented on an “annualized” basis. This is done for analytical and decision-making purposes to better discern underlying performance trends when compared to full-year or year-over-year amounts. Taxable Equivalent. Income from tax-exempt earning assets is increased by an amount equivalent to the taxes that would have been paid if this income had been taxable at the federal statutory rate. This adjustment puts all earning assets, most notably tax-exempt municipal securities, and certain lease assets, on a common basis that facilitates comparison of results to results of peers. Earnings Per Share Equivalent. Certain income or expense items may be expressed on a per common share basis. This is done for analytical and decision-making purposes to better discern underlying trends in total consolidated earnings per share performance excluding the impact of such items. When the impact of certain income or expense items is disclosed separately, the after-tax amount is computed using the marginal tax rate, unless otherwise specified, with this then being the amount used to calculate the earnings per share equivalent. GAAP: Generally Accepted Accounting Principles Forward-looking Statements and Additional Information 30