v3.26.3
Pay vs Performance Disclosure - USD ($)
12 Months Ended
May 31, 2026
May 31, 2025
May 31, 2024
May 31, 2023
May 31, 2022
Pay vs Performance Disclosure          
Pay vs Performance Disclosure, Table

PAY VERSUS PERFORMANCE

The following tables and related disclosures have been prepared in accordance with the SEC’s pay versus performance rules in Item 402(v) of Regulation S-K under the Exchange Act and do not necessarily reflect the economic benefit actually realized by our NEOs or the method by which the Compensation Committee makes compensation determinations. For a discussion of our executive compensation program and the Compensation Committee’s decision-making process in determining and approving our NEOs’ compensation, see “Executive Compensation—Compensation Discussion and Analysis” beginning on page 40.

Pay Versus Performance Table


Clayton M. Magouyrk


Michael D. Sicilia


Safra A. Catz


Average Non-PEO NEOs


Value of Initial
Fixed $100
Investment Based On:


Year

SCT Total
($) (1)

CAP
($) (2)


SCT Total
($) (1)

CAP
($) (2)


SCT Total
($) (1)

CAP
($) (2)


Average SCT
Total
($) (1)

Average CAP
($) (3)


Total
Shareholder
Return
(TSR)
($) (4)

Peer Group
TSR
($) (5)

Net
Income
($ millions)

Non-GAAP
Operating
Income
Growth

($ millions)
(6)

2026

627,472,419

413,038,464


256,606,752

193,783,100


10,141,063

256,974,411


52,900,119

107,649,517


206.82

189.86

16,984

3,893

2025

—

—


—

—


1,113,417

461,805,673


11,329,031

106,537,403


231.50

172.38

12,443

1,978

2024

—

—


—

—


6,464,234

94,264,234


13,191,706

38,148,634


132.03

136.76

10,467

2,153

2023

—

—


—

—


5,250,680

304,050,680


12,487,762

96,299,855


106.80

68.89

8,503

1,309

2022

—

—


—

—


138,192,032

139,242,032


58,544,998

56,911,587


37.95

42.02

6,717

593


(1)
For fiscal 2026, Messrs. Magouyrk and Sicilia were each promoted to the roles of principal executive officer (PEO) effective September 22, 2025. Ms. Catz served as PEO until September 22, 2025, at which time she transitioned to the role of Executive Vice Chair of the Board. Our non-PEO NEOs for fiscal 2026 were Lawrence J. Ellison, Hilary Maxson, Mark Hura, Stuart Levey and Douglas Kehring. Both Ms. Maxson and Mr. Kehring served as our Principal Financial Officer during portions of fiscal 2026, and each is included in the non-PEO NEO averages. For fiscal years 2025, 2024, 2023 and 2022, Ms. Catz served as our PEO. Our non-PEO NEOs for fiscal 2022 were Lawrence J. Ellison, Edward Screven and Dorian E. Daley. Our non-PEO NEOs for fiscal years 2025, 2024 and 2023 were Jeffrey O. Henley, Stuart Levey and Edward Screven. Maria Smith was a non-PEO NEO for fiscal 2025. In addition, although Mr. Ellison was not an NEO for fiscal 2025, 2024 or 2023 under applicable SEC rules, we have voluntarily included him as a non-PEO NEO for each of those years.
(2)
The amounts reported in these columns represent the amount of “compensation actually paid” (CAP) to each PEO, as applicable, computed in accordance with Item 402(v) of Regulation S-K and do not reflect the actual amount of compensation earned by or paid to the applicable PEO during the covered year. In accordance with the requirements of Item 402(v) of Regulation S-K, the following adjustments were made to each PEO's total compensation during the covered year to determine the CAP:


Year


PEO


SCT Total
($)


Deduction of
Equity
Amounts
Reported
in SCT
($)


Fair Value for
Unvested
Awards Granted
in Covered
Year
($)


Fair Value for
Awards Vested
and Granted
in the
Covered Year
($)


Change in Fair
Value of
Outstanding
Unvested Awards
from Prior Years
($)


Change in Fair
Value of
Prior-Year
Awards that
Vested in
the Covered
Year
($)


Prior-Year
Awards
Forfeited
($)


CAP
($)

2026


Clayton M. Magouyrk


627,472,419


(621,669,237)


355,475,761


—


20,639,341


31,120,180


—


413,038,464


2026


Michael D. Sicilia


256,606,752


(248,667,656)


142,190,282


—


17,563,214


26,090,508


—


193,783,100


2026


Safra A. Catz


10,141,063


(8,849,979)


7,133,327


—


—


248,550,000

 (a)


—


256,974,411


2025


Safra A. Catz


1,113,417


—


—


—


404,300,134


56,392,122


—


461,805,673


2024


Safra A. Catz


6,464,234


—


—


—


54,300,000


33,500,000


—


94,264,234


2023


Safra A. Catz


5,250,680


—


—


—


298,800,000


—


—


304,050,680


2022


Safra A. Catz


138,192,032


(129,275,000)


—


—


123,300,000


7,025,000


—


139,242,032


(a)
This amount includes the change in the fair value of 2,500,000 PSOs (representing the fourth tranche of PSOs) and 2,500,000 PSOs (representing the fifth tranche of PSOs) which were earned in fiscal 2025 and vested in fiscal 2026 on June 24, 2025.

(3)
The amounts reported in this column represent the average amount of CAP to the non-PEO NEOs as a group, as computed in accordance with Item 402(v) of Regulation S-K. The dollar amounts do not reflect the actual average amount of compensation earned by or paid to the non-PEO NEOs as a group during the applicable year. In accordance with the
requirements of Item 402(v) of Regulation S-K, the following adjustments were made to the average total compensation for the non-PEO NEOs for each year to determine the CAP:


Year


Average SCT
Total for
Non-PEO
NEOs ($)


Deduction of
Average Equity
Amounts
Reported in
SCT
($)


Average Fair
Value for
Unvested
Awards Granted
in the Covered
Year
($)


Average Fair
Value for
Vested Awards
Granted in the
Covered Year
($)


Change in
Average Fair
Value of
Outstanding
Unvested
Awards from
Prior Years
($)


Change in Average
Fair Value of
Awards from Prior
Years that Vested
in the Covered
Year
($)


Deduction
of Awards
from
Prior
Years
Forfeited
in the
Covered
Year
($)


Average CAP
to Non-PEO
NEOs
($)

2026


52,900,119


(48,519,407)


37,699,149


—


6,515,714


59,053,942

(a)


—


107,649,517


2025


11,329,031


(9,581,943)


7,831,535


—


86,045,938


14,409,251


(3,496,409)


106,537,403


2024


13,191,706


(9,438,478)


9,932,357


—


15,424,691


9,038,358


—


38,148,634


2023


12,487,762


(9,341,022)


14,522,834


—


78,125,625


504,656


—


96,299,855


2022


58,544,998


(53,190,333)


8,279,833


—


39,812,596


3,464,493


—


56,911,587


(a)
This calculation includes the change in the fair value of 2,500,000 PSOs (representing the fourth tranche of PSOs) and 2,500,000 PSOs (representing the fifth tranche of PSOs) held by Mr. Ellison which were earned in fiscal 2025 and vested in fiscal 2026 on June 24, 2025.
(4)
The amounts reported in this column reflect the cumulative total stockholder return on our common stock for each of the fiscal years presented, assuming an investment of $100 at the beginning of the earliest fiscal year presented and the reinvestment of any dividends.
(5)
The peer group used in this disclosure, the Dow Jones U.S. Technology Total Return Index, is the same peer group used in the Stock Performance Graph in Part II, Item 5 of our Annual Report on Form 10-K for the fiscal year ended May 31, 2026. The amounts reported in this column reflect the cumulative total return of the Dow Jones U.S. Technology Total Return Index for each of the fiscal years presented, assuming an investment of $100 at the beginning of the earliest fiscal year presented.
(6)
Non-GAAP operating income growth is a non-GAAP financial measure that reflects adjustments based on stock-based compensation expenses, amortization of intangible assets, acquisition related and other expenses and restructuring expenses. As noted in the CD&A, our non-GAAP operating income growth is the financial performance metric that is used to determine performance-based cash bonuses under the Executive Bonus Plan, and which funds our discretionary bonus plan. For more information see “Executive Compensation—Compensation Discussion and Analysis—Elements of Our Executive Compensation Program—Base Salary and Cash Bonuses” beginning on page 50.
       
Company Selected Measure Name Non-GAAPOperatingIncomeGrowth        
Named Executive Officers, Footnote Our non-PEO NEOs for fiscal 2026 were Lawrence J. Ellison, Hilary Maxson, Mark Hura, Stuart Levey and Douglas Kehring. Both Ms. Maxson and Mr. Kehring served as our Principal Financial Officer during portions of fiscal 2026, and each is included in the non-PEO NEO averages.Our non-PEO NEOs for fiscal 2022 were Lawrence J. Ellison, Edward Screven and Dorian E. Daley. Our non-PEO NEOs for fiscal years 2025, 2024 and 2023 were Jeffrey O. Henley, Stuart Levey and Edward Screven. Maria Smith was a non-PEO NEO for fiscal 2025. In addition, although Mr. Ellison was not an NEO for fiscal 2025, 2024 or 2023 under applicable SEC rules, we have voluntarily included him as a non-PEO NEO for each of those years.        
Peer Group Issuers, Footnote
(5)
The peer group used in this disclosure, the Dow Jones U.S. Technology Total Return Index, is the same peer group used in the Stock Performance Graph in Part II, Item 5 of our Annual Report on Form 10-K for the fiscal year ended May 31, 2026. The amounts reported in this column reflect the cumulative total return of the Dow Jones U.S. Technology Total Return Index for each of the fiscal years presented, assuming an investment of $100 at the beginning of the earliest fiscal year presented.
       
Adjustment To PEO Compensation, Footnote

Year


PEO


SCT Total
($)


Deduction of
Equity
Amounts
Reported
in SCT
($)


Fair Value for
Unvested
Awards Granted
in Covered
Year
($)


Fair Value for
Awards Vested
and Granted
in the
Covered Year
($)


Change in Fair
Value of
Outstanding
Unvested Awards
from Prior Years
($)


Change in Fair
Value of
Prior-Year
Awards that
Vested in
the Covered
Year
($)


Prior-Year
Awards
Forfeited
($)


CAP
($)

2026


Clayton M. Magouyrk


627,472,419


(621,669,237)


355,475,761


—


20,639,341


31,120,180


—


413,038,464


2026


Michael D. Sicilia


256,606,752


(248,667,656)


142,190,282


—


17,563,214


26,090,508


—


193,783,100


2026


Safra A. Catz


10,141,063


(8,849,979)


7,133,327


—


—


248,550,000

 (a)


—


256,974,411


2025


Safra A. Catz


1,113,417


—


—


—


404,300,134


56,392,122


—


461,805,673


2024


Safra A. Catz


6,464,234


—


—


—


54,300,000


33,500,000


—


94,264,234


2023


Safra A. Catz


5,250,680


—


—


—


298,800,000


—


—


304,050,680


2022


Safra A. Catz


138,192,032


(129,275,000)


—


—


123,300,000


7,025,000


—


139,242,032


(a)
This amount includes the change in the fair value of 2,500,000 PSOs (representing the fourth tranche of PSOs) and 2,500,000 PSOs (representing the fifth tranche of PSOs) which were earned in fiscal 2025 and vested in fiscal 2026 on June 24, 2025.
       
Non-PEO NEO Average Total Compensation Amount $ 52,900,119 $ 11,329,031 $ 13,191,706 $ 12,487,762 $ 58,544,998
Non-PEO NEO Average Compensation Actually Paid Amount $ 107,649,517 106,537,403 38,148,634 96,299,855 56,911,587
Adjustment to Non-PEO NEO Compensation Footnote

Year


Average SCT
Total for
Non-PEO
NEOs ($)


Deduction of
Average Equity
Amounts
Reported in
SCT
($)


Average Fair
Value for
Unvested
Awards Granted
in the Covered
Year
($)


Average Fair
Value for
Vested Awards
Granted in the
Covered Year
($)


Change in
Average Fair
Value of
Outstanding
Unvested
Awards from
Prior Years
($)


Change in Average
Fair Value of
Awards from Prior
Years that Vested
in the Covered
Year
($)


Deduction
of Awards
from
Prior
Years
Forfeited
in the
Covered
Year
($)


Average CAP
to Non-PEO
NEOs
($)

2026


52,900,119


(48,519,407)


37,699,149


—


6,515,714


59,053,942

(a)


—


107,649,517


2025


11,329,031


(9,581,943)


7,831,535


—


86,045,938


14,409,251


(3,496,409)


106,537,403


2024


13,191,706


(9,438,478)


9,932,357


—


15,424,691


9,038,358


—


38,148,634


2023


12,487,762


(9,341,022)


14,522,834


—


78,125,625


504,656


—


96,299,855


2022


58,544,998


(53,190,333)


8,279,833


—


39,812,596


3,464,493


—


56,911,587


(a)
This calculation includes the change in the fair value of 2,500,000 PSOs (representing the fourth tranche of PSOs) and 2,500,000 PSOs (representing the fifth tranche of PSOs) held by Mr. Ellison which were earned in fiscal 2025 and vested in fiscal 2026 on June 24, 2025.
       
Compensation Actually Paid vs. Total Shareholder Return

Compensation Actually Paid and Total Stockholder Return

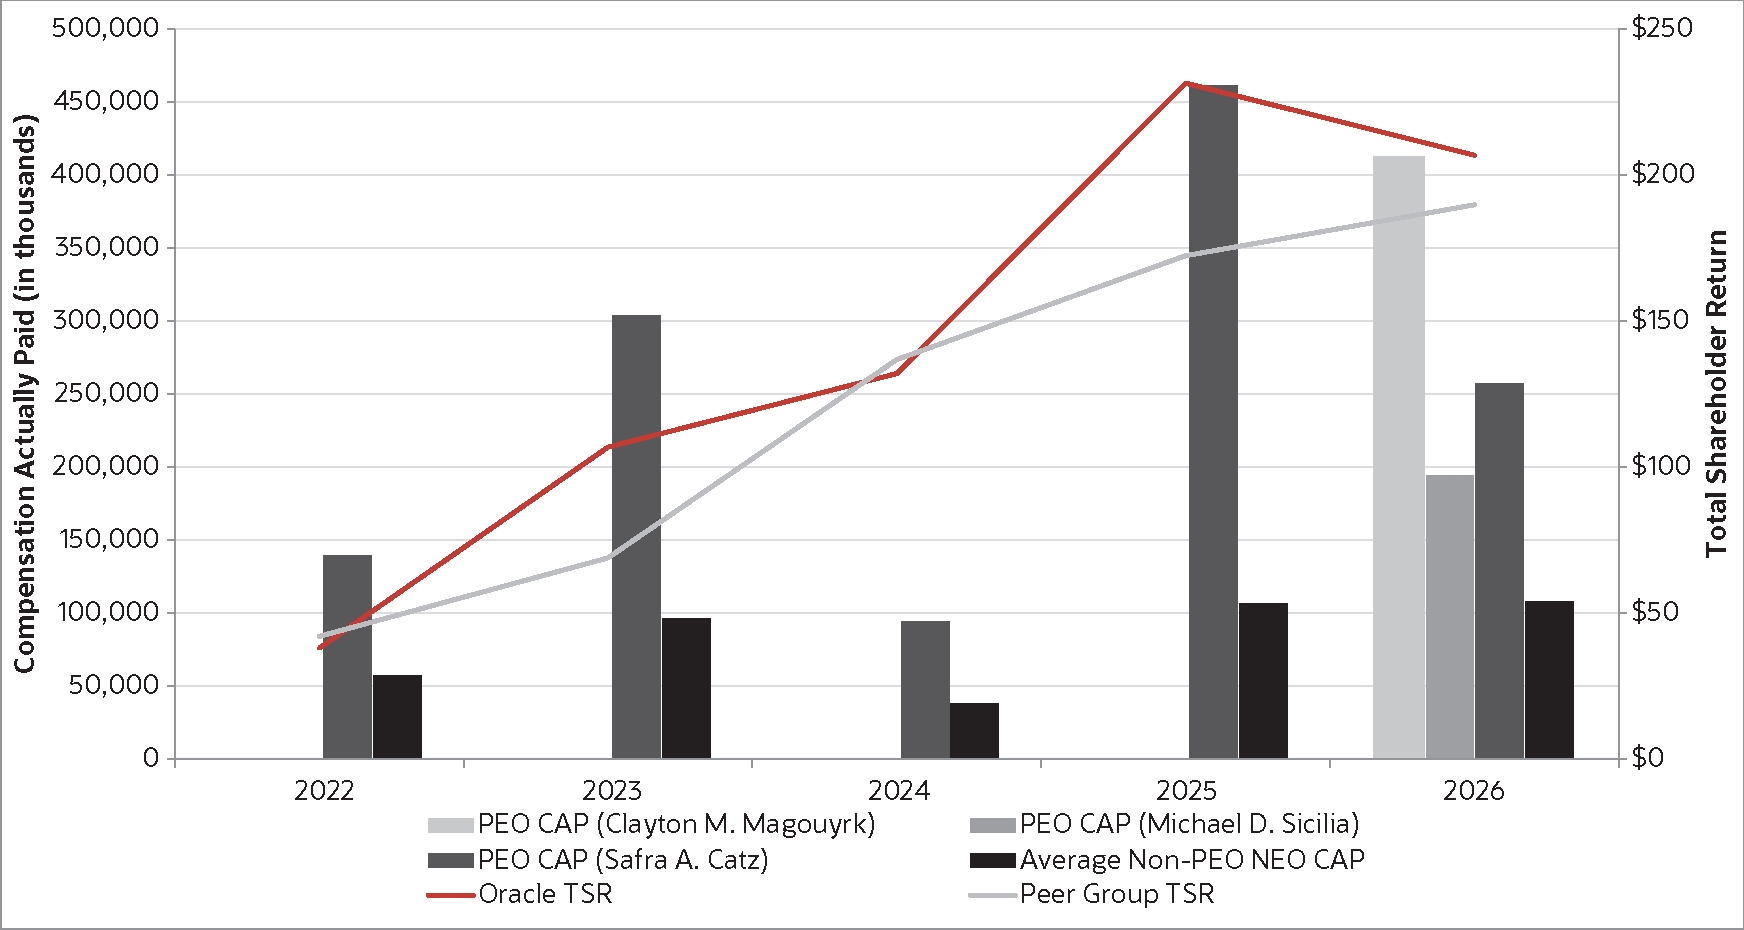
The following graph illustrates the relationship between CAP to our PEO and the average amount of CAP to our non-PEO NEOs, our cumulative total stockholder return and our cumulative peer group total stockholder return for fiscal years 2022, 2023, 2024, 2025 and 2026, each as set forth in the pay versus performance table above.

Relationship Between Compensation Actually Paid and Total Stockholder Return
 

img87684002_233.jpg

       
Compensation Actually Paid vs. Net Income

Compensation Actually Paid and Net Income

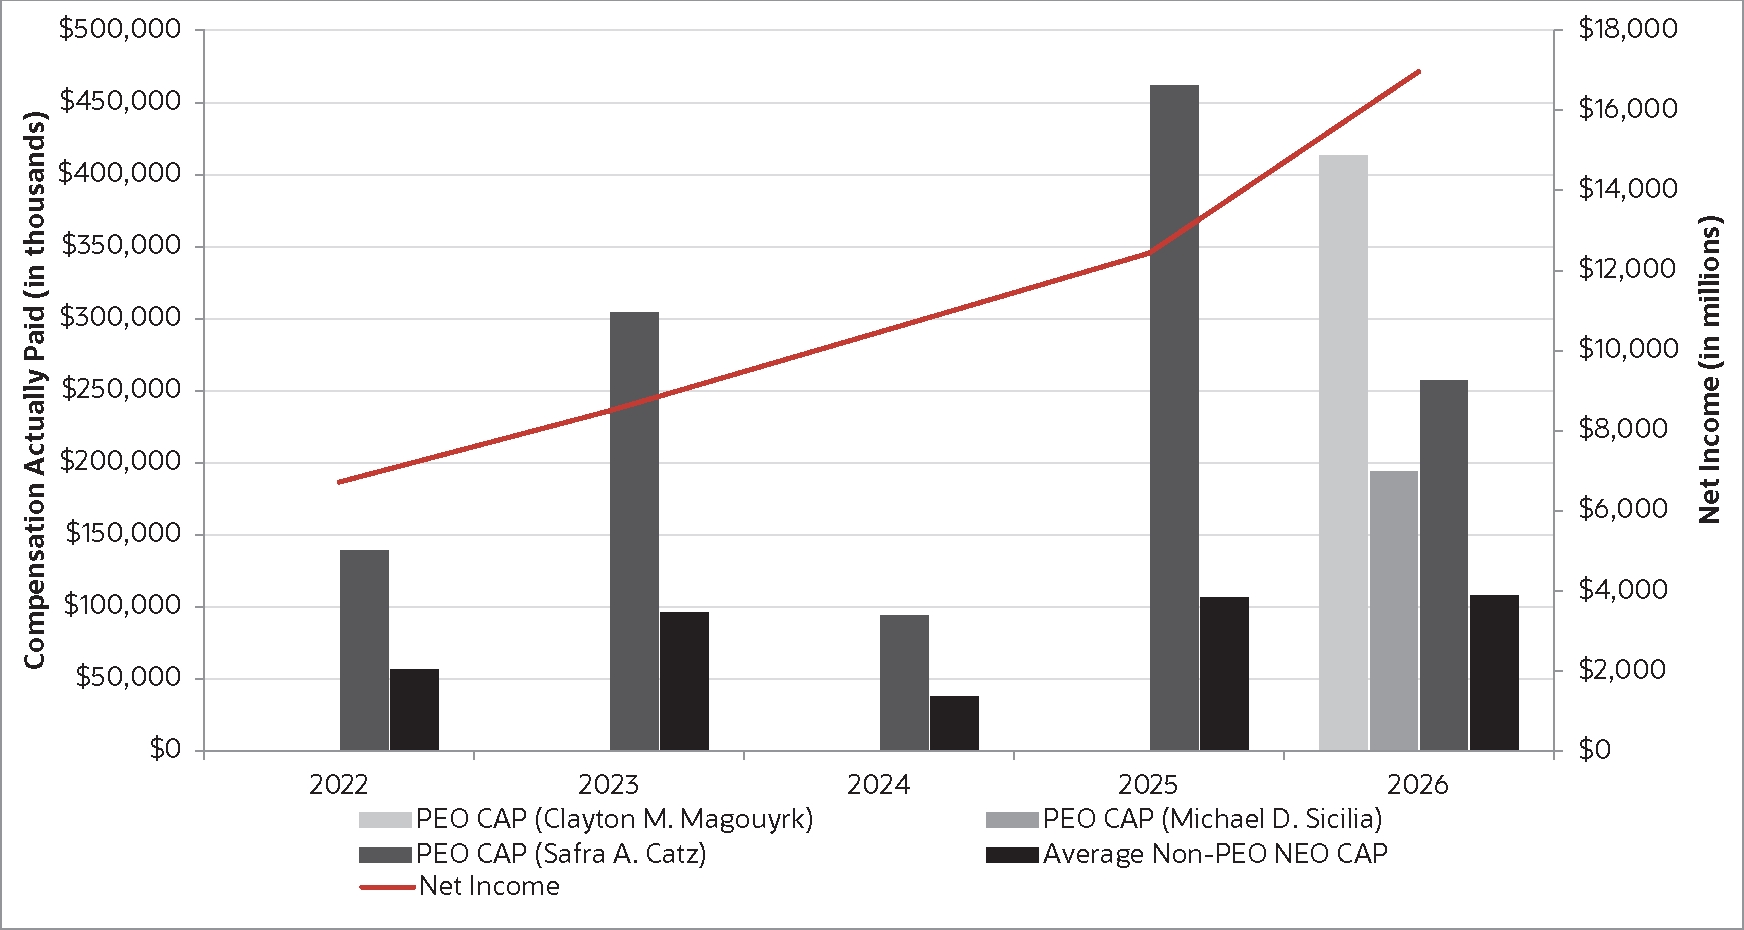
The following graph illustrates the relationship between CAP to our PEO and the average amount of CAP to our non-PEO NEOs and our net income for fiscal years 2022, 2023, 2024, 2025 and 2026, each as set forth in the pay versus performance table above.

Relationship Between Compensation Actually Paid and Net Income
img87684002_234.jpg

       
Compensation Actually Paid vs. Company Selected Measure

Compensation Actually Paid and Non-GAAP Operating Income Growth

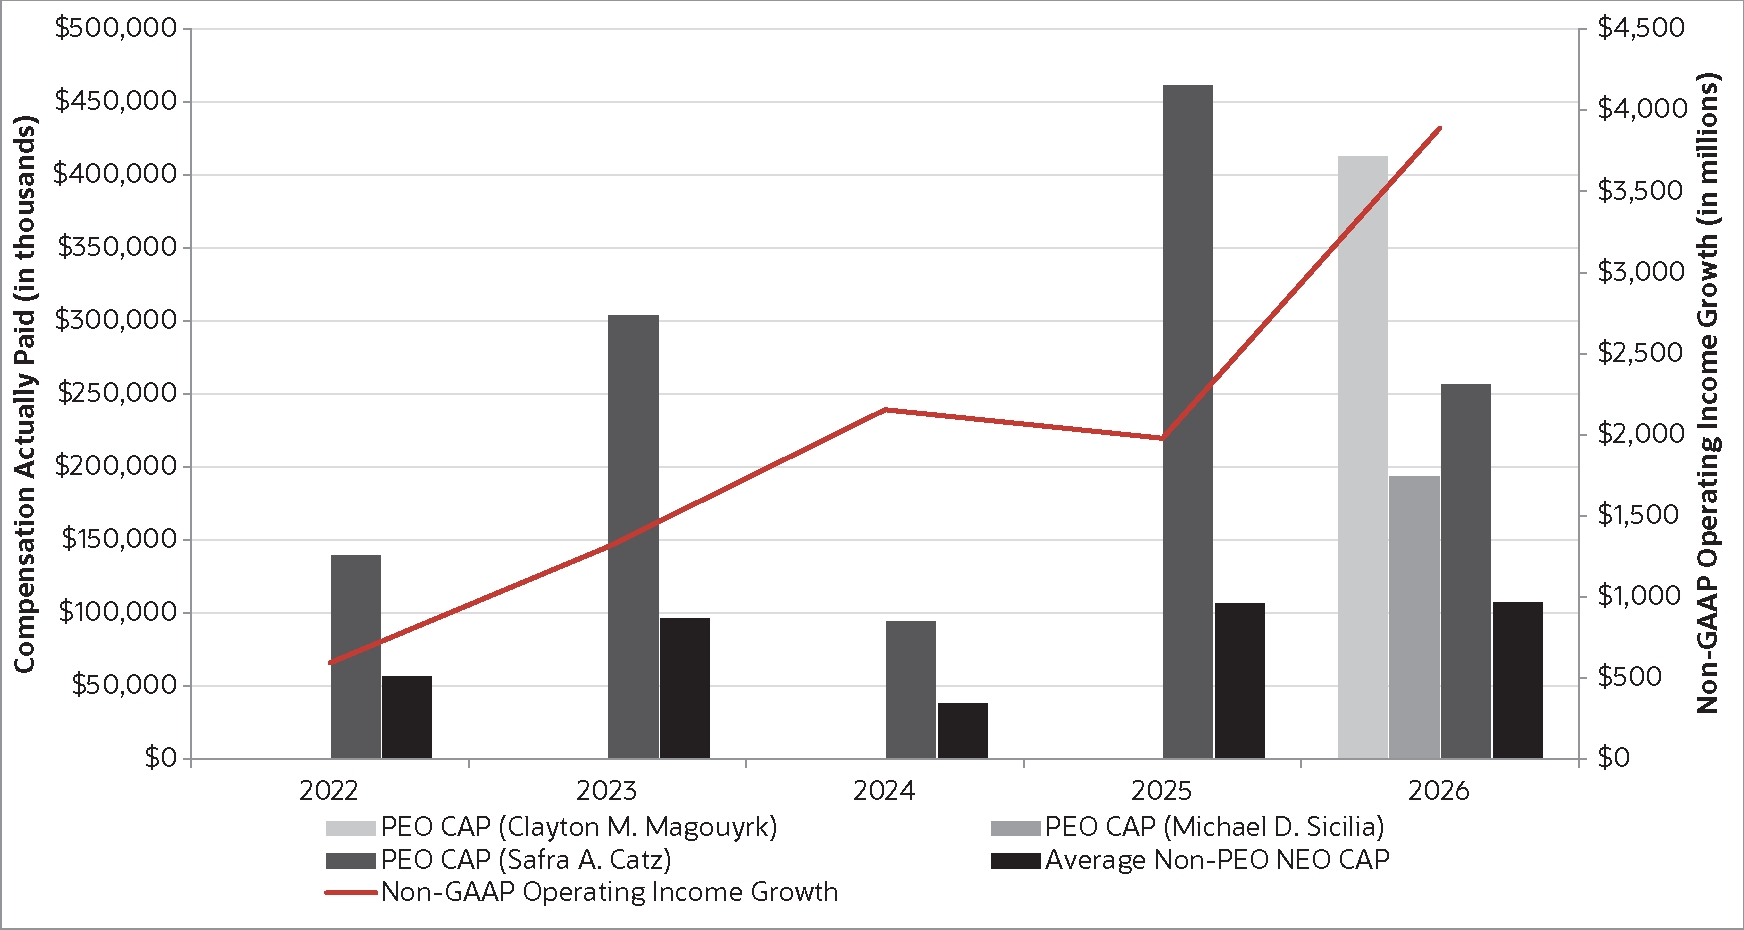
The following graph illustrates the relationship between CAP to our PEO and the average amount of CAP to our non-PEO NEOs and our non-GAAP operating income growth for fiscal years 2022, 2023, 2024, 2025 and 2026, each as set forth in the pay versus performance table above.

Relationship Between Compensation Actually Paid and Non-GAAP Operating Income Growth
 

img87684002_235.jpg

       
Total Shareholder Return Vs Peer Group

Compensation Actually Paid and Total Stockholder Return

The following graph illustrates the relationship between CAP to our PEO and the average amount of CAP to our non-PEO NEOs, our cumulative total stockholder return and our cumulative peer group total stockholder return for fiscal years 2022, 2023, 2024, 2025 and 2026, each as set forth in the pay versus performance table above.

Relationship Between Compensation Actually Paid and Total Stockholder Return


img87684002_233.jpg

       
Tabular List, Table

Financial Performance Measures

The table below lists the financial performance measures that the Compensation Committee believes represent the most important financial performance measures used to link compensation actually paid to our NEOs to Oracle’s performance for fiscal 2026. See “Executive Compensation—Compensation Discussion and Analysis” beginning on page 40 for a further description of our executive compensation program. The performance measures included in this table are not ranked by relative importance.


Non-GAAP Operating Income Growth

Fiscal 2028 Non-GAAP Total Revenues

Total Non-GPU Infrastructure Bookings*

GPU Bookings*

Total SaaS Bookings Growth*

Non-GAAP Software Revenue Growth*

* Metric applicable to Mr. Hura only.

       
Total Shareholder Return Amount $ 206.82 231.5 132.03 106.8 37.95
Peer Group Total Shareholder Return Amount 189.86 172.38 136.76 68.89 42.02
Net Income (Loss) $ 16,984,000,000 $ 12,443,000,000 $ 10,467,000,000 $ 8,503,000,000 $ 6,717,000,000
Company Selected Measure Amount 3,893,000,000 1,978,000,000 2,153,000,000 1,309,000,000 593,000,000
PEO Name Messrs. Magouyrk and Sicilia Ms. Catz Ms. Catz Ms. Catz Ms. Catz
Measure:: 1          
Pay vs Performance Disclosure          
Name Non-GAAP Operating Income Growth        
Non-GAAP Measure Description
(6)
Non-GAAP operating income growth is a non-GAAP financial measure that reflects adjustments based on stock-based compensation expenses, amortization of intangible assets, acquisition related and other expenses and restructuring expenses. As noted in the CD&A, our non-GAAP operating income growth is the financial performance metric that is used to determine performance-based cash bonuses under the Executive Bonus Plan, and which funds our discretionary bonus plan. For more information see “Executive Compensation—Compensation Discussion and Analysis—Elements of Our Executive Compensation Program—Base Salary and Cash Bonuses” beginning on page 50.
       
Measure:: 2          
Pay vs Performance Disclosure          
Name Fiscal 2028 Non-GAAP Total Revenues        
Measure:: 3          
Pay vs Performance Disclosure          
Name Total Non-GPU Infrastructure Bookings        
Measure:: 4          
Pay vs Performance Disclosure          
Name GPU Bookings        
Measure:: 5          
Pay vs Performance Disclosure          
Name Total SaaS Bookings Growth        
Measure:: 6          
Pay vs Performance Disclosure          
Name Non-GAAP Software Revenue Growth        
Clayton M. Magouyrk          
Pay vs Performance Disclosure          
PEO Total Compensation Amount $ 627,472,419        
PEO Actually Paid Compensation Amount 413,038,464        
Michael D. Sicilia          
Pay vs Performance Disclosure          
PEO Total Compensation Amount 256,606,752        
PEO Actually Paid Compensation Amount 193,783,100        
Safra A. Catz          
Pay vs Performance Disclosure          
PEO Total Compensation Amount 10,141,063 $ 1,113,417 $ 6,464,234 $ 5,250,680 $ 138,192,032
PEO Actually Paid Compensation Amount 256,974,411 461,805,673 94,264,234 304,050,680 139,242,032
PEO | Clayton M. Magouyrk | Aggregate Grant Date Fair Value of Equity Award Amounts Reported in Summary Compensation Table          
Pay vs Performance Disclosure          
Adjustment to Compensation, Amount (621,669,237)        
PEO | Clayton M. Magouyrk | Year-end Fair Value of Equity Awards Granted in Covered Year that are Outstanding and Unvested          
Pay vs Performance Disclosure          
Adjustment to Compensation, Amount 355,475,761        
PEO | Clayton M. Magouyrk | Year-over-Year Change in Fair Value of Equity Awards Granted in Prior Years That are Outstanding and Unvested          
Pay vs Performance Disclosure          
Adjustment to Compensation, Amount 20,639,341        
PEO | Clayton M. Magouyrk | Change in Fair Value as of Vesting Date of Prior Year Equity Awards Vested in Covered Year          
Pay vs Performance Disclosure          
Adjustment to Compensation, Amount 31,120,180        
PEO | Michael D. Sicilia | Aggregate Grant Date Fair Value of Equity Award Amounts Reported in Summary Compensation Table          
Pay vs Performance Disclosure          
Adjustment to Compensation, Amount (248,667,656)        
PEO | Michael D. Sicilia | Year-end Fair Value of Equity Awards Granted in Covered Year that are Outstanding and Unvested          
Pay vs Performance Disclosure          
Adjustment to Compensation, Amount 142,190,282        
PEO | Michael D. Sicilia | Year-over-Year Change in Fair Value of Equity Awards Granted in Prior Years That are Outstanding and Unvested          
Pay vs Performance Disclosure          
Adjustment to Compensation, Amount 17,563,214        
PEO | Michael D. Sicilia | Change in Fair Value as of Vesting Date of Prior Year Equity Awards Vested in Covered Year          
Pay vs Performance Disclosure          
Adjustment to Compensation, Amount 26,090,508        
PEO | Safra A. Catz | Aggregate Grant Date Fair Value of Equity Award Amounts Reported in Summary Compensation Table          
Pay vs Performance Disclosure          
Adjustment to Compensation, Amount (8,849,979)       (129,275,000)
PEO | Safra A. Catz | Year-end Fair Value of Equity Awards Granted in Covered Year that are Outstanding and Unvested          
Pay vs Performance Disclosure          
Adjustment to Compensation, Amount 7,133,327        
PEO | Safra A. Catz | Year-over-Year Change in Fair Value of Equity Awards Granted in Prior Years That are Outstanding and Unvested          
Pay vs Performance Disclosure          
Adjustment to Compensation, Amount   404,300,134 54,300,000 298,800,000 123,300,000
PEO | Safra A. Catz | Change in Fair Value as of Vesting Date of Prior Year Equity Awards Vested in Covered Year          
Pay vs Performance Disclosure          
Adjustment to Compensation, Amount 248,550,000 56,392,122 33,500,000   7,025,000
Non-PEO NEO | Aggregate Grant Date Fair Value of Equity Award Amounts Reported in Summary Compensation Table          
Pay vs Performance Disclosure          
Adjustment to Compensation, Amount (48,519,407) (9,581,943) (9,438,478) (9,341,022) (53,190,333)
Non-PEO NEO | Year-end Fair Value of Equity Awards Granted in Covered Year that are Outstanding and Unvested          
Pay vs Performance Disclosure          
Adjustment to Compensation, Amount 37,699,149 7,831,535 9,932,357 14,522,834 8,279,833
Non-PEO NEO | Year-over-Year Change in Fair Value of Equity Awards Granted in Prior Years That are Outstanding and Unvested          
Pay vs Performance Disclosure          
Adjustment to Compensation, Amount 6,515,714 86,045,938 15,424,691 78,125,625 39,812,596
Non-PEO NEO | Change in Fair Value as of Vesting Date of Prior Year Equity Awards Vested in Covered Year          
Pay vs Performance Disclosure          
Adjustment to Compensation, Amount $ 59,053,942 14,409,251 $ 9,038,358 $ 504,656 $ 3,464,493
Non-PEO NEO | Prior Year End Fair Value of Equity Awards Granted in Any Prior Year that Fail to Meet Applicable Vesting Conditions During Covered Year          
Pay vs Performance Disclosure          
Adjustment to Compensation, Amount   $ (3,496,409)