Shareholder Report
Jul. 31, 2026
USD ($)
holding
Jul. 31, 2026
USD ($)
holding
What were the fund costs for the last year? (based on a hypothetical $10,000 investment) | ||||||||
Costs of a $10,000 investment | Costs paid as a percentage of a $10,000 investment | |||||||
| Investor Class | $72 | 0.69% | ||||||
| What were the key factors that affected the fund’s performance? | |||||
Strategic Allocation: Conservative Fund Investor Class returned 8.50% for the reporting period ended July 31, 2026. | |||||
| The fund is an asset allocation fund. That is, it diversifies its assets among various classes of investments such as equity securities, bonds and money market instruments. The fund seeks the highest level of total return consistent with its asset mix. See the Fund Holdings for the portfolio’s asset weights. Below, we discuss the factors that affected these asset classes. | |||||
• | The portfolio's U.S. stock holdings generally did well, with mid- and large-cap equities lagging small-cap stocks, while value stocks beat growth. This reflects uncertainty around spending on artificial intelligence (AI), which weighed most on mid- and large-cap growth stocks. Smaller and more value-oriented companies benefited from broad economic and earnings strength. | ||||
• | The portfolio's non-U.S. equity holdings generally outperformed U.S. stock holdings. That's because non-U.S. stocks benefited from attractive relative valuations as investors looked beyond the most expensive U.S. growth stocks. Nevertheless, some notable non-U.S. stocks did benefit from the broadening of the AI trade beyond U.S. borders. | ||||
• | The global bond allocation produced positive total returns and diversification benefits even as some of the world's leading central banks raised rates amid elevated inflation. For example, the European Central Bank and the Bank of Japan raised rates during the period, mindful of having left rates too low for too long ahead of the 2022 inflation shock. | ||||
• | The portfolio's cash allocation produced strong returns despite rate cuts by the Federal Reserve (Fed). Even as cash yields fell in line with the Fed rate changes, short-term yields remained in excess of inflation, and total returns exceeded those of intermediate- and long-term bonds. | ||||
Cumulative Performance (based on an initial $10,000 investment) | ||
July 31, 2016 through July 31, 2026 | ||
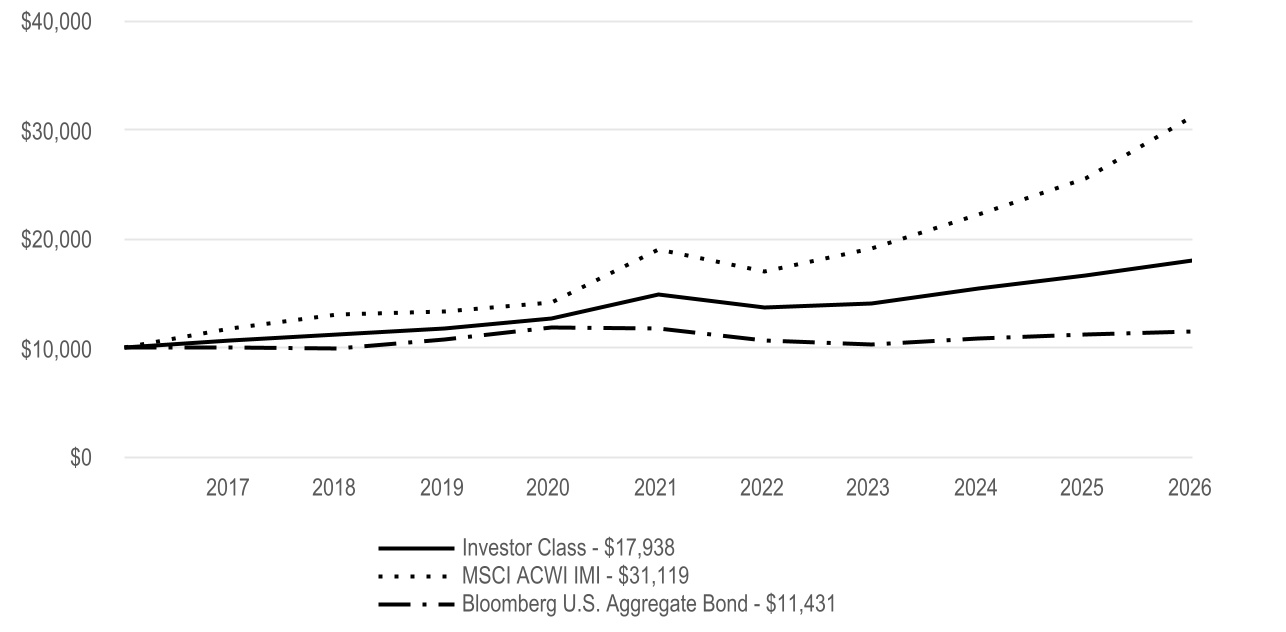
Average Annual Total Returns | |||||||||||
| 1 Year | 5 Year | 10 Year | |||||||||
| Investor Class | 8.50% | 3.85% | 6.02% | ||||||||
| MSCI ACWI IMI | 22.27% | 10.40% | 12.02% | ||||||||
| Bloomberg U.S. Aggregate Bond | 2.71% | -0.40% | 1.35% | ||||||||
| Fund Holdings | ||
Types of Investments in Portfolio (as a % of net assets) | |||||
| Affiliated Funds | 41.4% | ||||
| Common Stocks | 18.5% | ||||
| U.S. Treasury Securities | 14.5% | ||||
| U.S. Government Agency Mortgage-Backed Securities | 6.0% | ||||
| Corporate Bonds | 5.6% | ||||
| Sovereign Governments and Agencies | 4.7% | ||||
| Collateralized Mortgage Obligations | 1.8% | ||||
| Asset-Backed Securities | 1.1% | ||||
| Commercial Mortgage-Backed Securities | 0.6% | ||||
| Municipal Securities | 0.3% | ||||
| Exchange-Traded Funds | 0.1% | ||||
| Preferred Securities | 0.0% | ||||
| Rights | 0.0% | ||||
| Short-Term Investments | 8.2% | ||||
| Other Assets and Liabilities | (2.8)% | ||||
What were the fund costs for the last year? (based on a hypothetical $10,000 investment) | ||||||||
Costs of a $10,000 investment | Costs paid as a percentage of a $10,000 investment | |||||||
| I Class | $51 | 0.49% | ||||||
| What were the key factors that affected the fund’s performance? | |||||
Strategic Allocation: Conservative Fund I Class returned 8.51% for the reporting period ended July 31, 2026. | |||||
| The fund is an asset allocation fund. That is, it diversifies its assets among various classes of investments such as equity securities, bonds and money market instruments. The fund seeks the highest level of total return consistent with its asset mix. See the Fund Holdings for the portfolio’s asset weights. Below, we discuss the factors that affected these asset classes. | |||||
• | The portfolio's U.S. stock holdings generally did well, with mid- and large-cap equities lagging small-cap stocks, while value stocks beat growth. This reflects uncertainty around spending on artificial intelligence (AI), which weighed most on mid- and large-cap growth stocks. Smaller and more value-oriented companies benefited from broad economic and earnings strength. | ||||
• | The portfolio's non-U.S. equity holdings generally outperformed U.S. stock holdings. That's because non-U.S. stocks benefited from attractive relative valuations as investors looked beyond the most expensive U.S. growth stocks. Nevertheless, some notable non-U.S. stocks did benefit from the broadening of the AI trade beyond U.S. borders. | ||||
• | The global bond allocation produced positive total returns and diversification benefits even as some of the world's leading central banks raised rates amid elevated inflation. For example, the European Central Bank and the Bank of Japan raised rates during the period, mindful of having left rates too low for too long ahead of the 2022 inflation shock. | ||||
• | The portfolio's cash allocation produced strong returns despite rate cuts by the Federal Reserve (Fed). Even as cash yields fell in line with the Fed rate changes, short-term yields remained in excess of inflation, and total returns exceeded those of intermediate- and long-term bonds. | ||||
Cumulative Performance (based on an initial $10,000 investment) | ||
July 31, 2016 through July 31, 2026 | ||
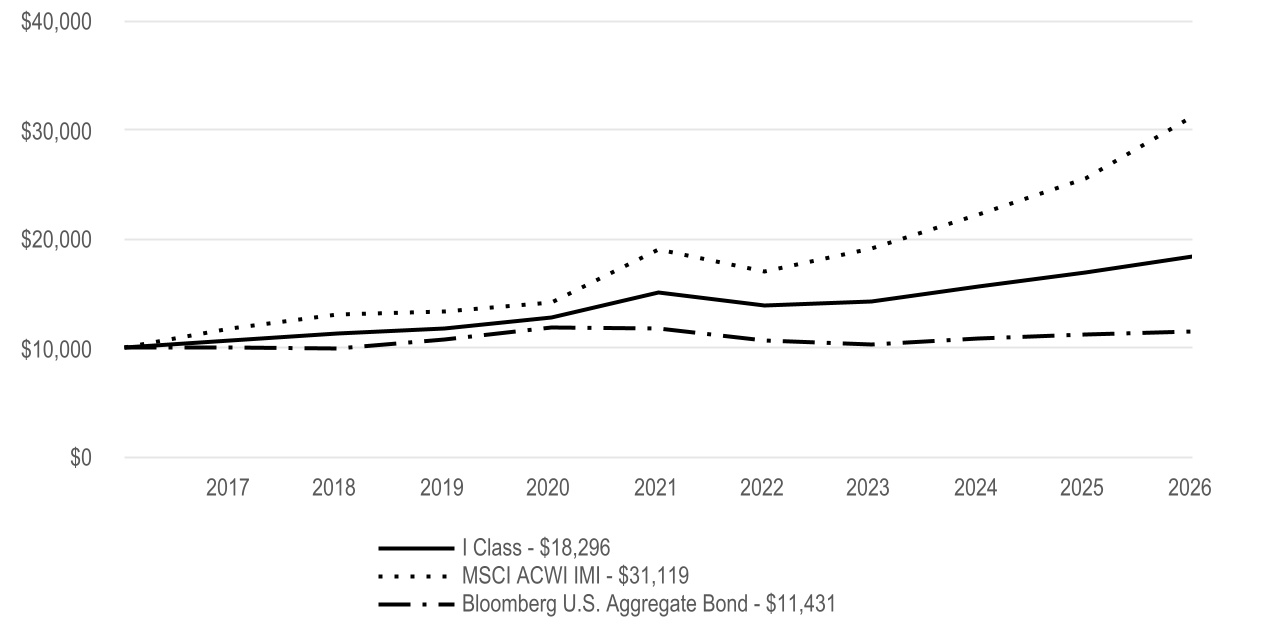
Average Annual Total Returns | |||||||||||
| 1 Year | 5 Year | 10 Year | |||||||||
| I Class | 8.51% | 4.02% | 6.23% | ||||||||
| MSCI ACWI IMI | 22.27% | 10.40% | 12.02% | ||||||||
| Bloomberg U.S. Aggregate Bond | 2.71% | -0.40% | 1.35% | ||||||||
| Fund Holdings | ||
Types of Investments in Portfolio (as a % of net assets) | |||||
| Affiliated Funds | 41.4% | ||||
| Common Stocks | 18.5% | ||||
| U.S. Treasury Securities | 14.5% | ||||
| U.S. Government Agency Mortgage-Backed Securities | 6.0% | ||||
| Corporate Bonds | 5.6% | ||||
| Sovereign Governments and Agencies | 4.7% | ||||
| Collateralized Mortgage Obligations | 1.8% | ||||
| Asset-Backed Securities | 1.1% | ||||
| Commercial Mortgage-Backed Securities | 0.6% | ||||
| Municipal Securities | 0.3% | ||||
| Exchange-Traded Funds | 0.1% | ||||
| Preferred Securities | 0.0% | ||||
| Rights | 0.0% | ||||
| Short-Term Investments | 8.2% | ||||
| Other Assets and Liabilities | (2.8)% | ||||
What were the fund costs for the last year? (based on a hypothetical $10,000 investment) | ||||||||
Costs of a $10,000 investment | Costs paid as a percentage of a $10,000 investment | |||||||
| A Class | $98 | 0.94% | ||||||
| What were the key factors that affected the fund’s performance? | |||||
Strategic Allocation: Conservative Fund A Class returned 8.06% for the reporting period ended July 31, 2026. | |||||
| The fund is an asset allocation fund. That is, it diversifies its assets among various classes of investments such as equity securities, bonds and money market instruments. The fund seeks the highest level of total return consistent with its asset mix. See the Fund Holdings for the portfolio’s asset weights. Below, we discuss the factors that affected these asset classes. | |||||
• | The portfolio's U.S. stock holdings generally did well, with mid- and large-cap equities lagging small-cap stocks, while value stocks beat growth. This reflects uncertainty around spending on artificial intelligence (AI), which weighed most on mid- and large-cap growth stocks. Smaller and more value-oriented companies benefited from broad economic and earnings strength. | ||||
• | The portfolio's non-U.S. equity holdings generally outperformed U.S. stock holdings. That's because non-U.S. stocks benefited from attractive relative valuations as investors looked beyond the most expensive U.S. growth stocks. Nevertheless, some notable non-U.S. stocks did benefit from the broadening of the AI trade beyond U.S. borders. | ||||
• | The global bond allocation produced positive total returns and diversification benefits even as some of the world's leading central banks raised rates amid elevated inflation. For example, the European Central Bank and the Bank of Japan raised rates during the period, mindful of having left rates too low for too long ahead of the 2022 inflation shock. | ||||
• | The portfolio's cash allocation produced strong returns despite rate cuts by the Federal Reserve (Fed). Even as cash yields fell in line with the Fed rate changes, short-term yields remained in excess of inflation, and total returns exceeded those of intermediate- and long-term bonds. | ||||
Cumulative Performance (based on an initial $10,000 investment) | ||
July 31, 2016 through July 31, 2026 | ||
The initial investment is adjusted to reflect the maximum initial sales charge. | ||
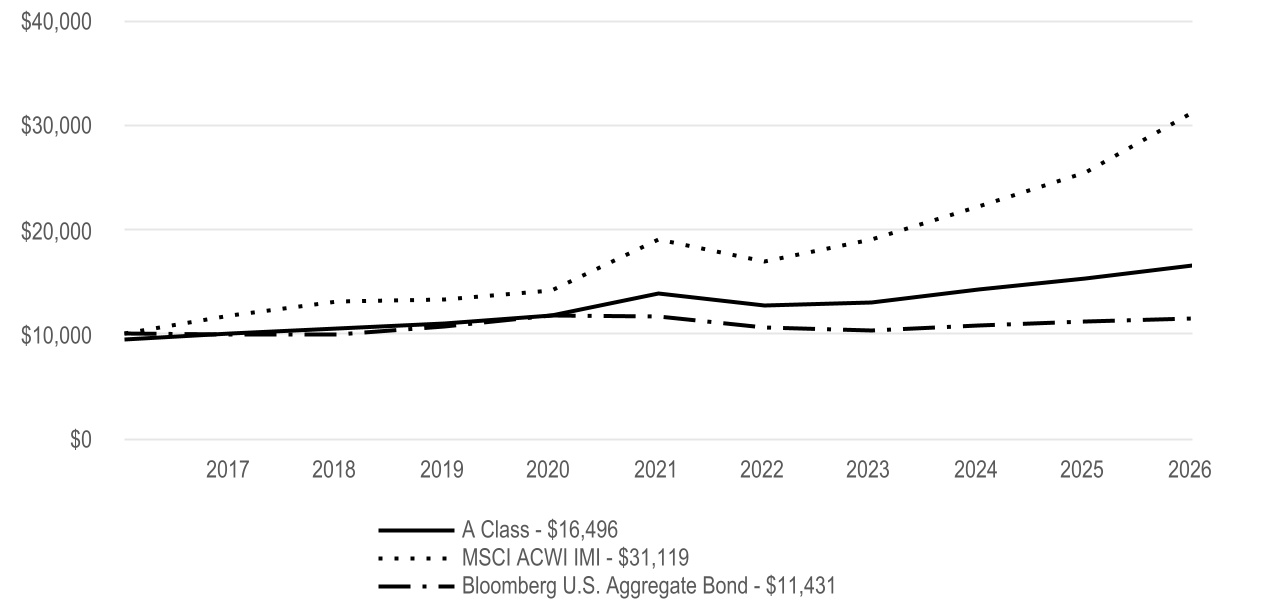
Average Annual Total Returns | |||||||||||
| 1 Year | 5 Year | 10 Year | |||||||||
| A Class | 8.06% | 3.56% | 5.76% | ||||||||
| A Class - with sales charge | 1.84% | 2.34% | 5.13% | ||||||||
| MSCI ACWI IMI | 22.27% | 10.40% | 12.02% | ||||||||
| Bloomberg U.S. Aggregate Bond | 2.71% | -0.40% | 1.35% | ||||||||
| Fund Holdings | ||
Types of Investments in Portfolio (as a % of net assets) | |||||
| Affiliated Funds | 41.4% | ||||
| Common Stocks | 18.5% | ||||
| U.S. Treasury Securities | 14.5% | ||||
| U.S. Government Agency Mortgage-Backed Securities | 6.0% | ||||
| Corporate Bonds | 5.6% | ||||
| Sovereign Governments and Agencies | 4.7% | ||||
| Collateralized Mortgage Obligations | 1.8% | ||||
| Asset-Backed Securities | 1.1% | ||||
| Commercial Mortgage-Backed Securities | 0.6% | ||||
| Municipal Securities | 0.3% | ||||
| Exchange-Traded Funds | 0.1% | ||||
| Preferred Securities | 0.0% | ||||
| Rights | 0.0% | ||||
| Short-Term Investments | 8.2% | ||||
| Other Assets and Liabilities | (2.8)% | ||||
What were the fund costs for the last year? (based on a hypothetical $10,000 investment) | ||||||||
Costs of a $10,000 investment | Costs paid as a percentage of a $10,000 investment | |||||||
| C Class | $175 | 1.69% | ||||||
| What were the key factors that affected the fund’s performance? | |||||
Strategic Allocation: Conservative Fund C Class returned 7.26% for the reporting period ended July 31, 2026. | |||||
| The fund is an asset allocation fund. That is, it diversifies its assets among various classes of investments such as equity securities, bonds and money market instruments. The fund seeks the highest level of total return consistent with its asset mix. See the Fund Holdings for the portfolio’s asset weights. Below, we discuss the factors that affected these asset classes. | |||||
• | The portfolio's U.S. stock holdings generally did well, with mid- and large-cap equities lagging small-cap stocks, while value stocks beat growth. This reflects uncertainty around spending on artificial intelligence (AI), which weighed most on mid- and large-cap growth stocks. Smaller and more value-oriented companies benefited from broad economic and earnings strength. | ||||
• | The portfolio's non-U.S. equity holdings generally outperformed U.S. stock holdings. That's because non-U.S. stocks benefited from attractive relative valuations as investors looked beyond the most expensive U.S. growth stocks. Nevertheless, some notable non-U.S. stocks did benefit from the broadening of the AI trade beyond U.S. borders. | ||||
• | The global bond allocation produced positive total returns and diversification benefits even as some of the world's leading central banks raised rates amid elevated inflation. For example, the European Central Bank and the Bank of Japan raised rates during the period, mindful of having left rates too low for too long ahead of the 2022 inflation shock. | ||||
• | The portfolio's cash allocation produced strong returns despite rate cuts by the Federal Reserve (Fed). Even as cash yields fell in line with the Fed rate changes, short-term yields remained in excess of inflation, and total returns exceeded those of intermediate- and long-term bonds. | ||||
Cumulative Performance (based on an initial $10,000 investment) | ||
July 31, 2016 through July 31, 2026 | ||
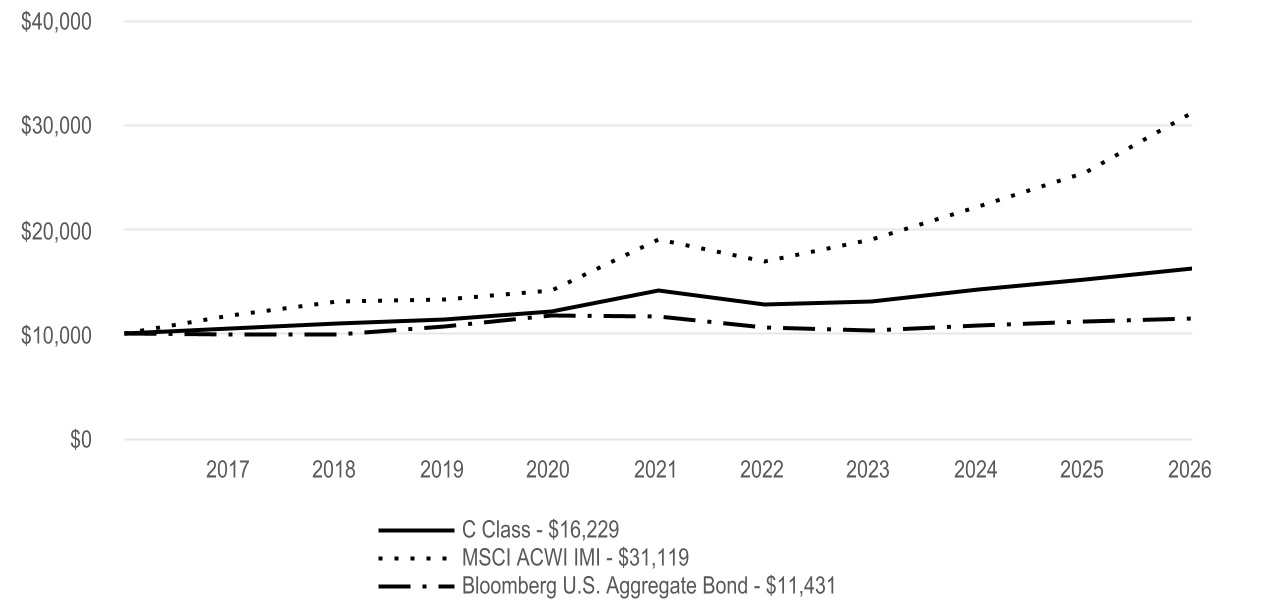
Average Annual Total Returns | |||||||||||
| 1 Year | 5 Year | 10 Year | |||||||||
| C Class | 7.26% | 2.80% | 4.96% | ||||||||
| MSCI ACWI IMI | 22.27% | 10.40% | 12.02% | ||||||||
| Bloomberg U.S. Aggregate Bond | 2.71% | -0.40% | 1.35% | ||||||||
| Fund Holdings | ||
Types of Investments in Portfolio (as a % of net assets) | |||||
| Affiliated Funds | 41.4% | ||||
| Common Stocks | 18.5% | ||||
| U.S. Treasury Securities | 14.5% | ||||
| U.S. Government Agency Mortgage-Backed Securities | 6.0% | ||||
| Corporate Bonds | 5.6% | ||||
| Sovereign Governments and Agencies | 4.7% | ||||
| Collateralized Mortgage Obligations | 1.8% | ||||
| Asset-Backed Securities | 1.1% | ||||
| Commercial Mortgage-Backed Securities | 0.6% | ||||
| Municipal Securities | 0.3% | ||||
| Exchange-Traded Funds | 0.1% | ||||
| Preferred Securities | 0.0% | ||||
| Rights | 0.0% | ||||
| Short-Term Investments | 8.2% | ||||
| Other Assets and Liabilities | (2.8)% | ||||
What were the fund costs for the last year? (based on a hypothetical $10,000 investment) | ||||||||
Costs of a $10,000 investment | Costs paid as a percentage of a $10,000 investment | |||||||
| R Class | $124 | 1.19% | ||||||
| What were the key factors that affected the fund’s performance? | |||||
Strategic Allocation: Conservative Fund R Class returned 7.67% for the reporting period ended July 31, 2026. | |||||
| The fund is an asset allocation fund. That is, it diversifies its assets among various classes of investments such as equity securities, bonds and money market instruments. The fund seeks the highest level of total return consistent with its asset mix. See the Fund Holdings for the portfolio’s asset weights. Below, we discuss the factors that affected these asset classes. | |||||
• | The portfolio's U.S. stock holdings generally did well, with mid- and large-cap equities lagging small-cap stocks, while value stocks beat growth. This reflects uncertainty around spending on artificial intelligence (AI), which weighed most on mid- and large-cap growth stocks. Smaller and more value-oriented companies benefited from broad economic and earnings strength. | ||||
• | The portfolio's non-U.S. equity holdings generally outperformed U.S. stock holdings. That's because non-U.S. stocks benefited from attractive relative valuations as investors looked beyond the most expensive U.S. growth stocks. Nevertheless, some notable non-U.S. stocks did benefit from the broadening of the AI trade beyond U.S. borders. | ||||
• | The global bond allocation produced positive total returns and diversification benefits even as some of the world's leading central banks raised rates amid elevated inflation. For example, the European Central Bank and the Bank of Japan raised rates during the period, mindful of having left rates too low for too long ahead of the 2022 inflation shock. | ||||
• | The portfolio's cash allocation produced strong returns despite rate cuts by the Federal Reserve (Fed). Even as cash yields fell in line with the Fed rate changes, short-term yields remained in excess of inflation, and total returns exceeded those of intermediate- and long-term bonds. | ||||
Cumulative Performance (based on an initial $10,000 investment) | ||
July 31, 2016 through July 31, 2026 | ||
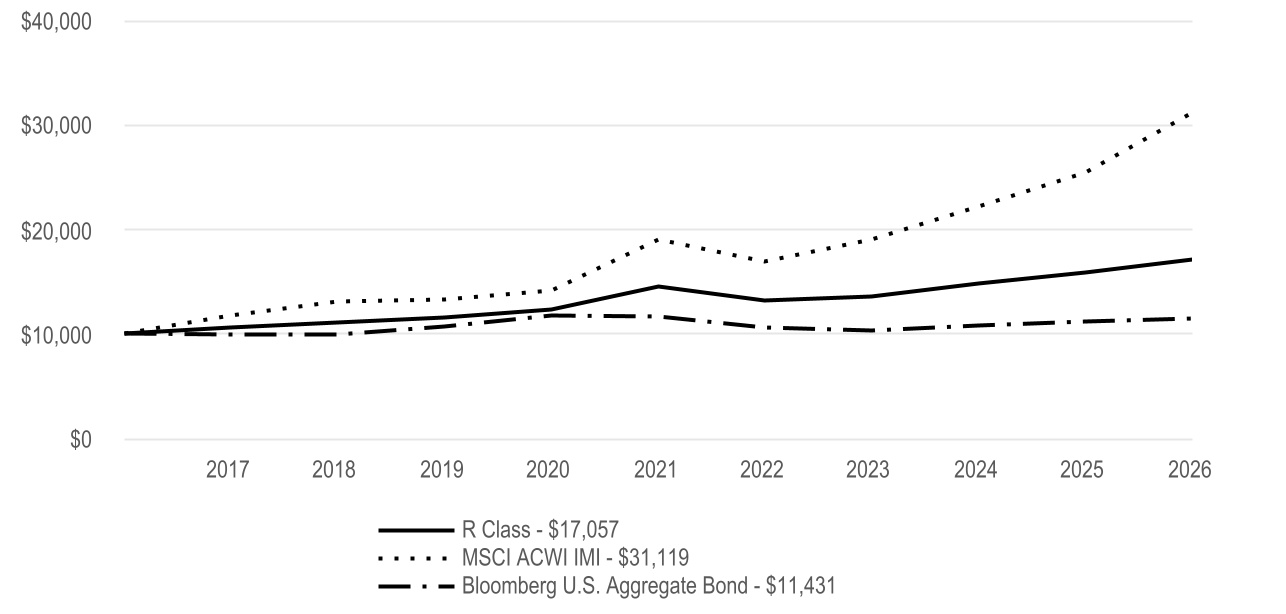
Average Annual Total Returns | |||||||||||
| 1 Year | 5 Year | 10 Year | |||||||||
| R Class | 7.67% | 3.29% | 5.48% | ||||||||
| MSCI ACWI IMI | 22.27% | 10.40% | 12.02% | ||||||||
| Bloomberg U.S. Aggregate Bond | 2.71% | -0.40% | 1.35% | ||||||||
| Fund Holdings | ||
Types of Investments in Portfolio (as a % of net assets) | |||||
| Affiliated Funds | 41.4% | ||||
| Common Stocks | 18.5% | ||||
| U.S. Treasury Securities | 14.5% | ||||
| U.S. Government Agency Mortgage-Backed Securities | 6.0% | ||||
| Corporate Bonds | 5.6% | ||||
| Sovereign Governments and Agencies | 4.7% | ||||
| Collateralized Mortgage Obligations | 1.8% | ||||
| Asset-Backed Securities | 1.1% | ||||
| Commercial Mortgage-Backed Securities | 0.6% | ||||
| Municipal Securities | 0.3% | ||||
| Exchange-Traded Funds | 0.1% | ||||
| Preferred Securities | 0.0% | ||||
| Rights | 0.0% | ||||
| Short-Term Investments | 8.2% | ||||
| Other Assets and Liabilities | (2.8)% | ||||
What were the fund costs for the last year? (based on a hypothetical $10,000 investment) | ||||||||
Costs of a $10,000 investment | Costs paid as a percentage of a $10,000 investment | |||||||
| R5 Class | $51 | 0.49% | ||||||
| What were the key factors that affected the fund’s performance? | |||||
Strategic Allocation: Conservative Fund R5 Class returned 8.51% for the reporting period ended July 31, 2026. | |||||
| The fund is an asset allocation fund. That is, it diversifies its assets among various classes of investments such as equity securities, bonds and money market instruments. The fund seeks the highest level of total return consistent with its asset mix. See the Fund Holdings for the portfolio’s asset weights. Below, we discuss the factors that affected these asset classes. | |||||
• | The portfolio's U.S. stock holdings generally did well, with mid- and large-cap equities lagging small-cap stocks, while value stocks beat growth. This reflects uncertainty around spending on artificial intelligence (AI), which weighed most on mid- and large-cap growth stocks. Smaller and more value-oriented companies benefited from broad economic and earnings strength. | ||||
• | The portfolio's non-U.S. equity holdings generally outperformed U.S. stock holdings. That's because non-U.S. stocks benefited from attractive relative valuations as investors looked beyond the most expensive U.S. growth stocks. Nevertheless, some notable non-U.S. stocks did benefit from the broadening of the AI trade beyond U.S. borders. | ||||
• | The global bond allocation produced positive total returns and diversification benefits even as some of the world's leading central banks raised rates amid elevated inflation. For example, the European Central Bank and the Bank of Japan raised rates during the period, mindful of having left rates too low for too long ahead of the 2022 inflation shock. | ||||
• | The portfolio's cash allocation produced strong returns despite rate cuts by the Federal Reserve (Fed). Even as cash yields fell in line with the Fed rate changes, short-term yields remained in excess of inflation, and total returns exceeded those of intermediate- and long-term bonds. | ||||
Cumulative Performance (based on an initial $10,000 investment) | ||
April 10, 2017 through July 31, 2026 | ||
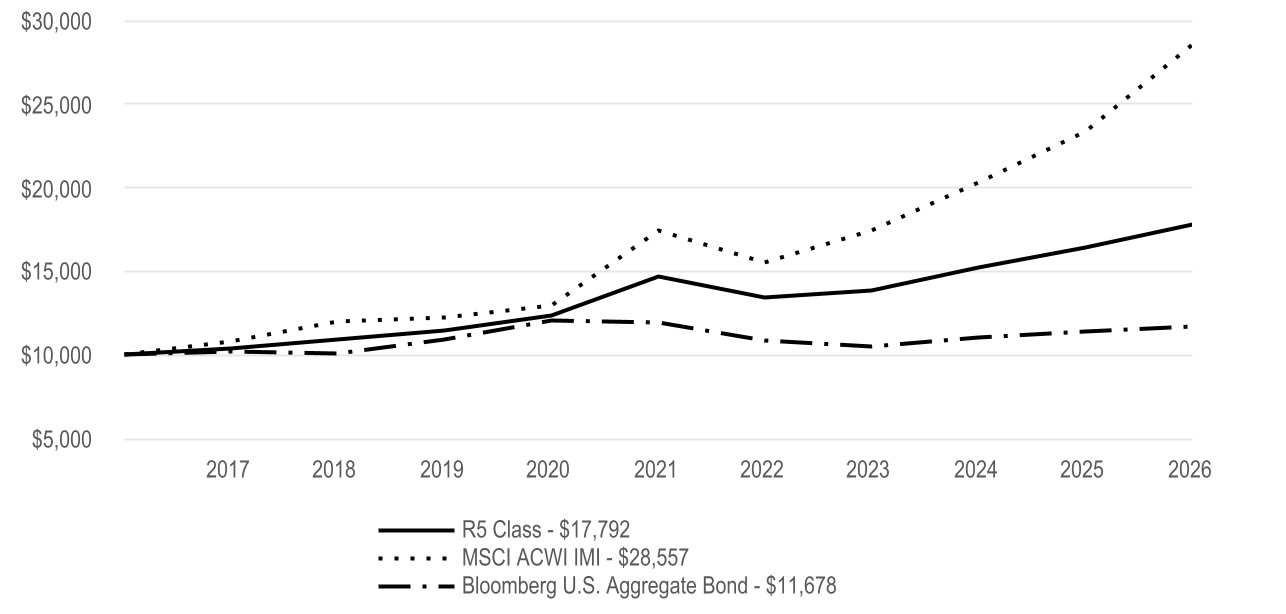
Average Annual Total Returns | ||||||||||||||
| 1 Year | 5 Year | Since Inception | Inception Date | |||||||||||
| R5 Class | 8.51% | 3.98% | 6.38% | 4/10/17 | ||||||||||
| MSCI ACWI IMI | 22.27% | 10.40% | 11.93% | — | ||||||||||
| Bloomberg U.S. Aggregate Bond | 2.71% | -0.40% | 1.68% | — | ||||||||||
| Fund Holdings | ||
Types of Investments in Portfolio (as a % of net assets) | |||||
| Affiliated Funds | 41.4% | ||||
| Common Stocks | 18.5% | ||||
| U.S. Treasury Securities | 14.5% | ||||
| U.S. Government Agency Mortgage-Backed Securities | 6.0% | ||||
| Corporate Bonds | 5.6% | ||||
| Sovereign Governments and Agencies | 4.7% | ||||
| Collateralized Mortgage Obligations | 1.8% | ||||
| Asset-Backed Securities | 1.1% | ||||
| Commercial Mortgage-Backed Securities | 0.6% | ||||
| Municipal Securities | 0.3% | ||||
| Exchange-Traded Funds | 0.1% | ||||
| Preferred Securities | 0.0% | ||||
| Rights | 0.0% | ||||
| Short-Term Investments | 8.2% | ||||
| Other Assets and Liabilities | (2.8)% | ||||
What were the fund costs for the last year? (based on a hypothetical $10,000 investment) | ||||||||
Costs of a $10,000 investment | Costs paid as a percentage of a $10,000 investment | |||||||
| R6 Class | $35 | 0.34% | ||||||
| What were the key factors that affected the fund’s performance? | |||||
Strategic Allocation: Conservative Fund R6 Class returned 8.67% for the reporting period ended July 31, 2026. | |||||
| The fund is an asset allocation fund. That is, it diversifies its assets among various classes of investments such as equity securities, bonds and money market instruments. The fund seeks the highest level of total return consistent with its asset mix. See the Fund Holdings for the portfolio’s asset weights. Below, we discuss the factors that affected these asset classes. | |||||
• | The portfolio's U.S. stock holdings generally did well, with mid- and large-cap equities lagging small-cap stocks, while value stocks beat growth. This reflects uncertainty around spending on artificial intelligence (AI), which weighed most on mid- and large-cap growth stocks. Smaller and more value-oriented companies benefited from broad economic and earnings strength. | ||||
• | The portfolio's non-U.S. equity holdings generally outperformed U.S. stock holdings. That's because non-U.S. stocks benefited from attractive relative valuations as investors looked beyond the most expensive U.S. growth stocks. Nevertheless, some notable non-U.S. stocks did benefit from the broadening of the AI trade beyond U.S. borders. | ||||
• | The global bond allocation produced positive total returns and diversification benefits even as some of the world's leading central banks raised rates amid elevated inflation. For example, the European Central Bank and the Bank of Japan raised rates during the period, mindful of having left rates too low for too long ahead of the 2022 inflation shock. | ||||
• | The portfolio's cash allocation produced strong returns despite rate cuts by the Federal Reserve (Fed). Even as cash yields fell in line with the Fed rate changes, short-term yields remained in excess of inflation, and total returns exceeded those of intermediate- and long-term bonds. | ||||
Cumulative Performance (based on an initial $10,000 investment) | ||
July 31, 2016 through July 31, 2026 | ||
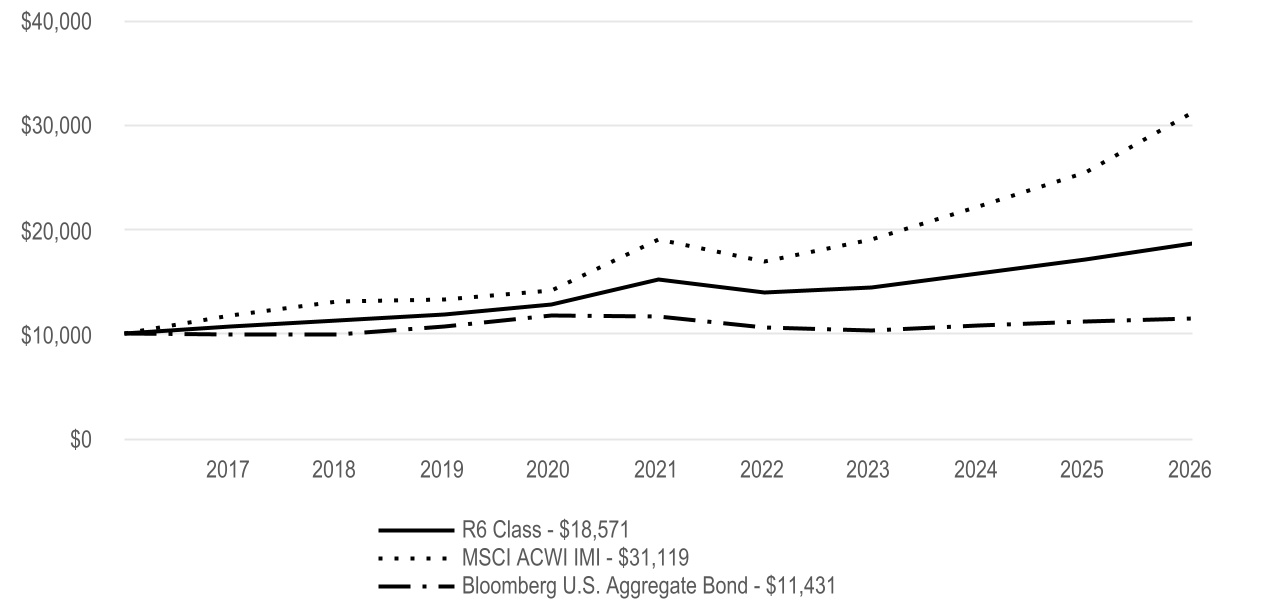
Average Annual Total Returns | |||||||||||
| 1 Year | 5 Year | 10 Year | |||||||||
| R6 Class | 8.67% | 4.18% | 6.39% | ||||||||
| MSCI ACWI IMI | 22.27% | 10.40% | 12.02% | ||||||||
| Bloomberg U.S. Aggregate Bond | 2.71% | -0.40% | 1.35% | ||||||||
| Fund Holdings | ||
Types of Investments in Portfolio (as a % of net assets) | |||||
| Affiliated Funds | 41.4% | ||||
| Common Stocks | 18.5% | ||||
| U.S. Treasury Securities | 14.5% | ||||
| U.S. Government Agency Mortgage-Backed Securities | 6.0% | ||||
| Corporate Bonds | 5.6% | ||||
| Sovereign Governments and Agencies | 4.7% | ||||
| Collateralized Mortgage Obligations | 1.8% | ||||
| Asset-Backed Securities | 1.1% | ||||
| Commercial Mortgage-Backed Securities | 0.6% | ||||
| Municipal Securities | 0.3% | ||||
| Exchange-Traded Funds | 0.1% | ||||
| Preferred Securities | 0.0% | ||||
| Rights | 0.0% | ||||
| Short-Term Investments | 8.2% | ||||
| Other Assets and Liabilities | (2.8)% | ||||
What were the fund costs for the last year? (based on a hypothetical $10,000 investment) | ||||||||
Costs of a $10,000 investment | Costs paid as a percentage of a $10,000 investment | |||||||
| Investor Class | $71 | 0.67% | ||||||
| What were the key factors that affected the fund’s performance? | |||||
Strategic Allocation: Moderate Fund Investor Class returned 11.60% for the reporting period ended July 31, 2026. | |||||
| The fund is an asset allocation fund. That is, it diversifies its assets among various classes of investments such as equity securities, bonds and money market instruments. The fund seeks the highest level of total return consistent with its asset mix. See the Fund Holdings for the portfolio’s asset weights. Below, we discuss the factors that affected these asset classes. | |||||
• | Global financial markets produced strong returns amid significant volatility related to inflation, interest rates and geopolitical trade tensions and war. Nevertheless, stocks rose because corporate earnings growth remained remarkably strong. The Federal Reserve cut interest rates three times during the period, but persistently high inflation meant that long-term bond yields actually rose. | ||||
• | The portfolio's U.S. stock holdings generally did well, with mid- and large-cap equities lagging small-cap stocks, while value stocks beat growth. This reflects uncertainty around spending on artificial intelligence (AI), which weighed most on mid- and large-cap growth stocks. Smaller and more value-oriented companies benefited from broad economic and earnings strength. | ||||
• | The portfolio's non-U.S. equity holdings generally outperformed U.S. stock holdings. That's because non-U.S. stocks benefited from attractive relative valuations as investors looked beyond the most expensive U.S. growth stocks. Emerging markets stocks also did very well, but this reflects the broadening of the AI trade beyond U.S. borders. | ||||
• | The global bond allocation produced positive total returns and diversification benefits even as some of the world's leading central banks raised rates amid elevated inflation. For example, the European Central Bank and the Bank of Japan raised rates during the period, mindful of having left rates too low for too long ahead of the 2022 inflation shock. | ||||
Cumulative Performance (based on an initial $10,000 investment) | ||
July 31, 2016 through July 31, 2026 | ||
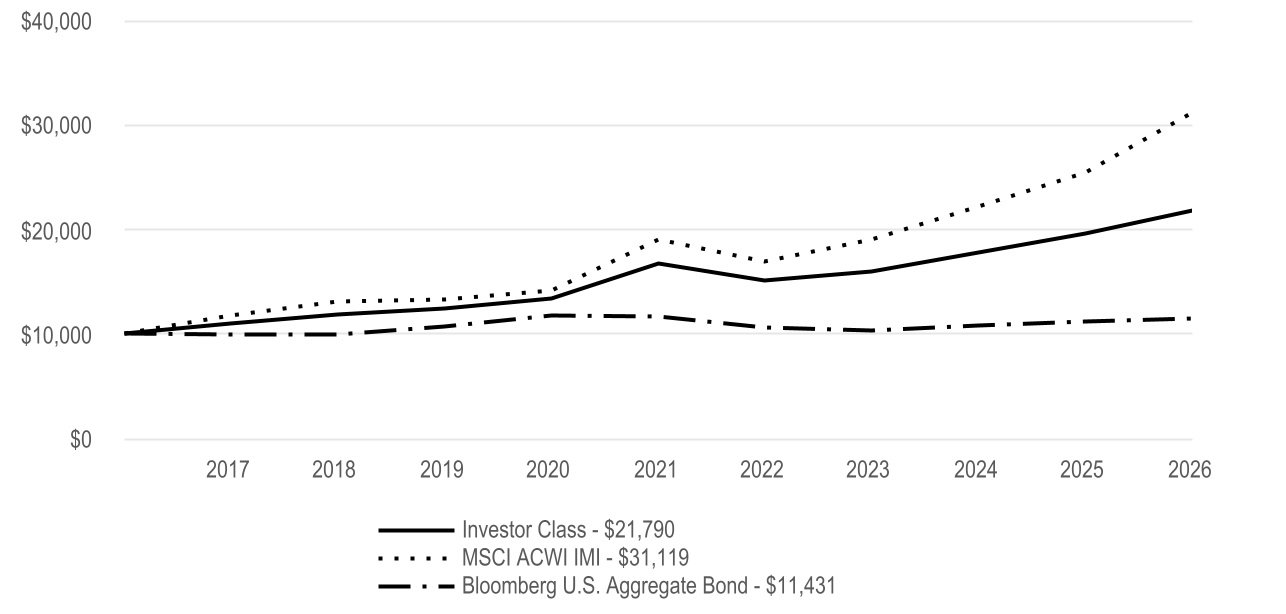
Average Annual Total Returns | |||||||||||
| 1 Year | 5 Year | 10 Year | |||||||||
| Investor Class | 11.60% | 5.47% | 8.10% | ||||||||
| MSCI ACWI IMI | 22.27% | 10.40% | 12.02% | ||||||||
| Bloomberg U.S. Aggregate Bond | 2.71% | -0.40% | 1.35% | ||||||||
| Fund Holdings | ||
Types of Investments in Portfolio (as a % of net assets) | |||||
| Affiliated Funds | 49.9% | ||||
| Common Stocks | 24.4% | ||||
| U.S. Treasury Securities | 8.5% | ||||
| U.S. Government Agency Mortgage-Backed Securities | 4.3% | ||||
| Sovereign Governments and Agencies | 3.3% | ||||
| Corporate Bonds | 3.0% | ||||
| Collateralized Mortgage Obligations | 1.1% | ||||
| Asset-Backed Securities | 0.7% | ||||
| Commercial Mortgage-Backed Securities | 0.4% | ||||
| Municipal Securities | 0.3% | ||||
| Exchange-Traded Funds | 0.2% | ||||
| Convertible Preferred Securities | 0.2% | ||||
| Collateralized Loan Obligations | 0.1% | ||||
| Preferred Securities | 0.0% | ||||
| Rights | 0.0% | ||||
| Short-Term Investments | 10.4% | ||||
| Other Assets and Liabilities | (6.8)% | ||||
What were the fund costs for the last year? (based on a hypothetical $10,000 investment) | ||||||||
Costs of a $10,000 investment | Costs paid as a percentage of a $10,000 investment | |||||||
| I Class | $50 | 0.47% | ||||||
| What were the key factors that affected the fund’s performance? | |||||
Strategic Allocation: Moderate Fund I Class returned 11.81% for the reporting period ended July 31, 2026. | |||||
| The fund is an asset allocation fund. That is, it diversifies its assets among various classes of investments such as equity securities, bonds and money market instruments. The fund seeks the highest level of total return consistent with its asset mix. See the Fund Holdings for the portfolio’s asset weights. Below, we discuss the factors that affected these asset classes. | |||||
• | Global financial markets produced strong returns amid significant volatility related to inflation, interest rates and geopolitical trade tensions and war. Nevertheless, stocks rose because corporate earnings growth remained remarkably strong. The Federal Reserve cut interest rates three times during the period, but persistently high inflation meant that long-term bond yields actually rose. | ||||
• | The portfolio's U.S. stock holdings generally did well, with mid- and large-cap equities lagging small-cap stocks, while value stocks beat growth. This reflects uncertainty around spending on artificial intelligence (AI), which weighed most on mid- and large-cap growth stocks. Smaller and more value-oriented companies benefited from broad economic and earnings strength. | ||||
• | The portfolio's non-U.S. equity holdings generally outperformed U.S. stock holdings. That's because non-U.S. stocks benefited from attractive relative valuations as investors looked beyond the most expensive U.S. growth stocks. Emerging markets stocks also did very well, but this reflects the broadening of the AI trade beyond U.S. borders. | ||||
• | The global bond allocation produced positive total returns and diversification benefits even as some of the world's leading central banks raised rates amid elevated inflation. For example, the European Central Bank and the Bank of Japan raised rates during the period, mindful of having left rates too low for too long ahead of the 2022 inflation shock. | ||||
Cumulative Performance (based on an initial $10,000 investment) | ||
July 31, 2016 through July 31, 2026 | ||
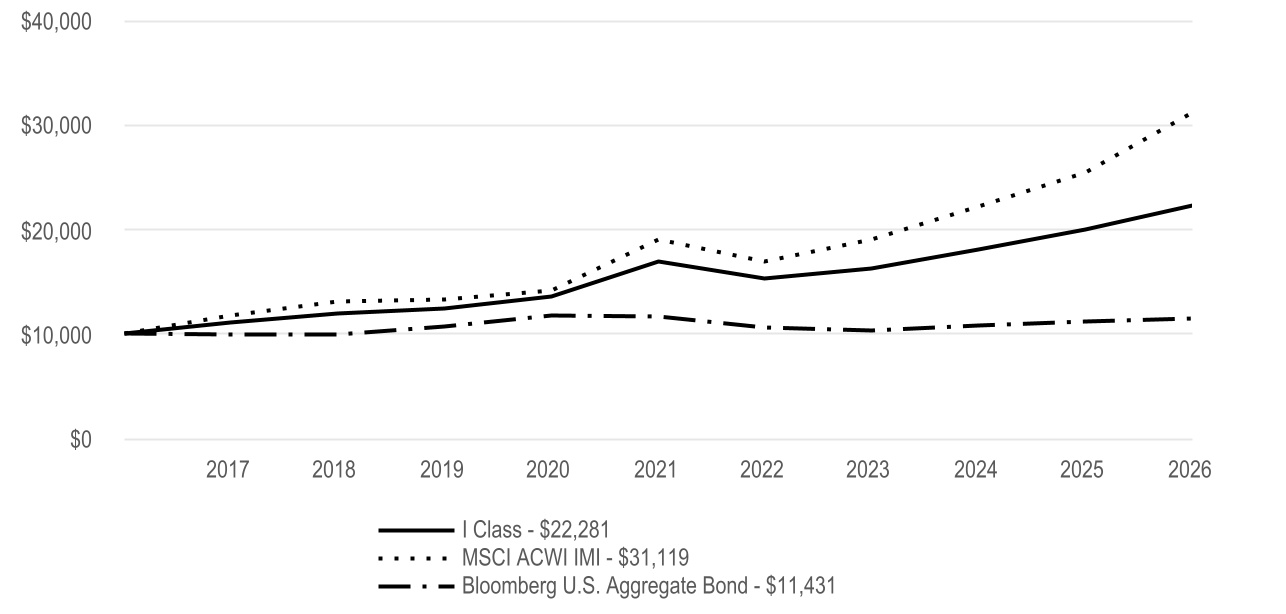
Average Annual Total Returns | |||||||||||
| 1 Year | 5 Year | 10 Year | |||||||||
| I Class | 11.81% | 5.70% | 8.34% | ||||||||
| MSCI ACWI IMI | 22.27% | 10.40% | 12.02% | ||||||||
| Bloomberg U.S. Aggregate Bond | 2.71% | -0.40% | 1.35% | ||||||||
| Fund Holdings | ||
Types of Investments in Portfolio (as a % of net assets) | |||||
| Affiliated Funds | 49.9% | ||||
| Common Stocks | 24.4% | ||||
| U.S. Treasury Securities | 8.5% | ||||
| U.S. Government Agency Mortgage-Backed Securities | 4.3% | ||||
| Sovereign Governments and Agencies | 3.3% | ||||
| Corporate Bonds | 3.0% | ||||
| Collateralized Mortgage Obligations | 1.1% | ||||
| Asset-Backed Securities | 0.7% | ||||
| Commercial Mortgage-Backed Securities | 0.4% | ||||
| Municipal Securities | 0.3% | ||||
| Exchange-Traded Funds | 0.2% | ||||
| Convertible Preferred Securities | 0.2% | ||||
| Collateralized Loan Obligations | 0.1% | ||||
| Preferred Securities | 0.0% | ||||
| Rights | 0.0% | ||||
| Short-Term Investments | 10.4% | ||||
| Other Assets and Liabilities | (6.8)% | ||||
What were the fund costs for the last year? (based on a hypothetical $10,000 investment) | ||||||||
Costs of a $10,000 investment | Costs paid as a percentage of a $10,000 investment | |||||||
| A Class | $97 | 0.92% | ||||||
| What were the key factors that affected the fund’s performance? | |||||
Strategic Allocation: Moderate Fund A Class returned 11.40% for the reporting period ended July 31, 2026. | |||||
| The fund is an asset allocation fund. That is, it diversifies its assets among various classes of investments such as equity securities, bonds and money market instruments. The fund seeks the highest level of total return consistent with its asset mix. See the Fund Holdings for the portfolio’s asset weights. Below, we discuss the factors that affected these asset classes. | |||||
• | Global financial markets produced strong returns amid significant volatility related to inflation, interest rates and geopolitical trade tensions and war. Nevertheless, stocks rose because corporate earnings growth remained remarkably strong. The Federal Reserve cut interest rates three times during the period, but persistently high inflation meant that long-term bond yields actually rose. | ||||
• | The portfolio's U.S. stock holdings generally did well, with mid- and large-cap equities lagging small-cap stocks, while value stocks beat growth. This reflects uncertainty around spending on artificial intelligence (AI), which weighed most on mid- and large-cap growth stocks. Smaller and more value-oriented companies benefited from broad economic and earnings strength. | ||||
• | The portfolio's non-U.S. equity holdings generally outperformed U.S. stock holdings. That's because non-U.S. stocks benefited from attractive relative valuations as investors looked beyond the most expensive U.S. growth stocks. Emerging markets stocks also did very well, but this reflects the broadening of the AI trade beyond U.S. borders. | ||||
• | The global bond allocation produced positive total returns and diversification benefits even as some of the world's leading central banks raised rates amid elevated inflation. For example, the European Central Bank and the Bank of Japan raised rates during the period, mindful of having left rates too low for too long ahead of the 2022 inflation shock. | ||||
Cumulative Performance (based on an initial $10,000 investment) | ||
July 31, 2016 through July 31, 2026 | ||
The initial investment is adjusted to reflect the maximum initial sales charge. | ||
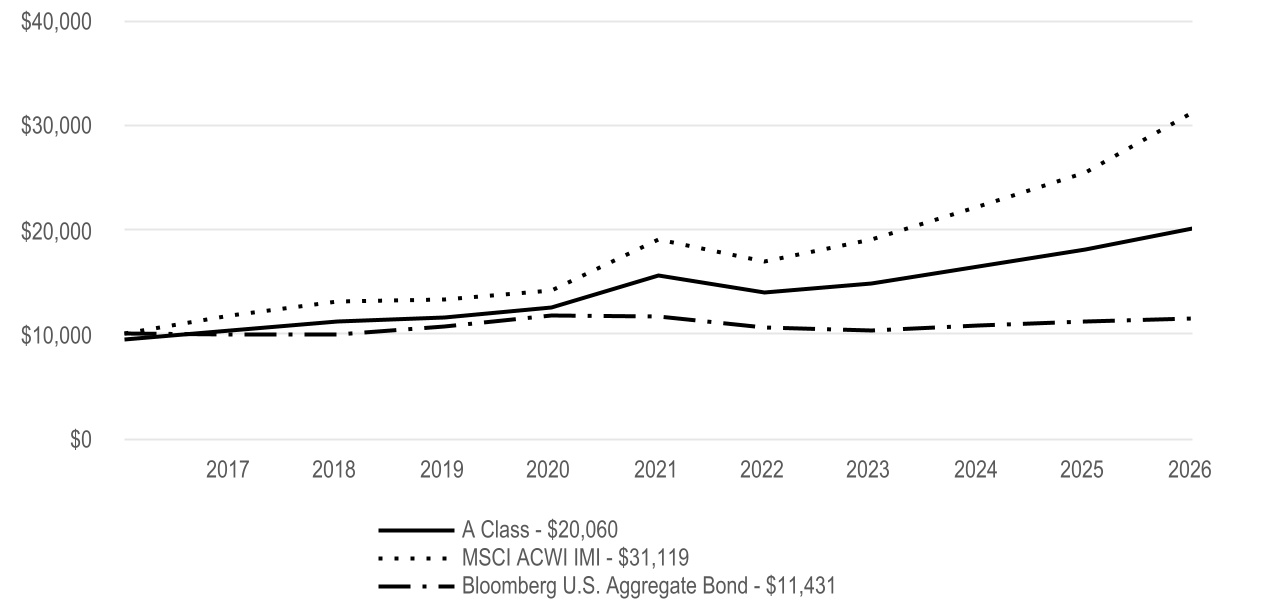
Average Annual Total Returns | |||||||||||
| 1 Year | 5 Year | 10 Year | |||||||||
| A Class | 11.40% | 5.23% | 7.85% | ||||||||
| A Class - with sales charge | 4.99% | 3.99% | 7.21% | ||||||||
| MSCI ACWI IMI | 22.27% | 10.40% | 12.02% | ||||||||
| Bloomberg U.S. Aggregate Bond | 2.71% | -0.40% | 1.35% | ||||||||
| Fund Holdings | ||
Types of Investments in Portfolio (as a % of net assets) | |||||
| Affiliated Funds | 49.9% | ||||
| Common Stocks | 24.4% | ||||
| U.S. Treasury Securities | 8.5% | ||||
| U.S. Government Agency Mortgage-Backed Securities | 4.3% | ||||
| Sovereign Governments and Agencies | 3.3% | ||||
| Corporate Bonds | 3.0% | ||||
| Collateralized Mortgage Obligations | 1.1% | ||||
| Asset-Backed Securities | 0.7% | ||||
| Commercial Mortgage-Backed Securities | 0.4% | ||||
| Municipal Securities | 0.3% | ||||
| Exchange-Traded Funds | 0.2% | ||||
| Convertible Preferred Securities | 0.2% | ||||
| Collateralized Loan Obligations | 0.1% | ||||
| Preferred Securities | 0.0% | ||||
| Rights | 0.0% | ||||
| Short-Term Investments | 10.4% | ||||
| Other Assets and Liabilities | (6.8)% | ||||
What were the fund costs for the last year? (based on a hypothetical $10,000 investment) | ||||||||
Costs of a $10,000 investment | Costs paid as a percentage of a $10,000 investment | |||||||
| C Class | $176 | 1.67% | ||||||
| What were the key factors that affected the fund’s performance? | |||||
Strategic Allocation: Moderate Fund C Class returned 10.52% for the reporting period ended July 31, 2026. | |||||
| The fund is an asset allocation fund. That is, it diversifies its assets among various classes of investments such as equity securities, bonds and money market instruments. The fund seeks the highest level of total return consistent with its asset mix. See the Fund Holdings for the portfolio’s asset weights. Below, we discuss the factors that affected these asset classes. | |||||
• | Global financial markets produced strong returns amid significant volatility related to inflation, interest rates and geopolitical trade tensions and war. Nevertheless, stocks rose because corporate earnings growth remained remarkably strong. The Federal Reserve cut interest rates three times during the period, but persistently high inflation meant that long-term bond yields actually rose. | ||||
• | The portfolio's U.S. stock holdings generally did well, with mid- and large-cap equities lagging small-cap stocks, while value stocks beat growth. This reflects uncertainty around spending on artificial intelligence (AI), which weighed most on mid- and large-cap growth stocks. Smaller and more value-oriented companies benefited from broad economic and earnings strength. | ||||
• | The portfolio's non-U.S. equity holdings generally outperformed U.S. stock holdings. That's because non-U.S. stocks benefited from attractive relative valuations as investors looked beyond the most expensive U.S. growth stocks. Emerging markets stocks also did very well, but this reflects the broadening of the AI trade beyond U.S. borders. | ||||
• | The global bond allocation produced positive total returns and diversification benefits even as some of the world's leading central banks raised rates amid elevated inflation. For example, the European Central Bank and the Bank of Japan raised rates during the period, mindful of having left rates too low for too long ahead of the 2022 inflation shock. | ||||
Cumulative Performance (based on an initial $10,000 investment) | ||
July 31, 2016 through July 31, 2026 | ||
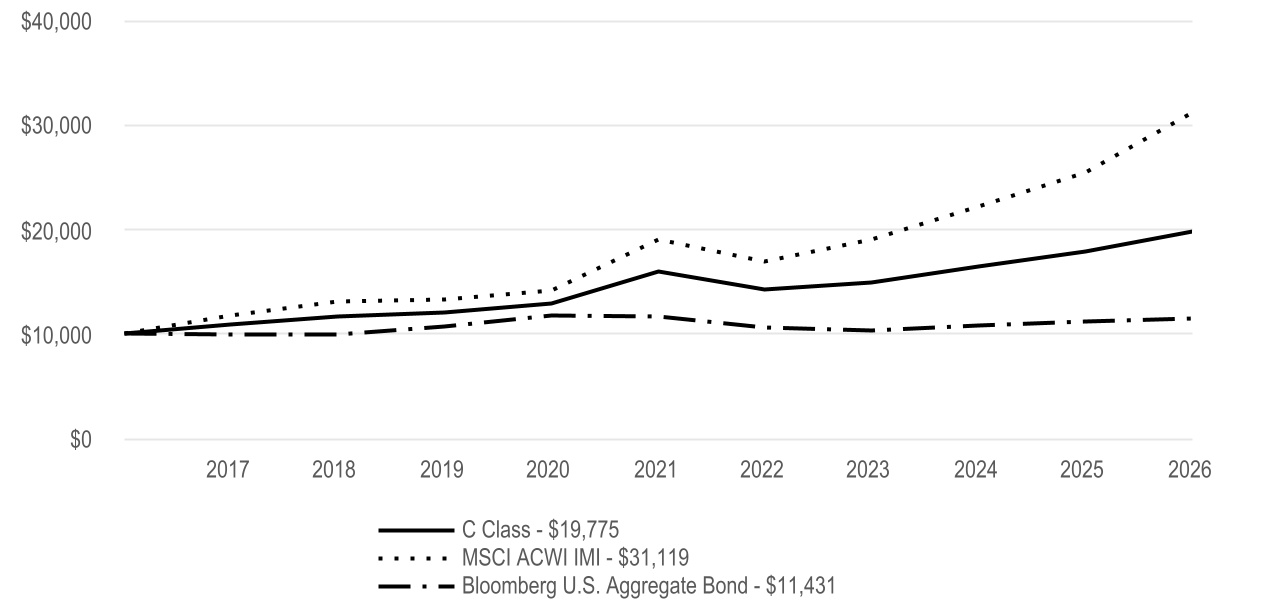
Average Annual Total Returns | |||||||||||
| 1 Year | 5 Year | 10 Year | |||||||||
| C Class | 10.52% | 4.46% | 7.06% | ||||||||
| MSCI ACWI IMI | 22.27% | 10.40% | 12.02% | ||||||||
| Bloomberg U.S. Aggregate Bond | 2.71% | -0.40% | 1.35% | ||||||||
| Fund Holdings | ||
Types of Investments in Portfolio (as a % of net assets) | |||||
| Affiliated Funds | 49.9% | ||||
| Common Stocks | 24.4% | ||||
| U.S. Treasury Securities | 8.5% | ||||
| U.S. Government Agency Mortgage-Backed Securities | 4.3% | ||||
| Sovereign Governments and Agencies | 3.3% | ||||
| Corporate Bonds | 3.0% | ||||
| Collateralized Mortgage Obligations | 1.1% | ||||
| Asset-Backed Securities | 0.7% | ||||
| Commercial Mortgage-Backed Securities | 0.4% | ||||
| Municipal Securities | 0.3% | ||||
| Exchange-Traded Funds | 0.2% | ||||
| Convertible Preferred Securities | 0.2% | ||||
| Collateralized Loan Obligations | 0.1% | ||||
| Preferred Securities | 0.0% | ||||
| Rights | 0.0% | ||||
| Short-Term Investments | 10.4% | ||||
| Other Assets and Liabilities | (6.8)% | ||||
What were the fund costs for the last year? (based on a hypothetical $10,000 investment) | ||||||||
Costs of a $10,000 investment | Costs paid as a percentage of a $10,000 investment | |||||||
| R Class | $123 | 1.17% | ||||||
| What were the key factors that affected the fund’s performance? | |||||
Strategic Allocation: Moderate Fund R Class returned 11.11% for the reporting period ended July 31, 2026. | |||||
| The fund is an asset allocation fund. That is, it diversifies its assets among various classes of investments such as equity securities, bonds and money market instruments. The fund seeks the highest level of total return consistent with its asset mix. See the Fund Holdings for the portfolio’s asset weights. Below, we discuss the factors that affected these asset classes. | |||||
• | Global financial markets produced strong returns amid significant volatility related to inflation, interest rates and geopolitical trade tensions and war. Nevertheless, stocks rose because corporate earnings growth remained remarkably strong. The Federal Reserve cut interest rates three times during the period, but persistently high inflation meant that long-term bond yields actually rose. | ||||
• | The portfolio's U.S. stock holdings generally did well, with mid- and large-cap equities lagging small-cap stocks, while value stocks beat growth. This reflects uncertainty around spending on artificial intelligence (AI), which weighed most on mid- and large-cap growth stocks. Smaller and more value-oriented companies benefited from broad economic and earnings strength. | ||||
• | The portfolio's non-U.S. equity holdings generally outperformed U.S. stock holdings. That's because non-U.S. stocks benefited from attractive relative valuations as investors looked beyond the most expensive U.S. growth stocks. Emerging markets stocks also did very well, but this reflects the broadening of the AI trade beyond U.S. borders. | ||||
• | The global bond allocation produced positive total returns and diversification benefits even as some of the world's leading central banks raised rates amid elevated inflation. For example, the European Central Bank and the Bank of Japan raised rates during the period, mindful of having left rates too low for too long ahead of the 2022 inflation shock. | ||||
Cumulative Performance (based on an initial $10,000 investment) | ||
July 31, 2016 through July 31, 2026 | ||
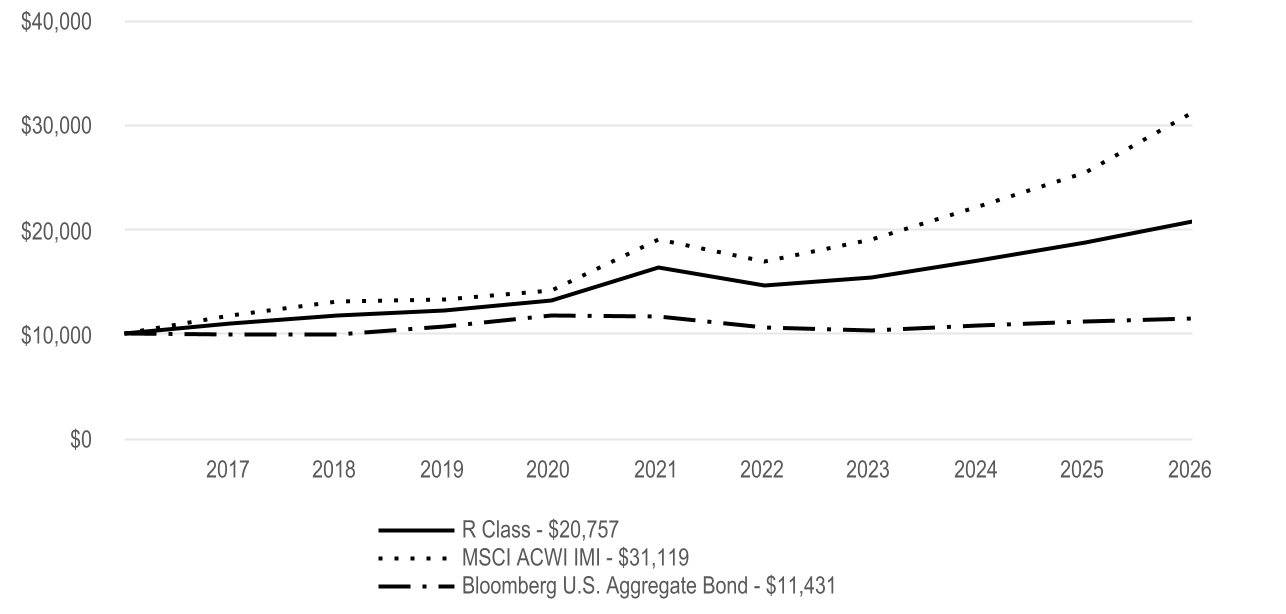
Average Annual Total Returns | |||||||||||
| 1 Year | 5 Year | 10 Year | |||||||||
| R Class | 11.11% | 4.95% | 7.58% | ||||||||
| MSCI ACWI IMI | 22.27% | 10.40% | 12.02% | ||||||||
| Bloomberg U.S. Aggregate Bond | 2.71% | -0.40% | 1.35% | ||||||||
| Fund Holdings | ||
Types of Investments in Portfolio (as a % of net assets) | |||||
| Affiliated Funds | 49.9% | ||||
| Common Stocks | 24.4% | ||||
| U.S. Treasury Securities | 8.5% | ||||
| U.S. Government Agency Mortgage-Backed Securities | 4.3% | ||||
| Sovereign Governments and Agencies | 3.3% | ||||
| Corporate Bonds | 3.0% | ||||
| Collateralized Mortgage Obligations | 1.1% | ||||
| Asset-Backed Securities | 0.7% | ||||
| Commercial Mortgage-Backed Securities | 0.4% | ||||
| Municipal Securities | 0.3% | ||||
| Exchange-Traded Funds | 0.2% | ||||
| Convertible Preferred Securities | 0.2% | ||||
| Collateralized Loan Obligations | 0.1% | ||||
| Preferred Securities | 0.0% | ||||
| Rights | 0.0% | ||||
| Short-Term Investments | 10.4% | ||||
| Other Assets and Liabilities | (6.8)% | ||||
What were the fund costs for the last year? (based on a hypothetical $10,000 investment) | ||||||||
Costs of a $10,000 investment | Costs paid as a percentage of a $10,000 investment | |||||||
| R5 Class | $50 | 0.47% | ||||||
| What were the key factors that affected the fund’s performance? | |||||
Strategic Allocation: Moderate Fund R5 Class returned 11.63% for the reporting period ended July 31, 2026. | |||||
| The fund is an asset allocation fund. That is, it diversifies its assets among various classes of investments such as equity securities, bonds and money market instruments. The fund seeks the highest level of total return consistent with its asset mix. See the Fund Holdings for the portfolio’s asset weights. Below, we discuss the factors that affected these asset classes. | |||||
• | Global financial markets produced strong returns amid significant volatility related to inflation, interest rates and geopolitical trade tensions and war. Nevertheless, stocks rose because corporate earnings growth remained remarkably strong. The Federal Reserve cut interest rates three times during the period, but persistently high inflation meant that long-term bond yields actually rose. | ||||
• | The portfolio's U.S. stock holdings generally did well, with mid- and large-cap equities lagging small-cap stocks, while value stocks beat growth. This reflects uncertainty around spending on artificial intelligence (AI), which weighed most on mid- and large-cap growth stocks. Smaller and more value-oriented companies benefited from broad economic and earnings strength. | ||||
• | The portfolio's non-U.S. equity holdings generally outperformed U.S. stock holdings. That's because non-U.S. stocks benefited from attractive relative valuations as investors looked beyond the most expensive U.S. growth stocks. Emerging markets stocks also did very well, but this reflects the broadening of the AI trade beyond U.S. borders. | ||||
• | The global bond allocation produced positive total returns and diversification benefits even as some of the world's leading central banks raised rates amid elevated inflation. For example, the European Central Bank and the Bank of Japan raised rates during the period, mindful of having left rates too low for too long ahead of the 2022 inflation shock. | ||||
Cumulative Performance (based on an initial $10,000 investment) | ||
April 10, 2017 through July 31, 2026 | ||
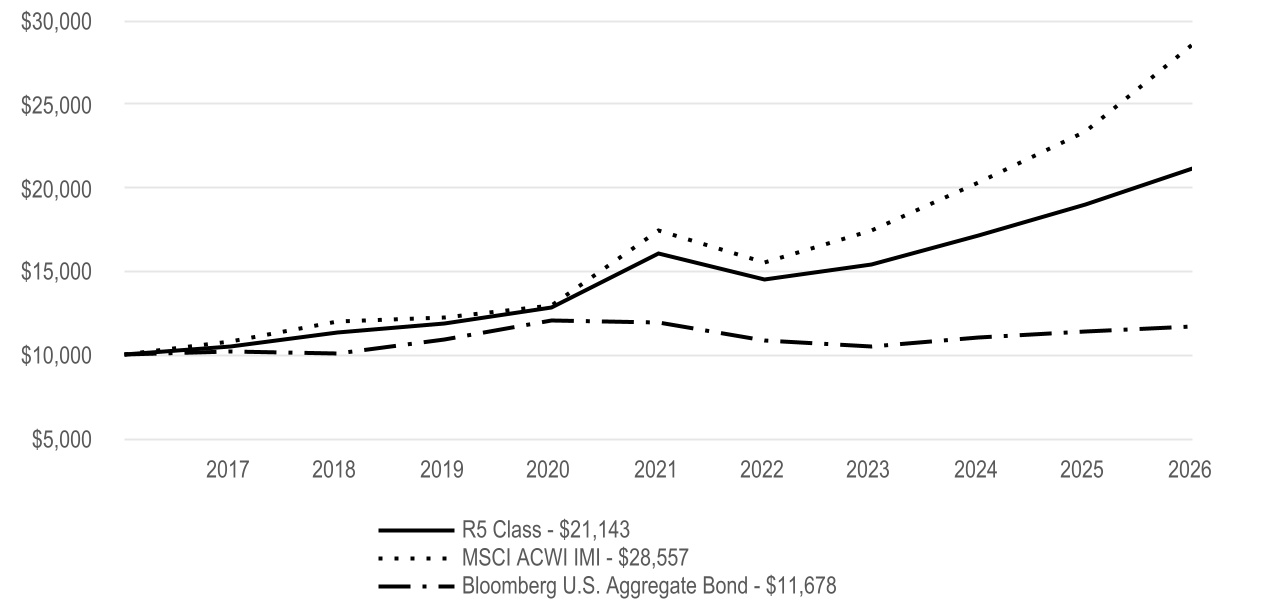
Average Annual Total Returns | ||||||||||||||
| 1 Year | 5 Year | Since Inception | Inception Date | |||||||||||
| R5 Class | 11.63% | 5.67% | 8.37% | 4/10/17 | ||||||||||
| MSCI ACWI IMI | 22.27% | 10.40% | 11.93% | — | ||||||||||
| Bloomberg U.S. Aggregate Bond | 2.71% | -0.40% | 1.68% | — | ||||||||||
| Fund Holdings | ||
Types of Investments in Portfolio (as a % of net assets) | |||||
| Affiliated Funds | 49.9% | ||||
| Common Stocks | 24.4% | ||||
| U.S. Treasury Securities | 8.5% | ||||
| U.S. Government Agency Mortgage-Backed Securities | 4.3% | ||||
| Sovereign Governments and Agencies | 3.3% | ||||
| Corporate Bonds | 3.0% | ||||
| Collateralized Mortgage Obligations | 1.1% | ||||
| Asset-Backed Securities | 0.7% | ||||
| Commercial Mortgage-Backed Securities | 0.4% | ||||
| Municipal Securities | 0.3% | ||||
| Exchange-Traded Funds | 0.2% | ||||
| Convertible Preferred Securities | 0.2% | ||||
| Collateralized Loan Obligations | 0.1% | ||||
| Preferred Securities | 0.0% | ||||
| Rights | 0.0% | ||||
| Short-Term Investments | 10.4% | ||||
| Other Assets and Liabilities | (6.8)% | ||||
What were the fund costs for the last year? (based on a hypothetical $10,000 investment) | ||||||||
Costs of a $10,000 investment | Costs paid as a percentage of a $10,000 investment | |||||||
| R6 Class | $34 | 0.32% | ||||||
| What were the key factors that affected the fund’s performance? | |||||
Strategic Allocation: Moderate Fund R6 Class returned 12.00% for the reporting period ended July 31, 2026. | |||||
| The fund is an asset allocation fund. That is, it diversifies its assets among various classes of investments such as equity securities, bonds and money market instruments. The fund seeks the highest level of total return consistent with its asset mix. See the Fund Holdings for the portfolio’s asset weights. Below, we discuss the factors that affected these asset classes. | |||||
• | Global financial markets produced strong returns amid significant volatility related to inflation, interest rates and geopolitical trade tensions and war. Nevertheless, stocks rose because corporate earnings growth remained remarkably strong. The Federal Reserve cut interest rates three times during the period, but persistently high inflation meant that long-term bond yields actually rose. | ||||
• | The portfolio's U.S. stock holdings generally did well, with mid- and large-cap equities lagging small-cap stocks, while value stocks beat growth. This reflects uncertainty around spending on artificial intelligence (AI), which weighed most on mid- and large-cap growth stocks. Smaller and more value-oriented companies benefited from broad economic and earnings strength. | ||||
• | The portfolio's non-U.S. equity holdings generally outperformed U.S. stock holdings. That's because non-U.S. stocks benefited from attractive relative valuations as investors looked beyond the most expensive U.S. growth stocks. Emerging markets stocks also did very well, but this reflects the broadening of the AI trade beyond U.S. borders. | ||||
• | The global bond allocation produced positive total returns and diversification benefits even as some of the world's leading central banks raised rates amid elevated inflation. For example, the European Central Bank and the Bank of Japan raised rates during the period, mindful of having left rates too low for too long ahead of the 2022 inflation shock. | ||||
Cumulative Performance (based on an initial $10,000 investment) | ||
July 31, 2016 through July 31, 2026 | ||
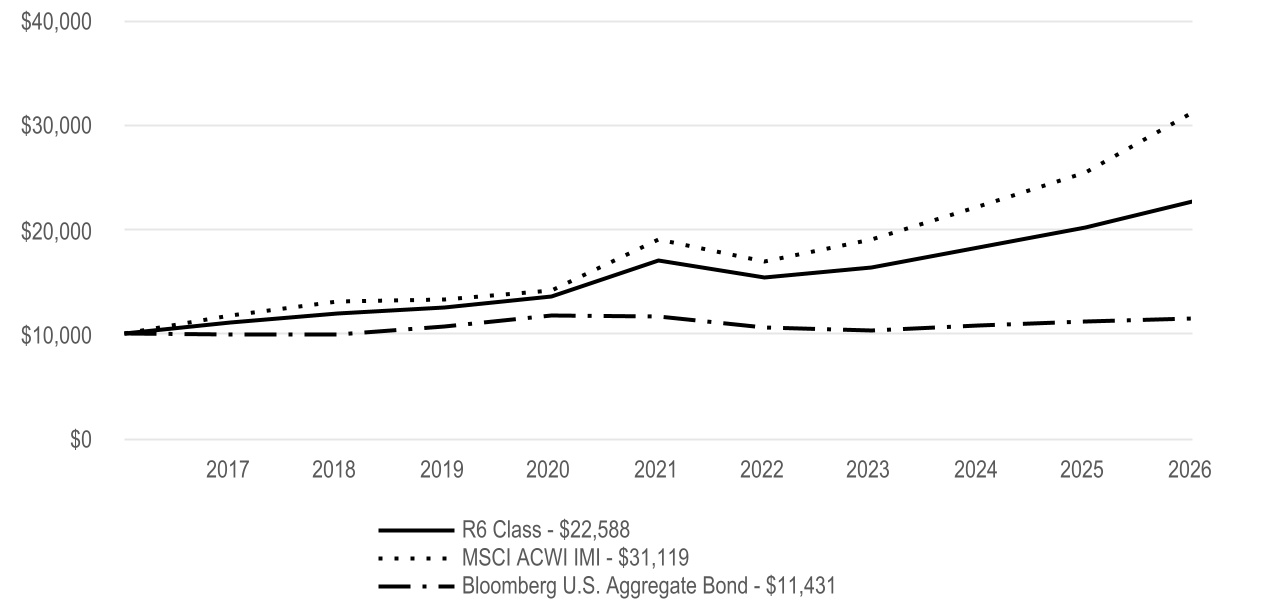
Average Annual Total Returns | |||||||||||
| 1 Year | 5 Year | 10 Year | |||||||||
| R6 Class | 12.00% | 5.85% | 8.49% | ||||||||
| MSCI ACWI IMI | 22.27% | 10.40% | 12.02% | ||||||||
| Bloomberg U.S. Aggregate Bond | 2.71% | -0.40% | 1.35% | ||||||||
| Fund Holdings | ||
Types of Investments in Portfolio (as a % of net assets) | |||||
| Affiliated Funds | 49.9% | ||||
| Common Stocks | 24.4% | ||||
| U.S. Treasury Securities | 8.5% | ||||
| U.S. Government Agency Mortgage-Backed Securities | 4.3% | ||||
| Sovereign Governments and Agencies | 3.3% | ||||
| Corporate Bonds | 3.0% | ||||
| Collateralized Mortgage Obligations | 1.1% | ||||
| Asset-Backed Securities | 0.7% | ||||
| Commercial Mortgage-Backed Securities | 0.4% | ||||
| Municipal Securities | 0.3% | ||||
| Exchange-Traded Funds | 0.2% | ||||
| Convertible Preferred Securities | 0.2% | ||||
| Collateralized Loan Obligations | 0.1% | ||||
| Preferred Securities | 0.0% | ||||
| Rights | 0.0% | ||||
| Short-Term Investments | 10.4% | ||||
| Other Assets and Liabilities | (6.8)% | ||||
What were the fund costs for the last year? (based on a hypothetical $10,000 investment) | ||||||||
Costs of a $10,000 investment | Costs paid as a percentage of a $10,000 investment | |||||||
| Investor Class | $64 | 0.60% | ||||||
| What were the key factors that affected the fund’s performance? | |||||
Strategic Allocation: Aggressive Fund Investor Class returned 14.49% for the reporting period ended July 31, 2026. | |||||
| The fund is an asset allocation fund. That is, it diversifies its assets among various classes of investments such as equity securities, bonds and money market instruments. The fund seeks the highest level of total return consistent with its asset mix. See the Fund Holdings for the portfolio’s asset weights. Below, we discuss the factors that affected these asset classes. | |||||
• | Global financial markets produced strong returns amid significant volatility related to inflation, interest rates and geopolitical trade tensions and war. Nevertheless, stocks rose because corporate earnings growth remained remarkably strong. The Federal Reserve cut interest rates three times during the period, but persistently high inflation meant that long-term bond yields actually rose. | ||||
• | The portfolio's U.S. stock holdings generally did well, with mid- and large-cap equities lagging small-cap stocks, while value stocks beat growth. This reflects uncertainty around spending on artificial intelligence (AI), which weighed most on mid- and large-cap growth stocks. Smaller and more value-oriented companies benefited from broad economic and earnings strength. | ||||
• | The portfolio's non-U.S. equity holdings generally outperformed U.S. stock holdings. That's because non-U.S. stocks benefited from attractive relative valuations as investors looked beyond the most expensive U.S. growth stocks. Emerging markets stocks also did very well, but this reflects the broadening of the AI trade beyond U.S. borders. | ||||
• | The global bond allocation produced positive total returns and diversification benefits even as some of the world's leading central banks raised rates amid elevated inflation. For example, the European Central Bank and the Bank of Japan raised rates during the period, mindful of having left rates too low for too long ahead of the 2022 inflation shock. | ||||
Cumulative Performance (based on an initial $10,000 investment) | ||
July 31, 2016 through July 31, 2026 | ||
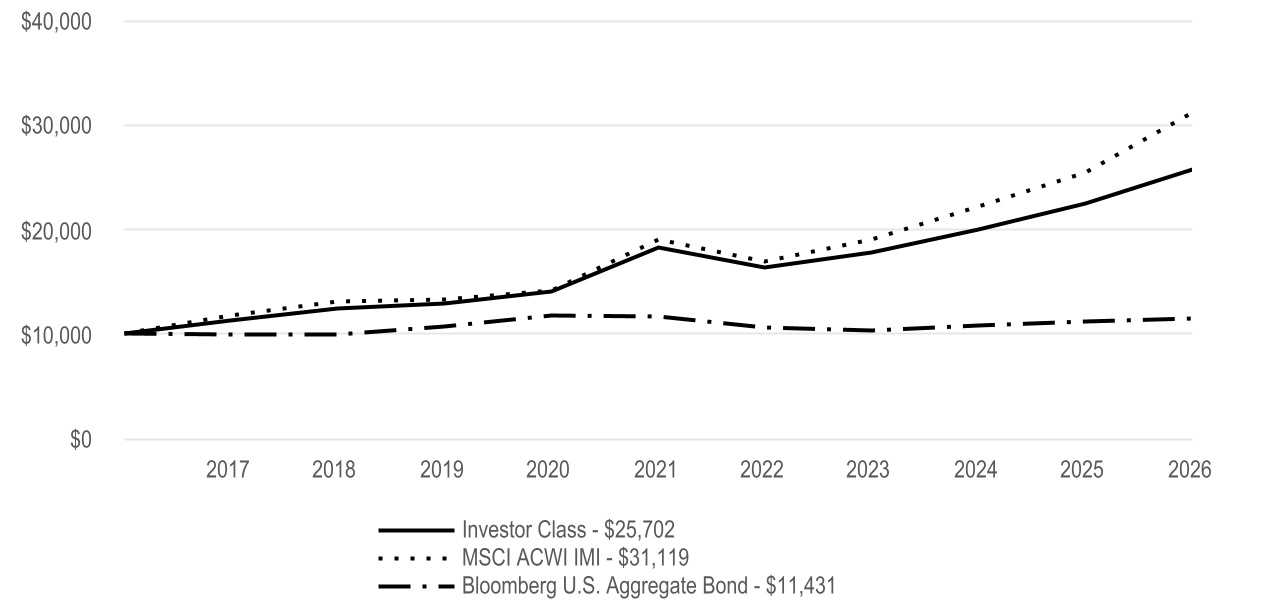
Average Annual Total Returns | |||||||||||
| 1 Year | 5 Year | 10 Year | |||||||||
| Investor Class | 14.49% | 7.10% | 9.90% | ||||||||
| MSCI ACWI IMI | 22.27% | 10.40% | 12.02% | ||||||||
| Bloomberg U.S. Aggregate Bond | 2.71% | -0.40% | 1.35% | ||||||||
| Fund Holdings | ||
Types of Investments in Portfolio (as a % of net assets) | |||||
| Affiliated Funds | 58.5% | ||||
| Common Stocks | 29.9% | ||||
| Corporate Bonds | 2.8% | ||||
| U.S. Government Agency Mortgage-Backed Securities | 2.3% | ||||
| Sovereign Governments and Agencies | 1.6% | ||||
| U.S. Treasury Securities | 1.0% | ||||
| Collateralized Mortgage Obligations | 0.7% | ||||
| Convertible Preferred Securities | 0.6% | ||||
| Asset-Backed Securities | 0.4% | ||||
| Preferred Securities | 0.4% | ||||
| Exchange-Traded Funds | 0.4% | ||||
| Bank Loan Obligations | 0.2% | ||||
| Commercial Mortgage-Backed Securities | 0.2% | ||||
| Municipal Securities | 0.0% | ||||
| Rights | 0.0% | ||||
| Short-Term Investments | 8.1% | ||||
| Other Assets and Liabilities | (7.1)% | ||||
What were the fund costs for the last year? (based on a hypothetical $10,000 investment) | ||||||||
Costs of a $10,000 investment | Costs paid as a percentage of a $10,000 investment | |||||||
| I Class | $43 | 0.40% | ||||||
| What were the key factors that affected the fund’s performance? | |||||
Strategic Allocation: Aggressive Fund I Class returned 14.78% for the reporting period ended July 31, 2026. | |||||
| The fund is an asset allocation fund. That is, it diversifies its assets among various classes of investments such as equity securities, bonds and money market instruments. The fund seeks the highest level of total return consistent with its asset mix. See the Fund Holdings for the portfolio’s asset weights. Below, we discuss the factors that affected these asset classes. | |||||
• | Global financial markets produced strong returns amid significant volatility related to inflation, interest rates and geopolitical trade tensions and war. Nevertheless, stocks rose because corporate earnings growth remained remarkably strong. The Federal Reserve cut interest rates three times during the period, but persistently high inflation meant that long-term bond yields actually rose. | ||||
• | The portfolio's U.S. stock holdings generally did well, with mid- and large-cap equities lagging small-cap stocks, while value stocks beat growth. This reflects uncertainty around spending on artificial intelligence (AI), which weighed most on mid- and large-cap growth stocks. Smaller and more value-oriented companies benefited from broad economic and earnings strength. | ||||
• | The portfolio's non-U.S. equity holdings generally outperformed U.S. stock holdings. That's because non-U.S. stocks benefited from attractive relative valuations as investors looked beyond the most expensive U.S. growth stocks. Emerging markets stocks also did very well, but this reflects the broadening of the AI trade beyond U.S. borders. | ||||
• | The global bond allocation produced positive total returns and diversification benefits even as some of the world's leading central banks raised rates amid elevated inflation. For example, the European Central Bank and the Bank of Japan raised rates during the period, mindful of having left rates too low for too long ahead of the 2022 inflation shock. | ||||
Cumulative Performance (based on an initial $10,000 investment) | ||
July 31, 2016 through July 31, 2026 | ||
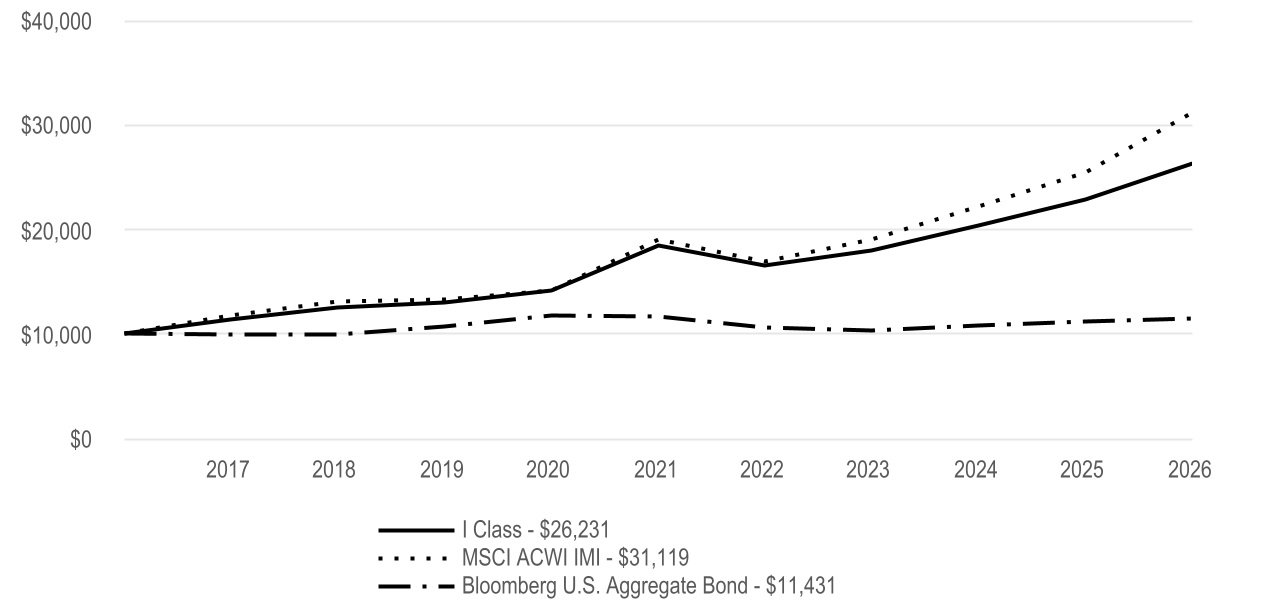
Average Annual Total Returns | |||||||||||
| 1 Year | 5 Year | 10 Year | |||||||||
| I Class | 14.78% | 7.31% | 10.12% | ||||||||
| MSCI ACWI IMI | 22.27% | 10.40% | 12.02% | ||||||||
| Bloomberg U.S. Aggregate Bond | 2.71% | -0.40% | 1.35% | ||||||||
| Fund Holdings | ||
Types of Investments in Portfolio (as a % of net assets) | |||||
| Affiliated Funds | 58.5% | ||||
| Common Stocks | 29.9% | ||||
| Corporate Bonds | 2.8% | ||||
| U.S. Government Agency Mortgage-Backed Securities | 2.3% | ||||
| Sovereign Governments and Agencies | 1.6% | ||||
| U.S. Treasury Securities | 1.0% | ||||
| Collateralized Mortgage Obligations | 0.7% | ||||
| Convertible Preferred Securities | 0.6% | ||||
| Asset-Backed Securities | 0.4% | ||||
| Preferred Securities | 0.4% | ||||
| Exchange-Traded Funds | 0.4% | ||||
| Bank Loan Obligations | 0.2% | ||||
| Commercial Mortgage-Backed Securities | 0.2% | ||||
| Municipal Securities | 0.0% | ||||
| Rights | 0.0% | ||||
| Short-Term Investments | 8.1% | ||||
| Other Assets and Liabilities | (7.1)% | ||||
What were the fund costs for the last year? (based on a hypothetical $10,000 investment) | ||||||||
Costs of a $10,000 investment | Costs paid as a percentage of a $10,000 investment | |||||||
| A Class | $91 | 0.85% | ||||||
| What were the key factors that affected the fund’s performance? | |||||
Strategic Allocation: Aggressive Fund A Class returned 14.25% for the reporting period ended July 31, 2026. | |||||
| The fund is an asset allocation fund. That is, it diversifies its assets among various classes of investments such as equity securities, bonds and money market instruments. The fund seeks the highest level of total return consistent with its asset mix. See the Fund Holdings for the portfolio’s asset weights. Below, we discuss the factors that affected these asset classes. | |||||
• | Global financial markets produced strong returns amid significant volatility related to inflation, interest rates and geopolitical trade tensions and war. Nevertheless, stocks rose because corporate earnings growth remained remarkably strong. The Federal Reserve cut interest rates three times during the period, but persistently high inflation meant that long-term bond yields actually rose. | ||||
• | The portfolio's U.S. stock holdings generally did well, with mid- and large-cap equities lagging small-cap stocks, while value stocks beat growth. This reflects uncertainty around spending on artificial intelligence (AI), which weighed most on mid- and large-cap growth stocks. Smaller and more value-oriented companies benefited from broad economic and earnings strength. | ||||
• | The portfolio's non-U.S. equity holdings generally outperformed U.S. stock holdings. That's because non-U.S. stocks benefited from attractive relative valuations as investors looked beyond the most expensive U.S. growth stocks. Emerging markets stocks also did very well, but this reflects the broadening of the AI trade beyond U.S. borders. | ||||
• | The global bond allocation produced positive total returns and diversification benefits even as some of the world's leading central banks raised rates amid elevated inflation. For example, the European Central Bank and the Bank of Japan raised rates during the period, mindful of having left rates too low for too long ahead of the 2022 inflation shock. | ||||
Cumulative Performance (based on an initial $10,000 investment) | ||
July 31, 2016 through July 31, 2026 | ||
The initial investment is adjusted to reflect the maximum initial sales charge. | ||
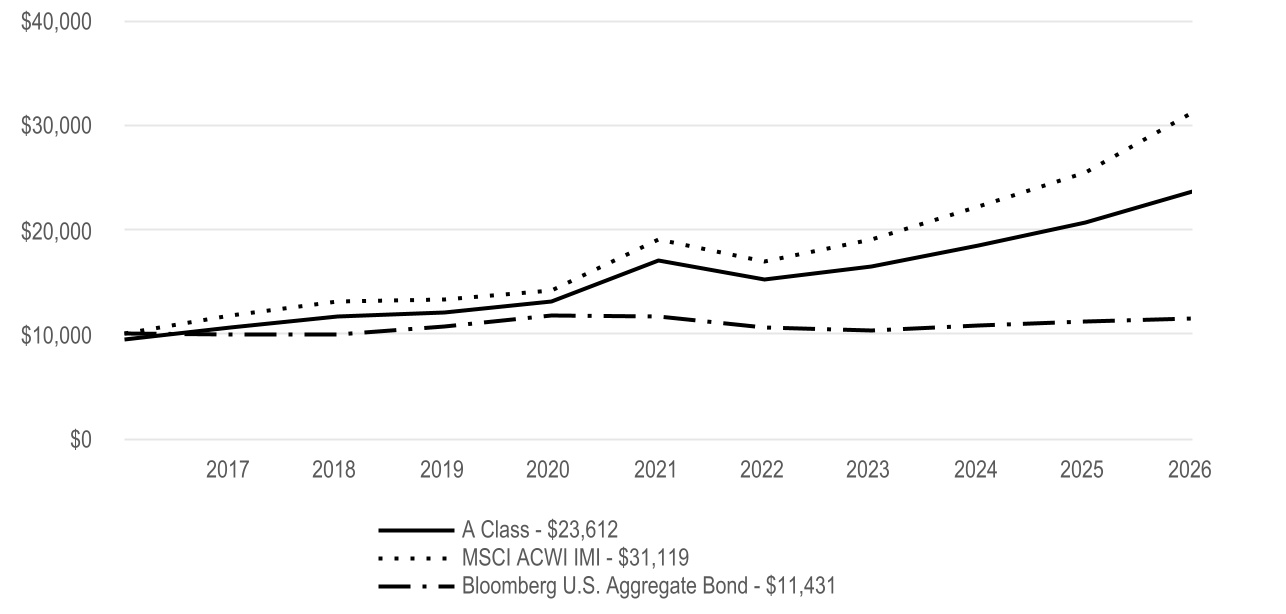
Average Annual Total Returns | |||||||||||
| 1 Year | 5 Year | 10 Year | |||||||||
| A Class | 14.25% | 6.84% | 9.62% | ||||||||
| A Class - with sales charge | 7.68% | 5.58% | 8.97% | ||||||||
| MSCI ACWI IMI | 22.27% | 10.40% | 12.02% | ||||||||
| Bloomberg U.S. Aggregate Bond | 2.71% | -0.40% | 1.35% | ||||||||
| Fund Holdings | ||
Types of Investments in Portfolio (as a % of net assets) | |||||
| Affiliated Funds | 58.5% | ||||
| Common Stocks | 29.9% | ||||
| Corporate Bonds | 2.8% | ||||
| U.S. Government Agency Mortgage-Backed Securities | 2.3% | ||||
| Sovereign Governments and Agencies | 1.6% | ||||
| U.S. Treasury Securities | 1.0% | ||||
| Collateralized Mortgage Obligations | 0.7% | ||||
| Convertible Preferred Securities | 0.6% | ||||
| Asset-Backed Securities | 0.4% | ||||
| Preferred Securities | 0.4% | ||||
| Exchange-Traded Funds | 0.4% | ||||
| Bank Loan Obligations | 0.2% | ||||
| Commercial Mortgage-Backed Securities | 0.2% | ||||
| Municipal Securities | 0.0% | ||||
| Rights | 0.0% | ||||
| Short-Term Investments | 8.1% | ||||
| Other Assets and Liabilities | (7.1)% | ||||
What were the fund costs for the last year? (based on a hypothetical $10,000 investment) | ||||||||
Costs of a $10,000 investment | Costs paid as a percentage of a $10,000 investment | |||||||
| C Class | $171 | 1.60% | ||||||
| What were the key factors that affected the fund’s performance? | |||||
Strategic Allocation: Aggressive Fund C Class returned 13.37% for the reporting period ended July 31, 2026. | |||||
| The fund is an asset allocation fund. That is, it diversifies its assets among various classes of investments such as equity securities, bonds and money market instruments. The fund seeks the highest level of total return consistent with its asset mix. See the Fund Holdings for the portfolio’s asset weights. Below, we discuss the factors that affected these asset classes. | |||||
• | Global financial markets produced strong returns amid significant volatility related to inflation, interest rates and geopolitical trade tensions and war. Nevertheless, stocks rose because corporate earnings growth remained remarkably strong. The Federal Reserve cut interest rates three times during the period, but persistently high inflation meant that long-term bond yields actually rose. | ||||
• | The portfolio's U.S. stock holdings generally did well, with mid- and large-cap equities lagging small-cap stocks, while value stocks beat growth. This reflects uncertainty around spending on artificial intelligence (AI), which weighed most on mid- and large-cap growth stocks. Smaller and more value-oriented companies benefited from broad economic and earnings strength. | ||||
• | The portfolio's non-U.S. equity holdings generally outperformed U.S. stock holdings. That's because non-U.S. stocks benefited from attractive relative valuations as investors looked beyond the most expensive U.S. growth stocks. Emerging markets stocks also did very well, but this reflects the broadening of the AI trade beyond U.S. borders. | ||||
• | The global bond allocation produced positive total returns and diversification benefits even as some of the world's leading central banks raised rates amid elevated inflation. For example, the European Central Bank and the Bank of Japan raised rates during the period, mindful of having left rates too low for too long ahead of the 2022 inflation shock. | ||||
Cumulative Performance (based on an initial $10,000 investment) | ||
July 31, 2016 through July 31, 2026 | ||
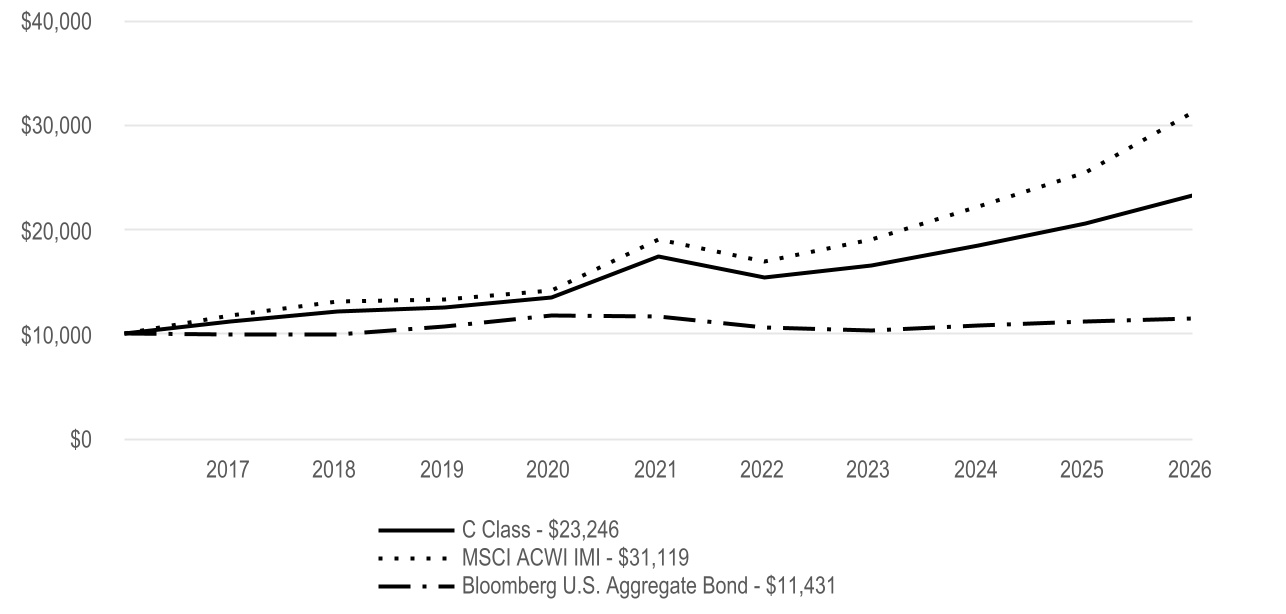
Average Annual Total Returns | |||||||||||
| 1 Year | 5 Year | 10 Year | |||||||||
| C Class | 13.37% | 6.04% | 8.80% | ||||||||
| MSCI ACWI IMI | 22.27% | 10.40% | 12.02% | ||||||||
| Bloomberg U.S. Aggregate Bond | 2.71% | -0.40% | 1.35% | ||||||||
| Fund Holdings | ||
Types of Investments in Portfolio (as a % of net assets) | |||||
| Affiliated Funds | 58.5% | ||||
| Common Stocks | 29.9% | ||||
| Corporate Bonds | 2.8% | ||||
| U.S. Government Agency Mortgage-Backed Securities | 2.3% | ||||
| Sovereign Governments and Agencies | 1.6% | ||||
| U.S. Treasury Securities | 1.0% | ||||
| Collateralized Mortgage Obligations | 0.7% | ||||
| Convertible Preferred Securities | 0.6% | ||||
| Asset-Backed Securities | 0.4% | ||||
| Preferred Securities | 0.4% | ||||
| Exchange-Traded Funds | 0.4% | ||||
| Bank Loan Obligations | 0.2% | ||||
| Commercial Mortgage-Backed Securities | 0.2% | ||||
| Municipal Securities | 0.0% | ||||
| Rights | 0.0% | ||||
| Short-Term Investments | 8.1% | ||||
| Other Assets and Liabilities | (7.1)% | ||||
What were the fund costs for the last year? (based on a hypothetical $10,000 investment) | ||||||||
Costs of a $10,000 investment | Costs paid as a percentage of a $10,000 investment | |||||||
| R Class | $118 | 1.10% | ||||||
| What were the key factors that affected the fund’s performance? | |||||
Strategic Allocation: Aggressive Fund R Class returned 13.98% for the reporting period ended July 31, 2026. | |||||
| The fund is an asset allocation fund. That is, it diversifies its assets among various classes of investments such as equity securities, bonds and money market instruments. The fund seeks the highest level of total return consistent with its asset mix. See the Fund Holdings for the portfolio’s asset weights. Below, we discuss the factors that affected these asset classes. | |||||
• | Global financial markets produced strong returns amid significant volatility related to inflation, interest rates and geopolitical trade tensions and war. Nevertheless, stocks rose because corporate earnings growth remained remarkably strong. The Federal Reserve cut interest rates three times during the period, but persistently high inflation meant that long-term bond yields actually rose. | ||||
• | The portfolio's U.S. stock holdings generally did well, with mid- and large-cap equities lagging small-cap stocks, while value stocks beat growth. This reflects uncertainty around spending on artificial intelligence (AI), which weighed most on mid- and large-cap growth stocks. Smaller and more value-oriented companies benefited from broad economic and earnings strength. | ||||
• | The portfolio's non-U.S. equity holdings generally outperformed U.S. stock holdings. That's because non-U.S. stocks benefited from attractive relative valuations as investors looked beyond the most expensive U.S. growth stocks. Emerging markets stocks also did very well, but this reflects the broadening of the AI trade beyond U.S. borders. | ||||
• | The global bond allocation produced positive total returns and diversification benefits even as some of the world's leading central banks raised rates amid elevated inflation. For example, the European Central Bank and the Bank of Japan raised rates during the period, mindful of having left rates too low for too long ahead of the 2022 inflation shock. | ||||
Cumulative Performance (based on an initial $10,000 investment) | ||
July 31, 2016 through July 31, 2026 | ||
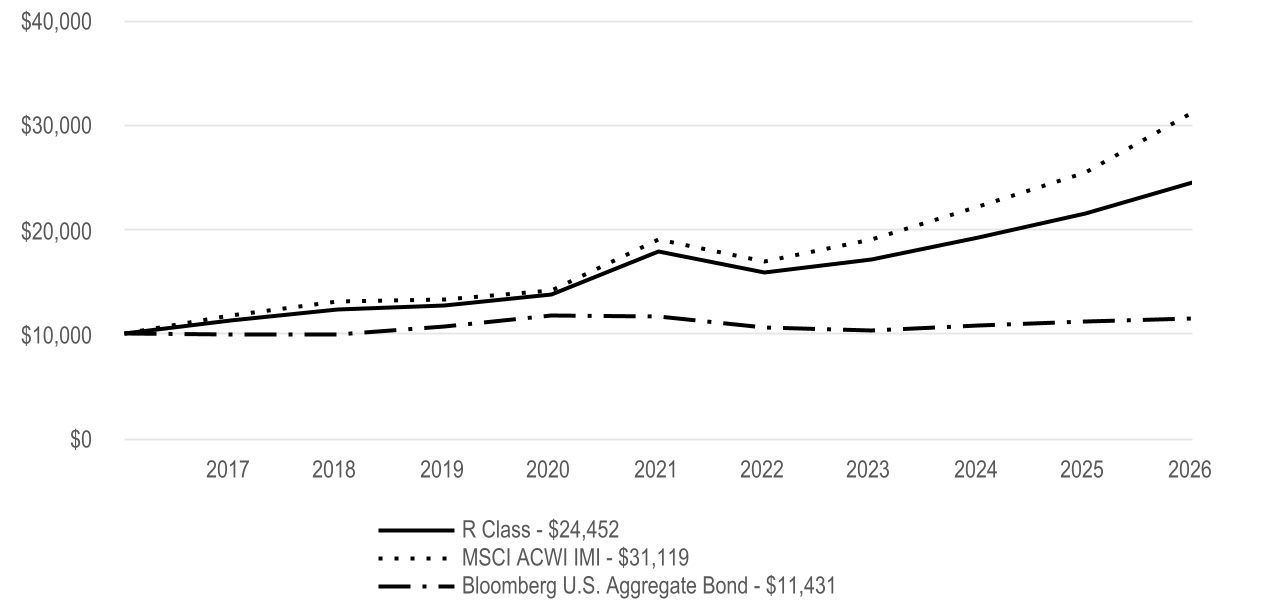
Average Annual Total Returns | |||||||||||
| 1 Year | 5 Year | 10 Year | |||||||||
| R Class | 13.98% | 6.55% | 9.35% | ||||||||
| MSCI ACWI IMI | 22.27% | 10.40% | 12.02% | ||||||||
| Bloomberg U.S. Aggregate Bond | 2.71% | -0.40% | 1.35% | ||||||||
| Fund Holdings | ||
Types of Investments in Portfolio (as a % of net assets) | |||||
| Affiliated Funds | 58.5% | ||||
| Common Stocks | 29.9% | ||||
| Corporate Bonds | 2.8% | ||||
| U.S. Government Agency Mortgage-Backed Securities | 2.3% | ||||
| Sovereign Governments and Agencies | 1.6% | ||||
| U.S. Treasury Securities | 1.0% | ||||
| Collateralized Mortgage Obligations | 0.7% | ||||
| Convertible Preferred Securities | 0.6% | ||||
| Asset-Backed Securities | 0.4% | ||||
| Preferred Securities | 0.4% | ||||
| Exchange-Traded Funds | 0.4% | ||||
| Bank Loan Obligations | 0.2% | ||||
| Commercial Mortgage-Backed Securities | 0.2% | ||||
| Municipal Securities | 0.0% | ||||
| Rights | 0.0% | ||||
| Short-Term Investments | 8.1% | ||||
| Other Assets and Liabilities | (7.1)% | ||||
What were the fund costs for the last year? (based on a hypothetical $10,000 investment) | ||||||||
Costs of a $10,000 investment | Costs paid as a percentage of a $10,000 investment | |||||||
| R5 Class | $43 | 0.40% | ||||||
| What were the key factors that affected the fund’s performance? | |||||
Strategic Allocation: Aggressive Fund R5 Class returned 14.77% for the reporting period ended July 31, 2026. | |||||
| The fund is an asset allocation fund. That is, it diversifies its assets among various classes of investments such as equity securities, bonds and money market instruments. The fund seeks the highest level of total return consistent with its asset mix. See the Fund Holdings for the portfolio’s asset weights. Below, we discuss the factors that affected these asset classes. | |||||
• | Global financial markets produced strong returns amid significant volatility related to inflation, interest rates and geopolitical trade tensions and war. Nevertheless, stocks rose because corporate earnings growth remained remarkably strong. The Federal Reserve cut interest rates three times during the period, but persistently high inflation meant that long-term bond yields actually rose. | ||||
• | The portfolio's U.S. stock holdings generally did well, with mid- and large-cap equities lagging small-cap stocks, while value stocks beat growth. This reflects uncertainty around spending on artificial intelligence (AI), which weighed most on mid- and large-cap growth stocks. Smaller and more value-oriented companies benefited from broad economic and earnings strength. | ||||
• | The portfolio's non-U.S. equity holdings generally outperformed U.S. stock holdings. That's because non-U.S. stocks benefited from attractive relative valuations as investors looked beyond the most expensive U.S. growth stocks. Emerging markets stocks also did very well, but this reflects the broadening of the AI trade beyond U.S. borders. | ||||
• | The global bond allocation produced positive total returns and diversification benefits even as some of the world's leading central banks raised rates amid elevated inflation. For example, the European Central Bank and the Bank of Japan raised rates during the period, mindful of having left rates too low for too long ahead of the 2022 inflation shock. | ||||
Cumulative Performance (based on an initial $10,000 investment) | ||
April 10, 2017 through July 31, 2026 | ||
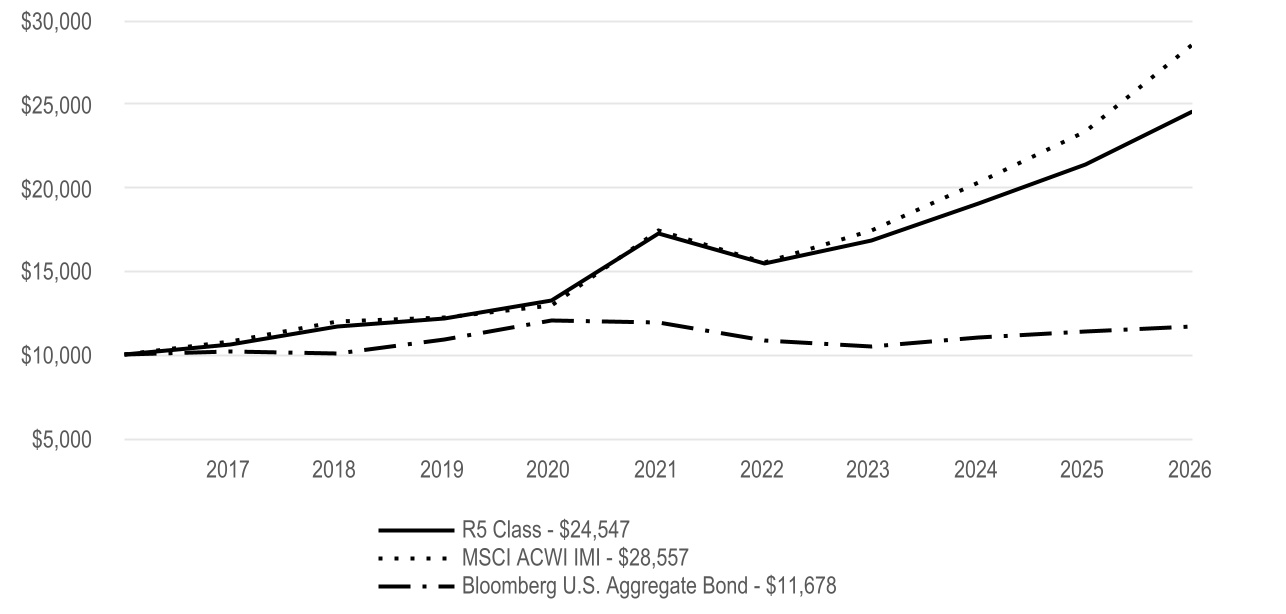
Average Annual Total Returns | ||||||||||||||
| 1 Year | 5 Year | Since Inception | Inception Date | |||||||||||
| R5 Class | 14.77% | 7.33% | 10.12% | 4/10/17 | ||||||||||
| MSCI ACWI IMI | 22.27% | 10.40% | 11.93% | — | ||||||||||
| Bloomberg U.S. Aggregate Bond | 2.71% | -0.40% | 1.68% | — | ||||||||||
| Fund Holdings | ||
Types of Investments in Portfolio (as a % of net assets) | |||||
| Affiliated Funds | 58.5% | ||||
| Common Stocks | 29.9% | ||||
| Corporate Bonds | 2.8% | ||||
| U.S. Government Agency Mortgage-Backed Securities | 2.3% | ||||
| Sovereign Governments and Agencies | 1.6% | ||||
| U.S. Treasury Securities | 1.0% | ||||
| Collateralized Mortgage Obligations | 0.7% | ||||
| Convertible Preferred Securities | 0.6% | ||||
| Asset-Backed Securities | 0.4% | ||||
| Preferred Securities | 0.4% | ||||
| Exchange-Traded Funds | 0.4% | ||||
| Bank Loan Obligations | 0.2% | ||||
| Commercial Mortgage-Backed Securities | 0.2% | ||||
| Municipal Securities | 0.0% | ||||
| Rights | 0.0% | ||||
| Short-Term Investments | 8.1% | ||||
| Other Assets and Liabilities | (7.1)% | ||||
What were the fund costs for the last year? (based on a hypothetical $10,000 investment) | ||||||||
Costs of a $10,000 investment | Costs paid as a percentage of a $10,000 investment | |||||||
| R6 Class | $27 | 0.25% | ||||||
| What were the key factors that affected the fund’s performance? | |||||
Strategic Allocation: Aggressive Fund R6 Class returned 15.04% for the reporting period ended July 31, 2026. | |||||
| The fund is an asset allocation fund. That is, it diversifies its assets among various classes of investments such as equity securities, bonds and money market instruments. The fund seeks the highest level of total return consistent with its asset mix. See the Fund Holdings for the portfolio’s asset weights. Below, we discuss the factors that affected these asset classes. | |||||
• | Global financial markets produced strong returns amid significant volatility related to inflation, interest rates and geopolitical trade tensions and war. Nevertheless, stocks rose because corporate earnings growth remained remarkably strong. The Federal Reserve cut interest rates three times during the period, but persistently high inflation meant that long-term bond yields actually rose. | ||||
• | The portfolio's U.S. stock holdings generally did well, with mid- and large-cap equities lagging small-cap stocks, while value stocks beat growth. This reflects uncertainty around spending on artificial intelligence (AI), which weighed most on mid- and large-cap growth stocks. Smaller and more value-oriented companies benefited from broad economic and earnings strength. | ||||
• | The portfolio's non-U.S. equity holdings generally outperformed U.S. stock holdings. That's because non-U.S. stocks benefited from attractive relative valuations as investors looked beyond the most expensive U.S. growth stocks. Emerging markets stocks also did very well, but this reflects the broadening of the AI trade beyond U.S. borders. | ||||
• | The global bond allocation produced positive total returns and diversification benefits even as some of the world's leading central banks raised rates amid elevated inflation. For example, the European Central Bank and the Bank of Japan raised rates during the period, mindful of having left rates too low for too long ahead of the 2022 inflation shock. | ||||
Cumulative Performance (based on an initial $10,000 investment) | ||
July 31, 2016 through July 31, 2026 | ||
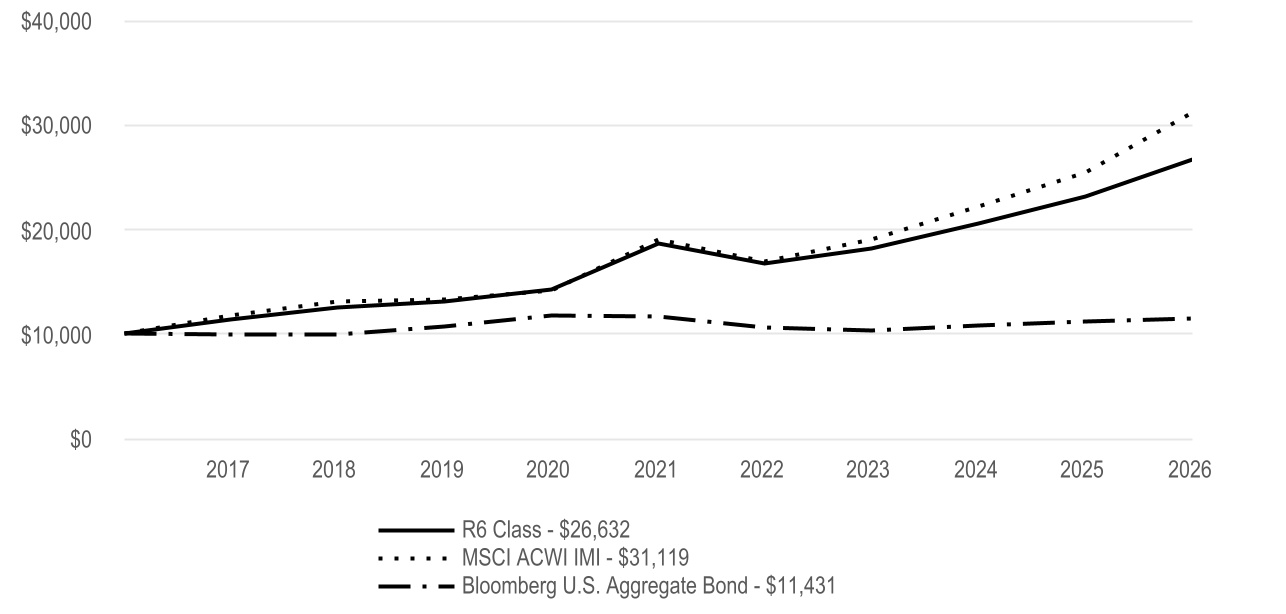
Average Annual Total Returns | |||||||||||
| 1 Year | 5 Year | 10 Year | |||||||||
| R6 Class | 15.04% | 7.48% | 10.29% | ||||||||
| MSCI ACWI IMI | 22.27% | 10.40% | 12.02% | ||||||||
| Bloomberg U.S. Aggregate Bond | 2.71% | -0.40% | 1.35% | ||||||||
| Fund Holdings | ||
Types of Investments in Portfolio (as a % of net assets) | |||||
| Affiliated Funds | 58.5% | ||||
| Common Stocks | 29.9% | ||||
| Corporate Bonds | 2.8% | ||||
| U.S. Government Agency Mortgage-Backed Securities | 2.3% | ||||
| Sovereign Governments and Agencies | 1.6% | ||||
| U.S. Treasury Securities | 1.0% | ||||
| Collateralized Mortgage Obligations | 0.7% | ||||
| Convertible Preferred Securities | 0.6% | ||||
| Asset-Backed Securities | 0.4% | ||||
| Preferred Securities | 0.4% | ||||
| Exchange-Traded Funds | 0.4% | ||||
| Bank Loan Obligations | 0.2% | ||||
| Commercial Mortgage-Backed Securities | 0.2% | ||||
| Municipal Securities | 0.0% | ||||
| Rights | 0.0% | ||||
| Short-Term Investments | 8.1% | ||||
| Other Assets and Liabilities | (7.1)% | ||||