Shareholder Report
|
12 Months Ended |
|
Mar. 31, 2026
USD ($)
Holding
|
|---|
| Shareholder Report [Line Items] |
|
| Document Type |
N-CSR
|
| Amendment Flag |
false
|
| Registrant Name |
WISCONSIN CAPITAL FUNDS INC
|
| Entity Central Index Key |
0001395397
|
| Entity Investment Company Type |
N-1A
|
| Document Period End Date |
Mar. 31, 2026
|
| Shareholder Report Annual or Semi-Annual |
Annual Shareholder Report
|
| C000221188 |
|
| Shareholder Report [Line Items] |
|
| Fund Name |
Plumb Balanced Fund
|
| Class Name |
Institutional Class
|
| Trading Symbol |
PLIBX
|
| Annual or Semi-Annual Statement [Text Block] |
This annual shareholder report contains important information about Plumb Balanced Fund for the period of April 1, 2025 to March 31, 2026.
|
| Additional Information [Text Block] |
You can find additional information about the Fund at plumbfunds.com. You can also request this information by contacting us at 1-866-987-7888.
|
| Additional Information Phone Number |
1-866-987-7888
|
| Additional Information Website |
plumbfunds.com
|
| Expenses [Text Block] |
What were the Fund’s costs for the last year?(based on a hypothetical $10,000 investment) Table SummaryClass Name | Costs of a $10,000 investment | Costs paid as a percentage of a $10,000 investment |
|---|
Institutional Class | $127 | 1.19% |
|---|
|
| Expenses Paid, Amount |
$ 127
|
| Expense Ratio, Percent |
1.19%
|
| Factors Affecting Performance [Text Block] |
How did the Fund perform during the reporting period? The Plumb Funds are pleased to present our March 31, 2026, fiscal year results to you, even in a down market caused by geopolitical risks. The fiscal year of 2026 proved to be an eventful period for financial markets, most notably the United States entering into a conflict with Iran on February 28th that sent crude oil prices dramatically up and hence gasoline prices at the pumps. The largest contributors to the Plumb Balanced Fund included Modine Manufacturing, AAR, Exxon Mobil, Phillips 66, and Ubiquiti. The largest detractors for the quarter were Microsoft, American Express, Toast, Mercardo Libre, and Visa. |
| Performance Past Does Not Indicate Future [Text] |
The Fund’s past performance is not a good predictor of how the Fund will perform in the future.
|
| Performance Inception Date |
Aug. 03, 2020
|
| No Deduction of Taxes [Text Block] |
The graph and table do not reflect the deduction of taxes that a shareholder would pay on fund distributions or redemption of fund shares.
|
| AssetsNet |
$ 63,208,971
|
| Holdings Count | Holding |
59
|
| Advisory Fees Paid, Amount |
$ 349,117
|
| InvestmentCompanyPortfolioTurnover |
29.00%
|
| Holdings [Text Block] |
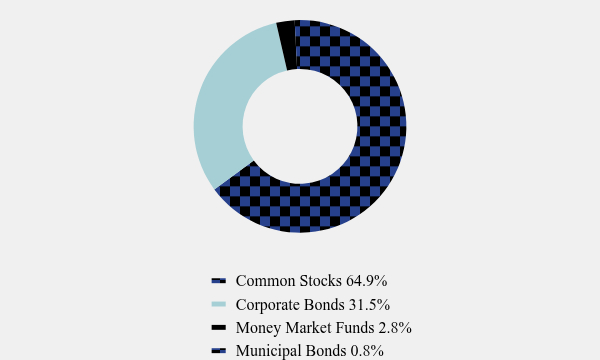
Asset Weighting (% of total investments)Table SummaryValue | Value |
|---|
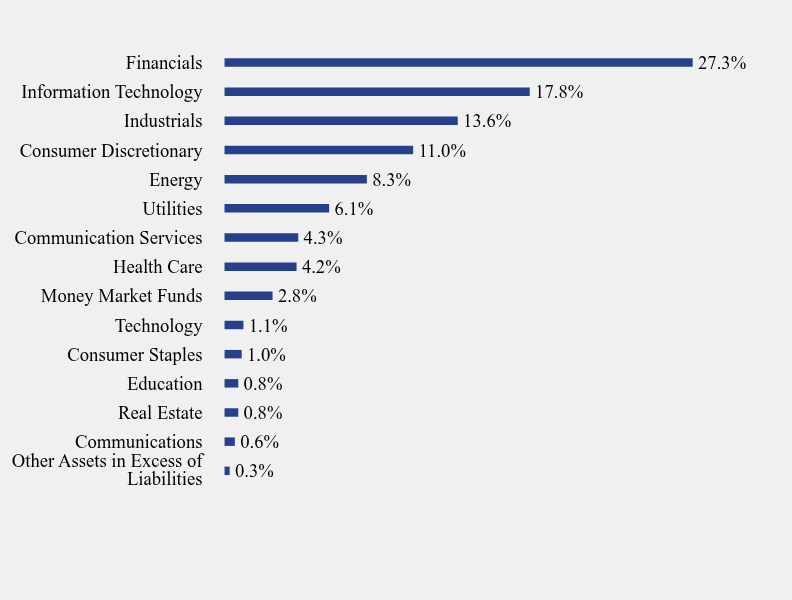
Common Stocks | 64.9% | Corporate Bonds | 31.5% | Money Market Funds | 2.8% | Municipal Bonds | 0.8% | Sector Weighting (% of net assets)Table SummaryValue | Value |
|---|
Other Assets in Excess of Liabilities | 0.3% | Communications | 0.6% | Real Estate | 0.8% | Education | 0.8% | Consumer Staples | 1.0% | Technology | 1.1% | Money Market Funds | 2.8% | Health Care | 4.2% | Communication Services | 4.3% | Utilities | 6.1% | Energy | 8.3% | Consumer Discretionary | 11.0% | Industrials | 13.6% | Information Technology | 17.8% | Financials | 27.3% | |
| Largest Holdings [Text Block] |
Top 10 Holdings (% of net assets)Table SummaryHolding Name | % of Net Assets |
|---|
NVIDIA Corporation | 6.3% |
|---|
Modine Manufacturing Company | 4.5% |
|---|
Alphabet, Inc. - Class A | 4.3% |
|---|
AAR Corporation | 3.5% |
|---|
Mastercard, Inc. - Class A | 3.2% |
|---|
VSE Corporation | 3.2% |
|---|
Amazon.com, Inc. | 3.2% |
|---|
Visa, Inc. - Class A | 3.0% |
|---|
Microsoft Corporation | 2.8% |
|---|
Taiwan Semiconductor Manufacturing Company Ltd. - ADR | 2.7% |
|---|
|
| Material Fund Change [Text Block] |
No material changes occurred during the year ended March 31, 2026. |
| C000049545 |
|
| Shareholder Report [Line Items] |
|
| Fund Name |
Plumb Balanced Fund
|
| Class Name |
Investor Class
|
| Trading Symbol |
PLBBX
|
| Annual or Semi-Annual Statement [Text Block] |
This annual shareholder report contains important information about Plumb Balanced Fund for the period of April 1, 2025 to May 31, 2026.
|
| Additional Information [Text Block] |
You can find additional information about the Fund at plumbfunds.com. You can also request this information by contacting us at 1-866-987-7888.
|
| Material Fund Change Notice [Text Block] |
This report describes changes to the Fund that occurred during the reporting period.
|
| Additional Information Phone Number |
1-866-987-7888
|
| Additional Information Website |
plumbfunds.com
|
| Expenses [Text Block] |
What were the Fund’s costs for the last year?(based on a hypothetical $10,000 investment) Table SummaryClass Name | Costs of a $10,000 investment | Costs paid as a percentage of a $10,000 investment |
|---|
Investor Class | $153 | 1.44% |
|---|
|
| Expenses Paid, Amount |
$ 153
|
| Expense Ratio, Percent |
1.44%
|
| Factors Affecting Performance [Text Block] |
How did the Fund perform during the reporting period? The Plumb Funds are pleased to present our March 31, 2026, fiscal year results to you, even in a down market caused by geopolitical risks. The fiscal year of 2026 proved to be an eventful period for financial markets, most notably the United States entering into a conflict with Iran on February 28th that sent crude oil prices dramatically up and hence gasoline prices at the pumps. The largest contributors to the Plumb Balanced Fund included Modine Manufacturing, AAR, Exxon Mobil, Phillips 66, and Ubiquiti. The largest detractors for the quarter were Microsoft, American Express, Toast, Mercardo Libre, and Visa. |
| Performance Past Does Not Indicate Future [Text] |
The Fund’s past performance is not a good predictor of how the Fund will perform in the future.
|
| No Deduction of Taxes [Text Block] |
The graph and table do not reflect the deduction of taxes that a shareholder would pay on fund distributions or redemption of fund shares.
|
| AssetsNet |
$ 63,208,971
|
| Holdings Count | Holding |
59
|
| Advisory Fees Paid, Amount |
$ 349,117
|
| InvestmentCompanyPortfolioTurnover |
29.00%
|
| Holdings [Text Block] |
Asset Weighting (% of total investments)Table SummaryValue | Value |
|---|
Common Stocks | 64.9% | Corporate Bonds | 31.5% | Money Market Funds | 2.8% | Municipal Bonds | 0.8% | Sector Weighting (% of net assets)Table SummaryValue | Value |
|---|
Other Assets in Excess of Liabilities | 0.3% | Communications | 0.6% | Real Estate | 0.8% | Education | 0.8% | Consumer Staples | 1.0% | Technology | 1.1% | Money Market Funds | 2.8% | Health Care | 4.2% | Communication Services | 4.3% | Utilities | 6.1% | Energy | 8.3% | Consumer Discretionary | 11.0% | Industrials | 13.6% | Information Technology | 17.8% | Financials | 27.3% | |
| Largest Holdings [Text Block] |
Top 10 Holdings (% of net assets)Table SummaryHolding Name | % of Net Assets |
|---|
NVIDIA Corporation | 6.3% |
|---|
Modine Manufacturing Company | 4.5% |
|---|
Alphabet, Inc. - Class A | 4.3% |
|---|
AAR Corporation | 3.5% |
|---|
Mastercard, Inc. - Class A | 3.2% |
|---|
VSE Corporation | 3.2% |
|---|
Amazon.com, Inc. | 3.2% |
|---|
Visa, Inc. - Class A | 3.0% |
|---|
Microsoft Corporation | 2.8% |
|---|
Taiwan Semiconductor Manufacturing Company Ltd. - ADR | 2.7% |
|---|
|
| Material Fund Change [Text Block] |
No material changes occurred during the year ended March 31, 2026. |
| C000221189 |
|
| Shareholder Report [Line Items] |
|
| Fund Name |
Plumb Equity Fund
|
| Class Name |
Institutional Class
|
| Trading Symbol |
PLIEX
|
| Annual or Semi-Annual Statement [Text Block] |
This annual shareholder report contains important information about Plumb Equity Fund for the period of April 1, 2025 to March 31, 2026.
|
| Additional Information [Text Block] |
You can find additional information about the Fund at www.plumbfunds.com. You can also request this information by contacting us at 1-866-987-7888.
|
| Additional Information Phone Number |
1-866-987-7888
|
| Additional Information Website |
www.plumbfunds.com
|
| Expenses [Text Block] |
What were the Fund’s costs for the last year?(based on a hypothetical $10,000 investment) Table SummaryClass Name | Costs of a $10,000 investment | Costs paid as a percentage of a $10,000 investment |
|---|
Institutional Class | $132 | 1.25% |
|---|
|
| Expenses Paid, Amount |
$ 132
|
| Expense Ratio, Percent |
1.25%
|
| Factors Affecting Performance [Text Block] |
How did the Fund perform during the reporting period? The Plumb Funds are pleased to present our March 31, 2026, fiscal year results to you, even in a down market caused by geopolitical risks. The fiscal year of 2026 proved to be an eventful period for financial markets, most notably the United States entering into a conflict with Iran on February 28th that sent crude oil prices dramatically up and hence gasoline prices at the pumps. The largest contributors to the Plumb Equity Fund and percentage of net assets by security selection included: AAR, Modine Manufacturing, Phillips 66, VSE, and Honeywell. The largest detractors included Genius Sports, Microsoft, Autodesk, Cellebrite, and Toast. |
| Performance Past Does Not Indicate Future [Text] |
The Fund’s past performance is not a good predictor of how the Fund will perform in the future.
|
| Average Annual Return [Table Text Block] |
Table Summary | 1 Year | 5 Years | Since Inception (August 3, 2020) |
|---|
Plumb Equity Fund | 10.72% | 4.47% | 6.89% |
|---|
S&P 500® Index | 17.80% | 12.06% | 14.53% |
|---|
MSCI EAFE Price (USD) | 18.24% | 5.15% | 7.97% |
|---|
90% S&P500/10% MSCI EAFE Price | 17.92% | 11.41% | 13.91% |
|---|
|
| Performance Inception Date |
Aug. 03, 2020
|
| No Deduction of Taxes [Text Block] |
The graph and table do not reflect the deduction of taxes that a shareholder would pay on fund distributions or redemption of fund shares.
|
| AssetsNet |
$ 27,834,119
|
| Holdings Count | Holding |
30
|
| Advisory Fees Paid, Amount |
$ 6,554
|
| InvestmentCompanyPortfolioTurnover |
26.00%
|
| Holdings [Text Block] |
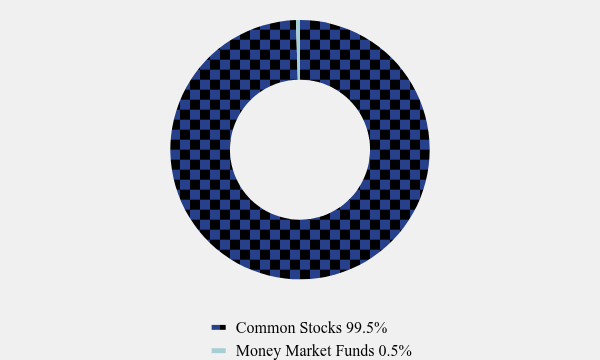
Asset Weighting (% of total investments)Table SummaryValue | Value |
|---|
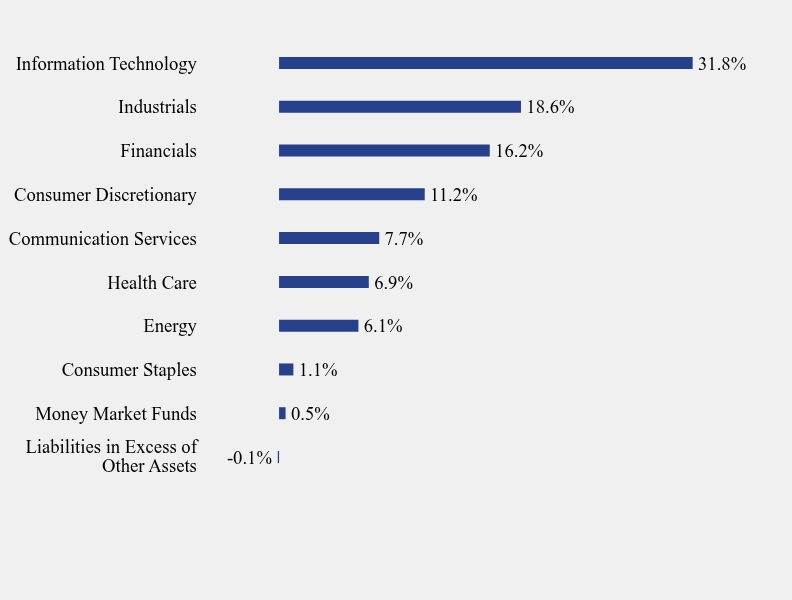
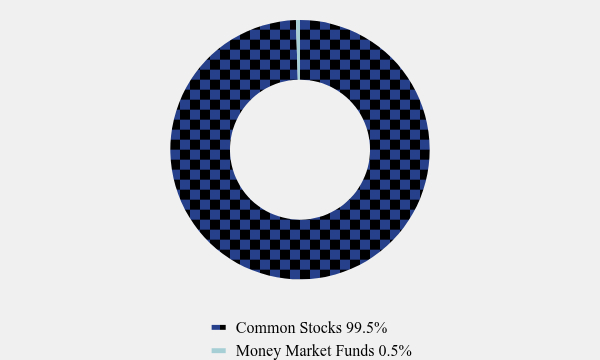
Common Stocks | 99.5% | Money Market Funds | 0.5% | Sector Weighting (% of net assets)Table SummaryValue | Value |
|---|
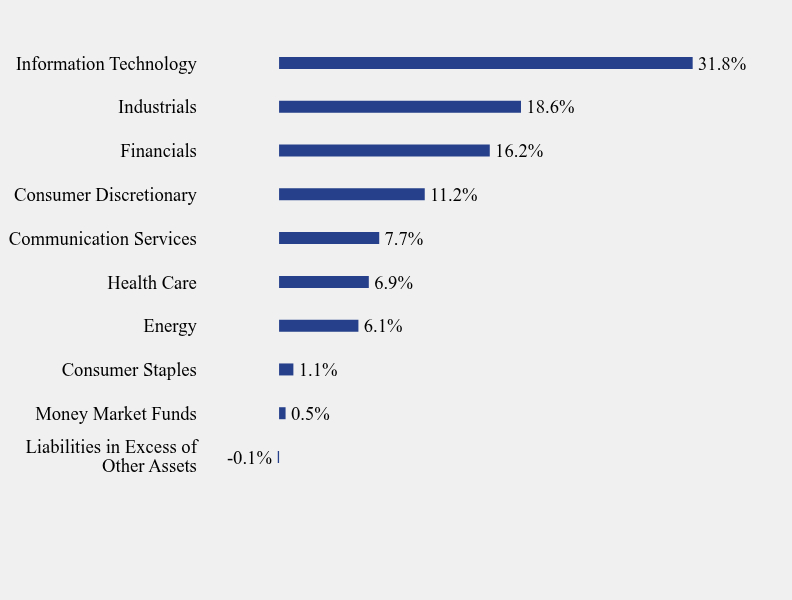
Liabilities in Excess of Other Assets | -0.1% | Money Market Funds | 0.5% | Consumer Staples | 1.1% | Energy | 6.1% | Health Care | 6.9% | Communication Services | 7.7% | Consumer Discretionary | 11.2% | Financials | 16.2% | Industrials | 18.6% | Information Technology | 31.8% | |
| Largest Holdings [Text Block] |
Top 10 Holdings (% of net assets)Table SummaryHolding Name | % of Net Assets |
|---|
NVIDIA Corporation | 13.2% |
|---|
Alphabet, Inc. - Class A | 7.7% |
|---|
VSE Corporation | 6.1% |
|---|
Advanced Micro Devices, Inc. | 5.8% |
|---|
AAR Corporation | 5.5% |
|---|
Apple, Inc. | 4.1% |
|---|
Microsoft Corporation | 4.0% |
|---|
Visa, Inc. - Class A | 3.9% |
|---|
Amazon.com, Inc. | 3.6% |
|---|
Mastercard, Inc. - Class A | 3.6% |
|---|
|
| Material Fund Change [Text Block] |
No material changes occurred during the year ended March 31, 2026. |
| C000049546 |
|
| Shareholder Report [Line Items] |
|
| Fund Name |
Plumb Equity Fund
|
| Class Name |
Investor Class
|
| Trading Symbol |
PLBEX
|
| Annual or Semi-Annual Statement [Text Block] |
This annual shareholder report contains important information about Plumb Equity Fund for the period of April 1, 2025 to May 31, 2026.
|
| Additional Information [Text Block] |
You can find additional information about the Fund at www.plumbfunds.com. You can also request this information by contacting us at 1-866-987-7888.
|
| Material Fund Change Notice [Text Block] |
This report describes changes to the Fund that occurred during the reporting period.
|
| Additional Information Phone Number |
1-866-987-7888
|
| Additional Information Website |
www.plumbfunds.com
|
| Expenses [Text Block] |
What were the Fund’s costs for the last year?(based on a hypothetical $10,000 investment) Table SummaryClass Name | Costs of a $10,000 investment | Costs paid as a percentage of a $10,000 investment |
|---|
Investor Class | $158 | 1.50% |
|---|
|
| Expenses Paid, Amount |
$ 158
|
| Expense Ratio, Percent |
1.50%
|
| Factors Affecting Performance [Text Block] |
How did the Fund perform during the reporting period? The Plumb Funds are pleased to present our March 31, 2026, fiscal year results to you, even in a down market caused by geopolitical risks. The fiscal year of 2026 proved to be an eventful period for financial markets, most notably the United States entering into a conflict with Iran on February 28th that sent crude oil prices dramatically up and hence gasoline prices at the pumps. The largest contributors to the Plumb Equity Fund and percentage of net assets by security selection included: AAR, Modine Manufacturing, Phillips 66, VSE, and Honeywell. The largest detractors included Genius Sports, Microsoft, Autodesk, Cellebrite, and Toast. |
| Performance Past Does Not Indicate Future [Text] |
The Fund’s past performance is not a good predictor of how the Fund will perform in the future.
|
| Average Annual Return [Table Text Block] |
Table Summary | 1 Year | 5 Years | 10 Years |
|---|
Plumb Equity Fund | 10.41% | 4.23% | 12.09% |
|---|
S&P 500® Index | 17.80% | 12.06% | 14.16% |
|---|
MSCI EAFE Price (USD) | 18.24% | 5.15% | 5.56% |
|---|
90% S&P500/10% MSCI EAFE Price | 17.92% | 11.41% | 13.31% |
|---|
|
| No Deduction of Taxes [Text Block] |
The graph and table do not reflect the deduction of taxes that a shareholder would pay on fund distributions or redemption of fund shares.
|
| AssetsNet |
$ 27,834,119
|
| Holdings Count | Holding |
30
|
| Advisory Fees Paid, Amount |
$ 6,554
|
| InvestmentCompanyPortfolioTurnover |
26.00%
|
| Holdings [Text Block] |
Asset Weighting (% of total investments)Table SummaryValue | Value |
|---|
Common Stocks | 99.5% | Money Market Funds | 0.5% | Sector Weighting (% of net assets)Table SummaryValue | Value |
|---|
Liabilities in Excess of Other Assets | -0.1% | Money Market Funds | 0.5% | Consumer Staples | 1.1% | Energy | 6.1% | Health Care | 6.9% | Communication Services | 7.7% | Consumer Discretionary | 11.2% | Financials | 16.2% | Industrials | 18.6% | Information Technology | 31.8% | |
| Largest Holdings [Text Block] |
Top 10 Holdings (% of net assets)Table SummaryHolding Name | % of Net Assets |
|---|
NVIDIA Corporation | 13.2% |
|---|
Alphabet, Inc. - Class A | 7.7% |
|---|
VSE Corporation | 6.1% |
|---|
Advanced Micro Devices, Inc. | 5.8% |
|---|
AAR Corporation | 5.5% |
|---|
Apple, Inc. | 4.1% |
|---|
Microsoft Corporation | 4.0% |
|---|
Visa, Inc. - Class A | 3.9% |
|---|
Amazon.com, Inc. | 3.6% |
|---|
Mastercard, Inc. - Class A | 3.6% |
|---|
|
| Material Fund Change [Text Block] |
No material changes occurred during the year ended March 31, 2026. |