The bar chart and table below provide some indication of the risks of investing in the Fund by showing changes in the performance of the Fund’s Class I shares from year to year and by showing how the average annual total returns of each class of the Fund compare with the average annual total returns of a broad-based market index as well as to a benchmark that the Fund’s investment adviser believes is representative of the Fund’s investment universe. Performance for classes other than those shown may vary from the performance shown to the extent the expenses for those classes differ. Updated performance information is available at the Fund’s website, www.northsquareinvest.com, or by calling the Fund at 1-855-551-5521.
The Fund has adopted the historical performance of the Oak Ridge Dynamic Small Cap Fund (the “Predecessor Fund”) as a result of a reorganization consummated after the close of business on May 10, 2019, in which the Fund acquired all of the assets, subject to the liabilities, of the Predecessor Fund. The performance information presented below for periods prior to the close of business on May 10, 2019, reflects the performance of the Predecessor Fund. At the time of the reorganization, the Fund and the Predecessor Fund had substantially the same investment strategies. Prior to the reorganization, the Fund was a “shell” fund with no assets and had not yet commenced operations.
The Predecessor Fund commenced operations on September 30, 2015, after the conversion of the Algert Global U.S. Small Cap account (the “Predecessor Account”), which commenced operations on November 1, 2008, into Class I shares of the Predecessor Fund. The Predecessor Fund’s and the Fund’s objectives, policies, guidelines and restrictions are, in all material respects, equivalent to those of the Predecessor Account. The Predecessor Account was the only fund or account managed by the Sub-Adviser with an investment objective and investment policies and restrictions substantially similar to those of the Predecessor Fund, and the Predecessor Account was managed in substantially the same way as the Sub-Adviser managed the Predecessor Fund and is managing the Fund. The Predecessor Account was not registered under the Investment Company Act of 1940, as amended (the “1940 Act”), and therefore was not subject to certain restrictions imposed by the 1940 Act on registered investment companies and by the Internal Revenue Code of 1986, as amended, (the “Code”) on regulated investment companies. The Fund’s Class A shares commenced operations on December 1, 2015. Following the close of business on May 29, 2020, the Fund’s outstanding Class A shares were converted into Class I shares and the offering of Class A shares was suspended as of that date. On May 1, 2023, the Class A shares of the Fund became available for purchase.
The Fund’s past performance, before and after taxes, is not necessarily an indication of how the Fund will perform in the future.
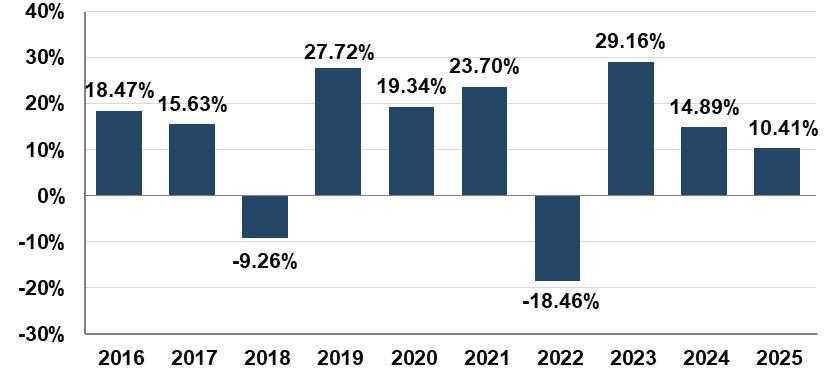
The year-to-date return as of June 30, 2026 was 23.27%.
| Class I | ||
| Highest Calendar Quarter Return at NAV (non-annualized) | 27.20% | Quarter ended 12/31/2020 |
| Lowest Calendar Quarter Return at NAV (non-annualized) | -29.76% | Quarter ended 03/31/2020 |
| Average Annual Total Returns (for the periods ended December 31, 2025) |
1 Year | 5 Years |
10 Years |
| Class I - Return Before Taxes | 10.41% | 10.57% | 12.09% |
| Class I - Return After Taxes on Distributions | 9.70% | 7.27% | 9.62% |
| Class I - Return After Taxes on Distributions and Sale of Fund Shares | 6.69% | 6.94% | 8.81% |
| Class A - Return Before Taxes1 | 3.82% | 9.02% | 11.16% |
| Russell 3000® Index (reflects no deduction for fees, expenses or taxes)2 | 17.15% | 13.15% | 14.29% |
| Russell 2000® Index (reflects no deduction for fees, expenses or taxes)3 | 12.81% | 6.09% | 9.62% |
| 1 | During the period from May 30, 2020, through April 30, 2023, there were no Class A shares of the Fund outstanding. Had Class A shares been outstanding they would have been invested in the same portfolio as the Class I shares. Performance shown for the period from May 30, 2020, to April 30, 2023, is based on the performance of Class I shares, adjusted on a proforma basis, for the higher expenses applicable to Class A shares, which are subject to a sales load and a 12b-1 fee. | |
| 2 | The Russell 3000® Index is an unmanaged index that measures the performance of the 3,000 largest U.S. companies based on total market capitalizations, which represents approximately 98% of the investable U.S. equity market. Investors cannot invest directly in an index or benchmark. Index returns are gross of any fees, brokerage commission or other expense of investing. | |
| 3 | The Russell 2000® Index is an unmanaged index that measures the performance of the small-cap segment of the U.S. equity universe. The Russell 2000® Index is a subset of the Russell 3000® Index representing approximately 10% of the total market capitalization of that index. It includes approximately 2,000 of the smallest securities based on a combination of their market cap and current index membership. Investors cannot invest directly in an index or benchmark. Index returns are gross of any fees, brokerage commission or other expense of investing. |
After-tax returns are calculated using the historical highest individual federal marginal income tax rates and do not reflect the impact of state and local taxes. Actual after-tax returns depend on an investor’s tax situation and may differ from those shown. After-tax returns shown are not relevant to investors who hold their Fund shares through tax-deferred arrangements, such as 401(k) plans or individual retirement accounts.
Information for Class I shares reflects the performance of the Predecessor Fund prior to the Class I shares’ inception date.
The bar chart and table below provide some indication of the risks of investing in the Fund by showing changes in the performance of the Fund’s Class I shares from year to year and by showing how the average annual total returns of Class I shares of the Fund compare with the average annual total returns of a broad-based market index, as well as to a benchmark that the Fund’s investment adviser believes is representative of the Fund’s investment universe. The Class A shares of the Fund are not offered for purchase as of the date of this Prospectus. Updated performance information is available at the Fund’s website, www.northsquareinvest.com, or by calling the Fund at 1-855-551-5521.
The Fund’s past performance, before and after taxes, is not necessarily an indication of how the Fund will perform in the future.
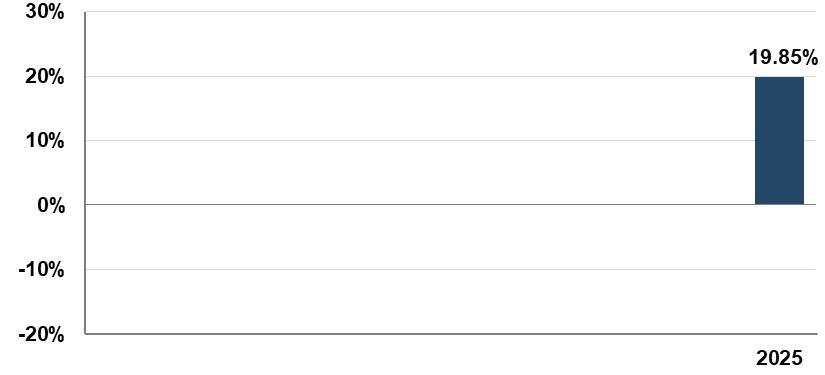
The year-to-date return as of June 30, 2026 was 30.52%.
| Class I | ||
| Highest Calendar Quarter Return at NAV (non-annualized) | 10.36% | Quarter ended 09/30/2025 |
| Lowest Calendar Quarter Return at NAV (non-annualized) | -5.08% | Quarter ended 03/31/2025 |
| Average Annual Total Returns (for the periods ended December 31, 2025) |
1 Year | Since Inception (6/10/2024) |
| Class I - Return Before Taxes | 19.85% | 27.35% |
| Class I - Return After Taxes on Distributions | 15.85% | 23.77% |
| Class I - Return After Taxes on Distributions and Sale of Fund Shares | 12.43% | 19.92% |
| Russell 3000® Index1 (reflects no deduction for fees, expenses or taxes) | 17.15% | 18.34% |
| Russell Microcap® Index2 (reflects no deduction for fees, expenses or taxes) | 22.99% | 24.72% |
| 1 | The Russell 3000® Index is an unmanaged index that measures the performance of the largest 3,000 U.S. companies designed to represent approximately 98% of the investable U.S. equity market. Investors cannot invest directly in an index or benchmark. Index returns are gross of any fees, brokerage commission or other expenses of investing. |
| 2 | The Russell Microcap® Index is an unmanaged index that measures the performance of the microcap segment of the U.S. equity universe. Microcap stocks make up less than 2% of the US equity market (by market cap, as of the most recent reconstitution) and consist of the smallest 1,000 securities in the small-cap Russell 2000® Index, plus the next 1,000 smallest eligible securities by market cap. Investors cannot invest directly in an index or benchmark. Index returns are gross of any fees, brokerage commission or other expenses of investing. |
After-tax returns are calculated using the historical highest individual federal marginal income tax rates and do not reflect the impact of state and local taxes. Actual after-tax returns depend on an investor’s tax situation and may differ from those shown. In certain cases, Return After Taxes on Distributions and Sale of Fund Shares may be higher than the other return figures for the same period. This will occur when a capital loss is realized upon the sale of Fund shares or provides an assumed tax benefit that increases the return. After-tax returns shown are not relevant to investors who hold their Fund shares through tax-deferred arrangements, such as 401(k) plans or individual retirement accounts.
The bar chart and table below provide some indication of the risks of investing in the Fund by showing changes in the performance of the Fund’s Class I shares from year to year and by showing how the average annual total returns of the Fund compare with the average annual total returns of a broad-based market index, as well as to benchmarks that the Fund’s investment adviser believes are representative of the Fund’s investment universe. Updated performance information is available at the Fund’s website, www.northsquareinvest.com, or by calling the Fund at 1-855-551-5521.
Effective January 11, 2022, the Fund made certain changes to its principal investment strategies, including the modification of the strategies to invest, under normal circumstances, primarily in equity securities of small capitalization companies. Prior to January 11, 2022, the Fund invested primarily in equity securities that had a record of paying dividends over at least a trailing one-year period. Accordingly, the performance shown below for periods prior to January 11, 2022, is based on the Fund’s prior principal investment strategies and may not be representative of the Fund’s performance under its current principal investment strategies.
The Fund has adopted the historical performance of the Advisory Research All Cap Value Fund (the “Predecessor Fund”), a former series of Investment Managers Series Trust, as a result of a reorganization consummated after the close of business on February 21, 2020 (“Reorganization”), in which the Fund acquired all of the assets, and assumed all of the liabilities, of the Predecessor Fund. The performance information presented below for periods prior to the Reorganization reflects the performance of the Predecessor Fund. At the time of the Reorganization, the Fund and the Predecessor Fund had substantially similar investment strategies. Prior to the Reorganization, the Fund was a “shell” fund with no assets and had not yet commenced operations. The Fund’s performance has not been restated to reflect any differences in expenses paid by the Predecessor Fund and those paid by the Fund.
The Fund’s past performance, before and after taxes, is not necessarily an indication of how the Fund will perform in the future.
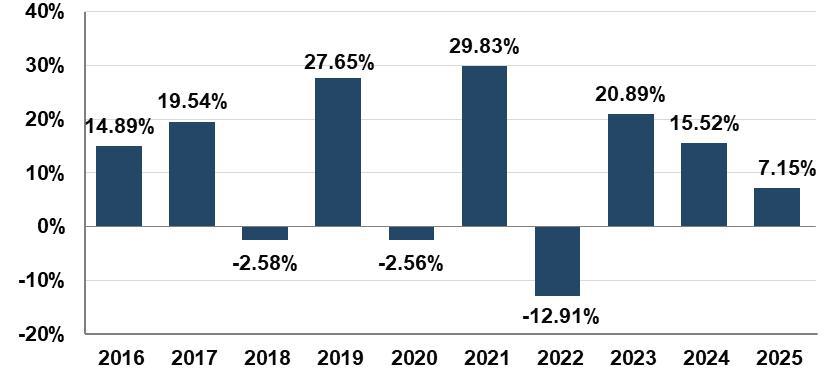
The year-to-date return as of June 30, 2026 was 25.49%.
| Highest Calendar Quarter Return at NAV (non-annualized) | 18.28% | Quarter ended 12/31/2023 |
| Lowest Calendar Quarter Return at NAV (non-annualized) | -29.64% | Quarter ended 03/31/2020 |
| Average Annual Total Returns (for the periods ended December 31, 2025) |
1 Year | 5 Years | 10 Years |
| Class I - Return Before Taxes | 7.15% | 11.09% | 10.91% |
| Class I - Return After Taxes on Distributions | 5.82% | 9.97% | 8.55% |
| Class I - Return After Taxes on Distributions and Sale of Fund Shares | 5.24% | 8.65% | 8.19% |
|
Russell 3000® Index1 (reflects no deduction for fees, expenses or taxes) |
17.15% | 13.15% | 14.29% |
|
Russell 2000® Value Index2 (reflects no deduction for fees, expenses or taxes) |
12.59% | 8.88% | 9.27% |
|
Russell 2000® Index3 (reflects no deduction for fees, expenses or taxes) |
12.81% | 6.09% | 9.62% |
| 1 | The Russell 3000® Index is an unmanaged index that measures the performance of the largest 3,000 U.S. companies designed to represent approximately 98% of the investable U.S. equity market. Investors cannot invest directly in an index or benchmark. Index returns are gross of any fees, brokerage commission or other expenses of investing. | |
| 2 | The Russell 2000® Value Index is an unmanaged index that measures the performance of the small-cap segment of the U.S. equity universe. It includes those Russell 2000 companies with relatively lower price-to-book ratios, lower I/B/E/S forecast medium term (2 year) growth and lower sales per share historical growth (5 years). Investors cannot invest directly in an index or benchmark. Index returns are gross of any fees, brokerage commission or other expenses of investing. | |
| 3 | The Russell 2000® Index is an unmanaged index that measures the performance of the small-cap segment of the U.S. equity universe. The Russell 2000® Index is a subset of the Russell 3000® Index representing approximately 10% of the total market capitalization of that index. It includes approximately 2,000 of the smallest securities based on a combination of their market cap and current index membership. Investors cannot invest directly in an index or benchmark. Index returns are gross of any fees, brokerage commission or other expenses of investing. |
After-tax returns are calculated using the historical highest individual federal marginal income tax rates and do not reflect the impact of state and local taxes. Actual after-tax returns depend on an investor’s tax situation and may differ from those shown. In certain cases, Return After Taxes on Distributions and Sale of Fund Shares may be higher than the other return figures for the same period. This will occur when a capital loss is realized upon the sale of Fund shares or provides an assumed tax benefit that increases the return. After–tax returns shown are not relevant to investors who hold their Fund shares through tax-deferred arrangements, such as 401(k) plans or individual retirement accounts.
Concurrently with the Fund’s commencement of operations, the Fund acquired all of the assets, subject to the liabilities, of the Foundry Partners Small Cap Value Fund, a series of Valued Advisers Trust (the “Predecessor Fund”), in a tax-free reorganization on April 25, 2025 (the “Reorganization”). The Predecessor Fund had an investment objective and strategies that were, in all material respects, the same as those of the Fund, and was managed in a manner that, in all material respects, complied with the investment guidelines and restrictions of the Fund. Further, the Predecessor Fund’s portfolio managers joined the Sub-Adviser to serve as the Fund’s portfolio managers as part of the Reorganization. The Predecessor Fund had two share classes: Investor Class shares and Institutional Class shares. In the Reorganization, the holders of the Investor Class shares and Institutional Class shares of the Predecessor Fund received Investor Class shares and Class I shares, respectively, of the Fund. The performance information presented below for periods prior to the Reorganization, reflects the performance of the Predecessor Fund and, as applicable, its share classes. Prior to the Reorganization, the Fund was a “shell” fund with no assets and had not yet commenced operations.
The bar chart and table below provide some indication of the risks of investing in the Fund by showing changes in the performance of the Fund’s and/or Predecessor Fund’s Investor Class shares from year to year and by showing how the average annual total returns of Investor Class shares of the Fund and/or Predecessor Fund compare with the average annual total returns of a broad-based market index as well as to a benchmark that the Fund’s investment adviser believes is representative of the Fund’s investment universe. Performance of Investor Class shares will differ from that of Class I shares due to, among other things, differences in fees and expenses. Updated performance information is available at the Fund’s website, www.northsquareinvest.com, or by calling the Fund at 1-855-551-5521.
The Fund’s and/or Predecessor Fund’s past performance, before and after taxes, is not necessarily an indication of how the Fund will perform in the future.
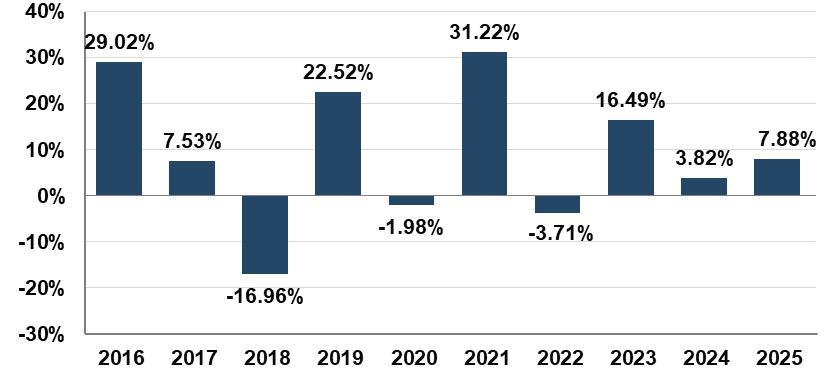
The year-to-date return as of June 30, 2026 was 22.86%.
| Investor Class | ||
| Highest Calendar Quarter Return at NAV (non-annualized) | 27.36% | Quarter ended 12/31/2020 |
| Lowest Calendar Quarter Return at NAV (non-annualized) | -36.62% | Quarter ended 03/31/2020 |
|
Average Annual Total Returns (for the periods ended December 31, 2025) |
1 Year | 5 Years | 10 Years |
| Investor Class - Return Before Taxes | 7.88% | 10.51% | 8.60% |
| Investor Class - Return After Taxes on Distributions | 7.64% | 7.13% | 6.43% |
| Investor Class - Return After Taxes on Distributions and Sale of Fund Shares | 4.84% | 7.55% | 6.45% |
| Class I - Return Before Taxes | 8.17% | 10.79% | 8.87% |
| Russell 3000® Index (reflects no deduction for fees, expenses, or taxes)1 | 17.15% | 13.15% | 14.29% |
| Russell 2000® Value Index (reflects no deduction for fees, expenses, or taxes)2 | 12.59% | 8.88% | 9.27% |
| 1 | The Russell 3000® Index is an unmanaged index that measures the performance of the 3,000 largest U.S. companies based on total market capitalizations, which represents approximately 98% of the investable U.S. equity market. Investors cannot invest directly in an index. Index returns are gross of any fees, brokerage commissions or other expenses of investing. | |
| 2 | The Russell 2000® Value Index is an unmanaged index that measures the performance of the small-cap value segment of the U.S. equity universe. It includes those Russell 2000 companies with relatively lower price-to-book ratios, lower I/B/E/S forecast medium term (2 year) growth and lower sales per share historical growth (5 years). Investors cannot invest directly in an index. Index returns are gross of any fees, brokerage commissions or other expenses of investing. |
After-tax returns are shown for the Investor Class shares only. After-tax returns for Class I shares will vary. After-tax returns are calculated using the historical highest individual federal marginal income tax rates and do not reflect the impact of state and local taxes. Actual after-tax returns depend on an investor’s tax situation and may differ from those shown. After-tax returns shown are not relevant to investors who hold their Fund shares through tax-deferred arrangements, such as 401(k) plans or individual retirement accounts. In certain cases, the Return After Taxes on Distributions and Sale of Fund Shares may be higher than the other return figures for the same period. This will occur when a capital loss is realized upon the sale of Fund shares or provides an assumed tax benefit that increases the return.
The bar chart and table below provide some indication of the risks of investing in the Fund by showing changes in the performance of the Fund’s Class I shares from year to year and by showing how the average annual total returns of the Fund compare with the average annual total returns of a broad-based market index. Updated performance information is available at the Fund’s website, www.northsquareinvest.com, or by calling the Fund at 1-855-551-5521.
The Fund’s past performance, before and after taxes, is not necessarily an indication of how the Fund will perform in the future.
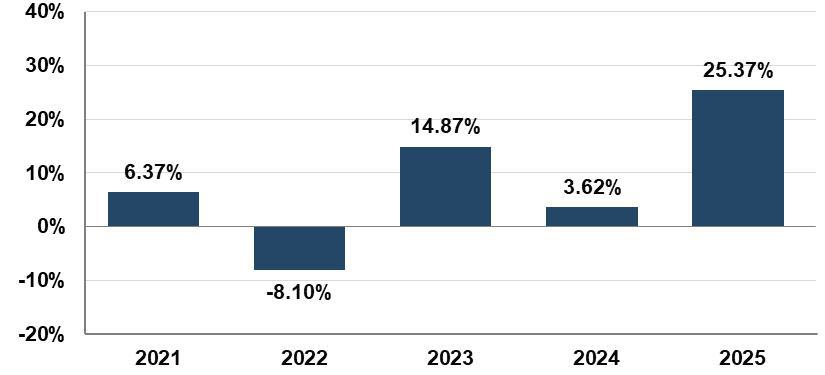
The year-to-date return as of June 30, 2026 was 6.00%.
| Class I | ||
| Highest Calendar Quarter Return at NAV (non-annualized) | 18.18% | Quarter ended 12/31/2022 |
| Lowest Calendar Quarter Return at NAV (non-annualized) | -10.78% | Quarter ended 06/30/2022 |
| Average Annual Total Returns (for the periods ended December 31, 2025) |
1 Year | 5 Years | Since Inception (12/04/2020) |
| Class I - Return Before Taxes | 25.37% | 7.85% | 8.03% |
| Class I - Return After Taxes on Distributions | 22.62% | 6.97% | 7.16% |
| Class I - Return After Taxes on Distributions and Sale of Fund Shares | 17.34% | 6.24% | 6.39% |
| MSCI EAFE Index1 (reflects no deduction for fees, expenses or taxes) | 31.22% | 8.92% | 9.27% |
| 1 | The MSCI EAFE Index is a free float-adjusted market capitalization index that is designed to measure the equity market performance of developed markets, excluding the U.S. and Canada. Investors cannot invest directly in an index or benchmark. Index returns are gross of any fees, brokerage commission or other expenses of investing. |
After-tax returns are calculated using the historical highest individual federal marginal income tax rates and do not reflect the impact of state and local taxes. Actual after-tax returns depend on an investor’s tax situation and may differ from those shown. In certain cases, Return After Taxes on Distributions and Sale of Fund Shares may be higher than the other return figures for the same period. This will occur when a capital loss is realized upon the sale of Fund shares or provides an assumed tax benefit that increases the return. After–tax returns shown are not relevant to investors who hold their Fund shares through tax-deferred arrangements, such as 401(k) plans or individual retirement accounts.
The bar chart and table below provide some indication of the risks of investing in the Fund by showing changes in the performance of the Fund’s Class I shares from year to year and by showing how the average annual total returns of Class I shares of the Fund compare with the average annual total returns of a broad-based market index. Updated performance information is available at the Fund’s website, www.northsquareinvest.com, or by calling the Fund at 1-855-551-5521.
Effective September 27, 2024, the Fund made certain changes to its principal investment strategies, including the modification of the strategies to invest, under normal circumstances, primarily in investment grade debt securities. Prior to September 27, 2024, the Fund invested across multiple investment strategies and investment techniques that were designed to generate return and manage risk exposure across varying market conditions
by employing three separate investment styles. Accordingly, the performance shown below for periods prior to September 27, 2024, is based on the Fund’s prior principal investment strategies and may not be representative of the Fund’s performance under its current principal investment strategies. Effective September 27, 2024, the Fund converted Class A and Class C shares into Class I shares.
The Fund has adopted the historical performance of the Stadion Trilogy Alternative Return Fund (the “Predecessor Fund”), a former series of Stadion Investment Trust, as a result of a reorganization consummated after the close of business on June 11, 2021 (“Reorganization”), in which the Fund acquired all of the assets, subject to the liabilities, of the Predecessor Fund. The performance information presented below for periods prior to the Reorganization reflects the performance of the Predecessor Fund. At the time of the Reorganization, the Fund and the Predecessor Fund had substantially similar investment strategies. Prior to the Reorganization, the Fund was a “shell” fund with no assets and had not yet commenced operations.
The Fund’s past performance, before and after taxes, is not necessarily an indication of how the Fund will perform in the future.
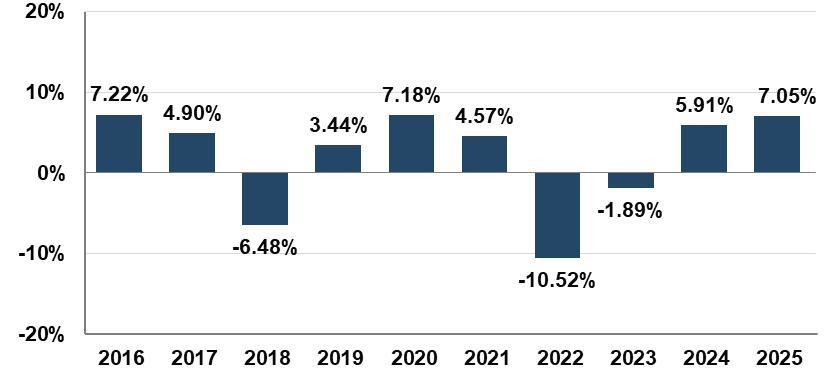
The year-to-date return as of June 30, 2026 was 0.31%.
| Class I | ||
| Highest Calendar Quarter Return at NAV (non-annualized) | 7.17% | Quarter ended 09/30/2024 |
| Lowest Calendar Quarter Return at NAV (non-annualized) | -5.04% | Quarter ended 09/30/2023 |
|
Average Annual Total Returns (for the periods ended December 31, 2025) |
1 Year | 5 Years | 10 Years |
| Class I - Return Before Taxes | 7.05% | 0.80% | 1.96% |
| Class I - Return After Taxes on Distributions | 5.05% | -0.59% | 1.09% |
| Class I - Return After Taxes on Distributions and Sale of Fund Shares | 4.14% | 0.30% | 1.34% |
| Bloomberg US Aggregate Bond Index (reflects no deduction for fees, expenses, or taxes)1 | 7.30% | -0.36% | 2.01% |
| 1 | The Bloomberg US Aggregate Bond Index is a broad-based, market capitalization-weighted bond market index representing intermediate-term investment grade bonds traded in the United States. Investors cannot invest directly in an index or benchmark. Index returns are gross of any fees, brokerage commission or other expense of investing. |
After-tax returns are calculated using the historical highest individual federal marginal income tax rates and do not reflect the impact of state and local taxes. Actual after-tax returns depend on an investor’s tax situation and may differ from those shown. After-tax returns shown are not relevant to investors who hold their Fund shares through tax-deferred arrangements, such as 401(k) plans or individual retirement accounts. In certain cases, the Return After Taxes on Distributions and Sale of Fund Shares may be higher than the other return figures for the same period. This will occur when a capital loss is realized upon the sale of Fund shares or provides an assumed tax benefit that increases the return.
The bar chart and table below provide some indication of the risks of investing in the Fund by showing changes in the performance of the Fund’s Class R6 shares from year to year and by showing how the average annual total returns of the Fund compare with the average annual total returns of a broad-based market index which also serves as the Fund’s benchmark. Updated performance information is available at the Fund’s website, www.northsquareinvest.com, or by calling the Fund at 1-855-551-5521.
The Fund’s past performance, before and after taxes, is not necessarily an indication of how the Fund will perform in the future.
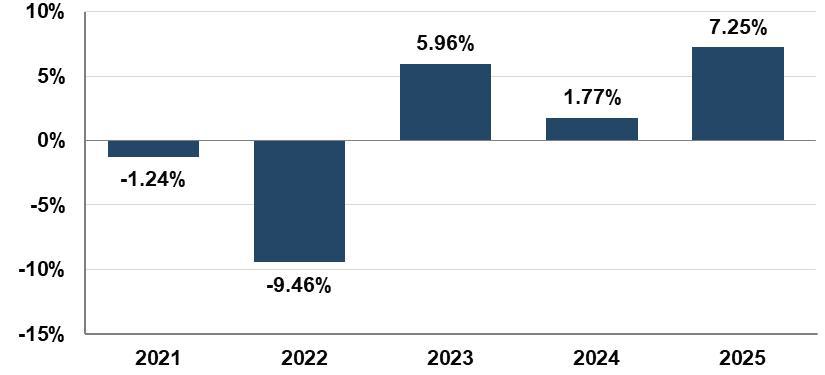
The year-to-date return as of June 30, 2026 was 0.79%.
| Class R6 | ||
| Highest Calendar Quarter Return at NAV (non-annualized) | 7.16% | Quarter ended 12/31/2023 |
| Lowest Calendar Quarter Return at NAV (non-annualized) | -4.53% | Quarter ended 03/31/2022 |
| Average Annual Total Returns (for the periods ended December 31, 2025) |
1 Year | 5 Years |
Since Inception1 (12/28/2020) |
| Class R6 - Return Before Taxes | 7.25% | 0.67% | 0.71% |
| Class R6 - Return After Taxes on Distributions | 5.40% | -0.54% | -0.50% |
| Class R6 - Return After Taxes on Distributions and Sale of Fund Shares | 4.26% | -0.02% | 0.01% |
| Class I - Return Before Taxes | 6.95% | 0.47% | 0.51% |
|
Bloomberg US Aggregate Bond Index2 (reflects no deduction for fees, expenses or taxes) |
7.30% | -0.36% | -0.33% |
| 1 | Class I shares of the Fund commenced operations on May 19, 2021. The performance shown for Class I shares for periods pre-dating the commencement of operations of the class reflects the performance of the Fund’s Class R6 shares, the initial share class, calculated using the fees and expenses of Class I shares, and without the effect of any fee and expense limitations or waivers. If Class I shares of the Fund had been available during periods prior to May 19, 2021, the performance shown may have been different. | |
| 2 | The Bloomberg US Aggregate Bond Index is a broad-based, market capitalization-weighted bond market index representing intermediate-term investment grade bonds traded in the United States. Investors cannot invest directly in an index or benchmark. Index returns are gross of any fees, brokerage commission or other expenses of investing. |
After-tax returns are calculated using the historical highest individual federal marginal income tax rates and do not reflect the impact of state and local taxes. Actual after-tax returns depend on an investor’s tax situation and may differ from those shown. In certain cases, Return After Taxes on Distributions and Sale of Fund Shares may be higher than the other return figures for the same period. This will occur when a capital loss is realized upon the sale of Fund shares or provides an assumed tax benefit that increases the return. After-tax returns shown are not relevant to investors who hold their Fund shares through tax-deferred arrangements, such as 401(k) plans or individual retirement accounts.
The bar chart and table below provide some indication of the risks of investing in the Fund by showing changes in the performance of the Fund’s Class I shares from year to year and by showing how the average annual total returns of the Fund compare with the average annual total returns of a broad-based market index as well as to a benchmark that the Fund’s investment adviser believes is representative of the Fund’s investment universe. Updated performance information is available at the Fund’s website, www.northsquareinvest.com, or by calling the Fund at 1-855-551-5521.
Effective January 11, 2022, the Fund made certain changes to its investment objective and principal investment strategies, including the modification of the strategies to invest in a portfolio of preferred and debt securities issued by U.S. and non-U.S. companies. Prior to January 11, 2022, the Fund invested primarily in equity securities that had a record of paying dividends over at least a trailing one year period. Effective January 11, 2022, the Fund’s sub-adviser also changed. Accordingly, the performance shown below for periods prior to January 11, 2022, is based on the Fund’s prior investment objective and principal investment strategies, as implemented by the Fund’s previous sub-adviser, and may not be representative of the Fund’s performance under its current principal investment strategies.
The Fund has adopted the historical performance of the Oak Ridge Dividend Growth Fund (the “Predecessor Fund”) as a result of a reorganization consummated after the close of business on May 10, 2019, in which the Fund acquired all of the assets, subject to the liabilities, of the Predecessor Fund. The performance information presented below for periods prior to the close of business on May 10, 2019 reflects the performance of the Predecessor Fund. At the time of the reorganization, the Fund and the Predecessor Fund had substantially the same investment strategies. Prior to the reorganization, the Fund was a “shell” fund with no assets and had not yet commenced operations.
The Fund’s past performance, before and after taxes, is not necessarily an indication of how the Fund will perform in the future.
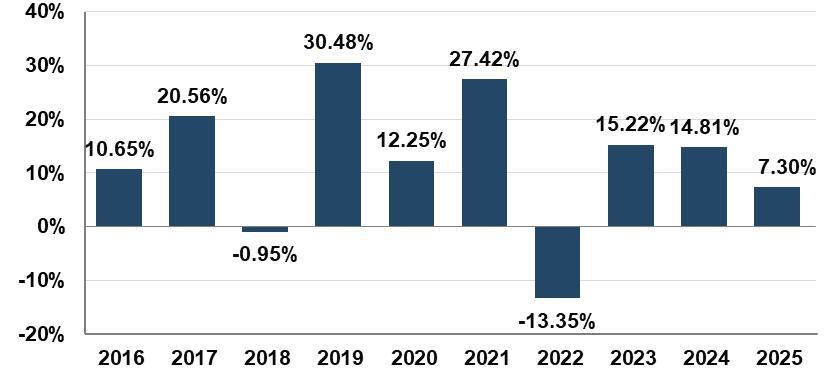
The year-to-date return as of June 30, 2026 was 1.83%.
| Class I | ||
| Highest Calendar Quarter Return at NAV (non-annualized) | 18.56% | Quarter ended 06/30/2020 |
| Lowest Calendar Quarter Return at NAV (non-annualized) | -20.17% | Quarter ended 03/31/2020 |
| Average Annual Total Returns (for the periods ended December 31, 2025) |
1 Year | 5 Years | 10 Years |
| Class I - Return Before Taxes | 7.30% | 9.40% | 11.73% |
| Class I - Return After Taxes on Distributions | 4.54% | 6.80% | 10.07% |
| Class I - Return After Taxes on Distributions and Sale of Fund Shares | 4.50% | 6.53% | 9.14% |
| Bloomberg US Aggregate Bond Index (reflects no deduction for fees, expenses or taxes)1 | 7.30% | -0.36% | 2.01% |
| ICE BofA Fixed Rate Preferred Securities Index (reflects no deduction for fees, expenses or taxes)2 | 5.13% | 1.61% | 3.97% |
| 1 | The Bloomberg US Aggregate Bond Index is a broad-based, market capitalization-weighted bond market index representing intermediate-term investment grade bonds traded in the United States. Investors cannot invest directly in an index or benchmark. Index returns are gross of any fees, brokerage commission or other expense of investing. | |
| 2 | The ICE BofA Fixed Rate Preferred Securities Index tracks the performance of fixed-rate U.S. dollar-denominated preferred securities issued in the U.S. domestic market. Qualifying securities must be rated investment-grade (based on an average of Moody’s, S&P Global Ratings and Fitch) and must have an investment-grade-rated country risk (based on an average of Moody’s, S&P Global Ratings and Fitch foreign currency long-term sovereign debt ratings.) Investors cannot invest directly in an index or benchmark. Index returns are gross of any fees, brokerage commission or other expense of investing. |
After-tax returns are calculated using the historical highest individual federal marginal income tax rates and do not reflect the impact of state and local taxes. Actual after-tax returns depend on an investor’s tax situation and may differ from those shown. After-tax returns shown are not relevant to investors who hold their Fund shares through tax-deferred arrangements, such as 401(k) plans or individual retirement accounts.
The bar chart and table below provide some indication of the risks of investing in the Fund by showing changes in the performance of the Fund’s Class I shares from year to year and by showing how the average annual total returns of Class I shares of the Fund compare with the average annual total returns of a broad-based market index. The performance for Class A shares may vary from the performance shown to the extent the classes have differing expenses. Updated performance information is available at the Fund’s website, www.northsquareinvest.com, or by calling the Fund at 1-855-551-5521.
The Fund has adopted the historical performance of the Advisory Research Strategic Income Fund (the “Predecessor Fund”), a former series of Investment Managers Series Trust, as a result of a reorganization consummated after the close of business on February 21, 2020 (“Reorganization”), in which the Fund acquired all of the assets, and assumed all of the liabilities, of the Predecessor Fund. At the time of the Reorganization, the Fund and the Predecessor Fund had substantially similar investment strategies. Prior to the Reorganization, the Fund was a “shell” fund with no assets and had not yet commenced operations. The performance information presented below for periods prior to the Reorganization reflects the performance of the Predecessor Fund. The Fund’s performance has not been restated to reflect any differences in expenses paid by the Predecessor Fund and those paid by the Fund.
The Fund’s past performance, before and after taxes, is not necessarily an indication of how the Fund will perform in the future.
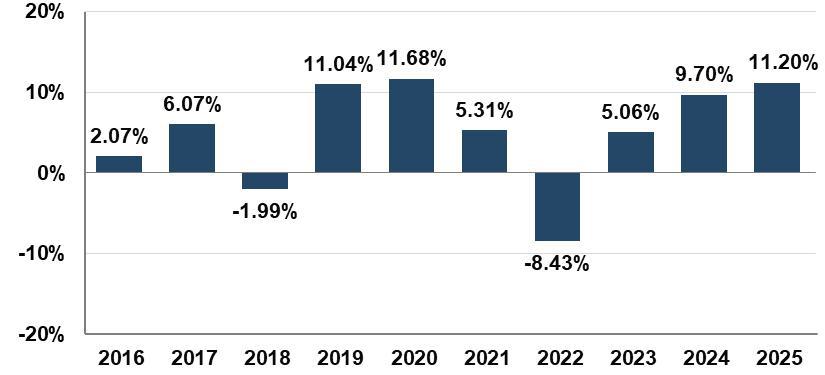
The year-to-date return as of June 30, 2026 was 1.53%.
| Class I | ||
| Highest Calendar Quarter Return at NAV (non-annualized) | 6.73% | Quarter ended 06/30/2020 |
| Lowest Calendar Quarter Return at NAV (non-annualized) | -6.09% | Quarter ended 06/30/2022 |
| Average Annual Total Returns (for the periods ended December 31, 2025) |
1 Year | 5 Years | 10 Years |
| Class I - Return Before Taxes | 11.20% | 4.33% | 4.98% |
| Class I - Return After Taxes on Distributions | 9.19% | 2.68% | 3.35% |
| Class I - Return After Taxes on Distributions and Sale of Fund Shares | 6.73% | 2.61% | 3.21% |
| Bloomberg US Aggregate Bond Index1 (reflects no deduction for fees, expenses or taxes) | 7.30% | -0.36% | 2.01% |
| Average Annual Total Returns (for the periods ended December 31, 2025) |
1 Year |
Since Inception |
|
| Class A - Return Before Taxes | 6.86% | 7.08% | N/A |
| 1 | The Bloomberg US Aggregate Bond Index is a broad-based, market capitalization-weighted bond market index representing intermediate-term investment grade bonds traded in the United States. Investors cannot invest directly in an index or benchmark. Index returns are gross of any fees, brokerage commission or other expenses of investing. |
After-tax returns are calculated using the historical highest individual federal marginal income tax rates and do not reflect the impact of state and local taxes. Actual after-tax returns depend on an investor’s tax situation and may differ from those shown. In certain cases, Return After Taxes on Distributions and Sale of Fund Shares may be higher than the other return figures for the same period. This will occur when a capital loss is realized upon the sale of Fund shares or provides an assumed tax benefit that increases the return. After–tax returns shown are not relevant to investors who hold their Fund shares through tax-deferred arrangements, such as 401(k) plans or individual retirement accounts. After-tax returns are shown for Class I shares only and after-tax returns for classes other than Class I will vary from returns shown for Class I shares.
The bar chart and table below provide some indication of the risks of investing in the Fund by showing changes in the performance of the Fund’s Class A shares from year to year and by showing how the average annual total returns of each class of the Fund compare with the average annual total returns of a broad-based market index. Performance for classes other than those shown may vary from the performance shown to the extent the expenses for those classes differ. Updated performance information is available at the Fund’s website, www.northsquareinvest.com, or by calling the Fund at 1-855-551-5521.
The Fund has adopted the historical performance of the Oak Ridge Multi Strategy Fund (the “Predecessor Fund”) as a result of a reorganization consummated after the close of business on May 10, 2019, in which the Fund acquired all of the assets, subject to the liabilities, of the Predecessor Fund. The performance information presented below for periods prior to the close of business on May 10, 2019 reflects the performance of the Predecessor Fund. At the time of the reorganization, the Fund and the Predecessor Fund had substantially identical investment strategies. Prior to the reorganization, the Fund was a “shell” fund with no assets and had not yet commenced operations.
On July 18, 2017, the Predecessor Fund’s investment strategy changed. Prior to July 18, 2017, the Predecessor Fund invested primarily in equity securities of large capitalization companies with above average potential for earnings growth. Accordingly, the performance information presented below for periods prior to July 18, 2017 is based on the Predecessor Fund’s prior investment strategy.
The Fund’s past performance, before and after taxes, is not necessarily an indication of how the Fund will perform in the future. Sales loads are not reflected in the bar chart, and if those charges were included, returns would be less than those shown.
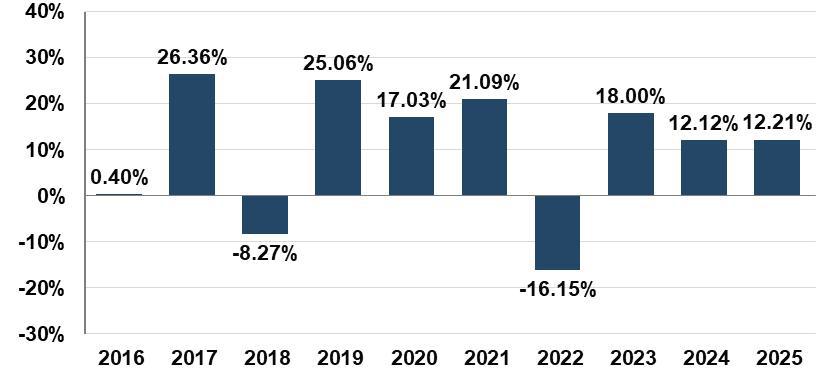
The year-to-date return as of June 30, 2026 was 9.46%.
| Class A | ||
| Highest Calendar Quarter Return at NAV (non-annualized) | 20.10% | Quarter ended 06/30/2020 |
| Lowest Calendar Quarter Return at NAV (non-annualized) | -20.51% | Quarter ended 03/31/2020 |
| Average Annual Total Returns (for the periods ended December 31, 2025) |
1 Year | 5 Years | 10 Years |
| Class A - Return Before Taxes | 5.74% | 7.27% | 9.24% |
| Class A - Return After Taxes on Distributions | 3.15% | 4.19% | 6.51% |
| Class A - Return After Taxes on Distributions and Sale of Fund Shares | 5.26% | 4.84% | 6.60% |
| Class I - Return Before Taxes | 12.45% | 8.84% | 10.22% |
| Russell 3000® Index (reflects no deduction for fees, expenses or taxes)1 | 17.15% | 13.15% | 14.29% |
| 1 | The Russell 3000® Index is an unmanaged index that measures the performance of the 3,000 largest U.S. companies based on total market capitalizations, which represents approximately 98% of the investable U.S. equity market. Investors cannot invest directly in an index or benchmark. Index returns are gross of any fees, brokerage commission or other expense of investing. |
After-tax returns are calculated using the historical highest individual federal marginal income tax rates and do not reflect the impact of state and local taxes. Actual after-tax returns depend on an investor’s tax situation and may differ from those shown. After-tax returns shown are not relevant to investors who hold their Fund shares through tax-deferred arrangements, such as 401(k) plans or individual retirement accounts. After-tax returns are shown for Class A shares only and after-tax returns for classes other than Class A will vary from returns shown for Class A shares. In certain cases, Return After Taxes on Distributions and Sale of Fund Shares may be higher than the other return figures for the same period. This will occur when a capital loss is realized upon the sale of Fund shares or provides an assumed tax benefit that increases the return.
The bar chart and table below provide some indication of the risks of investing in the Fund by showing changes in the performance of the Fund’s Class I shares from year to year and by showing how the average annual total returns of each class of the Fund compare with the average annual total returns of a broad-based market index as well as to a benchmark that the Fund’s investment adviser believes is representative of the Fund’s investment universe. Performance for classes other than those shown may vary from the performance shown to the extent the expenses for those classes differ. Updated performance information is available at the Fund’s website, www.northsquareinvest.com, or by calling the Fund at 1-855-551-5521.
Effective January 11, 2022, the Fund made certain changes to its principal investment strategies, including the modification of the strategies to become a “fund of funds” that invests primarily in affiliated mutual funds. Prior to January 11, 2022, the Fund invested primarily in equity securities of small capitalization companies. Effective January 11, 2022, the Fund’s sub-adviser also changed. Accordingly, the performance shown below for periods prior to January 11, 2022, is based on the Fund’s prior principal investment strategies, as implemented by the Fund’s previous sub-adviser, and may not be representative of the Fund’s performance under its current principal investment strategies.
The Fund has adopted the historical performance of the Oak Ridge Small Cap Growth Fund (the “Predecessor Fund”) as a result of a reorganization consummated after the close of business on May 10, 2019, in which the Fund acquired all of the assets, subject to the liabilities, of the Predecessor Fund. The performance information presented below for periods prior to the close of business on May 10, 2019, reflects the performance of the Predecessor Fund. At the time of the reorganization, the Fund and the Predecessor Fund had substantially the same investment strategies. Prior to the reorganization, the Fund was a “shell” fund with no assets and had not yet commenced operations.
The Fund’s past performance, before and after taxes, is not necessarily an indication of how the Fund will perform in the future.
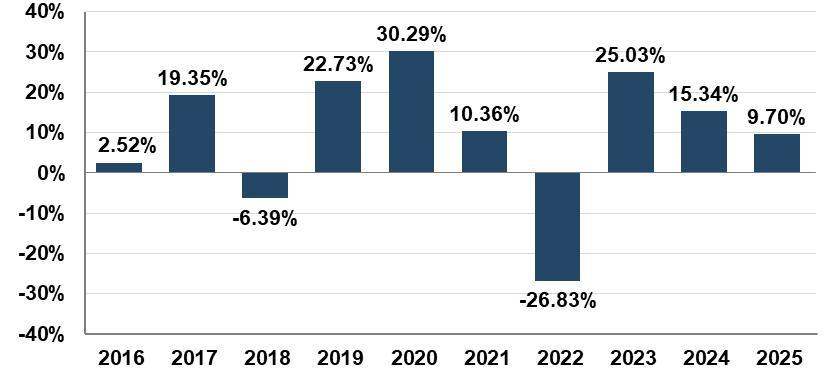
The year-to-date return as of June 30, 2026 was 24.61%.
| Class I | ||
| Highest Calendar Quarter Return at NAV (non-annualized) | 31.76% | Quarter ended 06/30/2020 |
| Lowest Calendar Quarter Return at NAV (non-annualized) | -25.10% | Quarter ended 03/31/2020 |
| Average Annual Total Returns (for the periods ended December 31, 2025) |
1 Year | 5 Years |
10 Years |
| Class I - Return Before Taxes | 9.70% | 5.02% | 8.87% |
| Class I - Return After Taxes on Distributions | 9.70% | 2.43% | 4.80% |
| Class I - Return After Taxes on Distributions and Sale of Fund Shares | 5.74% | 3.24% | 5.92% |
| Class A - Return Before Taxes | 3.20% | 3.54% | 7.94% |
| Russell 3000® Index (reflects no deduction for fees, expenses or taxes)1 | 17.15% | 13.15% | 14.29% |
| Russell 2000® Index (reflects no deduction for fees, expenses or taxes)2 | 12.81% | 6.09% | 9.62% |
| 1 | The Russell 3000® Index is an unmanaged index that measures the performance of the 3,000 largest U.S. companies based on total market capitalizations, which represents approximately 98% of the investable U.S. equity market. Investors cannot invest directly in an index or benchmark. Index returns are gross of any fees, brokerage commission or other expense of investing. |
| 2 | The Russell 2000® Index is an unmanaged index that measures the performance of the small-cap segment of the U.S. equity universe. The Russell 2000® Index is a subset of the Russell 3000® Index representing approximately 10% of the total market capitalization of that index. It includes approximately 2,000 of the smallest securities based on a combination of their market cap and current index membership. Investors cannot invest directly in an index or benchmark. Index returns are gross of any fees, brokerage commission or other expense of investing. |
After-tax returns are calculated using the historical highest individual federal marginal income tax rates and do not reflect the impact of state and local taxes. Actual after-tax returns depend on an investor’s tax situation and may differ from those shown. After-tax returns shown are not relevant to investors who hold their Fund shares through tax-deferred arrangements, such as 401(k) plans or individual retirement accounts. After-tax returns are shown for Class I shares only and after-tax returns for classes other than Class I will vary from returns shown for Class I shares. In certain cases, Return After Taxes on Distributions and Sale of Fund Shares may be higher than the other return figures for the same period. This will occur when a capital loss is realized upon the sale of Fund shares or provides an assumed tax benefit that increases the return.
The bar chart and table below provide some indication of the risks of investing in the Fund by showing changes in the performance of the Fund’s Class A shares from year to year and by showing how the average annual total returns of Class A shares of the Fund compare with the average annual total returns of a broad-based market index as well as to a benchmark that the Fund’s investment adviser believes is representative of the Fund’s investment universe. Performance for classes other than those shown may vary from the performance shown to the extent the expenses for those classes differ. Updated performance information is available at the Fund’s website, www.northsquareinvest.com, or by calling the Fund at 1-855-551-5521.
The Fund has adopted the historical performance of the Stadion Tactical Defensive Fund (the “Predecessor Fund”), a former series of Stadion Investment Trust, as a result of a reorganization consummated after the close of business on June 11, 2021 (“Reorganization”), in which the Fund acquired all of the assets, subject to the liabilities, of the Predecessor Fund. The performance information presented below for periods prior to the Reorganization reflects the performance of the Predecessor Fund. At the time of the Reorganization, the Fund and the Predecessor Fund had substantially similar investment strategies. Prior to the Reorganization, the Fund was a “shell” fund with no assets and had not yet commenced operations.
The Fund’s past performance, before and after taxes, is not necessarily an indication of how the Fund will perform in the future. Sales loads are not reflected in the bar chart, and if those charges were included, returns would be less than those shown.
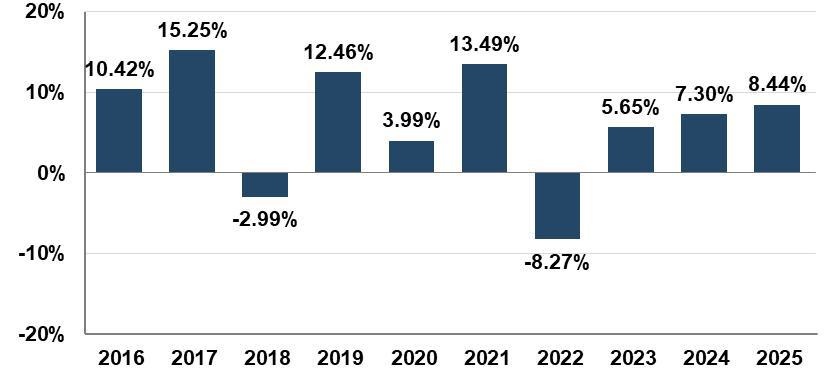
The year-to-date return as of June 30, 2026 was 6.92%.
| Class A | ||
| Highest Calendar Quarter Return at NAV (non-annualized) | 9.17% | Quarter ended 12/31/2020 |
| Lowest Calendar Quarter Return at NAV (non-annualized) | -14.37% | Quarter ended 03/31/2020 |
| Average Annual Total Returns (for the periods ended December 31, 2025) |
1 Year | 5 Years | 10 Years |
| Class A - Return Before Taxes | 2.20% | 3.82% | 5.70% |
| Class A - Return After Taxes on Distributions | 2.08% | 3.75% | 5.58% |
| Class A - Return After Taxes on Distributions and Sale of Fund Shares | 1.39% | 2.96% | 4.54% |
| Class C - Return Before Taxes | 6.73% | 4.28% | 5.53% |
| Class I - Return Before Taxes | 8.74% | 5.32% | 6.57% |
| Russell 3000® Index (reflects no deduction for fees, expenses or taxes)1 | 17.15% | 13.15% | 14.29% |
| Morningstar Moderate Target Risk Index (reflects no deduction for fees, expenses or taxes)2 | 15.95% | 5.95% | 7.83% |
| 1 | The Russell 3000® Total Return Index is an unmanaged index that measures the performance of the 3,000 largest U.S. companies based on total market capitalizations, which represents approximately 98% of the investable U.S. equity market. Investors cannot invest directly in an index or benchmark. Index returns are gross of any fees, brokerage commission or other expense of investing. | |
| 2 |
The Morningstar Target Risk Index family is designed to meet the needs of investors who would like to maintain a target level of equity exposure through a portfolio diversified across equities, bonds and inflation-hedged instruments. The Morningstar Moderate Target Risk Index seeks approximately 60% exposure to global equity markets. This index does not incorporate Environmental, Social, or Governance (ESG) criteria. Investors cannot invest directly in an index or benchmark. Index returns are gross of any fees, brokerage commission or other expense of investing. |
After-tax returns are calculated using the historical highest individual federal marginal income tax rates and do not reflect the impact of state and local taxes. Actual after-tax returns depend on an investor’s tax situation and may differ from those shown. In certain cases, Return After Taxes on Distributions and Sale of Fund Shares may be higher than the other return figures for the same period. This will occur when a capital loss is realized upon the sale of Fund shares or provides an assumed tax benefit that increases the return. After-tax returns shown are not relevant to investors who hold their Fund shares through tax-deferred arrangements, such as 401(k) plans or individual retirement accounts. After-tax returns are shown for Class A shares only and after-tax returns for other classes will vary from returns shown for Class A shares to the extent that each class has different expenses.
The bar chart and table below provide some indication of the risks of investing in the Fund by showing changes in the performance of the Fund’s Class I shares from year to year and by showing how the average annual total returns of Class I shares of the Fund compare with the average annual total returns of a broad-based market index as well as to a benchmark that the Fund’s investment adviser believes is representative of the Fund’s investment universe. Performance for classes other than those shown may vary from the performance shown to the extent the expenses for those classes differ. Updated performance information is available at the Fund’s website, www.northsquareinvest.com, or by calling the Fund at 1-855-551-5521.
The Fund has adopted the historical performance of the Stadion Tactical Growth Fund (the “Predecessor Fund”), a former series of Stadion Investment Trust, as a result of a reorganization consummated after the close of business on June 11, 2021 (“Reorganization”), in which the Fund acquired all of the assets, subject to the liabilities, of the Predecessor Fund. The performance information presented below for periods prior to the Reorganization reflects the performance of the Predecessor Fund. At the time of the Reorganization, the Fund and the Predecessor Fund had substantially similar investment strategies. Prior to the Reorganization, the Fund was a “shell” fund with no assets and had not yet commenced operations.
The Fund’s past performance, before and after taxes, is not necessarily an indication of how the Fund will perform in the future.
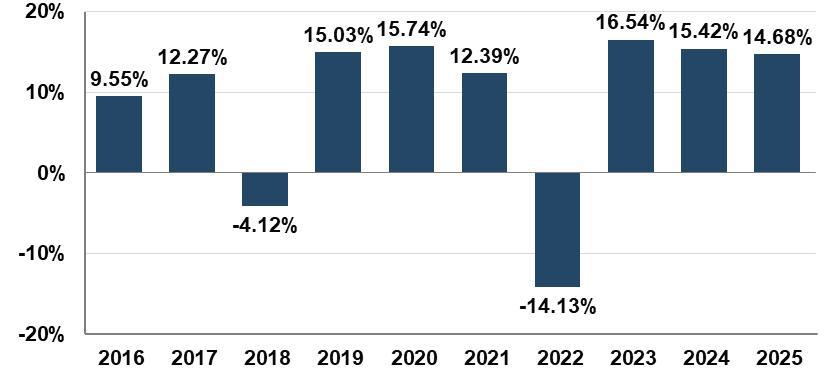
The year-to-date return as of June 30, 2026 was 8.96%.
| Class I | ||
| Highest Calendar Quarter Return at NAV (non-annualized) | 11.00% | Quarter ended 12/31/2020 |
| Lowest Calendar Quarter Return at NAV (non-annualized) | -11.31% | Quarter ended 06/30/2022 |
| Average Annual Total Returns (for the periods ended December 31, 2025) |
1 Year | 5 Years | 10 Years |
| Class I - Return Before Taxes | 14.68% | 8.28% | 8.86% |
| Class I - Return After Taxes on Distributions | 14.33% | 7.35% | 8.20% |
| Class I - Return After Taxes on Distributions and Sale of Fund Shares | 8.94% | 6.27% | 7.06% |
| Class A - Return Before Taxes | 7.75% | 6.74% | 7.94% |
| Class C - Return Before Taxes | 12.48% | 7.22% | 7.78% |
| Russell 3000® Index (reflects no deduction for fees, expenses or taxes)1 | 17.15% | 13.15% | 14.29% |
| Morningstar Moderately Aggressive Target Risk Index (reflects no deduction for fees, expenses or taxes)2 | 18.44% | 7.94% | 9.59% |
| 1 | The Russell 3000® Index is an unmanaged index that measures the performance of the 3,000 largest U.S. companies based on total market capitalizations, which represents approximately 98% of the investable U.S. equity market. Investors cannot invest directly in an index or benchmark. Index returns are gross of any fees, brokerage commission or other expense of investing. | |
| 2 | The Morningstar Target Risk Index family is designed to meet the needs of investors who would like to maintain a target level of equity exposure through a portfolio diversified across equities, bonds and inflation-hedged instruments. The Morningstar Moderately Aggressive Target Risk Index seeks approximately 80% exposure to global equity markets. This index does not incorporate Environmental, Social, or Governance (ESG) criteria. Investors cannot invest directly in an index or benchmark. Index returns are gross of any fees, brokerage commission or other expense of investing. |
After-tax returns are calculated using the historical highest individual federal marginal income tax rates and do not reflect the impact of state and local taxes. Actual after-tax returns depend on an investor’s tax situation and may differ from those shown. After-tax returns shown are not relevant to investors who hold their Fund shares through tax-deferred arrangements, such as 401(k) plans or individual retirement accounts. After-tax returns are shown for Class I shares only and after-tax returns for other classes will vary from returns shown for Class I shares to the extent that each class has different expenses.
The bar chart and table below provide some indication of the risks of investing in the Fund by showing changes in the performance of the Fund from year to year and by showing how the average annual total returns of the Fund compare with the average annual total returns of a broad-based market index, as well as to a benchmark that the Fund’s investment adviser believes is representative of the Fund’s investment universe. Updated performance information is available at no cost by visiting https://northsquareinvest.com/strategies/tax-adv-preferred-etf, or by calling the Fund at 1-855-514-7733.
The Fund’s past performance, before and after taxes, is not necessarily an indication of how the Fund will perform in the future.
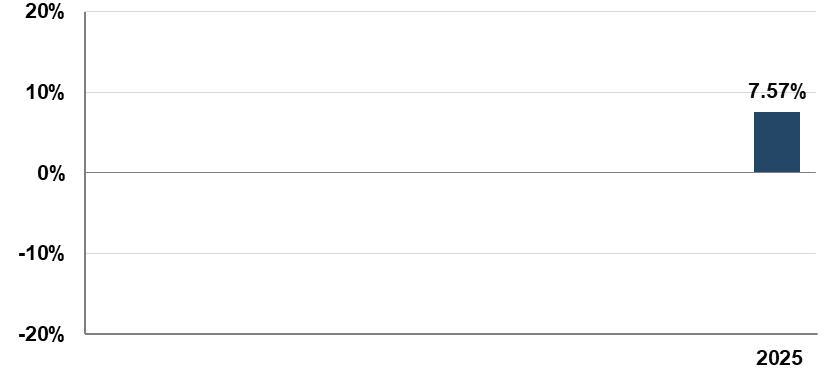
The year-to-date return as of June 30, 2026 was 1.51%.
| Highest Calendar Quarter Return at NAV (non-annualized) | 2.63% | Quarter ended 09/30/2025 |
| Lowest Calendar Quarter Return at NAV (non-annualized) | 1.12% | Quarter ended 03/31/2025 |
| Average Annual Total Returns (for the periods ended December 31, 2025) |
1 Year | Since Inception (12/18/2024) |
| Return Before Taxes | 7.57% | 7.40% |
| Return After Taxes on Distributions | 6.43% | 6.27% |
| Return After Taxes on Distributions and Sale of Fund Shares | 5.24% | 5.59% |
| Bloomberg US Aggregate Bond Index1 (reflects no deduction for fees, expenses or taxes) | 7.30% | 6.90% |
| ICE BofA Core Plus Fixed Rate Preferred Securities Index2 (reflects no deduction for fees, expenses or taxes) | 3.60% | 2.92% |
| 1 | The Bloomberg US Aggregate Bond Index is a broad based, market capitalization-weighted bond market index representing intermediate-term investment grade bonds traded in the United States. Investors cannot invest directly in an index or benchmark. Index returns are gross of any fees, brokerage commission or other expense of investing. | |
| 2 | The ICE BofA Core Plus Fixed Rate Preferred Securities Index is an unmanaged index that tracks the performance of fixed-rate preferred securities in the U.S. The index is market capitalization-weighted and is designed to measure the performance of the U.S. dollar-denominated preferred securities market. Investors cannot invest directly in an index or benchmark. Index returns are gross of any fees, brokerage commission or other expense of investing. |
After-tax returns are calculated using the historical highest individual federal marginal income tax rates and do not reflect the impact of state and local taxes. Actual after-tax returns depend on an investor’s tax situation and may differ from those shown. In certain cases, Return After Taxes on Distributions and Sale of Fund Shares may be higher than the other return figures for the same period. This will occur when a capital loss is realized upon the sale of Fund shares or provides an assumed tax benefit that increases the return. After-tax returns shown are not relevant to investors who hold their Fund shares through tax-deferred arrangements, such as 401(k) plans or individual retirement accounts.