The following information provides some indication of the risks and variability of investing in the Fund by showing how the Fund’s performance has varied from year to year and by showing how the Fund’s average annual returns for the past one-, five-, ten-year and since inception periods compare with those of the S&P 500® Index, Bloomberg U.S. Treasury Bill Index and the Bloomberg U.S. Aggregate Bond Index.
The bar chart presents the calendar year total returns of the Fund’s Class R Shares before taxes. Returns shown in the bar chart do not reflect sales charges applicable to other share classes, which would reduce performance results. The performance table reflects the performance of the Fund’s Class R shares before and after taxes and the Fund’s Class I, Class C and Class A shares before taxes. How the Fund has performed in the past (before and after taxes) is not necessarily an indication of how the Fund will perform in the future. Updated information on the Fund’s performance can be obtained by visiting www.arbitragefunds.com.
| Year-by-Year Annual Total Returns through December 31, 2025 – Class R Shares During the period shown in the bar chart, the highest return for a quarter was 3.66% during the quarter ended June 30, 2020 and the lowest return for a quarter was 2.90% during the quarter ended June 30, 2022. The year-to-date return of the Fund’s Class R shares through June 30, 2026 is 1.56%. While the Class I, Class C, and Class A shares would have substantially similar annual returns to the Class R shares because the shares are invested in the same portfolio of securities, the performance of Class I, Class C, and Class A shares will differ from that shown since the Classes do not have the same expenses or inception dates. |
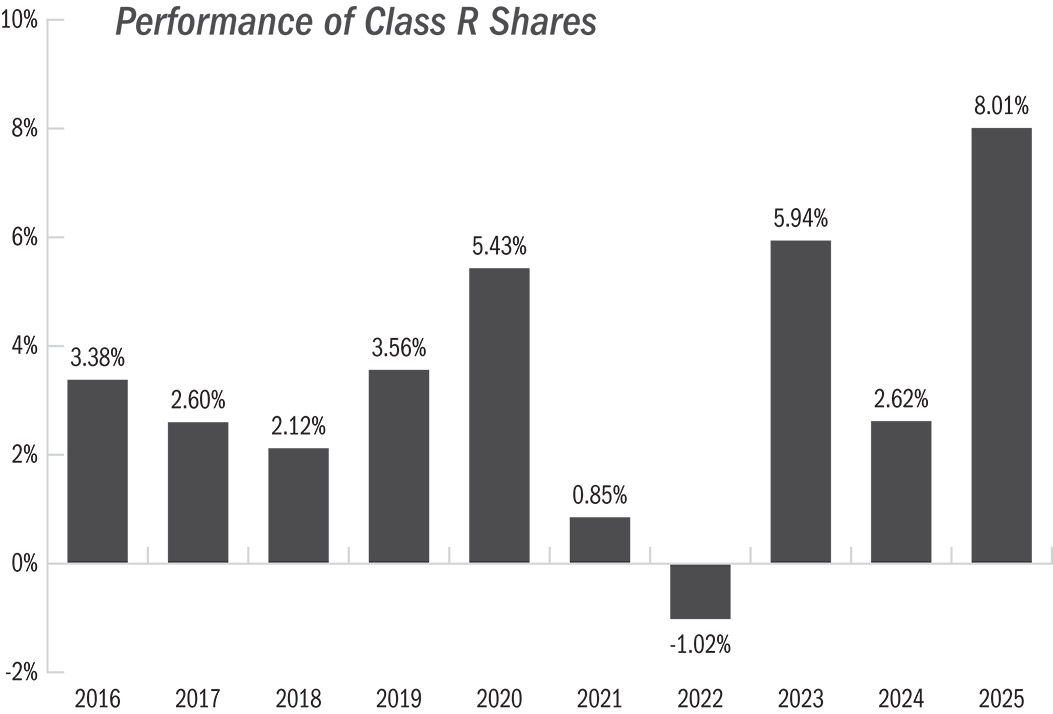
During the period shown in the bar chart, the highest return for a quarter was 3.66% during the quarter ended June 30, 2020 and the lowest return for a quarter was 2.90% during the quarter ended June 30, 2022.
The year-to-date return of the Fund’s Class R shares through June 30, 2026 is 1.56%.
While the Class I, Class C, and Class A shares would have substantially similar annual returns to the Class R shares because the shares are invested in the same portfolio of securities, the performance of Class I, Class C, and Class A shares will differ from that shown since the Classes do not have the same expenses or inception dates.
The table below shows the Fund’s average annual total returns for Class R shares, Class I shares, Class C shares, and Class A shares compared with those of the S&P 500® Index, Bloomberg U.S. Treasury Bill Index and the Bloomberg U.S. Aggregate Bond Index. The returns in the table below reflect the maximum applicable sales charges for the relevant share class. The table also presents the impact of taxes on the returns of the Fund’s Class R shares. After-tax returns are shown for Class R shares only, and after-tax returns for Class I, Class C, and Class A shares will vary. After-tax returns are calculated using the historical highest individual federal marginal income tax rates and do not reflect the impact of state and local taxes. Actual after-tax returns depend on an investor’s tax situation and may differ from those shown, and after-tax returns shown are not relevant to investors who hold their Fund shares through tax-deferred arrangements, such as 401(k) plans or individual retirement accounts. Return after taxes on distributions measures the effect of taxable distributions, but assumes the underlying shares are held for the entire period. Return after taxes on distributions and sale of Fund shares shows the effect of both taxable distributions and any taxable gain or loss that would be realized if the underlying shares were purchased at the beginning and sold at the end of the period (for purposes of the calculation, it is assumed that income dividends and capital gain distributions are reinvested at NAV and that the entire account is redeemed at the end of the period, including reinvested amounts).
Class C shares automatically convert to Class A shares approximately eight years after purchase if the conversion is available through your financial intermediary. In the table below, the performance for Class C shares does not reflect the conversion of Class C shares to Class A shares after eight years.
ARBITRAGE FUND | One Year |
|
| Five Years |
| Ten Years |
| Since |
| |||||||||
Class R Return Before Taxes |
|
| 8.01 | % |
|
|
| 3.23 | % |
|
| 3.32 | % |
|
| 3.87 | % |
|
Class R Return After Taxes on Distributions |
|
| 6.98 | % |
|
|
| 2.57 | % |
|
| 2.43 | % |
|
| 2.94 | % |
|
Class R Return After Taxes on Distributions and Sale of Fund Shares |
|
| 5.24 | % |
|
|
| 2.32 | % |
|
| 2.27 | % |
|
| 2.75 | % |
|
Class I Return Before Taxes |
|
| 8.29 | % |
|
|
| 3.48 | % |
|
| 3.57 | % |
|
| 3.27 | % |
|
Class C Return Before Taxes |
|
| 6.25 | % |
|
|
| 2.47 | % |
|
| 2.55 | % |
|
| 1.95 | % |
|
Class A Return Before Taxes |
|
| 5.05 | % |
|
|
| 2.65 | % |
|
| 3.05 | % |
|
| 2.69 | % |
|
S&P 500® Index** |
|
| 17.88 | % |
|
|
| 14.42 | % |
|
| 14.82 | % |
|
| 8.29 | % |
|
Bloomberg U.S. Treasury Bill Index*** |
|
| 4.30 | % |
|
|
| 3.19 | % |
|
| 2.20 | % |
|
| 1.92 | % |
|
Bloomberg U.S. Aggregate Bond Index**** |
|
| 7.30 | % |
|
|
| ‑0.36 | % |
|
| 2.01 | % |
|
| 3.92 | % |
|
* | The inception date for Class R shares is September 18, 2000, the inception date for Class I shares is October 17, 2003, the inception date for Class C shares is June 1, 2012, and the inception date for the Class A shares is June 1, 2013. The “Since Inception” returns reflected for the S&P 500® Index, the Bloomberg U.S. Treasury Bill Index and the Bloomberg U.S. Aggregate Bond Index are based on the inception date for Class R shares. |
** | To meet regulatory requirements, the S&P 500® Index serves as the Fund’s broad-based securities market index, providing a broad measure of market performance. The S&P 500® Index, or simply the S&P 500, is a stock market index tracking the performance of 500 large companies listed on stock exchanges in the U.S. |
*** | The Bloomberg U.S. Treasury Bill Index tracks the market for treasury bills issued by the US government with at least one month and up to, but not including, twelve months remaining to maturity. |
**** | The Bloomberg U.S. Aggregate Bond Index is a market value-weighted index of investment grade fixed-rated debt issues, including government, corporate, asset-backed and mortgage-backed securities with a maturity of one year or more. |
The indexes are calculated on a total-return basis, are unmanaged and are not available for direct investment. The indexes reflect no deduction for fees, expenses, or taxes. The indexes are not intended to, and do not, parallel the risk or investment style of the Fund’s investment strategy. |
In calculating the federal income taxes due on redemptions, capital gains taxes resulting from redemptions are subtracted from the redemption proceeds and the tax benefits from capital losses resulting from the redemptions are added to the redemption proceeds. Under certain circumstances, the addition of the tax benefits from capital losses resulting from redemptions may cause the Return After Taxes on Distributions and Sale of Fund Shares to be greater than the Return After Taxes on Distributions or even the Return Before Taxes. |
The following information provides some indication of the risks and variability of investing in the Fund by showing how the Fund’s performance has varied from year to year and by showing how the Fund’s average annual returns for the past one-, five-, ten-year and since inception periods compare with those of the S&P 500® Index, Bloomberg U.S. Treasury Bill Index and the Bloomberg U.S. Aggregate Bond Index.
The bar chart presents the calendar year total returns of the Fund’s Class R Shares before taxes. Returns shown in the bar chart do not reflect sales charges applicable to other share classes, which would reduce performance results. The performance table reflects the performance of the Fund’s Class R shares before and after taxes and the Fund’s Class I and Class A shares before taxes. How the Fund has performed in the past (before and after taxes) is not necessarily an indication of how the Fund will perform in the future. Performance reflects fee waivers in effect. If fee waivers were not in place, the Fund’s performance would be reduced. Updated information on the Fund’s performance can be obtained by visiting www.arbitragefunds.com.
| Year-by-Year Annual Total Returns through December 31, 2025 – Class R Shares During the period shown in the bar chart, the highest return for a quarter was 6.38% during the quarter ended June 30, 2020 and the lowest return for a quarter was -3.45% during the quarter ended June 30, 2022. The year-to-date return of the Fund’s Class R shares through June 30, 2026 is 4.04%. While the Class I shares and Class A shares would have substantially similar annual returns to the Class R shares because the shares are invested in the same portfolio of securities, the performance of Class I and Class A shares will differ from that shown since the Classes do not have the same expenses or inception dates. |
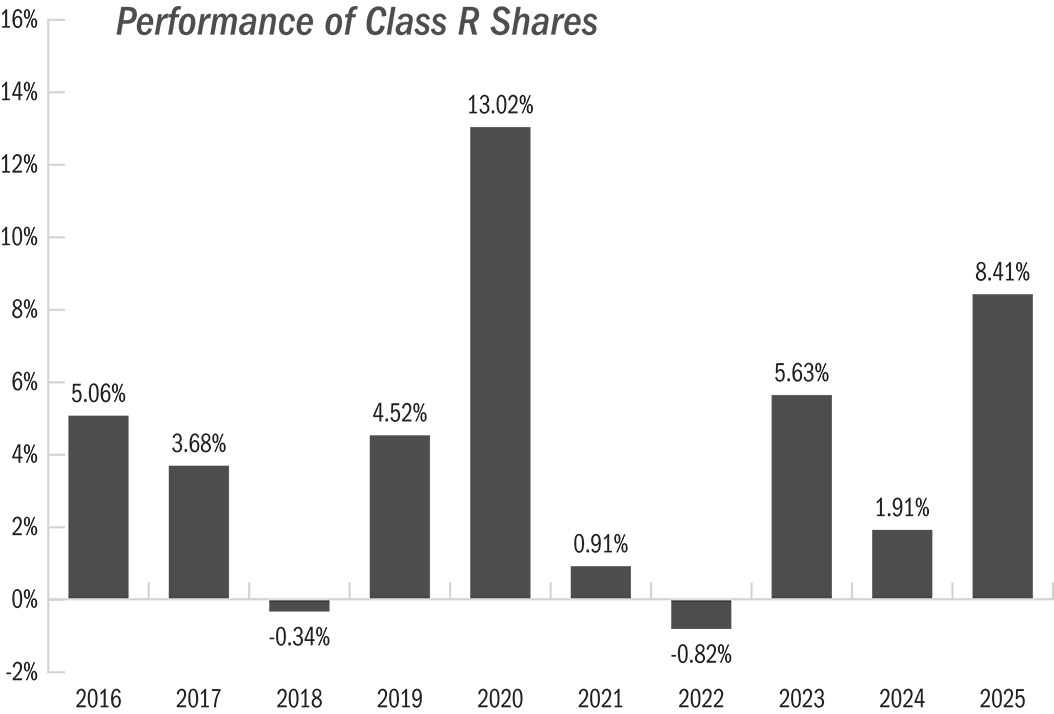
During the period shown in the bar chart, the highest return for a quarter was 6.38% during the quarter ended June 30, 2020 and the lowest return for a quarter was -3.45% during the quarter ended June 30, 2022.
The year-to-date return of the Fund’s Class R shares through June 30, 2026 is 4.04%.
While the Class I shares and Class A shares would have substantially similar annual returns to the Class R shares because the shares are invested in the same portfolio of securities, the performance of Class I and Class A shares will differ from that shown since the Classes do not have the same expenses or inception dates.
The table below shows the Fund’s average annual total returns for Class R shares, Class I shares, and Class A shares compared with those of the S&P 500® Index, Bloomberg U.S. Treasury Bill Index and the Bloomberg U.S. Aggregate Bond Index. The returns in the table below reflect the maximum applicable sales charges for the relevant share class. The table also presents the impact of taxes on the returns of the Fund’s Class R shares. After-tax returns are shown for Class R shares only, and after-tax returns for Class I and Class A shares will vary. After-tax returns are calculated using the historical highest individual federal marginal income tax rates and do not reflect the impact of state and local taxes. Actual after-tax returns depend on an investor’s tax situation and may differ from those shown, and after-tax returns shown are not relevant to investors who hold their Fund shares through tax-deferred arrangements, such as 401(k) plans or individual retirement accounts. Return after taxes on distributions measures the effect of taxable distributions, but assumes the underlying shares are held for the entire period. Return after taxes on distributions and sale of Fund shares shows the effect of both taxable distributions and any taxable gain or loss that would be realized if the underlying shares were purchased at the beginning and sold at the end of the period (for purposes of the calculation, it is assumed that income dividends and capital gain distributions are reinvested at NAV and that the entire account is redeemed at the end of the period, including reinvested amounts).
WATER ISLAND EVENT-DRIVEN FUND | One Year |
|
| Five Years |
| Ten Years |
| Since |
| |||||||||
Class R Return Before Taxes |
|
| 8.41 | % |
|
|
| 3.16 | % |
|
| 4.12 | % |
|
| 2.78 | % |
|
Class R Return After Taxes on Distributions |
|
| 8.23 | % |
|
|
| 3.08 | % |
|
| 4.01 | % |
|
| 2.33 | % |
|
Class R Return After Taxes on Distributions and Sale of Fund Shares |
|
| 5.10 | % |
|
|
| 2.42 | % |
|
| 3.23 | % |
|
| 1.99 | % |
|
Class I Return Before Taxes |
|
| 8.67 | % |
|
|
| 3.42 | % |
|
| 4.39 | % |
|
| 3.04 | % |
|
Class A Return Before Taxes |
|
| 4.93 | % |
|
|
| 2.49 | % |
|
| 3.80 | % |
|
| 2.48 | % |
|
S&P 500® Index** |
|
| 17.88 | % |
|
|
| 14.42 | % |
|
| 14.82 | % |
|
| 14.58 | % |
|
Bloomberg U.S. Treasury Bill Index*** |
|
| 4.30 | % |
|
|
| 3.19 | % |
|
| 2.20 | % |
|
| 1.48 | % |
|
Bloomberg U.S. Aggregate Bond Index**** |
|
| 7.30 | % |
|
|
| ‑0.36 | % |
|
| 2.01 | % |
|
| 2.29 | % |
|
* | The inception date for Class R shares and Class I shares is October 1, 2010 and the inception date for the Class A shares is June 1, 2013. The “Since Inception” returns reflected for the S&P 500® Index, the Bloomberg U.S. Treasury Bill Index and the Bloomberg U.S. Aggregate Bond Index are based on the inception date for Class R shares. |
** | To meet regulatory requirements, the S&P 500® Index serves as the Fund’s broad-based securities market index, providing a broad measure of market performance. The S&P 500® Index, or simply the S&P 500, is a stock market index tracking the performance of 500 large companies listed on stock exchanges in the U.S. |
*** | The Bloomberg U.S. Treasury Bill Index tracks the market for treasury bills issued by the US government with at least one month and up to, but not including, twelve months remaining to maturity. |
**** | The Bloomberg U.S. Aggregate Bond Index is a market value-weighted index of investment grade fixed-rated debt issues, including government, corporate, asset-backed and mortgage-backed securities with a maturity of one year or more. |
The indexes are calculated on a total-return basis, are unmanaged and are not available for direct investment. The indexes reflect no deduction for fees, expenses, or taxes. The indexes are not intended to, and do not, parallel the risk or investment style of the Fund’s investment strategy. |
In calculating the federal income taxes due on redemptions, capital gains taxes resulting from redemptions are subtracted from the redemption proceeds and the tax benefits from capital losses resulting from the redemptions are added to the redemption proceeds. Under certain circumstances, the addition of the tax benefits from capital losses resulting from redemptions may cause the Return After Taxes on Distributions and Sale of Fund Shares to be greater than the Return After Taxes on Distributions or even the Return Before Taxes. |
The following information provides some indication of the risks and variability of investing in the Fund by showing how the Fund’s performance has varied from year to year and by showing how the Fund’s average annual returns for the past one-, five-, ten-year and since inception periods compare with those of the Bloomberg U.S. Aggregate Bond Index and the Bloomberg U.S. Treasury Bill Index.
The bar chart presents the calendar year total returns of the Fund’s Class R Shares before taxes. Returns shown in the bar chart do not reflect sales charges applicable to other share classes, which would reduce performance results. The performance table reflects the performance of the Fund’s Class R shares before and after taxes and the Fund’s Class I and Class A shares before taxes. How the Fund has performed in the past (before and after taxes) is not necessarily an indication of how the Fund will perform in the future. Performance reflects fee waivers in effect. If fee waivers were not in place, the Fund’s performance would be reduced. Updated information on the Fund’s performance can be obtained by visiting www.arbitragefunds.com.
| Year-by-Year Annual Total Returns through December 31, 2025 – Class R Shares During the period shown in the bar chart, the highest return for a quarter was 7.81% during the quarter ended June 30, 2020 and the lowest return for a quarter was ‑5.56% during the quarter ended March 31, 2020. The year-to-date return of the Fund’s Class R shares through June 30, 2026 is 2.22%. While the Class I shares and Class A shares would have substantially similar annual returns to the Class R shares because the shares are invested in the same portfolio of securities, the performance of Class I and Class A shares will differ from that shown since the Classes do not have the same expenses or inception dates. |
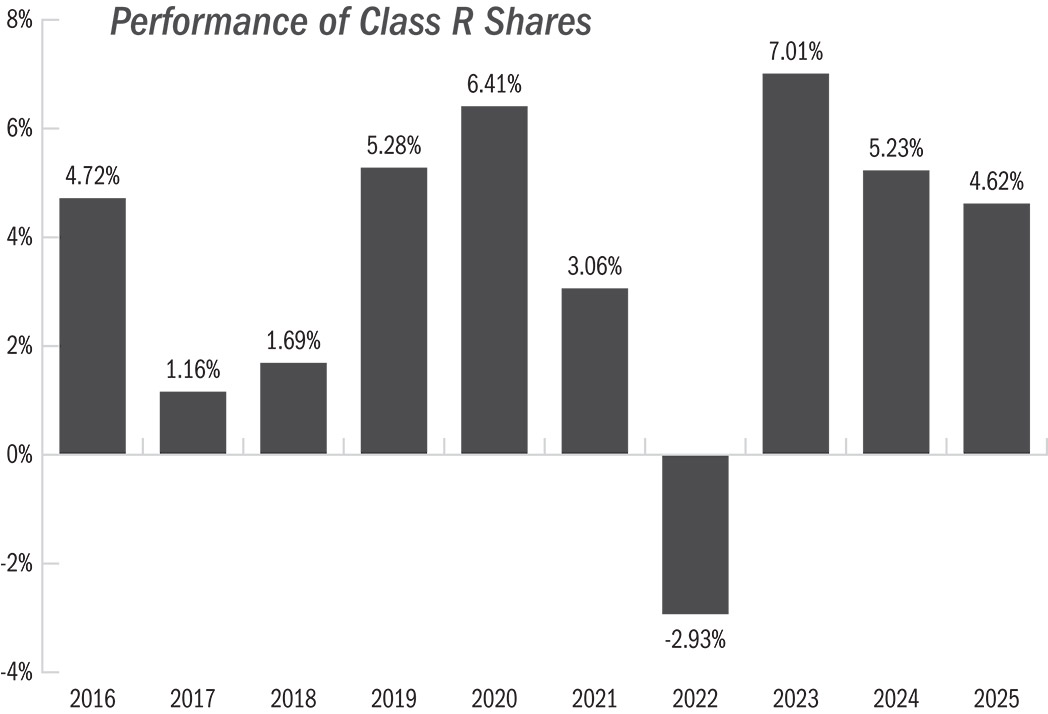
During the period shown in the bar chart, the highest return for a quarter was 7.81% during the quarter ended June 30, 2020 and the lowest return for a quarter was ‑5.56% during the quarter ended March 31, 2020.
The year-to-date return of the Fund’s Class R shares through June 30, 2026 is 2.22%.
While the Class I shares and Class A shares would have substantially similar annual returns to the Class R shares because the shares are invested in the same portfolio of securities, the performance of Class I and Class A shares will differ from that shown since the Classes do not have the same expenses or inception dates.
The table below shows the Fund’s average annual total returns for Class R shares, Class I shares, and Class A shares compared with those of the Bloomberg U.S. Aggregate Bond Index and the Bloomberg U.S. Treasury Bill Index. The returns in the table below reflect the maximum applicable sales charges for the relevant share class. The table also presents the impact of taxes on the returns of the Fund’s Class R shares. After-tax returns are shown for Class R shares only, and after-tax returns for Class I and Class A shares will vary. After-tax returns are calculated using the historical highest individual federal marginal income tax rates and do not reflect the impact of state and local taxes. Actual after-tax returns depend on an investor’s tax situation and may differ from those shown, and after-tax returns shown are not relevant to investors who hold their Fund shares through tax-deferred arrangements, such as 401(k) plans or individual retirement accounts. Return after taxes on distributions measures the effect of taxable distributions, but assumes the underlying shares are held for the entire period. Return after taxes on distributions and sale of Fund shares shows the effect of both taxable distributions and any taxable gain or loss that would be realized if the underlying shares were purchased at the beginning and sold at the end of the period (for purposes of the calculation, it is assumed that income dividends and capital gain distributions are reinvested at NAV and that the entire account is redeemed at the end of the period, including reinvested amounts).
WATER ISLAND CREDIT OPPORTUNITIES FUND | One Year |
|
| Five Years |
| Ten Years |
| Since |
| |||||||||
Class R Return Before Taxes |
|
| 4.62 | % |
|
|
| 3.34 | % |
|
| 3.59 | % |
|
| 3.09 | % |
|
Class R Return After Taxes on Distributions |
|
| 2.97 | % |
|
|
| 1.79 | % |
|
| 2.24 | % |
|
| 1.75 | % |
|
Class R Return After Taxes on Distributions and Sale of Fund Shares |
|
| 2.72 | % |
|
|
| 1.88 | % |
|
| 2.17 | % |
|
| 1.77 | % |
|
Class I Return Before Taxes |
|
| 4.79 | % |
|
|
| 3.58 | % |
|
| 3.84 | % |
|
| 3.33 | % |
|
Class A Return Before Taxes |
|
| 1.11 | % |
|
|
| 2.64 | % |
|
| 3.23 | % |
|
| 2.78 | % |
|
Bloomberg U.S. Aggregate Bond Index** |
|
| 7.30 | % |
|
|
| ‑0.36 | % |
|
| 2.01 | % |
|
| 1.86 | % |
|
Bloomberg U.S. Treasury Bill Index*** |
|
| 4.30 | % |
|
|
| 3.19 | % |
|
| 2.20 | % |
|
| 1.68 | % |
|
* | The inception date for Class R shares and Class I shares is October 1, 2012. The inception date for the Class A shares is June 1, 2013. The “Since Inception” returns reflected for the Bloomberg U.S. Aggregate Bond Index and the Bloomberg U.S. Treasury Bill Index are based on the inception date for Class R and Class I shares. |
** | To meet regulatory requirements, the Bloomberg U.S. Aggregate Bond Index serves as the Fund’s broad-based securities market index, providing a broad measure of market performance. The Bloomberg U.S. Aggregate Bond Index is a market value-weighted index of investment grade fixed-rated debt issues, including government, corporate, asset-backed and mortgage-backed securities with a maturity of one year or more. |
*** | Bloomberg U.S. Treasury Bill Index tracks the market for treasury bills issued by the US government with at least one month and up to, but not including, twelve months remaining to maturity. |
The indexes are calculated on a total-return basis, are unmanaged and are not available for direct investment. The indexes reflect no deduction for fees, expenses, or taxes. The indexes are not intended to, and do not, parallel the risk or investment style of the Fund’s investment strategy. |
In calculating the federal income taxes due on redemptions, capital gains taxes resulting from redemptions are subtracted from the redemption proceeds and the tax benefits from capital losses resulting from the redemptions are added to the redemption proceeds. Under certain circumstances, the addition of the tax benefits from capital losses resulting from redemptions may cause the Return After Taxes on Distributions and Sale of Fund Shares to be greater than the Return After Taxes on Distributions or even the Return Before Taxes. |
The following information provides some indication of the risks and variability of investing in the Fund by showing how the performance of the predecessor exchange traded fund, AltShares Merger Arbitrage ETF, has varied over time.
The Fund acquired the assets and liabilities of the predecessor exchange traded fund after the close on September 25, 2026. As a result of the transaction, the Fund adopted the accounting and performance history of the predecessor exchange traded fund. The information shown below is for the predecessor exchange traded fund. The Fund’s net operating expense ratio is the same as the net operating expense ratio of the predecessor exchange traded fund. Returns in the bar chart and average annual total returns table for the predecessor exchange traded fund have not been adjusted.
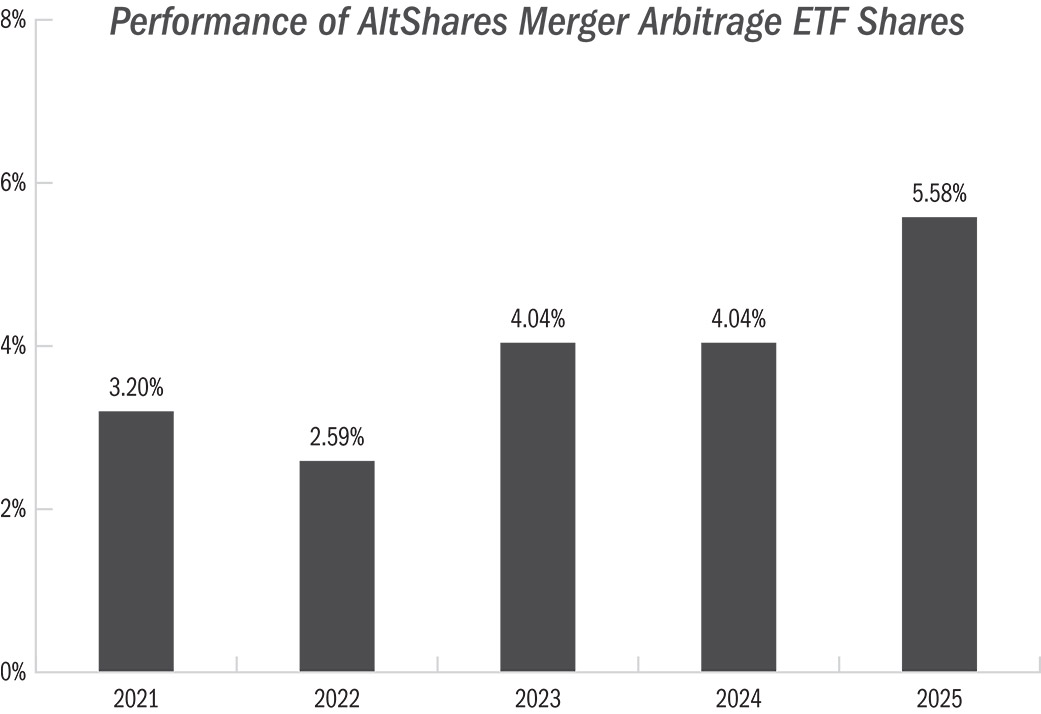
The following bar chart and performance table provide some indication of the risks and variability of investing in the Fund by showing changes in the predecessor exchange traded fund’s performance from year to year and by showing how the predecessor exchange traded fund’s average annual total returns for the past one-year, five-year, and since inception periods compare to the returns of the S&P 500® Index, Water Island Merger Arbitrage USD
Hedged Index, Bloomberg U.S. Treasury Bill Index and the Bloomberg U.S. Aggregate Bond Index. The performance table reflects the performance of the predecessor exchange traded fund’s shares before and after taxes. The performance shown reflects voluntary fee waivers which had a positive effect on performance and may be discontinued at any time. Without such voluntary fee waivers, performance would have been lower. How the predecessor exchange traded fund has performed in the past (before and after taxes) is not necessarily an indication of how the Fund will perform in the future. Updated performance information can be obtained by visiting www.altsharesetfs.com/arb.
| During the period shown in the bar chart, the highest return for the predecessor exchange traded fund for a quarter was 3.27% during the quarter ended September 30, 2023 and the lowest return for a quarter was 1.43% during the quarter ended June 30, 2022. The year-to-date return of the predecessor exchange traded fund’s shares through June 30, 2026 is 2.45%. |
|
During the period shown in the bar chart, the highest return for the predecessor exchange traded fund for a quarter was 3.27% during the quarter ended September 30, 2023 and the lowest return for a quarter was 1.43% during the quarter ended June 30, 2022. The year-to-date return of the predecessor exchange traded fund’s shares through June 30, 2026 is 2.45%. |
The table below shows the average annual total returns for the predecessor exchange traded fund, AltShares Merger Arbitrage ETF, compared with those of the S&P 500® Index, Water Island Merger Arbitrage USD Hedged Index, Bloomberg U.S. Treasury Bill Index and the Bloomberg U.S. Aggregate Bond Index. The table also presents the impact of taxes on the returns of the predecessor exchange traded fund’s shares. After-tax returns are calculated using the historical highest individual federal marginal income tax rates and do not reflect the impact of state and local taxes. Actual after-tax returns depend on an investor’s tax situation and may differ from those shown, and after-tax returns shown are not relevant to investors who hold their Fund shares through tax-deferred arrangements, such as 401(k) plans or individual retirement accounts. Return after taxes on distributions measures the effect of taxable distributions, but assumes the underlying shares are held for the entire period. Return after taxes on distributions and sale of Fund shares shows the effect of both taxable distributions and any taxable gain or loss that would be realized if the underlying shares were purchased at the beginning and sold at the end of the period (for purposes of the calculation, it is assumed that income dividends and capital gain distributions are reinvested at NAV and that the entire account is redeemed at the end of the period, including reinvested amounts).
ALTSHARES MERGER ARBITRAGE ETF |
| One Year |
| Five Years |
| Since |
| ||||||
Return Before Taxes |
|
| 5.58 | % |
|
| 3.88 | % |
|
| 4.18 | % |
|
Return After Taxes on Distributions |
|
| 5.46 | % |
|
| 3.45 | % |
|
| 3.59 | % |
|
Return After Taxes on Distributions and Sale of Fund Shares |
|
| 3.37 | % |
|
| 2.83 | % |
|
| 3.00 | % |
|
S&P 500® INDEX** |
|
| 17.88 | % |
|
| 14.42 | % |
|
| 18.55 | % |
|
WATER ISLAND MERGER ARBITRAGE USD HEDGED INDEX*** |
|
| 6.87 | % |
|
| 5.22 | % |
|
| 5.54 | % |
|
BLOOMBERG U.S. TREASURY BILL INDEX**** |
|
| 4.30 | % |
|
| 3.19 | % |
|
| 2.83 | % |
|
BLOOMBERG U.S. AGGREGATE BOND INDEX***** |
|
| 7.30 | % |
|
| ‑0.36 | % |
|
| 0.19 | % |
|
* | The predecessor exchange traded fund’s inception date is May 7, 2020. |
** | To meet regulatory requirements, the S&P 500® Index serves as the Fund’s broad-based securities market index, providing a broad measure of market performance. The S&P 500® Index, or simply the S&P 500, is a stock market index tracking the performance of 500 large companies listed on stock exchanges in the U.S. |
*** | The Water Island Merger Arbitrage USD Hedged Index is the Fund’s Underlying Index and is most representative of the Fund’s risk and return and investment style. The Fund seeks to provide investment results that closely correspond, before fees and expenses, to the performance of its Underlying Index. The Water Island Merger Arbitrage USD Hedged Index is designed to reflect a global merger arbitrage strategy investing in definitive, publicly announced mergers and acquisitions and is comprised of securities of U.S. and foreign companies of any market capitalization. |
**** | The Bloomberg U.S. Treasury Bill Index tracks the market for treasury bills issued by the US government with at least one month and up to, but not including, twelve months remaining to maturity. |
***** | The Bloomberg U.S. Aggregate Bond Index is a market value-weighted index of investment grade fixed-rated debt issues, including government, corporate, asset-backed and mortgage-backed securities with a maturity of one year or more. |
The indexes are calculated on a total-return basis, are unmanaged and are not available for direct investment. The indexes reflect no deduction for fees, expenses, or taxes. The S&P 500® Index, the Bloomberg U.S. Treasury Bill Index and the Bloomberg U.S. Aggregate Bond Index are not intended to, and do not, parallel the risk or investment style of the Fund’s investment strategy. |
In calculating the federal income taxes due on redemptions, capital gains taxes resulting from redemptions are subtracted from the redemption proceeds and the tax benefits from capital losses resulting from the redemptions are added to the redemption proceeds. Under certain circumstances, the addition of the tax benefits from capital losses resulting from redemptions may cause the Return After Taxes on Distributions and Sale of Fund Shares to be greater than the Return After Taxes on Distributions or even the Return Before Taxes. |
The following information provides some indication of the risks and variability of investing in the Fund by showing how the performance of the predecessor exchange traded fund, AltShares Event-Driven ETF, has varied over time.
The Fund acquired the assets and liabilities of the predecessor exchange traded fund after the close on September 25, 2026. As a result of the transaction, the Fund adopted the accounting and performance history of the predecessor exchange traded fund. The information shown below is for the predecessor exchange traded fund. The Fund’s net operating expense ratio is the same as the net operating expense ratio of the predecessor exchange traded fund. Returns in the bar chart and average annual total returns table for the predecessor exchange traded fund have not been adjusted.
The following bar chart and performance table provide some indication of the risks and variability of investing in the Fund by showing changes in the predecessor exchange traded fund’s performance year to year and by showing how the predecessor exchange traded fund’s average annual returns for the past one-year, five-year, and ten-year periods compare to the returns of the S&P 500® Index, Bloomberg U.S. Treasury Bill Index and the Bloomberg U.S. Aggregate Bond Index. The performance table reflects the performance of the predecessor exchange traded fund’s shares before and after taxes. The performance for periods prior to May 12, 2019 does not reflect the current investment strategy of the predecessor exchange traded fund or the Fund. How the predecessor exchange traded fund has performed in the past (before and after taxes) is not necessarily an indication of how the Fund will perform in the future. Updated performance information can be obtained by visiting www.altsharesetfs.com/evnt. High, double-digit returns were primarily achieved during favorable market conditions. Such returns are atypical and may not be repeatable.
| During the period shown in the bar chart, the highest return for the predecessor exchange traded fund for a quarter was 23.87% (for the quarter ended December 31, 2020). The lowest return was ‑6.94% (for the quarter ended June 30, 2022). The year-to-date return of the predecessor exchange traded fund, through June 30, 2026 is 5.55%. |
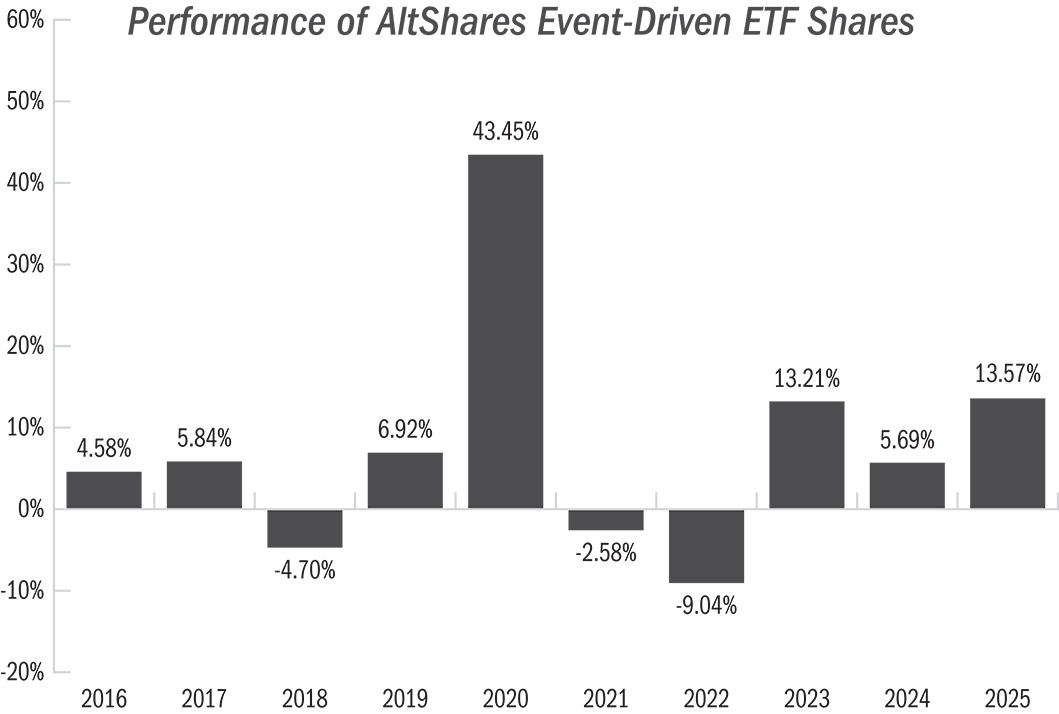
During the period shown in the bar chart, the highest return for the predecessor exchange traded fund for a quarter was 23.87% (for the quarter ended December 31, 2020). The lowest return was ‑6.94% (for the quarter ended June 30, 2022).
The year-to-date return of the predecessor exchange traded fund, through June 30, 2026 is 5.55%.
The table below shows the average annual total returns for the predecessor exchange traded fund, AltShares Event-Driven ETF, compared with those of the S&P 500® Index, Bloomberg U.S. Treasury Bill Index and the Bloomberg U.S. Aggregate Bond Index. The table also presents the impact of taxes on the returns of the predecessor exchange traded fund’s shares. After-tax returns are calculated using the historical highest individual federal marginal income tax rates and do not reflect the impact of state and local taxes. Actual after-tax returns depend on an investor’s tax situation and may differ from those shown, and after-tax returns shown are not relevant to investors who hold their Fund shares through tax-deferred arrangements, such as 401(k) plans or individual retirement accounts. Return after taxes on distributions measures the effect of taxable distributions, but assumes the underlying shares are held for the entire period. Return after taxes on distributions and sale of Fund shares shows the effect of both taxable distributions and any taxable gain or loss that would be realized if the underlying shares were purchased at the beginning and sold at the end of the period (for purposes of the calculation, it is assumed that income dividends and capital gain distributions are reinvested at NAV and that the entire account is redeemed at the end of the period, including reinvested amounts). The Fund’s return after taxes on distributions and sale of Fund shares may be higher than its returns before taxes or its returns after taxes on distributions because it may include a tax benefit resulting from the capital losses that would have been incurred.
ALTSHARES EVENT-DRIVEN ETF |
| One Year |
| Five Years |
| Since |
| ||||||
Return Before Taxes |
|
| 13.57 | % |
|
| 3.78 | % |
|
| 5.51 | % |
|
Return After Taxes on Distributions |
|
| 11.57 | % |
|
| 1.52 | % |
|
| 3.95 | % |
|
Return After Taxes on Distributions and Sale of Fund Shares |
|
| 8.16 | % |
|
| 1.90 | % |
|
| 3.68 | % |
|
S&P 500® INDEX** |
|
| 17.88 | % |
|
| 14.42 | % |
|
| 13.42 | % |
|
BLOOMBERG U.S. TREASURY BILL INDEX*** |
|
| 4.30 | % |
|
| 3.19 | % |
|
| 2.01 | % |
|
BLOOMBERG U.S. AGGREGATE BOND INDEX**** |
|
| 7.30 | % |
|
| ‑0.36 | % |
|
| 1.88 | % |
|
** | The S&P 500® Index serves as the Fund’s regulatory index and provides a broad measure of market performance. The Standard and Poor’s 500® Index, or simply the S&P 500, is a stock market index tracking the performance of 500 large companies listed on stock exchanges in the U.S. |
*** | The Bloomberg U.S. Treasury Bill Index tracks the market for treasury bills issued by the US government with at least one month and up to, but not including, twelve months remaining to maturity. |
**** | The Bloomberg U.S. Aggregate Bond Index is one of the Fund’s additional indexes and is also more representative of the Fund’s risk and return than the regulatory index. The Bloomberg U.S. Aggregate Bond Index is a market value-weighted index of investment grade fixed-rated debt issues, including government, corporate, asset-backed and mortgage-backed securities with a maturity of one year or more. |
The indexes are calculated on a total-return basis, are unmanaged and are not available for direct investment. The indexes reflect no deduction for fees, expenses, or taxes. The indexes are not intended to, and do not, parallel the risk or investment style of the Fund’s investment strategy. |
In calculating the federal income taxes due on redemptions, capital gains taxes resulting from redemptions are subtracted from the redemption proceeds and the tax benefits from capital losses resulting from the redemptions are added to the redemption proceeds. Under certain circumstances, the addition of the tax benefits from capital losses resulting from redemptions may cause the Return After Taxes on Distributions and Sale of Fund Shares to be greater than the Return After Taxes on Distributions or even the Return Before Taxes. |