AltShares Event-Driven ETF (the “Fund”) seeks to achieve capital appreciation over a full market cycle with lower volatility than the broad equity market.
This table describes the fees and expenses that you may pay if you buy, hold, and sell Shares of the Fund. You may pay other fees, such as brokerage commissions and other fees to financial intermediaries, which are not reflected in the table and example below.
Management Fee |
| 1.25 | % |
|
Distribution and/or Service (12b‑1) Fees(1) |
| None |
|
|
Other Expenses |
| 0.01 | % |
|
Dividend on Short Positions and Interest Expense on Short Positions and/or Borrowings |
| 0.01 | % |
|
All Remaining Other Expenses |
| 0.00 | % |
|
Acquired Fund Fees and Expenses |
| 0.01 | % |
|
Total Annual Fund Operating Expenses |
| 1.27 | % |
|
(1) | Pursuant to a Rule 12b‑1 Distribution and Service Plan (the “Plan”), the Fund may bear a Rule 12b‑1 fee not to exceed 0.25% per year of the Fund’s average daily net assets. However, no such fee is currently paid by the Fund, and the Board of Trustees has not currently approved the commencement of any payments under the Plan. |
The following example is intended to help you compare the cost of investing in the Fund with the cost of investing in other funds. The example assumes that you invest $10,000 for the time periods indicated. The example also assumes that the Fund provides a return of 5% a year and that operating expenses remain the same. The example does not reflect any brokerage commissions that you may pay on purchases and sales of Shares. Although your actual costs may be higher or lower, based on these assumptions, whether you do or do not redeem your Shares, your costs would be:
|
|
| One Year |
| Three Years |
| Five Years |
| 10 Years |
| ||||||||
|
|
| $ | 129 |
|
| $ | 403 |
|
| $ | 697 |
|
| $ | 1,534 |
|
|
The Fund may pay transaction costs, including commissions, when it buys and sells securities (or “turns over” its portfolio). A higher portfolio turnover rate may indicate higher transaction costs and may result in higher taxes when Shares are held in a taxable account. Transaction costs, which are not reflected in the annual fund operating expenses or in the example, affect the Fund’s performance. For the fiscal year ended May 31, 2026, the Fund’s portfolio turnover rate was 381% of the average value of its portfolio.
To pursue its investment objective, the Fund employs a “long/short” event-driven strategy, which seeks to profit by investing, long and/or short, in the equity and debt securities of companies whose prices Water Island Capital, LLC (the “Adviser”) believes are or will be impacted by a publicly announced or anticipated corporate event. The strategy may invest both long and short across various industries/sectors, market capitalizations, and credit qualities, and in both U.S. and foreign securities, seeking what the Adviser believes are the most favorable event opportunities across the globe. By focusing on event opportunities, the Adviser aims to generate a return profile that is more correlated to the outcomes of each idiosyncratic event rather than the overall direction of broader equity and credit markets.
Corporate events may take the form of “hard” catalysts or “soft” catalysts as described below. The Fund may invest in both hard and soft catalysts, though under normal market conditions the Adviser expects to focus on hard catalyst events – predominantly definitive merger arbitrage investments. Other approaches to event-driven investing in which the Adviser may engage include special situations and other types of arbitrage trades, such as convertible arbitrage and capital structure arbitrage. The Fund will invest in catalysts without bias toward a company’s capital structure, allowing the Fund to position its investments in both equity and credit instruments, selecting whichever security the Adviser believes offers the greatest reward-to-risk ratio for a given event opportunity.
Hard Catalysts: Investment opportunities predicated on hard catalysts tend to be characterized by more definitive outcomes, shorter timelines, and lower levels of volatility. The most common example of a hard catalyst is definitive, publicly announced mergers and acquisitions (“M&A”) whereby a legally binding merger agreement is in place, but hard catalysts may also take other forms including, but not limited to, Dutch tenders (whereby an offer is made to purchase securities within a given price range through an auction structure, wherein shareholders are invited to sell shares over a specific time period by specifying the lowest price within the range that they will accept), yield-to-call opportunities (whereby a company or other entity’s callable
bonds are purchased and held until the next anticipated call date, at which point they may be redeemed prior to maturity), and spin-offs (pre-completion, whereby a company has announced its intent to separate its business into two or more separately traded independent entities, which may be able to unlock more shareholder value on a standalone rather than combined basis).
Soft Catalysts: Investment opportunities predicated on soft catalysts tend to be characterized by less certain outcomes, longer timelines, and greater levels of risk – though also commensurate greater potential reward. Examples of soft catalysts include a broad range of events spurred by company-specific, industry-wide, or broad economic conditions such as speculated M&A (whereby certain M&A are anticipated, rumored or in negotiations but are not yet definitive), asset sales, spin-offs (post-completion, whereby a company has completed the separation of its business into two or more separately traded independent entities), turnaround plans, management changes, activist campaigns, transformational M&A (post-completion), corporate levering/de-levering, credit refinancings, recapitalizations, restructurings, and other corporate reorganizations and re-rating opportunities.
The Adviser generally engages in active and frequent trading of portfolio securities to achieve the Fund’s principal investment objective. The Adviser generally seeks to maintain a fully invested portfolio; however, for various reasons, there may be times when the Fund may hold a significant portion of its assets in cash or cash equivalents, including money market and similar cash management funds, money market instruments such as Treasury bills, and other short-term or temporary investments. Such instances may occur for defensive purposes in response to adverse market, economic, political, or other conditions; to preserve the Fund’s ability to capitalize quickly on new market opportunities; because the Adviser has determined to obtain investment exposure through derivative instruments instead of direct cash investments; or for other reasons, such as after a period in which several catalysts held by the Fund close in a similar timeframe, yet before capital is redeployed to other opportunities.
In addition, the Fund will hold a higher percentage of its assets in long positions (i.e., the Fund will be “net long”). The Fund’s net long exposure may exceed 100% of the Fund’s net assets.
The Fund may maintain long and short positions through the use of derivative instruments, including swap agreements, options, futures, and forward contracts, without investing directly in the underlying asset. The Fund may use derivative instruments to attempt to both increase the return of the Fund and hedge (protect) the value of the Fund’s assets. Investments in derivative instruments may have the economic effect of creating financial leverage in the Fund’s portfolio because such investments may give rise to exposures that exceed the Fund’s total assets and may result in losses that exceed the amount the Fund invested. Financial leverage will magnify, sometimes significantly, the Fund’s exposure to any increase or decrease in prices associated with a particular reference asset resulting in increased volatility in the value of the Fund’s portfolio. The Fund may invest in convertible and non-convertible debt securities, including high yield debt securities, also known as “junk bonds.” Furthermore, the Fund may invest in exchange-traded funds (“ETFs”).
The Fund is not limited with respect to issuer, geography, market capitalization, credit quality, sector or industry.
The following information provides some indication of the risks and variability of investing in the Fund by showing how the performance of the predecessor exchange traded fund, AltShares Event-Driven ETF, has varied over time.
The Fund acquired the assets and liabilities of the predecessor exchange traded fund after the close on September 25, 2026. As a result of the transaction, the Fund adopted the accounting and performance history of the predecessor exchange traded fund. The information shown below is for the predecessor exchange traded fund. The Fund’s net operating expense ratio is the same as the net operating expense ratio of the predecessor exchange traded fund. Returns in the bar chart and average annual total returns table for the predecessor exchange traded fund have not been adjusted.
The following bar chart and performance table provide some indication of the risks and variability of investing in the Fund by showing changes in the predecessor exchange traded fund’s performance year to year and by showing how the predecessor exchange traded fund’s average annual returns for the past one-year, five-year, and ten-year periods compare to the returns of the S&P 500® Index, Bloomberg U.S. Treasury Bill Index and the Bloomberg U.S. Aggregate Bond Index. The performance table reflects the performance of the predecessor exchange traded fund’s shares before and after taxes. The performance for periods prior to May 12, 2019 does not reflect the current investment strategy of the predecessor exchange traded fund or the Fund. How the predecessor exchange traded fund has performed in the past (before and after taxes) is not necessarily an indication of how the Fund will perform in the future. Updated performance information can be obtained by visiting www.altsharesetfs.com/evnt. High, double-digit returns were primarily achieved during favorable market conditions. Such returns are atypical and may not be repeatable.
| During the period shown in the bar chart, the highest return for the predecessor exchange traded fund for a quarter was 23.87% (for the quarter ended December 31, 2020). The lowest return was ‑6.94% (for the quarter ended June 30, 2022). The year-to-date return of the predecessor exchange traded fund, through June 30, 2026 is 5.55%. |
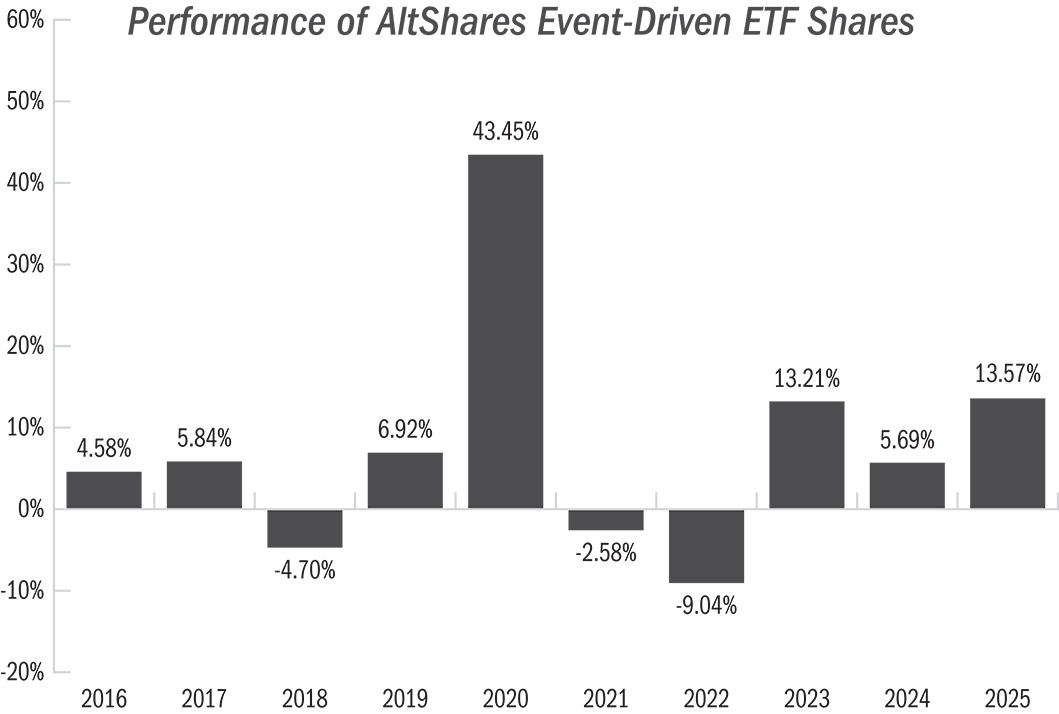
During the period shown in the bar chart, the highest return for the predecessor exchange traded fund for a quarter was 23.87% (for the quarter ended December 31, 2020). The lowest return was ‑6.94% (for the quarter ended June 30, 2022).
The year-to-date return of the predecessor exchange traded fund, through June 30, 2026 is 5.55%.
The table below shows the average annual total returns for the predecessor exchange traded fund, AltShares Event-Driven ETF, compared with those of the S&P 500® Index, Bloomberg U.S. Treasury Bill Index and the Bloomberg U.S. Aggregate Bond Index. The table also presents the impact of taxes on the returns of the predecessor exchange traded fund’s shares. After-tax returns are calculated using the historical highest individual federal marginal income tax rates and do not reflect the impact of state and local taxes. Actual after-tax returns depend on an investor’s tax situation and may differ from those shown, and after-tax returns shown are not relevant to investors who hold their Fund shares through tax-deferred arrangements, such as 401(k) plans or individual retirement accounts. Return after taxes on distributions measures the effect of taxable distributions, but assumes the underlying shares are held for the entire period. Return after taxes on distributions and sale of Fund shares shows the effect of both taxable distributions and any taxable gain or loss that would be realized if the underlying shares were purchased at the beginning and sold at the end of the period (for purposes of the calculation, it is assumed that income dividends and capital gain distributions are reinvested at NAV and that the entire account is redeemed at the end of the period, including reinvested amounts). The Fund’s return after taxes on distributions and sale of Fund shares may be higher than its returns before taxes or its returns after taxes on distributions because it may include a tax benefit resulting from the capital losses that would have been incurred.
ALTSHARES EVENT-DRIVEN ETF |
| One Year |
| Five Years |
| Since |
| ||||||
Return Before Taxes |
|
| 13.57 | % |
|
| 3.78 | % |
|
| 5.51 | % |
|
Return After Taxes on Distributions |
|
| 11.57 | % |
|
| 1.52 | % |
|
| 3.95 | % |
|
Return After Taxes on Distributions and Sale of Fund Shares |
|
| 8.16 | % |
|
| 1.90 | % |
|
| 3.68 | % |
|
S&P 500® INDEX** |
|
| 17.88 | % |
|
| 14.42 | % |
|
| 13.42 | % |
|
BLOOMBERG U.S. TREASURY BILL INDEX*** |
|
| 4.30 | % |
|
| 3.19 | % |
|
| 2.01 | % |
|
BLOOMBERG U.S. AGGREGATE BOND INDEX**** |
|
| 7.30 | % |
|
| ‑0.36 | % |
|
| 1.88 | % |
|
** | The S&P 500® Index serves as the Fund’s regulatory index and provides a broad measure of market performance. The Standard and Poor’s 500® Index, or simply the S&P 500, is a stock market index tracking the performance of 500 large companies listed on stock exchanges in the U.S. |
*** | The Bloomberg U.S. Treasury Bill Index tracks the market for treasury bills issued by the US government with at least one month and up to, but not including, twelve months remaining to maturity. |
**** | The Bloomberg U.S. Aggregate Bond Index is one of the Fund’s additional indexes and is also more representative of the Fund’s risk and return than the regulatory index. The Bloomberg U.S. Aggregate Bond Index is a market value-weighted index of investment grade fixed-rated debt issues, including government, corporate, asset-backed and mortgage-backed securities with a maturity of one year or more. |
The indexes are calculated on a total-return basis, are unmanaged and are not available for direct investment. The indexes reflect no deduction for fees, expenses, or taxes. The indexes are not intended to, and do not, parallel the risk or investment style of the Fund’s investment strategy. |
In calculating the federal income taxes due on redemptions, capital gains taxes resulting from redemptions are subtracted from the redemption proceeds and the tax benefits from capital losses resulting from the redemptions are added to the redemption proceeds. Under certain circumstances, the addition of the tax benefits from capital losses resulting from redemptions may cause the Return After Taxes on Distributions and Sale of Fund Shares to be greater than the Return After Taxes on Distributions or even the Return Before Taxes. |