AltShares Merger Arbitrage ETF (the “Fund”) seeks to provide investment results that closely correspond, before fees and expenses, to the performance of its underlying index, the Water Island Merger Arbitrage USD Hedged Index (the “Underlying Index”).
This table describes the fees and expenses that you may pay if you buy, hold, and sell Shares of the Fund. You may pay other fees, such as brokerage commissions and other fees to financial intermediaries, which are not reflected in the table and example below.
Management Fee |
| 0.75 | % |
|
Distribution and/or Service (12b‑1) Fees(1) |
| None |
|
|
Other Expenses |
| 0.06 | % |
|
Dividend on Short Positions and Interest Expense on Short Positions and/or Borrowings |
| 0.06 | % |
|
All Remaining Other Expenses |
| 0.00 |
|
|
Acquired Fund Fees and Expenses |
| 0.01 | % |
|
Total Annual Fund Operating Expenses |
| 0.82 | % |
|
(1) | Pursuant to a Rule 12b‑1 Distribution and Service Plan (the “Plan”), the Fund may bear a Rule 12b‑1 fee not to exceed 0.25% per year of the Fund’s average daily net assets. However, no such fee is currently paid by the Fund, and the Board of Trustees has not currently approved the commencement of any payments under the Plan. |
The following example is intended to help you compare the cost of investing in the Fund with the cost of investing in other funds. The example assumes that you invest $10,000 for the time periods indicated. The example also assumes that the Fund provides a return of 5% each year and that the Fund’s expenses are equal to the Total Annual Operating Expenses each year. The example does not reflect any brokerage commissions that you may pay on purchases and sales of Shares. Although your actual costs may be higher or lower, based on these assumptions, whether you do or do not redeem your Shares, your costs would be:
|
|
| One Year |
| Three Years |
| Five Years |
| 10 Years |
| |||||||||
|
|
| $ |
| 84 |
|
| $ | 262 |
|
| $ | 455 |
|
| $ | 1,014 |
|
|
The Fund may pay transaction costs, including commissions, when it buys and sells securities (or “turns over” its portfolio). A higher portfolio turnover rate may indicate higher transaction costs and may result in higher taxes when Shares are held in a taxable account. Transaction costs, which are not reflected in the annual fund operating expenses or in the example above, affect the Fund’s performance. For the fiscal year ended May 31, 2026, the Fund’s portfolio turnover rate was 399% of the average value of its portfolio.
The Fund seeks to provide investment results that closely correspond, before fees and expenses, to the performance of its Underlying Index, which is designed to reflect a global merger arbitrage strategy. The most common approach to merger arbitrage, and the approach the Underlying Index (and by extension the Fund) reflects, is to seek to capture the difference (the “spread”) between the price at which the stock of a target company in a publicly announced merger, takeover, tender offer, or leveraged buy-out (the “Target”) trades after the announcement of the acquisition and the price the acquiring company (the “Acquirer”) has agreed to pay for the stock of the Target.
The Underlying Index is rebalanced and reconstituted twice per month. The Fund reconstitutes and rebalances on the same schedule as the Underlying Index. The Fund’s investment adviser, Water Island Capital, LLC (the “Adviser”), generally expects the Underlying Index to include between 30‑50 Targets at each reconstitution. To gain exposure to the Underlying Index, the Fund will establish long positions in shares of the Target stocks. When the terms of a transaction call for the exchange of an Acquirer’s common stock, the Underlying Index, as a result of the index methodology, will include short exposure in the Acquirer’s stock at the deal’s exchange ratio. This short exposure is designed to lock in the current deal spread, and to hedge against the risk of a decline in the deal value as a result of a decline in the value of the Acquirer’s stock. The Fund may invest in derivatives, such as swaps, to obtain exposure to long and short constituents of the Underlying Index.
The Underlying Index is comprised of securities of United States (“U.S.”) and foreign companies of any market capitalization. The Underlying Index is calculated in U.S. dollars. The Underlying Index hedges against fluctuations in the relative value of foreign currencies against the U.S. dollar. The Fund uses forward currency or futures contracts to effectuate these hedges in the Underlying Index. The amount of forward and futures contracts held by the Fund is based on the aggregate exposure of the Fund to each currency.
The Underlying Index may also include an allocation to cash-like instruments, such as money market and similar cash management funds and ultra short-term bond exchange-traded funds (“ETFs”). In addition, when a transaction closes, any allocation in the Underlying Index to the securities of the Target and/or Acquirer will be reallocated to such instruments. The Underlying Index generally only allocates to cash when there are an insufficient number of Targets for inclusion in the Underlying Index and when a transaction represented by a Target in the Underlying Index has been consummated or abandoned. Accordingly, cash allocations in the Underlying Index and Fund are generally removed as part of each Underlying Index reconstitution, though cash allocations may continue to be included if there are an insufficient number of Targets.
Under normal market conditions, the Fund will invest at least 80% of its net assets (including borrowings for investment purposes) in the constituents of the Underlying Index and in financial instruments with economic characteristics similar to such constituents, such as swaps on such constituents. Although the Fund expects to replicate (or hold all components of) the Underlying Index, the Fund reserves the right to use representative sampling to track the Underlying Index. The Fund may invest up to 20% of its net assets in instruments that are not included in the Underlying Index, but that the Adviser believes will help the Fund track the Underlying Index. The Fund may also invest in financial instruments, including swap agreements, futures contracts, ETFs, and options on securities or equity securities indices. With respect to derivatives, the Fund will invest principally in swaps and forward contracts on foreign currencies. The Fund will invest in other funds, such as money market and similar cash management funds and ultra short-term bond ETFs, only to reflect cash allocations by the Underlying Index.
The Fund is non-diversified. To the extent the Underlying Index is concentrated in a particular industry, the Fund is expected to be concentrated in that industry. As of August 31, 2026, the Underlying Index included 65 long positions and 16 short positions in companies with market capitalizations of between $321 million and $2,745 billion.
The Underlying Index was developed by Water Island Indices LLC (the “Index Provider”), an affiliate of the Adviser. The Index Calculation Agent is Solactive AG, which is not affiliated with the Index Provider, the Fund, or the Adviser. The Index Calculation Agent provides information to the Fund about the constituents of the Underlying Index and does not provide investment advice with respect to the desirability of investing in, purchasing or selling securities.
The following information provides some indication of the risks and variability of investing in the Fund by showing how the performance of the predecessor exchange traded fund, AltShares Merger Arbitrage ETF, has varied over time.
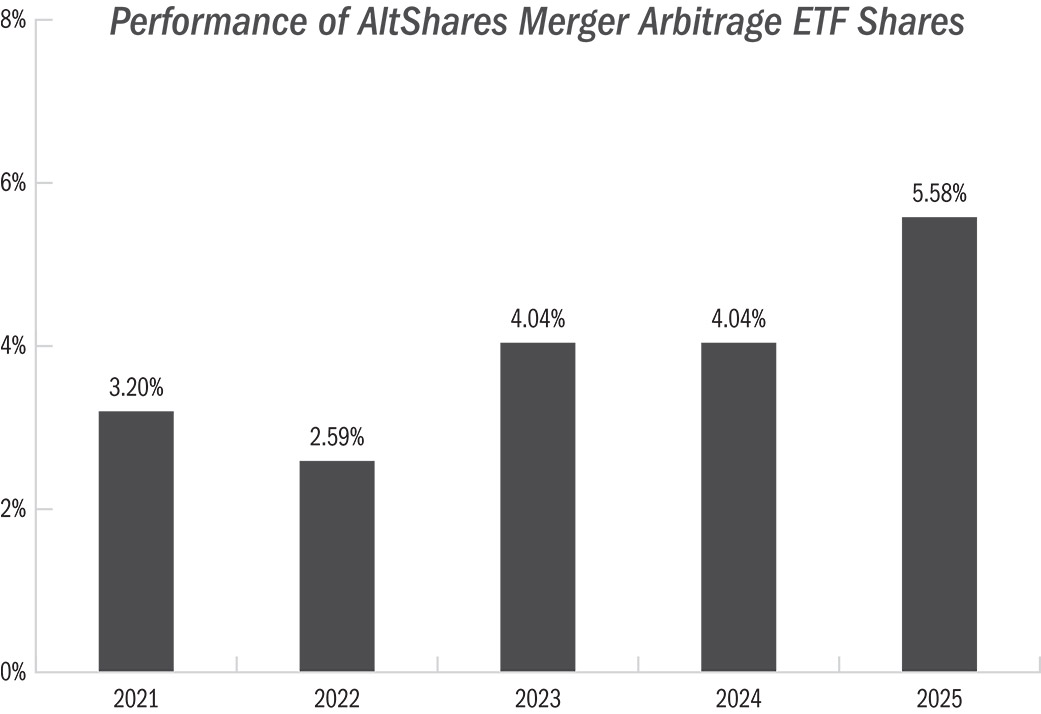
The Fund acquired the assets and liabilities of the predecessor exchange traded fund after the close on September 25, 2026. As a result of the transaction, the Fund adopted the accounting and performance history of the predecessor exchange traded fund. The information shown below is for the predecessor exchange traded fund. The Fund’s net operating expense ratio is the same as the net operating expense ratio of the predecessor exchange traded fund. Returns in the bar chart and average annual total returns table for the predecessor exchange traded fund have not been adjusted.
The following bar chart and performance table provide some indication of the risks and variability of investing in the Fund by showing changes in the predecessor exchange traded fund’s performance from year to year and by showing how the predecessor exchange traded fund’s average annual total returns for the past one-year, five-year, and since inception periods compare to the returns of the S&P 500® Index, Water Island Merger Arbitrage USD
Hedged Index, Bloomberg U.S. Treasury Bill Index and the Bloomberg U.S. Aggregate Bond Index. The performance table reflects the performance of the predecessor exchange traded fund’s shares before and after taxes. The performance shown reflects voluntary fee waivers which had a positive effect on performance and may be discontinued at any time. Without such voluntary fee waivers, performance would have been lower. How the predecessor exchange traded fund has performed in the past (before and after taxes) is not necessarily an indication of how the Fund will perform in the future. Updated performance information can be obtained by visiting www.altsharesetfs.com/arb.
| During the period shown in the bar chart, the highest return for the predecessor exchange traded fund for a quarter was 3.27% during the quarter ended September 30, 2023 and the lowest return for a quarter was 1.43% during the quarter ended June 30, 2022. The year-to-date return of the predecessor exchange traded fund’s shares through June 30, 2026 is 2.45%. |
|
During the period shown in the bar chart, the highest return for the predecessor exchange traded fund for a quarter was 3.27% during the quarter ended September 30, 2023 and the lowest return for a quarter was 1.43% during the quarter ended June 30, 2022. The year-to-date return of the predecessor exchange traded fund’s shares through June 30, 2026 is 2.45%. |
The table below shows the average annual total returns for the predecessor exchange traded fund, AltShares Merger Arbitrage ETF, compared with those of the S&P 500® Index, Water Island Merger Arbitrage USD Hedged Index, Bloomberg U.S. Treasury Bill Index and the Bloomberg U.S. Aggregate Bond Index. The table also presents the impact of taxes on the returns of the predecessor exchange traded fund’s shares. After-tax returns are calculated using the historical highest individual federal marginal income tax rates and do not reflect the impact of state and local taxes. Actual after-tax returns depend on an investor’s tax situation and may differ from those shown, and after-tax returns shown are not relevant to investors who hold their Fund shares through tax-deferred arrangements, such as 401(k) plans or individual retirement accounts. Return after taxes on distributions measures the effect of taxable distributions, but assumes the underlying shares are held for the entire period. Return after taxes on distributions and sale of Fund shares shows the effect of both taxable distributions and any taxable gain or loss that would be realized if the underlying shares were purchased at the beginning and sold at the end of the period (for purposes of the calculation, it is assumed that income dividends and capital gain distributions are reinvested at NAV and that the entire account is redeemed at the end of the period, including reinvested amounts).
ALTSHARES MERGER ARBITRAGE ETF |
| One Year |
| Five Years |
| Since |
| ||||||
Return Before Taxes |
|
| 5.58 | % |
|
| 3.88 | % |
|
| 4.18 | % |
|
Return After Taxes on Distributions |
|
| 5.46 | % |
|
| 3.45 | % |
|
| 3.59 | % |
|
Return After Taxes on Distributions and Sale of Fund Shares |
|
| 3.37 | % |
|
| 2.83 | % |
|
| 3.00 | % |
|
S&P 500® INDEX** |
|
| 17.88 | % |
|
| 14.42 | % |
|
| 18.55 | % |
|
WATER ISLAND MERGER ARBITRAGE USD HEDGED INDEX*** |
|
| 6.87 | % |
|
| 5.22 | % |
|
| 5.54 | % |
|
BLOOMBERG U.S. TREASURY BILL INDEX**** |
|
| 4.30 | % |
|
| 3.19 | % |
|
| 2.83 | % |
|
BLOOMBERG U.S. AGGREGATE BOND INDEX***** |
|
| 7.30 | % |
|
| ‑0.36 | % |
|
| 0.19 | % |
|
* | The predecessor exchange traded fund’s inception date is May 7, 2020. |
** | To meet regulatory requirements, the S&P 500® Index serves as the Fund’s broad-based securities market index, providing a broad measure of market performance. The S&P 500® Index, or simply the S&P 500, is a stock market index tracking the performance of 500 large companies listed on stock exchanges in the U.S. |
*** | The Water Island Merger Arbitrage USD Hedged Index is the Fund’s Underlying Index and is most representative of the Fund’s risk and return and investment style. The Fund seeks to provide investment results that closely correspond, before fees and expenses, to the performance of its Underlying Index. The Water Island Merger Arbitrage USD Hedged Index is designed to reflect a global merger arbitrage strategy investing in definitive, publicly announced mergers and acquisitions and is comprised of securities of U.S. and foreign companies of any market capitalization. |
**** | The Bloomberg U.S. Treasury Bill Index tracks the market for treasury bills issued by the US government with at least one month and up to, but not including, twelve months remaining to maturity. |
***** | The Bloomberg U.S. Aggregate Bond Index is a market value-weighted index of investment grade fixed-rated debt issues, including government, corporate, asset-backed and mortgage-backed securities with a maturity of one year or more. |
The indexes are calculated on a total-return basis, are unmanaged and are not available for direct investment. The indexes reflect no deduction for fees, expenses, or taxes. The S&P 500® Index, the Bloomberg U.S. Treasury Bill Index and the Bloomberg U.S. Aggregate Bond Index are not intended to, and do not, parallel the risk or investment style of the Fund’s investment strategy. |
In calculating the federal income taxes due on redemptions, capital gains taxes resulting from redemptions are subtracted from the redemption proceeds and the tax benefits from capital losses resulting from the redemptions are added to the redemption proceeds. Under certain circumstances, the addition of the tax benefits from capital losses resulting from redemptions may cause the Return After Taxes on Distributions and Sale of Fund Shares to be greater than the Return After Taxes on Distributions or even the Return Before Taxes. |