Shareholder Report
Jul. 31, 2026
USD ($)
holding
Jul. 31, 2026
USD ($)
holding
Jul. 31, 2026
USD ($)
holding
What were the fund costs for the last year? (based on a hypothetical $10,000 investment) | ||||||||
Costs of a $10,000 investment | Costs paid as a percentage of a $10,000 investment | |||||||
| Investor Class | $89 | 0.85% | ||||||
| What were the key factors that affected the fund’s performance? | |||||
Focused Dynamic Growth Fund Investor Class returned 10.57% for the reporting period ended July 31, 2026. | |||||
| The fund seeks long-term capital growth. The commentary below refers to the fund’s performance compared to the Russell 1000 Growth Index. | |||||
• | The communication services sector contributed most to relative results, driven by security selection. The portfolio's holdings in the interactive media and services industry were the main sources of strength. Alphabet, the parent of Google, was the number one overall contributor to the portfolio's results for the period. | ||||
• | Industrials was another area of positive contribution, with stock selection representing by far the most significant driver of relative performance. The choice of holdings in the aerospace and defense area added positively to overall results. An overweight position in launch and space systems provider Rocket Lab was the largest contributor. | ||||
• | Health care was the largest detractor from relative performance, as a result of stock choices. The biotechnology area was the largest detractor within the sector. Alnylam Pharmaceuticals, a biopharmaceutical company focused on RNA interference therapeutics, was a leading source of weakness. | ||||
• | Positioning in the information technology sector also weighed on relative results. It hurt performance to have no exposure to the computers and peripherals industry. The leading relative detractor was a lack of exposure to consumer electronics giant Apple. | ||||
Cumulative Performance (based on an initial $10,000 investment) | ||
July 31, 2016 through July 31, 2026 | ||
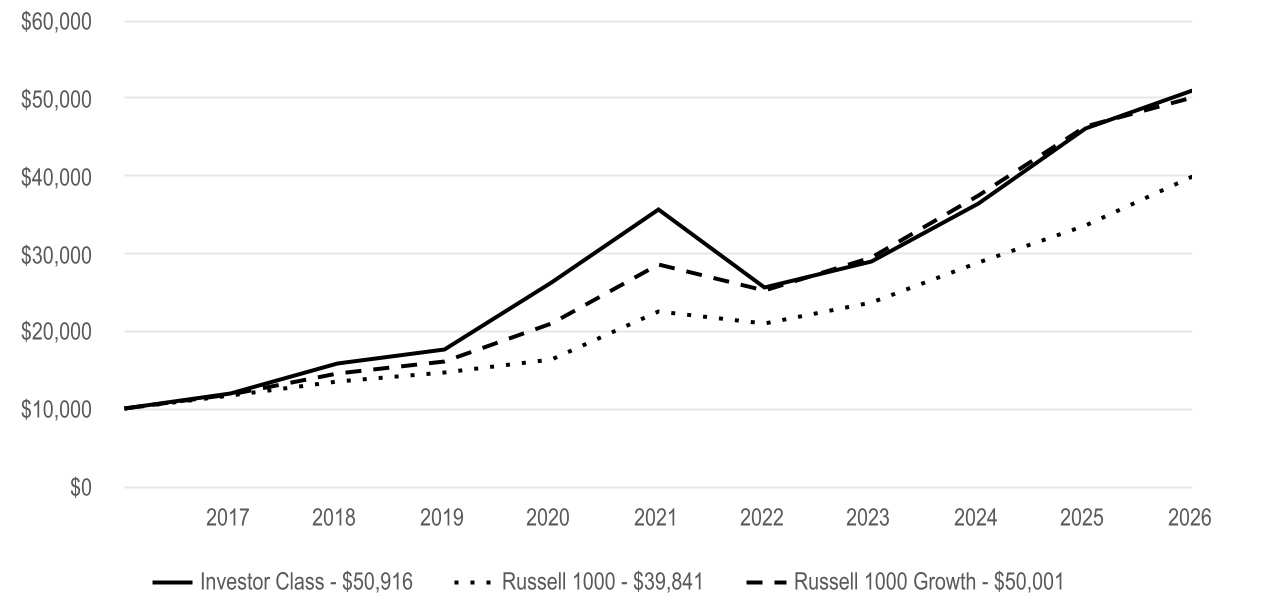
Average Annual Total Returns | |||||||||||
| 1 Year | 5 Year | 10 Year | |||||||||
| Investor Class | 10.57% | 7.39% | 17.68% | ||||||||
| Regulatory Index | |||||||||||
| Russell 1000 | 18.94% | 12.12% | 14.82% | ||||||||
| Performance Index | |||||||||||
| Russell 1000 Growth | 8.03% | 11.88% | 17.46% | ||||||||
| Fund Holdings | ||
Types of Investments in Portfolio (as a % of net assets) | Top Five Industries (as a % of net assets) | |||||||||||||
| Common Stocks | 99.4% | Semiconductors and Semiconductor Equipment | 27% | |||||||||||
| Short-Term Investments | 0.4% | Interactive Media and Services | 21% | |||||||||||
| Other Assets and Liabilities | 0.2% | Software | 12% | |||||||||||
| Broadline Retail | 8% | |||||||||||||
| Automobiles | 5% | |||||||||||||
What were the fund costs for the last year? (based on a hypothetical $10,000 investment) | ||||||||
Costs of a $10,000 investment | Costs paid as a percentage of a $10,000 investment | |||||||
| I Class | $69 | 0.65% | ||||||
| What were the key factors that affected the fund’s performance? | |||||
Focused Dynamic Growth Fund I Class returned 10.80% for the reporting period ended July 31, 2026. | |||||
| The fund seeks long-term capital growth. The commentary below refers to the fund’s performance compared to the Russell 1000 Growth Index. | |||||
• | The communication services sector contributed most to relative results, driven by security selection. The portfolio's holdings in the interactive media and services industry were the main sources of strength. Alphabet, the parent of Google, was the number one overall contributor to the portfolio's results for the period. | ||||
• | Industrials was another area of positive contribution, with stock selection representing by far the most significant driver of relative performance. The choice of holdings in the aerospace and defense area added positively to overall results. An overweight position in launch and space systems provider Rocket Lab was the largest contributor. | ||||
• | Health care was the largest detractor from relative performance, as a result of stock choices. The biotechnology area was the largest detractor within the sector. Alnylam Pharmaceuticals, a biopharmaceutical company focused on RNA interference therapeutics, was a leading source of weakness. | ||||
• | Positioning in the information technology sector also weighed on relative results. It hurt performance to have no exposure to the computers and peripherals industry. The leading relative detractor was a lack of exposure to consumer electronics giant Apple. | ||||
Cumulative Performance (based on an initial $10,000 investment) | ||
July 31, 2016 through July 31, 2026 | ||
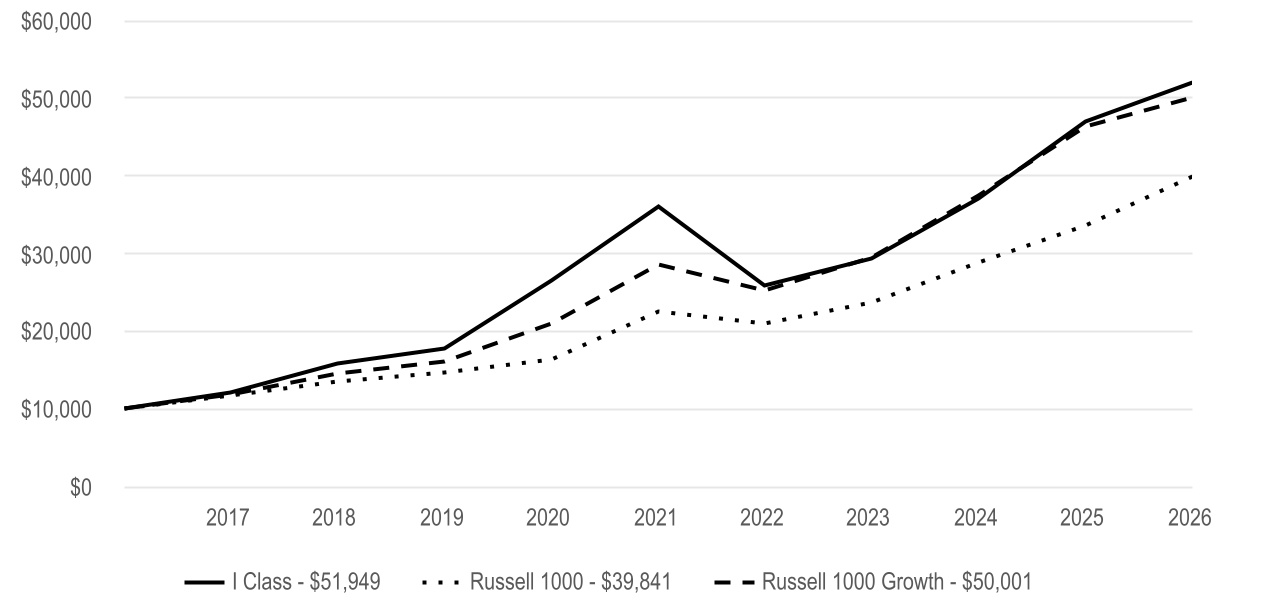
Average Annual Total Returns | |||||||||||
| 1 Year | 5 Year | 10 Year | |||||||||
| I Class | 10.80% | 7.60% | 17.91% | ||||||||
| Regulatory Index | |||||||||||
| Russell 1000 | 18.94% | 12.12% | 14.82% | ||||||||
| Performance Index | |||||||||||
| Russell 1000 Growth | 8.03% | 11.88% | 17.46% | ||||||||
| Fund Holdings | ||
Types of Investments in Portfolio (as a % of net assets) | Top Five Industries (as a % of net assets) | |||||||||||||
| Common Stocks | 99.4% | Semiconductors and Semiconductor Equipment | 27% | |||||||||||
| Short-Term Investments | 0.4% | Interactive Media and Services | 21% | |||||||||||
| Other Assets and Liabilities | 0.2% | Software | 12% | |||||||||||
| Broadline Retail | 8% | |||||||||||||
| Automobiles | 5% | |||||||||||||
What were the fund costs for the last year? (based on a hypothetical $10,000 investment) | ||||||||
Costs of a $10,000 investment | Costs paid as a percentage of a $10,000 investment | |||||||
| A Class | $116 | 1.10% | ||||||
| What were the key factors that affected the fund’s performance? | |||||
Focused Dynamic Growth Fund A Class returned 10.29% for the reporting period ended July 31, 2026. | |||||
| The fund seeks long-term capital growth. The commentary below refers to the fund’s performance compared to the Russell 1000 Growth Index. | |||||
• | The communication services sector contributed most to relative results, driven by security selection. The portfolio's holdings in the interactive media and services industry were the main sources of strength. Alphabet, the parent of Google, was the number one overall contributor to the portfolio's results for the period. | ||||
• | Industrials was another area of positive contribution, with stock selection representing by far the most significant driver of relative performance. The choice of holdings in the aerospace and defense area added positively to overall results. An overweight position in launch and space systems provider Rocket Lab was the largest contributor. | ||||
• | Health care was the largest detractor from relative performance, as a result of stock choices. The biotechnology area was the largest detractor within the sector. Alnylam Pharmaceuticals, a biopharmaceutical company focused on RNA interference therapeutics, was a leading source of weakness. | ||||
• | Positioning in the information technology sector also weighed on relative results. It hurt performance to have no exposure to the computers and peripherals industry. The leading relative detractor was a lack of exposure to consumer electronics giant Apple. | ||||
Cumulative Performance (based on an initial $10,000 investment) | ||
July 31, 2016 through July 31, 2026 | ||
The initial investment is adjusted to reflect the maximum initial sales charge. | ||
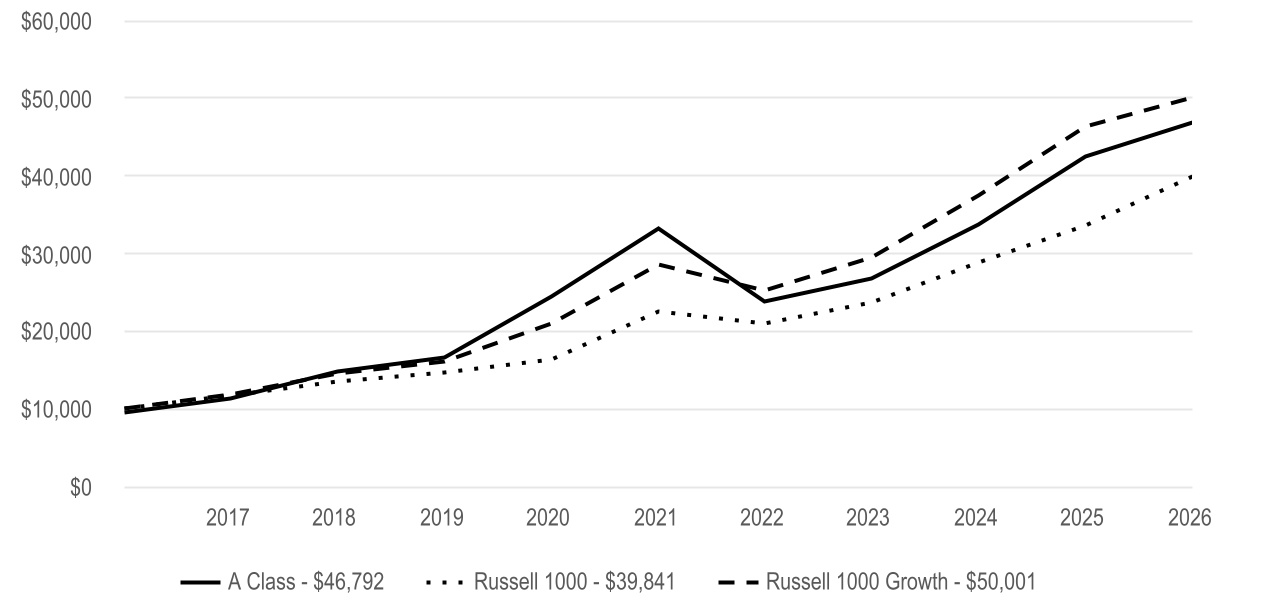
Average Annual Total Returns | |||||||||||
| 1 Year | 5 Year | 10 Year | |||||||||
| A Class | 10.29% | 7.12% | 17.38% | ||||||||
| A Class - with sales charge | 3.94% | 5.86% | 16.69% | ||||||||
| Regulatory Index | |||||||||||
| Russell 1000 | 18.94% | 12.12% | 14.82% | ||||||||
| Performance Index | |||||||||||
| Russell 1000 Growth | 8.03% | 11.88% | 17.46% | ||||||||
| Fund Holdings | ||
Types of Investments in Portfolio (as a % of net assets) | Top Five Industries (as a % of net assets) | |||||||||||||
| Common Stocks | 99.4% | Semiconductors and Semiconductor Equipment | 27% | |||||||||||
| Short-Term Investments | 0.4% | Interactive Media and Services | 21% | |||||||||||
| Other Assets and Liabilities | 0.2% | Software | 12% | |||||||||||
| Broadline Retail | 8% | |||||||||||||
| Automobiles | 5% | |||||||||||||
What were the fund costs for the last year? (based on a hypothetical $10,000 investment) | ||||||||
Costs of a $10,000 investment | Costs paid as a percentage of a $10,000 investment | |||||||
| R Class | $142 | 1.35% | ||||||
| What were the key factors that affected the fund’s performance? | |||||
Focused Dynamic Growth Fund R Class returned 10.03% for the reporting period ended July 31, 2026. | |||||
| The fund seeks long-term capital growth. The commentary below refers to the fund’s performance compared to the Russell 1000 Growth Index. | |||||
• | The communication services sector contributed most to relative results, driven by security selection. The portfolio's holdings in the interactive media and services industry were the main sources of strength. Alphabet, the parent of Google, was the number one overall contributor to the portfolio's results for the period. | ||||
• | Industrials was another area of positive contribution, with stock selection representing by far the most significant driver of relative performance. The choice of holdings in the aerospace and defense area added positively to overall results. An overweight position in launch and space systems provider Rocket Lab was the largest contributor. | ||||
• | Health care was the largest detractor from relative performance, as a result of stock choices. The biotechnology area was the largest detractor within the sector. Alnylam Pharmaceuticals, a biopharmaceutical company focused on RNA interference therapeutics, was a leading source of weakness. | ||||
• | Positioning in the information technology sector also weighed on relative results. It hurt performance to have no exposure to the computers and peripherals industry. The leading relative detractor was a lack of exposure to consumer electronics giant Apple. | ||||
Cumulative Performance (based on an initial $10,000 investment) | ||
July 31, 2016 through July 31, 2026 | ||
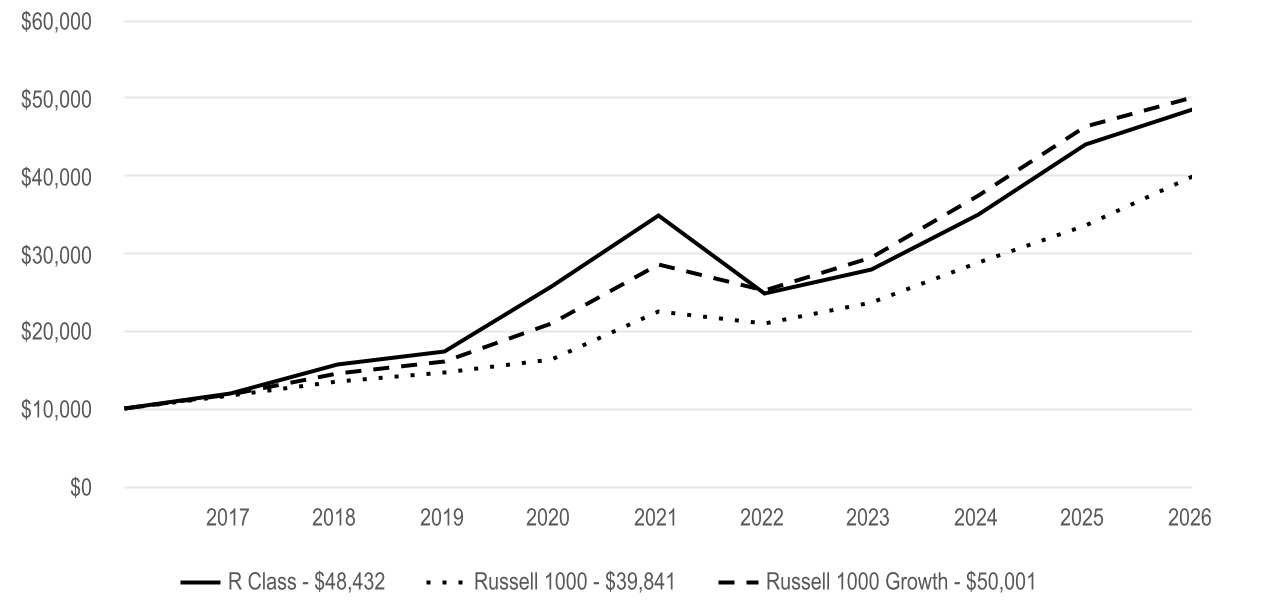
Average Annual Total Returns | |||||||||||
| 1 Year | 5 Year | 10 Year | |||||||||
| R Class | 10.03% | 6.85% | 17.09% | ||||||||
| Regulatory Index | |||||||||||
| Russell 1000 | 18.94% | 12.12% | 14.82% | ||||||||
| Performance Index | |||||||||||
| Russell 1000 Growth | 8.03% | 11.88% | 17.46% | ||||||||
| Fund Holdings | ||
Types of Investments in Portfolio (as a % of net assets) | Top Five Industries (as a % of net assets) | |||||||||||||
| Common Stocks | 99.4% | Semiconductors and Semiconductor Equipment | 27% | |||||||||||
| Short-Term Investments | 0.4% | Interactive Media and Services | 21% | |||||||||||
| Other Assets and Liabilities | 0.2% | Software | 12% | |||||||||||
| Broadline Retail | 8% | |||||||||||||
| Automobiles | 5% | |||||||||||||
What were the fund costs for the last year? (based on a hypothetical $10,000 investment) | ||||||||
Costs of a $10,000 investment | Costs paid as a percentage of a $10,000 investment | |||||||
| R6 Class | $53 | 0.50% | ||||||
| What were the key factors that affected the fund’s performance? | |||||
Focused Dynamic Growth Fund R6 Class returned 10.96% for the reporting period ended July 31, 2026. | |||||
| The fund seeks long-term capital growth. The commentary below refers to the fund’s performance compared to the Russell 1000 Growth Index. | |||||
• | The communication services sector contributed most to relative results, driven by security selection. The portfolio's holdings in the interactive media and services industry were the main sources of strength. Alphabet, the parent of Google, was the number one overall contributor to the portfolio's results for the period. | ||||
• | Industrials was another area of positive contribution, with stock selection representing by far the most significant driver of relative performance. The choice of holdings in the aerospace and defense area added positively to overall results. An overweight position in launch and space systems provider Rocket Lab was the largest contributor. | ||||
• | Health care was the largest detractor from relative performance, as a result of stock choices. The biotechnology area was the largest detractor within the sector. Alnylam Pharmaceuticals, a biopharmaceutical company focused on RNA interference therapeutics, was a leading source of weakness. | ||||
• | Positioning in the information technology sector also weighed on relative results. It hurt performance to have no exposure to the computers and peripherals industry. The leading relative detractor was a lack of exposure to consumer electronics giant Apple. | ||||
Cumulative Performance (based on an initial $10,000 investment) | ||
December 1, 2016 through July 31, 2026 | ||
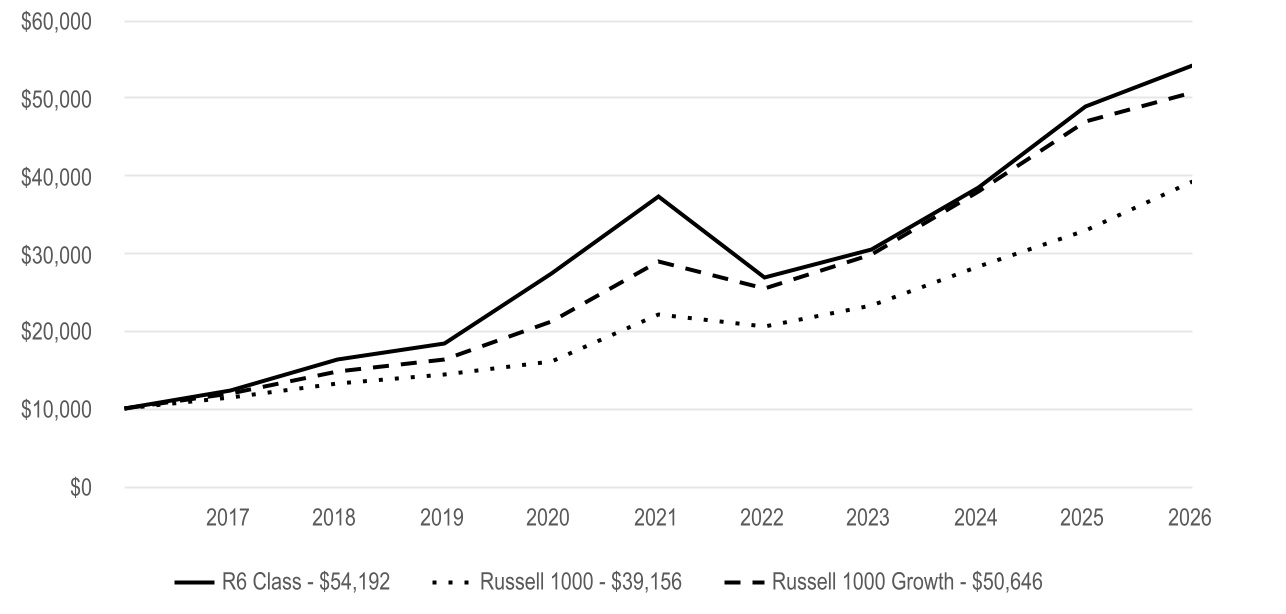
Average Annual Total Returns | ||||||||||||||
| 1 Year | 5 Year | Since Inception | Inception Date | |||||||||||
| R6 Class | 10.96% | 7.76% | 19.10% | 12/1/16 | ||||||||||
| Regulatory Index | ||||||||||||||
| Russell 1000 | 18.94% | 12.12% | 15.16% | — | ||||||||||
| Performance Index | ||||||||||||||
| Russell 1000 Growth | 8.03% | 11.88% | 18.27% | — | ||||||||||
| Fund Holdings | ||
Types of Investments in Portfolio (as a % of net assets) | Top Five Industries (as a % of net assets) | |||||||||||||
| Common Stocks | 99.4% | Semiconductors and Semiconductor Equipment | 27% | |||||||||||
| Short-Term Investments | 0.4% | Interactive Media and Services | 21% | |||||||||||
| Other Assets and Liabilities | 0.2% | Software | 12% | |||||||||||
| Broadline Retail | 8% | |||||||||||||
| Automobiles | 5% | |||||||||||||
What were the fund costs for the last year? (based on a hypothetical $10,000 investment) | ||||||||
Costs of a $10,000 investment | Costs paid as a percentage of a $10,000 investment | |||||||
| G Class | $0 | 0.00% | ||||||
| What were the key factors that affected the fund’s performance? | |||||
Focused Dynamic Growth Fund G Class returned 11.53% for the reporting period ended July 31, 2026. | |||||
| The fund seeks long-term capital growth. The commentary below refers to the fund’s performance compared to the Russell 1000 Growth Index. | |||||
• | The communication services sector contributed most to relative results, driven by security selection. The portfolio's holdings in the interactive media and services industry were the main sources of strength. Alphabet, the parent of Google, was the number one overall contributor to the portfolio's results for the period. | ||||
• | Industrials was another area of positive contribution, with stock selection representing by far the most significant driver of relative performance. The choice of holdings in the aerospace and defense area added positively to overall results. An overweight position in launch and space systems provider Rocket Lab was the largest contributor. | ||||
• | Health care was the largest detractor from relative performance, as a result of stock choices. The biotechnology area was the largest detractor within the sector. Alnylam Pharmaceuticals, a biopharmaceutical company focused on RNA interference therapeutics, was a leading source of weakness. | ||||
• | Positioning in the information technology sector also weighed on relative results. It hurt performance to have no exposure to the computers and peripherals industry. The leading relative detractor was a lack of exposure to consumer electronics giant Apple. | ||||
Cumulative Performance (based on an initial $10,000 investment) | ||
April 1, 2019 through July 31, 2026 | ||
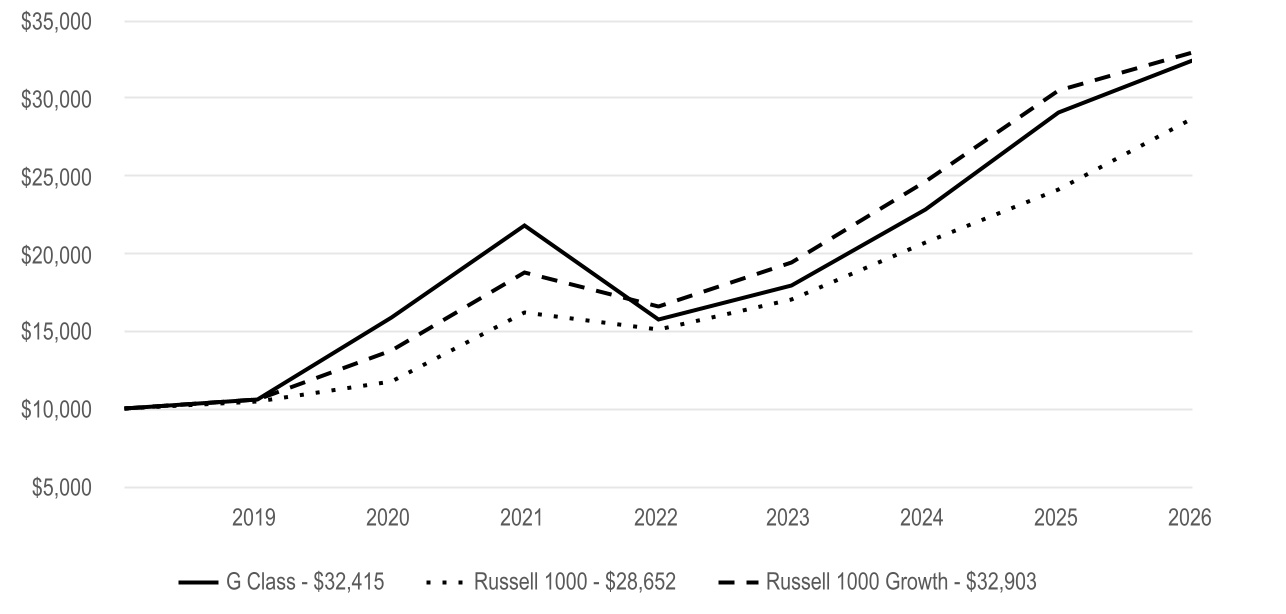
Average Annual Total Returns | ||||||||||||||
| 1 Year | 5 Year | Since Inception | Inception Date | |||||||||||
| G Class | 11.53% | 8.31% | 17.39% | 4/1/19 | ||||||||||
| Regulatory Index | ||||||||||||||
| Russell 1000 | 18.94% | 12.12% | 15.43% | — | ||||||||||
| Performance Index | ||||||||||||||
| Russell 1000 Growth | 8.03% | 11.88% | 17.62% | — | ||||||||||
| Fund Holdings | ||
Types of Investments in Portfolio (as a % of net assets) | Top Five Industries (as a % of net assets) | |||||||||||||
| Common Stocks | 99.4% | Semiconductors and Semiconductor Equipment | 27% | |||||||||||
| Short-Term Investments | 0.4% | Interactive Media and Services | 21% | |||||||||||
| Other Assets and Liabilities | 0.2% | Software | 12% | |||||||||||
| Broadline Retail | 8% | |||||||||||||
| Automobiles | 5% | |||||||||||||