Pay vs Performance Disclosure - USD ($)
Jun. 27, 2026
Jun. 28, 2025
Jun. 29, 2024
Jul. 01, 2023
Jul. 02, 2022
Jul. 02, 2022
Jul. 01, 2023
Jun. 29, 2024
Jun. 28, 2025
Jun. 27, 2026
PAY VERSUS PERFORMANCE
The following table sets forth the relationship between executive compensation actually paid and the financial performance of the Company in accordance with SEC rules. It includes compensation for our Chief Executive Officer, or PEO (Ms. Crevoiserat) and average compensation for our NEOs other than our PEOs, or the non-PEO NEOs. The dollar amounts shown as compensation actually paid (“CAP”) do not reflect the actual amounts realized by our executives during the applicable year.
The financial performance measures used are the Company’s TSR, the peer group TSR (as disclosed under Item 201(e) of Regulation S-K), and the Company’s GAAP Net Income (as reported in our Annual Report on Form 10-K), each of which are required financial performance measures under the SEC rules. The SEC rules also require an issuer to select its most important other financial performance measure that is used to link CAP to the Company’s performance, which is Net Sales, as reflected in the SEC-required table below.
The HR Committee does not use CAP as a basis for making compensation decisions. For a discussion of how our HR Committee seeks to align pay with performance when making compensation decisions, please review the Compensation Discussion and Analysis beginning on page 36 of this Proxy Statement.
| FISCAL YEAR | SUMMARY COMPENSATION TABLE TOTAL FOR MS. CREVOISERAT ($)(1) | COMPENSATION ACTUALLY PAID TO MS. CREVOISERAT(1)(2) | AVERAGE SUMMARY COMPENSATION TABLE TOTAL FOR NON-PEO NEOs(1) | AVERAGE COMPENSATION ACTUALLY PAID TO NON-PEO NEOs(1)(2) | VALUE OF INITIAL FIXED $100 INVESTMENT BASED ON: | NET INCOME (MILLIONS) | NET SALES (MILLIONS) | ||||||||||||||||||||||||||||||||||||||||||||||
TOTAL SHAREHOLDER RETURN(3) | INDEX TOTAL SHAREHOLDER RETURN(3) | ||||||||||||||||||||||||||||||||||||||||||||||||||||
| 2026 | $ | 33,986,485 | $ | 134,521,163 | $ | 5,643,191 | $ | 24,150,906 | $ | 390 | $ | 58 | $ | 1,528 | $ | 8,004 | |||||||||||||||||||||||||||||||||||||
| 2025 | $ | 17,340,349 | $ | 77,657,770 | $ | 5,055,137 | $ | 17,746,944 | $ | 229 | $ | 51 | $ | 183 | $ | 7,011 | |||||||||||||||||||||||||||||||||||||
| 2024 | $ | 15,430,213 | $ | 16,312,370 | $ | 4,565,986 | $ | 4,968,207 | $ | 110 | $ | 51 | $ | 816 | $ | 6,671 | |||||||||||||||||||||||||||||||||||||
| 2023 | $ | 14,489,503 | $ | 21,941,536 | $ | 3,867,451 | $ | 5,632,476 | $ | 106 | $ | 58 | $ | 936 | $ | 6,661 | |||||||||||||||||||||||||||||||||||||
| 2022 | $ | 13,739,426 | $ | 8,274,188 | $ | 4,287,976 | $ | 2,782,806 | $ | 74 | $ | 61 | $ | 856 | $ | 6,685 | |||||||||||||||||||||||||||||||||||||
| FISCAL YEAR | PEO(s) | NON-PEO NEOs | ||||||
| 2026 | Joanne Crevoiserat | Scott Roe, Todd Kahn, David Howard, and Denise Kulikowsky | ||||||
| 2025 | Joanne Crevoiserat | Scott Roe, Todd Kahn, David Howard, and Denise Kulikowsky | ||||||
| 2024 | Joanne Crevoiserat | Scott Roe, Todd Kahn, Liz Fraser, and David Howard | ||||||
| 2023 | Joanne Crevoiserat | Scott Roe, Todd Kahn, Liz Fraser, and David Howard | ||||||
| 2022 | Joanne Crevoiserat | Scott Roe, Todd Kahn, Tom Glaser, and Liz Fraser | ||||||
FY 2026 | ||||||||
PEO – MS. CREVOISERAT | AVG. NON-PEO NEO | |||||||
| Summary Compensation table total for applicable year. | 33,986,485 | 5,643,191 | ||||||
| Deduction for amounts reported under the “Stock Awards” and “Option Awards” columns in the Summary Compensation table for the applicable year. | (26,656,759) | (2,847,923) | ||||||
| Increase based on ASC Topic 718 fair value of Awards granted during applicable year that remain unvested as of applicable year end, determined as of applicable year end. RSU values include RSUs attributable to reinvested dividend equivalents. | 51,020,245 | 4,716,967 | ||||||
| Increase based on ASC 718 Fair Value of Awards granted during Applicable FY that Vested during Applicable FY, determined as of Vesting Date. | — | — | ||||||
FY 2026 | ||||||||
PEO – MS. CREVOISERAT | AVG. NON-PEO NEO | |||||||
| Increase/deduction for Awards granted in prior years that were outstanding and unvested as of applicable year end, determined based on change in ASC Topic 718 fair value from the prior year end to the applicable year end. | 70,150,767 | 15,520,975 | ||||||
| Increase/deduction for Awards granted in prior years that vested during the applicable year, determined based on change in ASC Topic 718 fair value from the prior year end to the vesting date. | 6,020,425 | 1,117,696 | ||||||
| Fair Value at the End of the Prior Year of Equity Awards that Failed to Meet Vesting Conditions in the Year. | — | — | ||||||
| Compensation Actually Paid | 134,521,163 | 24,150,906 | ||||||
FY 2026 | ||||||||
PEO – MS. CREVOISERAT | AVG. NON-PEO NEO | |||||||
| Summary Compensation table total for applicable year. | 33,986,485 | 5,643,191 | ||||||
| Deduction for amounts reported under the “Stock Awards” and “Option Awards” columns in the Summary Compensation table for the applicable year. | (26,656,759) | (2,847,923) | ||||||
| Increase based on ASC Topic 718 fair value of Awards granted during applicable year that remain unvested as of applicable year end, determined as of applicable year end. RSU values include RSUs attributable to reinvested dividend equivalents. | 51,020,245 | 4,716,967 | ||||||
| Increase based on ASC 718 Fair Value of Awards granted during Applicable FY that Vested during Applicable FY, determined as of Vesting Date. | — | — | ||||||
FY 2026 | ||||||||
PEO – MS. CREVOISERAT | AVG. NON-PEO NEO | |||||||
| Increase/deduction for Awards granted in prior years that were outstanding and unvested as of applicable year end, determined based on change in ASC Topic 718 fair value from the prior year end to the applicable year end. | 70,150,767 | 15,520,975 | ||||||
| Increase/deduction for Awards granted in prior years that vested during the applicable year, determined based on change in ASC Topic 718 fair value from the prior year end to the vesting date. | 6,020,425 | 1,117,696 | ||||||
| Fair Value at the End of the Prior Year of Equity Awards that Failed to Meet Vesting Conditions in the Year. | — | — | ||||||
| Compensation Actually Paid | 134,521,163 | 24,150,906 | ||||||
The chart below provides a comparison between (i) the TSR of Tapestry and of the S&P Composite 1500 Apparel, Accessories & Luxury Goods Index assuming a fixed $100 initial investment on July 3, 2021 and reinvestment of dividends, and (ii) the compensation actually paid to our PEOs and the average compensation actually paid to our non-PEO NEOs for the fiscal years 2022, 2023, 2024, 2025, and 2026.
Because our TSR outperformed the TSR of our industry index, and because LTI are the most significant element of pay for our PEO and our other NEOs, compensation actually paid is substantially higher than amounts reported in the Summary Compensation Table on a cumulative basis for fiscal years 2022, 2023, 2024, 2025, and 2026. While we are extremely pleased with our strong absolute and relative TSR performance over the last five years, we realize that there is no guarantee that our executives will actually realize the amounts reported below as compensation actually paid.
COMPANY TSR AND S&P COMPOSITE 1500 APPAREL, ACCESSORIES & LUXURY GOODS INDEX TSR VS. COMPENSATION ACTUALLY PAID
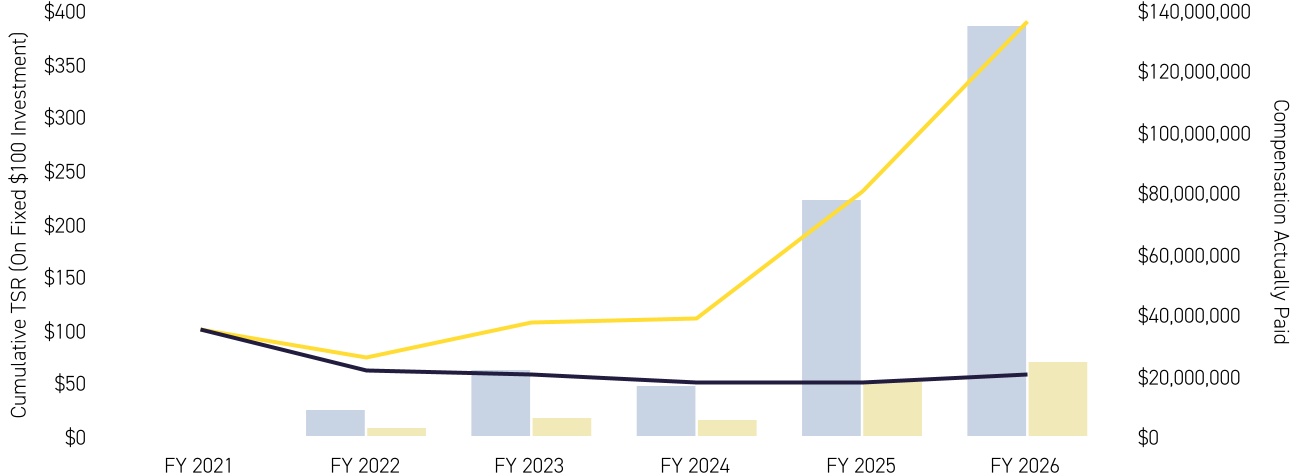
l | Tapestry TSR | l | S&P Composite 1500 Apparel, Accessories & Luxury Goods Index | l | PEO Compensation Actually Paid - Crevoiserat | l | Avg non-PEO NEO Compensation Actually Paid | |||||||||||||||||||||||||
FY 2021 | FY 2022 | FY 2023 | FY 2024 | FY 2025 | FY 2026 | |||||||||||||||||||||||||||||||||
| Tapestry TSR | $ | 100 | $ | 74.12 | $ | 106.16 | $ | 110.13 | $ | 229.45 | $ | 389.55 | ||||||||||||||||||||||||||
| S&P Composite 1500 Apparel, Accessories & Luxury Goods Index | $ | 100 | $ | 61.23 | $ | 57.68 | $ | 50.58 | $ | 50.53 | $ | 57.50 | ||||||||||||||||||||||||||
PEO Compensation Actually Paid - Crevoiserat | $ | 8,274,188 | $ | 21,941,536 | $ | 16,312,370 | $ | 77,657,770 | $ | 134,521,163 | ||||||||||||||||||||||||||||
| Avg non-PEO NEO Compensation Actually Paid | $ | 2,782,806 | $ | 5,632,476 | $ | 4,968,207 | $ | 17,746,944 | $ | 24,150,906 | ||||||||||||||||||||||||||||
The chart below provides a comparison between (i) Tapestry’s Net Income and (ii) compensation actually paid to our PEOs and average compensation actually paid to our non-PEO NEOs for the fiscal years 2022, 2023, 2024, 2025, and 2026
NET INCOME VS. COMPENSATION ACTUALLY PAID
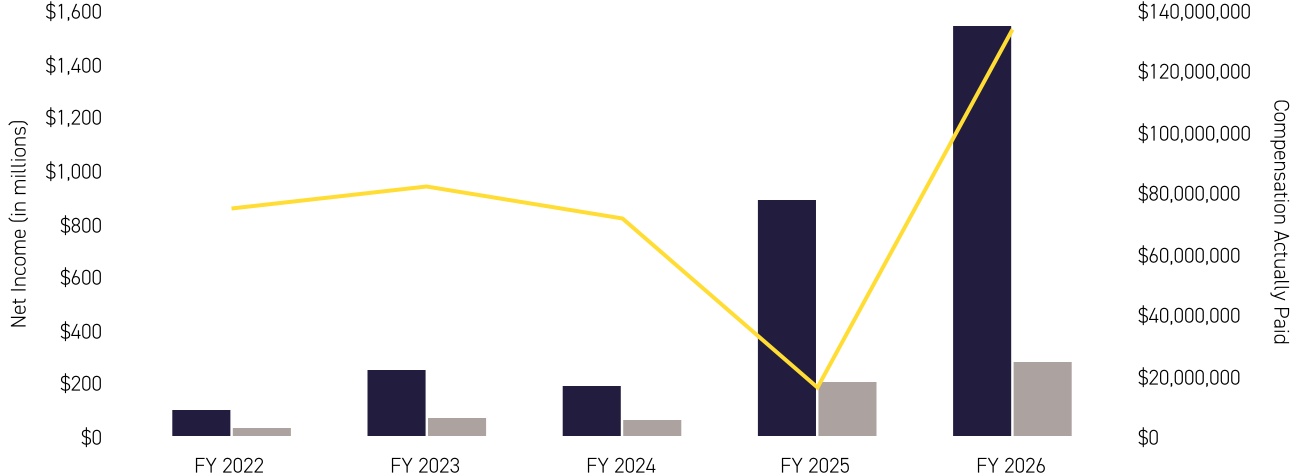
l | Net Income (in millions) | l | PEO Compensation Actually Paid - Crevoiserat | l | Avg non-PEO NEO Compensation Actually Paid | ||||||||||||||||||
FY 2022 | FY 2023 | FY 2024 | FY 2025 | FY 2026 | ||||||||||||||||||||||||||||
| Net Income (in millions) | $ | 856 | $ | 936 | $ | 816 | $ | 183 | $ | 1,528 | ||||||||||||||||||||||
PEO Compensation Actually Paid - Crevoiserat | $ | 8,274,188 | $ | 21,941,536 | $ | 16,312,370 | $ | 77,657,770 | $ | 134,521,163 | ||||||||||||||||||||||
| Avg non-PEO NEO Compensation Actually Paid | $ | 2,782,806 | $ | 5,632,476 | $ | 4,968,207 | $ | 17,746,944 | $ | 24,150,906 | ||||||||||||||||||||||
The chart below provides a comparison between (i) Tapestry’s Net Sales and (ii) compensation actually paid to our PEOs and average compensation actually paid to our non-PEO NEOs for the fiscal years 2022, 2023, 2024, 2025, and 2026.
NET SALES VS. COMPENSATION ACTUALLY PAID
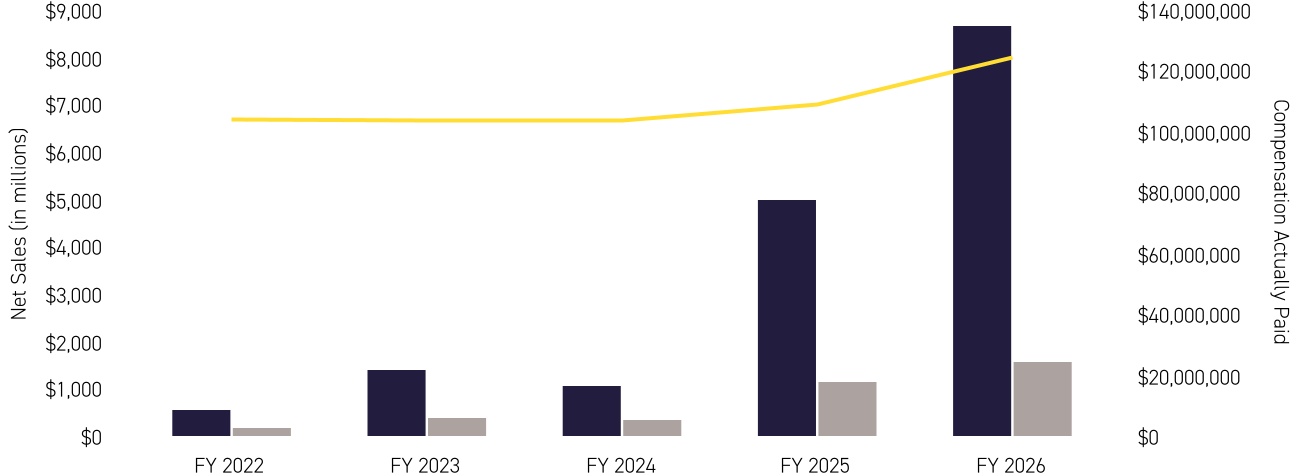
l | Net Sales (in millions) | l | PEO Compensation Actually Paid - Crevoiserat | l | Avg non-PEO NEO Compensation Actually Paid | ||||||||||||||||||
| FY 2022 | FY 2023 | FY 2024 | FY 2025 | FY 2026 | ||||||||||||||||||||||||||||
| Net Sales (in millions) | $ | 6,685 | $ | 6,661 | $ | 6,671 | $ | 7,011 | $ | 8,004 | ||||||||||||||||||||||
PEO Compensation Actually Paid - Crevoiserat | $ | 8,274,188 | $ | 21,941,536 | $ | 16,312,370 | $ | 77,657,770 | $ | 134,521,163 | ||||||||||||||||||||||
| Avg non-PEO NEO Compensation Actually Paid | $ | 2,782,806 | $ | 5,632,476 | $ | 4,968,207 | $ | 17,746,944 | $ | 24,150,906 | ||||||||||||||||||||||
PERFORMANCE MEASURES
The following performance measures are the most important used by the Company to link executive compensation actually paid to the NEOs to company performance during fiscal year 2026.
| COMPANY-SELECTED PERFORMANCE MEASURES | ||
| Net Sales | ||
| Operating Income | ||
| Gross Margin | ||
| Return on Invested Capital | ||
| Relative Total Shareholder Return | ||