The bar chart and performance table below show the variability of the Fund’s returns, which is some indication of the risks of investing in the Fund. The bar chart shows performance of the Fund’s shares for each calendar year since the Fund’s inception. The performance table compares the performance of the Fund over time to the performance of a broad-based securities market index and a supplemental index. You should be aware that the Fund’s past performance (before and after taxes) is not necessarily an indication of how the Fund will perform in the future. Updated performance information is available at no cost by visiting www.brookstoneam.com or by calling toll-free 888-562-8880.
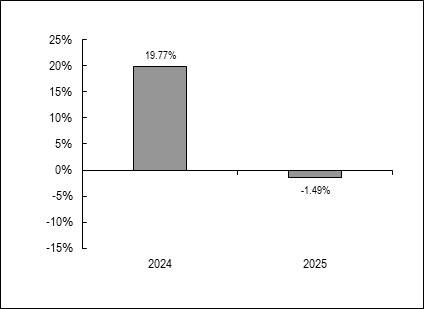
| Best Quarter: | 3rd Quarter 2024 | 14.74% |
| Worst Quarter: | 2nd Quarter 2025 | (3.34)% |
The Fund’s year-to-date return as of the most recent calendar quarter, which ended June 30, 2026 was 10.34%.
| One Year | Since Inception (9/27/23) | |
| Return before taxes | (1.49%) | 12.62% |
| Return after taxes on distributions | (2.97%) | 11.23% |
| Return after taxes on distributions and sale of Fund shares | (0.86%) | 9.35% |
| S&P 500® Index* | 17.88% | 24.85% |
| Dow Jones US Select Dividend Index** | 12.12% | 17.65% |
| * | The S&P 500® Index is an unmanaged free-float capitalization-weighted index which measures the performance of 500 large-cap common stocks actively traded in the United States. Index returns assume reinvestment of dividends. Investors may not invest in the index directly; unlike the Fund’s returns, the index does not reflect any fees or expenses. |
| ** | The Dow Jones US Select Dividend Index is one hundred stocks that are selected to the index by dividend yield, subject to screens for dividend-per-share growth rate, dividend payout ratio and average daily dollar trading volume. Components are weighted by indicated annual dividend. Investors may not invest in the index directly; unlike the Fund’s returns, the index does not reflect any fees or expenses. |
After-tax returns are calculated using the historical highest individual federal marginal income tax rates and do not reflect the impact of state and local taxes. Actual after-tax returns depend on an investor’s tax situation and may differ from those shown, and after-tax returns shown are not relevant to investors who hold their Shares through tax-deferred arrangements, such as 401(k) plans or individual retirement accounts.
The bar chart and performance table below show the variability of the Fund’s returns, which is some indication of the risks of investing in the Fund. The bar chart shows performance of the Fund’s shares for each calendar year since the Fund’s inception. The performance table compares the performance of the Fund over time to the performance of a broad-based securities market index and a supplemental index. You should be aware that the Fund’s past performance (before and after taxes) is not necessarily an indication of how the Fund will perform in the future. Updated performance information is available at no cost by visiting www.brookstoneam.com or by calling toll-free 888-562-8880.
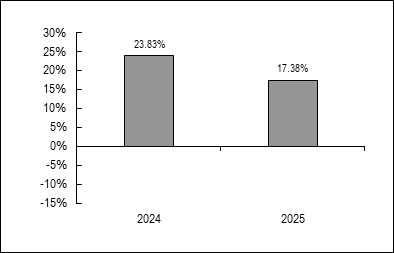
| Best Quarter: | 2nd Quarter 2025 | 13.63% |
| Worst Quarter: | 1st Quarter 2025 | (6.80%) |
The Fund’s year-to-date return as of the most recent calendar quarter, which ended June 30, 2026 was 12.76%.
| One Year | Since Inception (9/26/23) | |
| Return before taxes | 17.38% | 24.07% |
| Return after taxes on distributions | 17.38% | 23.80% |
| Return after taxes on distributions and sale of Fund shares | 10.29% | 18.77% |
| S&P 500® Growth Index* | 22.23% | 30.95% |
| Dow Jones Industrial Average** | 14.92% | 19.25% |
| * | The S&P 500® Growth Index measures constituents from the S&P 500 that are classified as growth stocks based on three factors: sales growth, the ratio of earnings change to price, and momentum. Investors may not invest in the index directly; unlike the Fund’s returns, the index does not reflect any fees or expenses. |
| ** | The Dow Jones Industrial Average is a stock market index of 30 prominent companies listed on stock exchanges in the United States. Investors may not invest in the index directly; unlike the Fund’s returns, the index does not reflect any fees or expenses. |
After-tax returns are calculated using the historical highest individual federal marginal income tax rates and do not reflect the impact of state and local taxes. Actual after-tax returns depend on an investor’s tax situation and may differ from those shown, and after-tax returns shown are not relevant to investors who hold their Shares through tax-deferred arrangements, such as 401(k) plans or individual retirement accounts.
The bar chart and performance table below show the variability of the Fund’s returns, which is some indication of the risks of investing in the Fund. The bar chart shows performance of the Fund’s shares for each calendar year since the Fund’s inception. The performance table compares the performance of the Fund over time to the performance of a broad-based securities market index and a supplemental index. You should be aware that the Fund’s past performance (before and after taxes) is not necessarily an indication of how the Fund will perform in the future. Updated performance information is available at no cost by visiting www.brookstoneam.com or by calling toll-free 888-562-8880.
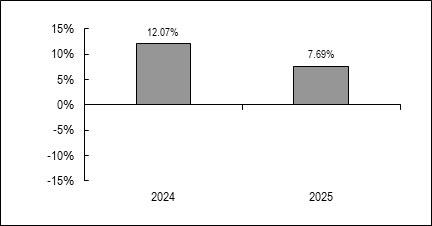
| Best Quarter: | 3rd Quarter 2024 | 8.83% |
| Worst Quarter: | 2nd Quarter 2024 | (3.49)% |
The Fund’s year-to-date return as of the most recent calendar quarter, which ended June 30, 2026 was 9.07%.
| One Year | Since Inception (9/26/23) | |
| Return before taxes | 7.69% | 14.74% |
| Return after taxes on distributions | 7.11% | 13.75% |
| Return after taxes on distributions and sale of Fund shares | 4.55% | 11.04% |
| S&P 500® Value Index* | 13.19% | 17.71% |
| Dow Jones Industrial Average** | 14.92% | 19.25% |
| * | The S&P 500® Value Index measures constituents from the S&P 500 Index that are classified as value stocks based on three factors: the ratios of book value, earnings and sales to price. Investors may not invest in the index directly; unlike the Fund’s returns, the index does not reflect any fees or expenses. |
| ** | The Dow Jones Industrial Average is a stock market index of 30 prominent companies listed on stock exchanges in the United States. Investors may not invest in the index directly; unlike the Fund’s returns, the index does not reflect any fees or expenses. |
After-tax returns are calculated using the historical highest individual federal marginal income tax rates and do not reflect the impact of state and local taxes. Actual after-tax returns depend on an investor’s tax situation and may differ from those shown, and after-tax returns shown are not relevant to investors who hold their Shares through tax-deferred arrangements, such as 401(k) plans or individual retirement accounts.
The bar chart and performance table below show the variability of the Fund’s returns, which is some indication of the risks of investing in the Fund. The bar chart shows performance of the Fund’s shares for each calendar year since the Fund’s inception. The performance table compares the performance of the Fund over time to the performance of a broad-based securities market index. You should be aware that the Fund’s past performance (before and after taxes) is not necessarily an indication of how the Fund will perform in the future. Updated performance information will be available at no cost by visiting www.brookstoneam.com or by calling toll-free 888-562-8880.
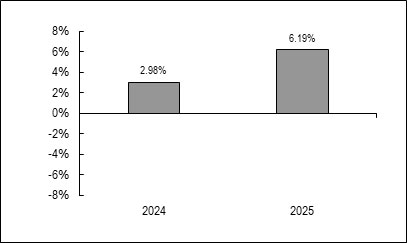
| Best Quarter: | rd Quarter 2024 | 4.41% |
| Worst Quarter: | 4th Quarter 2024 | (2.86)% |
The Fund’s year-to-date return as of the most recent calendar quarter, which ended June 30, 2026 was (0.51)%.
| One Year | Since Inception (9/26/23) | |
| Return before taxes | 6.19% | 5.34% |
| Return after taxes on distributions | 4.96% | 4.13% |
| Return after taxes on distributions and sale of Fund shares | 3.65% | 3.57% |
| Bloomberg U.S. Aggregate Bond Index* | 7.30% | 6.72% |
| * | The Bloomberg U.S. Aggregate Bond Index is a broad-based, market capitalization-weighted bond market index representing intermediate term investment grade bonds traded in the United States. Investors may not invest in the index directly; unlike the Fund’s returns, the index does not reflect any fees or expenses. |
After-tax returns are calculated using the historical highest individual federal marginal income tax rates and do not reflect the impact of state and local taxes. Actual after-tax returns depend on an investor’s tax situation and may differ from those shown, and after-tax returns shown are not relevant to investors who hold their Shares through tax-deferred arrangements, such as 401(k) plans or individual retirement accounts.
The bar chart and performance table below show the variability of the Fund’s returns, which is some indication of the risks of investing in the Fund. The bar chart shows performance of the Fund’s shares for each calendar year since the Fund’s inception. The performance table compares the performance of the Fund over time to the performance of a broad-based securities market index and a supplemental index. You should be aware that the Fund’s past performance (before and after taxes) is not necessarily an indication of how the Fund will perform in the future. Updated performance information will be available at no cost by visiting www.brookstoneam.com or by calling toll-free 888-562-8880.
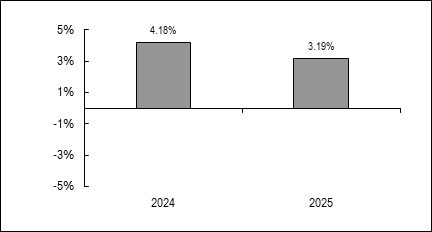
| Best Quarter: | 3rd Quarter 2024 | 1.18% |
| Worst Quarter: | 4th Quarter 2025 | 0.75% |
The Fund’s year-to-date return as of the most recent calendar quarter, which ended June 30, 2026 was 1.24%.
| One Year | Since Inception (9/26/23) | |
| Return before taxes | 3.19% | 3.83% |
| Return after taxes on distributions | 1.86% | 2.36% |
| Return after taxes on distributions and sale of Fund shares | 1.88% | 2.30% |
| Bloomberg U.S. Treasury Bills: 1-3 Months Index* | 4.29% | 4.89% |
| Bloomberg U.S. Aggregate Bond Index** | 7.30% | 6.72% |
| * | The Bloomberg U.S. Treasury Bills: 1-3 Months Index tracks the market for treasury bills issued by the U.S. government with time to maturity between 1 and 3 months. US Treasury bills are issued in fixed maturity terms of 4, 8, 13, 17, 26 and 52 weeks. The Bloomberg U.S. Treasury Bills: 1-3 Months Index is a component of the U.S. Short Treasury Index. Investors may not invest in the index directly; unlike the Fund’s returns, the index does not reflect any fees or expenses. |
| ** | The Bloomberg U.S. Aggregate Bond Index is a broad-based, market capitalization-weighted bond market index representing intermediate term investment grade bonds traded in the United States. Investors may not invest in the index directly; unlike the Fund’s returns, the index does not reflect any fees or expenses. |
After-tax returns are calculated using the historical highest individual federal marginal income tax rates and do not reflect the impact of state and local taxes. Actual after-tax returns depend on an investor’s tax situation and may differ from those shown, and after-tax returns shown are not relevant to investors who hold their Shares through tax-deferred arrangements, such as 401(k) plans or individual retirement accounts.
The bar chart and performance table below show the variability of the Fund’s returns, which is some indication of the risks of investing in the Fund. The bar chart shows performance of the Fund’s shares for each calendar year since the Fund’s inception. The performance table compares the performance of the Fund over time to the performance of a broad-based securities market index and supplemental indices. You should be aware that the Fund’s past performance (before and after taxes) is not necessarily an indication of how the Fund will perform in the future. Updated performance information will be available at no cost by visiting www.brookstoneam.com or by calling toll-free 888-562-8880.
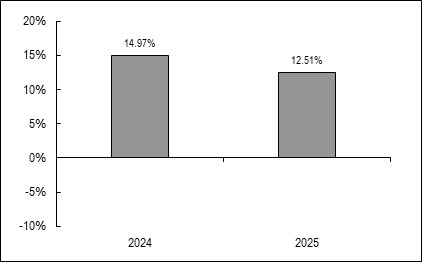
| Best Quarter: | 2nd Quarter 2025 | 7.26% |
| Worst Quarter: | 1st Quarter 2025 | (2.48%) |
The Fund’s year-to-date return as of the most recent calendar quarter, which ended June 30, 2026 was 8.15%.
| One Year | Since Inception (9/27/23) | |
| Return before taxes | 12.51% | 16.20% |
| Return after taxes on distributions | 11.93% | 15.59% |
| Return after taxes on distributions and sale of Fund shares | 7.53% | 12.40% |
| Dow Jones Moderate Portfolio Index* | 13.82% | 14.35% |
| S&P 500® Index** | 17.88% | 24.85% |
| Bloomberg U.S. Aggregate Bond Index*** | 7.30% | 6.91% |
| * | The Dow Jones Moderate Portfolio Index is a member of the Dow Jones Relative Risk Index Series and is designed to measure a total portfolio of U.S. stocks, bonds, and cash, allocated to represent an investor’s desired risk profile. The Dow Jones Moderate U.S. Portfolio Index risk level is set to 60% of the Dow Jones U.S. Stock CMAC Index’s downside risk (past 36 months). Investors may not invest in the index directly; unlike the Fund’s returns, the index does not reflect any fees or expenses. |
| ** | The S&P 500® Index is an unmanaged free-float capitalization-weighted index which measures the performance of 500 large-cap common stocks actively traded in the United States. Index returns assume reinvestment of dividends. Investors may not invest in the index directly; unlike the Fund’s returns, the index does not reflect any fees or expenses. |
| *** | The Bloomberg U.S. Aggregate Bond Index, is a broad-based, market capitalization-weighted bond market index representing intermediate term investment grade bonds traded in the United States. |
After-tax returns are calculated using the historical highest individual federal marginal income tax rates and do not reflect the impact of state and local taxes. Actual after-tax returns depend on an investor’s tax situation and may differ from those shown, and after-tax returns shown are not relevant to investors who hold their Shares through tax-deferred arrangements, such as 401(k) plans or individual retirement accounts.
The bar chart and performance table below show the variability of the Fund’s returns, which is some indication of the risks of investing in the Fund. The bar chart shows performance of the Fund’s shares for each calendar year since the Fund’s inception. The performance table compares the performance of the Fund over time to the performance of a broad-based securities market index and a supplemental index. You should be aware that the Fund’s past performance (before and after taxes) is not necessarily an indication of how the Fund will perform in the future. Updated performance information will be available at no cost by visiting www.brookstoneam.com or by calling toll-free 888-562-8880.
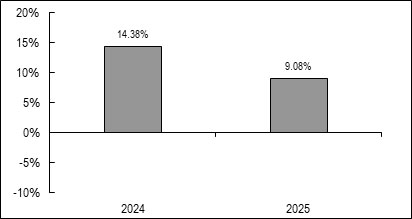
| Best Quarter: | 2nd Quarter 2025 | 6.23% |
| Worst Quarter: | 1st Quarter 2025 | (2.90%) |
The Fund’s year-to-date return as of the most recent calendar quarter, which ended June 30, 2026 was 6.22%.
| One Year | Since Inception (9/27/23) | |
| Return before taxes | 9.08% | 14.22% |
| Return after taxes on distributions | 8.39% | 13.53% |
| Return after taxes on distributions and sale of Fund shares | 5.37% | 10.76% |
| Dow Jones Moderate Portfolio Index* | 13.82% | 14.35% |
| S&P 500® Index** | 17.88% | 24.85% |
| * | The Dow Jones Moderate Portfolio Index is a member of the Dow Jones Relative Risk Index Series and is designed to measure a total portfolio of U.S. stocks, bonds, and cash, allocated to represent an investor’s desired risk profile. The Dow Jones Moderate U.S. Portfolio Index risk level is set to 60% of the Dow Jones U.S. Stock CMAC Index’s downside risk (past 36 months). Investors may not invest in the index directly; unlike the Fund’s returns, the index does not reflect any fees or expenses. |
| ** | The S&P 500® Index is an unmanaged free-float capitalization-weighted index which measures the performance of 500 large-cap common stocks actively traded in the United States. Index returns assume reinvestment of dividends. Investors may not invest in the index directly; unlike the Fund’s returns, the index does not reflect any fees or expenses. |
After-tax returns are calculated using the historical highest individual federal marginal income tax rates and do not reflect the impact of state and local taxes. Actual after-tax returns depend on an investor’s tax situation and may differ from those shown, and after-tax returns shown are not relevant to investors who hold their Shares through tax-deferred arrangements, such as 401(k) plans or individual retirement accounts.
The bar chart and performance table below show the variability of the Fund’s returns, which is some indication of the risks of investing in the Fund. The bar chart shows performance of the Fund’s shares for each calendar year since the Fund’s inception. The performance table compares the performance of the Fund over time to the performance of a broad-based securities market index and a supplemental index. You should be aware that the Fund’s past performance (before and after taxes) is not necessarily an indication of how the Fund will perform in the future. Updated performance information will be available at no cost by visiting www.brookstoneam.com or by calling toll-free 888-562-8880.
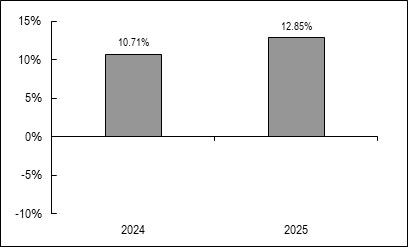
| Best Quarter: | 2nd Quarter 2025 | 5.40% |
| Worst Quarter: | 1st Quarter 2025 | (0.15)% |
The Fund’s year-to-date return as of the most recent calendar quarter, which ended June 30, 2026 was 1.58%.
| One Year | Since Inception (9/27/23) | |
| Return before taxes | 12.85% | 13.13% |
| Return after taxes on distributions | 9.75% | 9.74% |
| Return after taxes on distributions and sale of Fund shares | 7.69% | 8.64% |
| Bloomberg U.S. Aggregate Bond Index* | 7.30% | 6.91% |
| Bloomberg U.S. Corporate High Yield Index** | 8.62% | 10.85% |
| * | The Bloomberg U.S. Aggregate Bond Index is a broad-based, market capitalization-weighted bond market index representing intermediate term investment grade bonds traded in the United States. Investors may not invest in the index directly; unlike the Fund’s returns, the index does not reflect any fees or expenses. |
| ** | The Bloomberg U.S. Corporate High Yield Index measures the USD-denominated, high yield, fixed-rate corporate bond market. Securities are classified as high yield if the middle rating of Moody’s, Fitch and S&P is Ba1/BB+/BB+ or below. Bonds from issuers with an emerging markets country of risk, based on the indices’ EM country definition, are excluded. The Bloomberg U.S Corporate High Yield Index is a component of the U.S. Universal and Global High Yield Indices. Investors may not invest in the index directly; unlike the Fund’s returns, the index does not reflect any fees or expenses. |
After-tax returns are calculated using the historical highest individual federal marginal income tax rates and do not reflect the impact of state and local taxes. Actual after-tax returns depend on an investor’s tax situation and may differ from those shown, and after-tax returns shown are not relevant to investors who hold their Shares through tax-deferred arrangements, such as 401(k) plans or individual retirement accounts.