Shareholder Report
Jul. 31, 2026
USD ($)
$ / shares
WHAT WERE THE FUND COSTS FOR THE LAST YEAR? (based on a hypothetical $10,000 investment)
|
Class Name
|
Costs of a $10,000 investment
|
Costs paid as a percentage of a $10,000 investment*
|
|
Class A
|
$98
|
0.95%
|
HOW DID THE FUND PERFORM LAST YEAR AND WHAT AFFECTED ITS PERFORMANCE?
For the twelve months ended July 31, 2026, Class A shares of Western Asset Short Duration High Income Fund returned 5.46%. The Fund compares its performance to the Bloomberg U.S. High Yield 1-5 Year Cash Pay 2% Constrained Index, which returned 4.96% for the same period.
PERFORMANCE HIGHLIGHTS
|
Top contributors to performance:
|
|
|
↑
|
Issuer selection within multiple sectors, including technology, transportation and communications.
|
|
↑
|
Opportunistic allocation to structured products.
|
|
↑
|
Opportunistic allocation to emerging markets.
|
|
Top detractors from performance:
|
|
|
↓
|
Industry allocation, driven mainly by an overweight to transportation and an underweight to energy.
|
|
↓
|
Quality positioning contributed to relative performance, but the effect of credit derivatives resulted in an overall negative contribution during the reporting period.
|
|
↓
|
Issuer selection within multiple sectors, including real estate investment trusts (REITs), basic industry and banking.
|
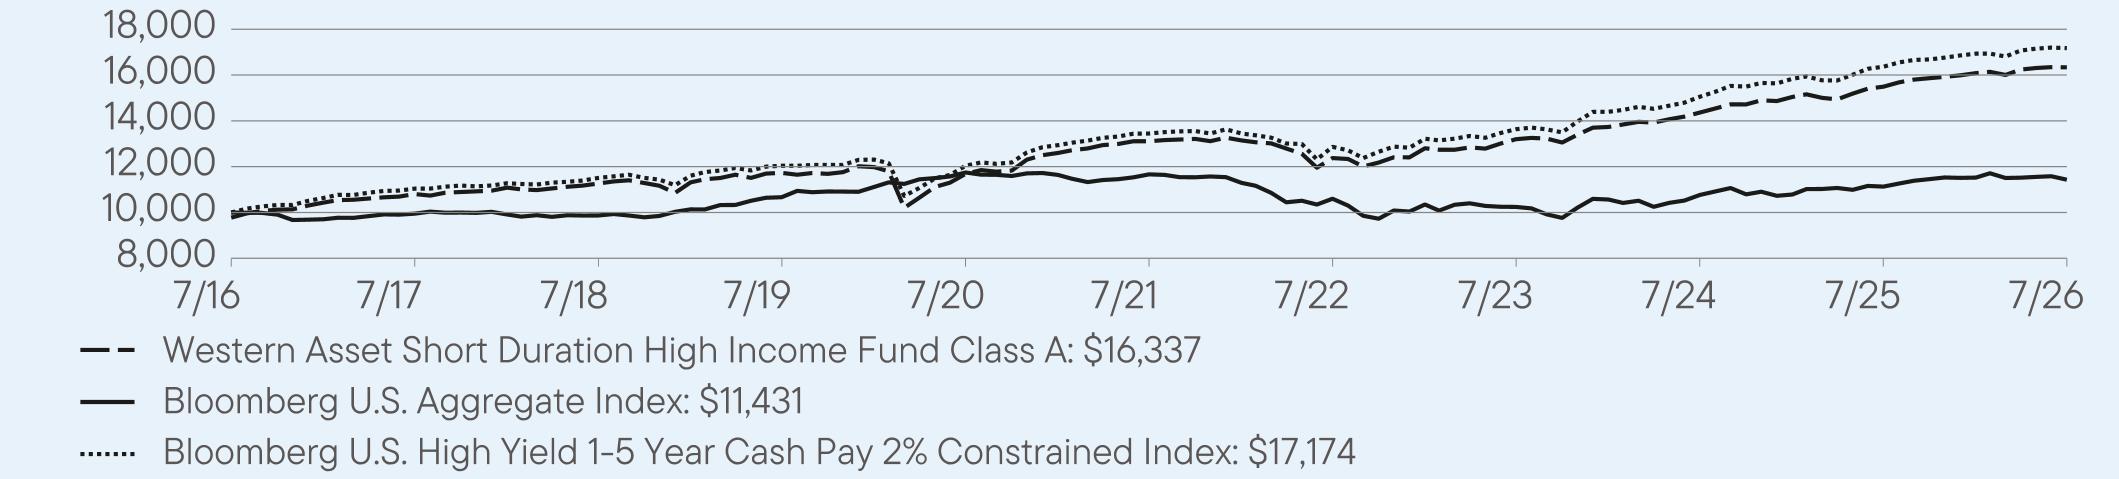
AVERAGE ANNUAL TOTAL RETURNS (%) Period Ended July 31, 2026
|
|
1 Year
|
5 Year
|
10 Year
|
|
Class A
|
5.46
|
4.50
|
5.27
|
|
Class A (with sales charge)
|
3.11
|
4.04
|
5.03
|
|
Bloomberg U.S. Aggregate Index
|
2.71
|
-0.40
|
1.35
|
|
Bloomberg U.S. High Yield 1-5 Year Cash Pay 2% Constrained Index
|
4.96
|
5.02
|
5.56
|
For current month-end performance, please call Franklin Templeton at 877-6LM-FUND/656-3863 or visit
https://www.franklintempleton.com/investments/options/mutual-funds.
https://www.franklintempleton.com/investments/options/mutual-funds.
Important data provider notices and terms available at www.franklintempletondatasources.com.
KEY FUND STATISTICS (as of July 31, 2026)
|
Total Net Assets
|
$581,787,132
|
|
Total Number of Portfolio Holdings (excludes derivatives, except purchased options, if any)
|
411
|
|
Total Management Fee Paid
|
$2,967,308
|
|
Portfolio Turnover Rate
|
61%
|
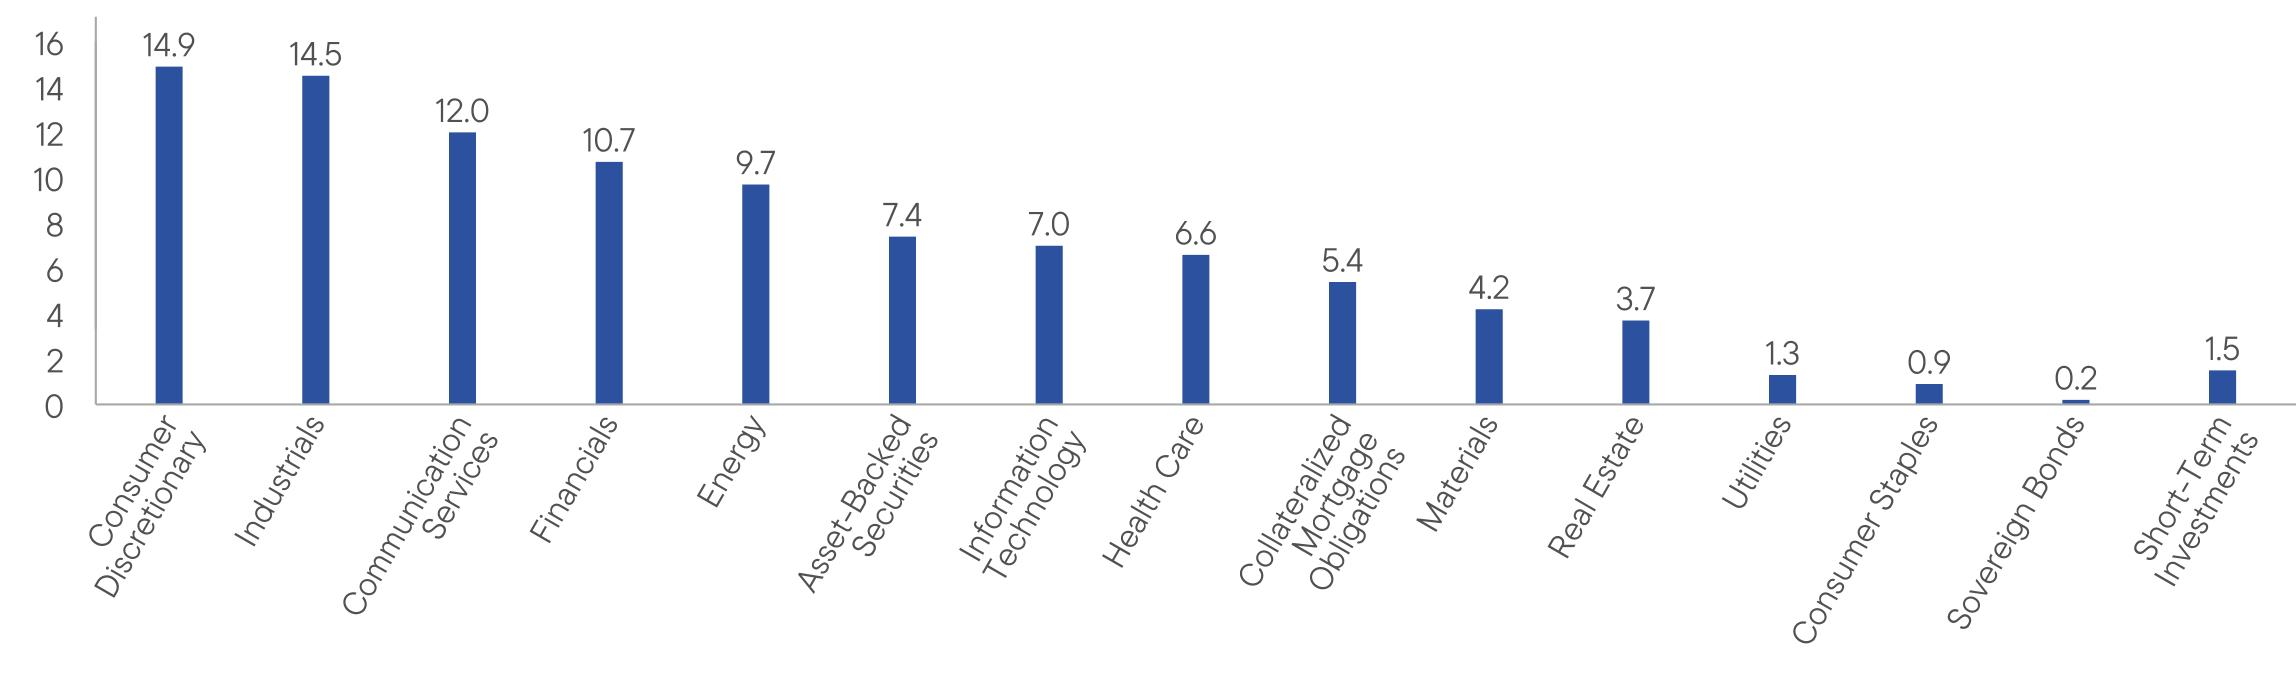
WHAT DID THE FUND INVEST IN? (as of July 31, 2026)
Portfolio Composition* (% of Total Investments)
WHAT WERE THE FUND COSTS FOR THE LAST YEAR? (based on a hypothetical $10,000 investment)
|
Class Name
|
Costs of a $10,000 investment
|
Costs paid as a percentage of a $10,000 investment*
|
|
Class C
|
$169
|
1.65%
|
HOW DID THE FUND PERFORM LAST YEAR AND WHAT AFFECTED ITS PERFORMANCE?
For the twelve months ended July 31, 2026, Class C shares of Western Asset Short Duration High Income Fund returned 4.51%. The Fund compares its performance to the Bloomberg U.S. High Yield 1-5 Year Cash Pay 2% Constrained Index, which returned 4.96% for the same period.
PERFORMANCE HIGHLIGHTS
|
Top contributors to performance:
|
|
|
↑
|
Issuer selection within multiple sectors, including technology, transportation and communications.
|
|
↑
|
Opportunistic allocation to structured products.
|
|
↑
|
Opportunistic allocation to emerging markets.
|
|
Top detractors from performance:
|
|
|
↓
|
Industry allocation, driven mainly by an overweight to transportation and an underweight to energy.
|
|
↓
|
Quality positioning contributed to relative performance, but the effect of credit derivatives resulted in an overall negative contribution during the reporting period.
|
|
↓
|
Issuer selection within multiple sectors, including real estate investment trusts (REITs), basic industry and banking.
|
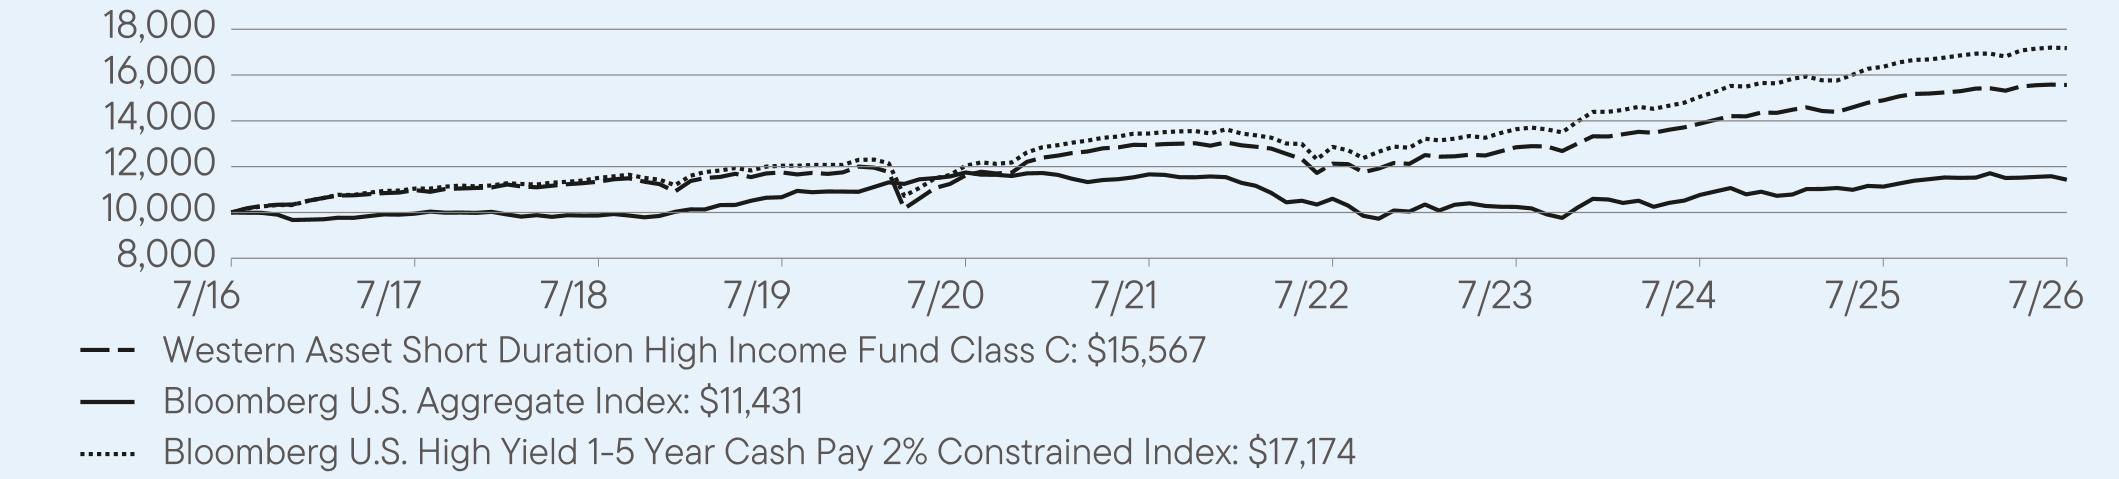
AVERAGE ANNUAL TOTAL RETURNS (%) Period Ended July 31, 2026
|
|
1 Year
|
5 Year
|
10 Year
|
|
Class C
|
4.51
|
3.76
|
4.53
|
|
Class C (with sales charge)
|
3.53
|
3.76
|
4.53
|
|
Bloomberg U.S. Aggregate Index
|
2.71
|
-0.40
|
1.35
|
|
Bloomberg U.S. High Yield 1-5 Year Cash Pay 2% Constrained Index
|
4.96
|
5.02
|
5.56
|
For current month-end performance, please call Franklin Templeton at 877-6LM-FUND/656-3863 or visit
https://www.franklintempleton.com/investments/options/mutual-funds.
https://www.franklintempleton.com/investments/options/mutual-funds.
Important data provider notices and terms available at www.franklintempletondatasources.com.
KEY FUND STATISTICS (as of July 31, 2026)
|
Total Net Assets
|
$581,787,132
|
|
Total Number of Portfolio Holdings (excludes derivatives, except purchased options, if any)
|
411
|
|
Total Management Fee Paid
|
$2,967,308
|
|
Portfolio Turnover Rate
|
61%
|
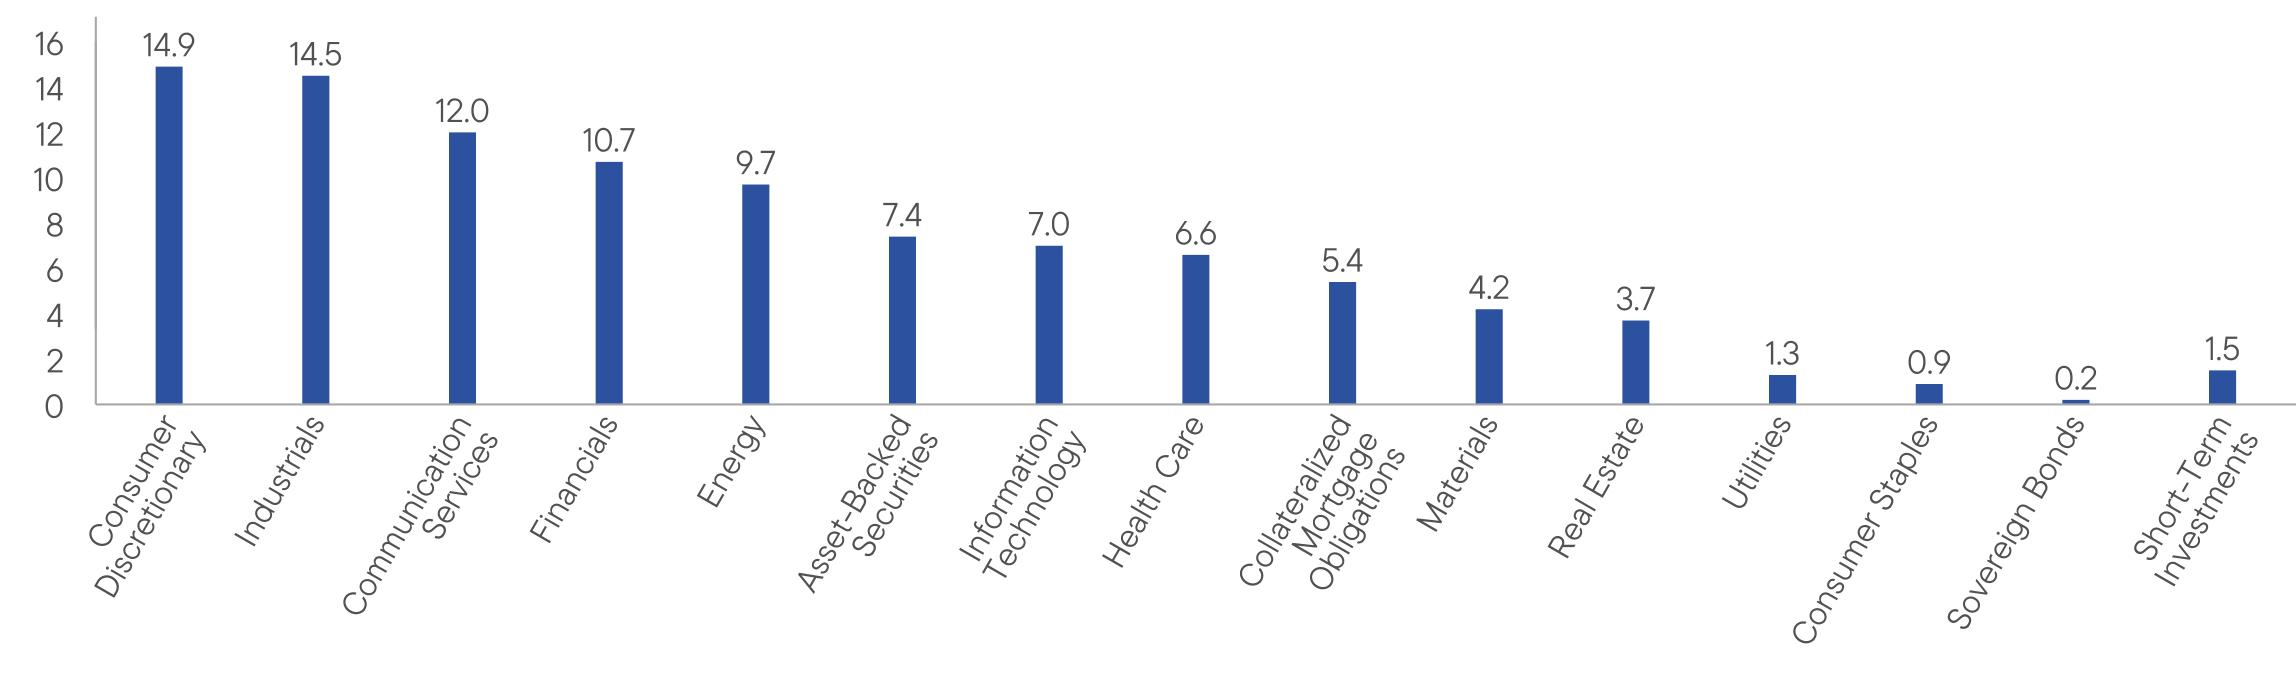
WHAT DID THE FUND INVEST IN? (as of July 31, 2026)
Portfolio Composition* (% of Total Investments)
WHAT WERE THE FUND COSTS FOR THE LAST YEAR? (based on a hypothetical $10,000 investment)
|
Class Name
|
Costs of a $10,000 investment
|
Costs paid as a percentage of a $10,000 investment*
|
|
Class C1
|
$169
|
1.65%
|
HOW DID THE FUND PERFORM LAST YEAR AND WHAT AFFECTED ITS PERFORMANCE?
For the twelve months ended July 31, 2026, Class C1 shares of Western Asset Short Duration High Income Fund returned 4.51%. The Fund compares its performance to the Bloomberg U.S. High Yield 1-5 Year Cash Pay 2% Constrained Index, which returned 4.96% for the same period.
PERFORMANCE HIGHLIGHTS
|
Top contributors to performance:
|
|
|
↑
|
Issuer selection within multiple sectors, including technology, transportation and communications.
|
|
↑
|
Opportunistic allocation to structured products.
|
|
↑
|
Opportunistic allocation to emerging markets.
|
|
Top detractors from performance:
|
|
|
↓
|
Industry allocation, driven mainly by an overweight to transportation and an underweight to energy.
|
|
↓
|
Quality positioning contributed to relative performance, but the effect of credit derivatives resulted in an overall negative contribution during the reporting period.
|
|
↓
|
Issuer selection within multiple sectors, including real estate investment trusts (REITs), basic industry and banking.
|
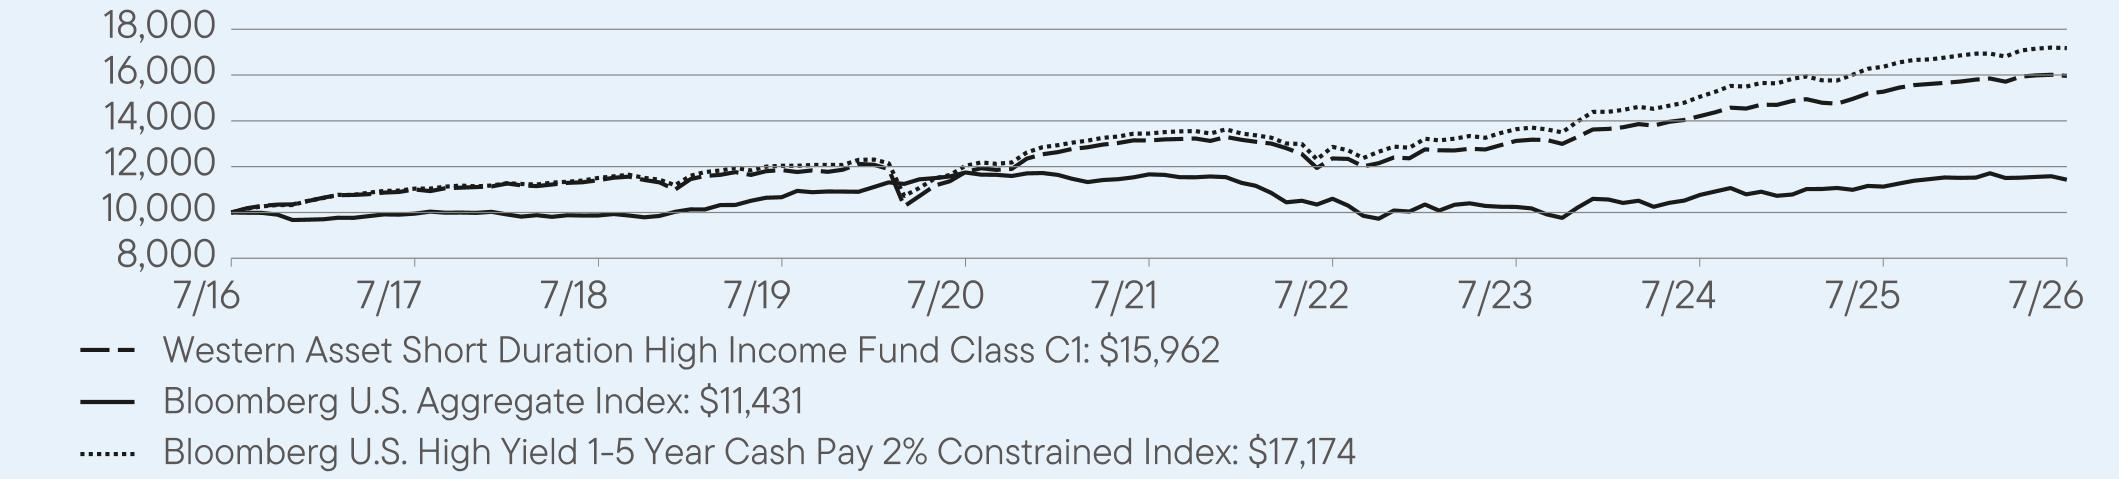
AVERAGE ANNUAL TOTAL RETURNS (%) Period Ended July 31, 2026
|
|
1 Year
|
5 Year
|
10 Year
|
|
Class C1
|
4.51
|
3.96
|
4.79
|
|
Class C1 (with sales charge)
|
3.53
|
3.96
|
4.79
|
|
Bloomberg U.S. Aggregate Index
|
2.71
|
-0.40
|
1.35
|
|
Bloomberg U.S. High Yield 1-5 Year Cash Pay 2% Constrained Index
|
4.96
|
5.02
|
5.56
|
For current month-end performance, please call Franklin Templeton at 877-6LM-FUND/656-3863 or visit
https://www.franklintempleton.com/investments/options/mutual-funds.
https://www.franklintempleton.com/investments/options/mutual-funds.
Important data provider notices and terms available at www.franklintempletondatasources.com.
KEY FUND STATISTICS (as of July 31, 2026)
|
Total Net Assets
|
$581,787,132
|
|
Total Number of Portfolio Holdings (excludes derivatives, except purchased options, if any)
|
411
|
|
Total Management Fee Paid
|
$2,967,308
|
|
Portfolio Turnover Rate
|
61%
|
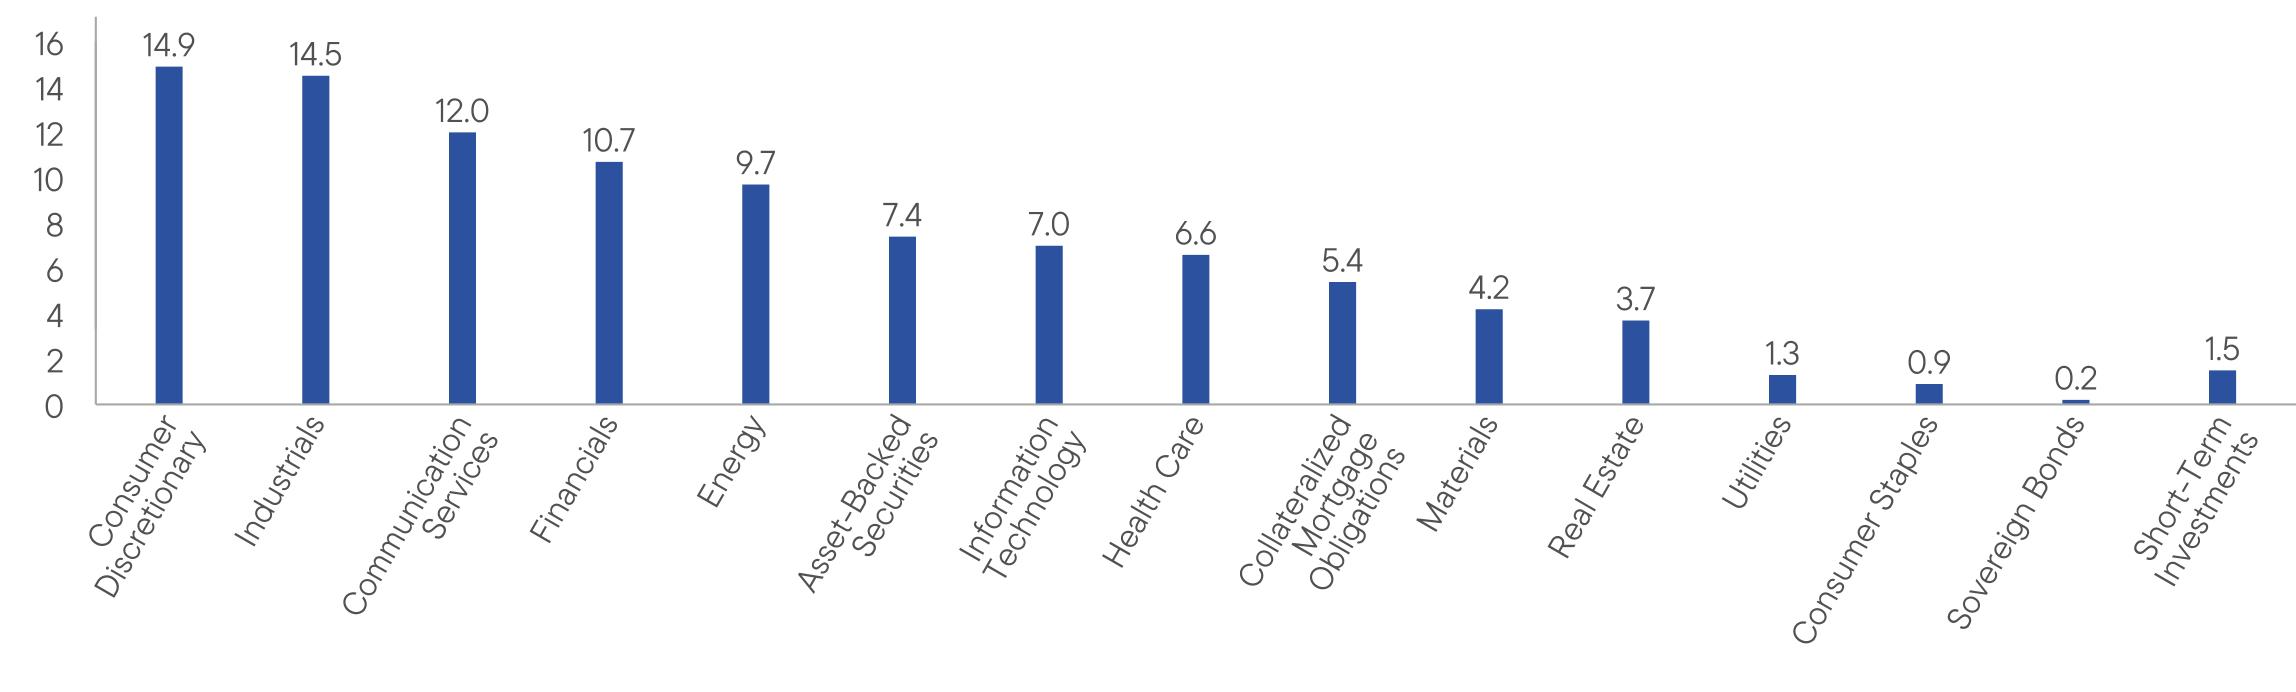
WHAT DID THE FUND INVEST IN? (as of July 31, 2026)
Portfolio Composition* (% of Total Investments)
WHAT WERE THE FUND COSTS FOR THE LAST YEAR? (based on a hypothetical $10,000 investment)
|
Class Name
|
Costs of a $10,000 investment
|
Costs paid as a percentage of a $10,000 investment*
|
|
Class R
|
$143
|
1.40%
|
HOW DID THE FUND PERFORM LAST YEAR AND WHAT AFFECTED ITS PERFORMANCE?
For the twelve months ended July 31, 2026, Class R shares of Western Asset Short Duration High Income Fund returned 4.98%. The Fund compares its performance to the Bloomberg U.S. High Yield 1-5 Year Cash Pay 2% Constrained Index, which returned 4.96% for the same period.
PERFORMANCE HIGHLIGHTS
|
Top contributors to performance:
|
|
|
↑
|
Issuer selection within multiple sectors, including technology, transportation and communications.
|
|
↑
|
Opportunistic allocation to structured products.
|
|
↑
|
Opportunistic allocation to emerging markets.
|
|
Top detractors from performance:
|
|
|
↓
|
Industry allocation, driven mainly by an overweight to transportation and an underweight to energy.
|
|
↓
|
Quality positioning contributed to relative performance, but the effect of credit derivatives resulted in an overall negative contribution during the reporting period.
|
|
↓
|
Issuer selection within multiple sectors, including real estate investment trusts (REITs), basic industry and banking.
|
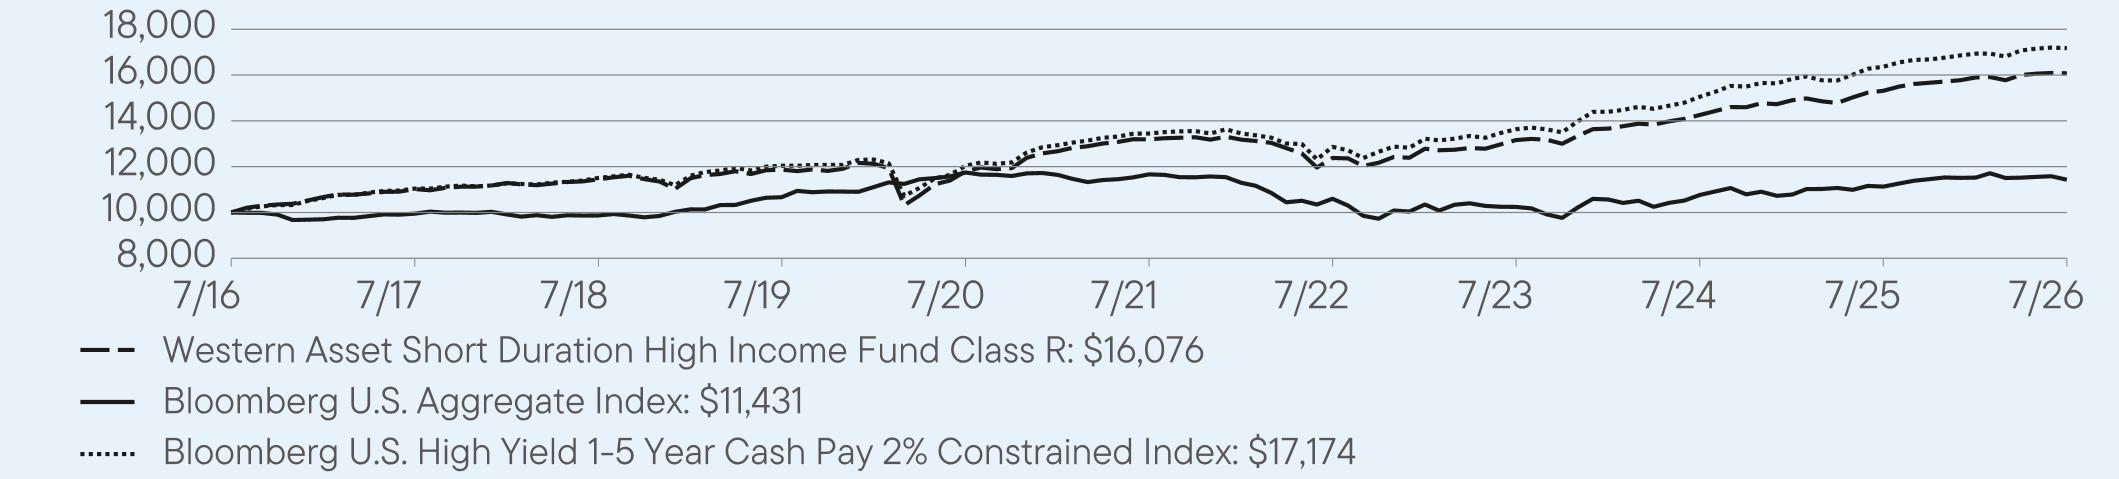
AVERAGE ANNUAL TOTAL RETURNS (%) Period Ended July 31, 2026
|
|
1 Year
|
5 Year
|
10 Year
|
|
Class R
|
4.98
|
4.03
|
4.86
|
|
Bloomberg U.S. Aggregate Index
|
2.71
|
-0.40
|
1.35
|
|
Bloomberg U.S. High Yield 1-5 Year Cash Pay 2% Constrained Index
|
4.96
|
5.02
|
5.56
|
For current month-end performance, please call Franklin Templeton at 877-6LM-FUND/656-3863 or visit
https://www.franklintempleton.com/investments/options/mutual-funds.
https://www.franklintempleton.com/investments/options/mutual-funds.
Important data provider notices and terms available at www.franklintempletondatasources.com.
KEY FUND STATISTICS (as of July 31, 2026)
|
Total Net Assets
|
$581,787,132
|
|
Total Number of Portfolio Holdings (excludes derivatives, except purchased options, if any)
|
411
|
|
Total Management Fee Paid
|
$2,967,308
|
|
Portfolio Turnover Rate
|
61%
|
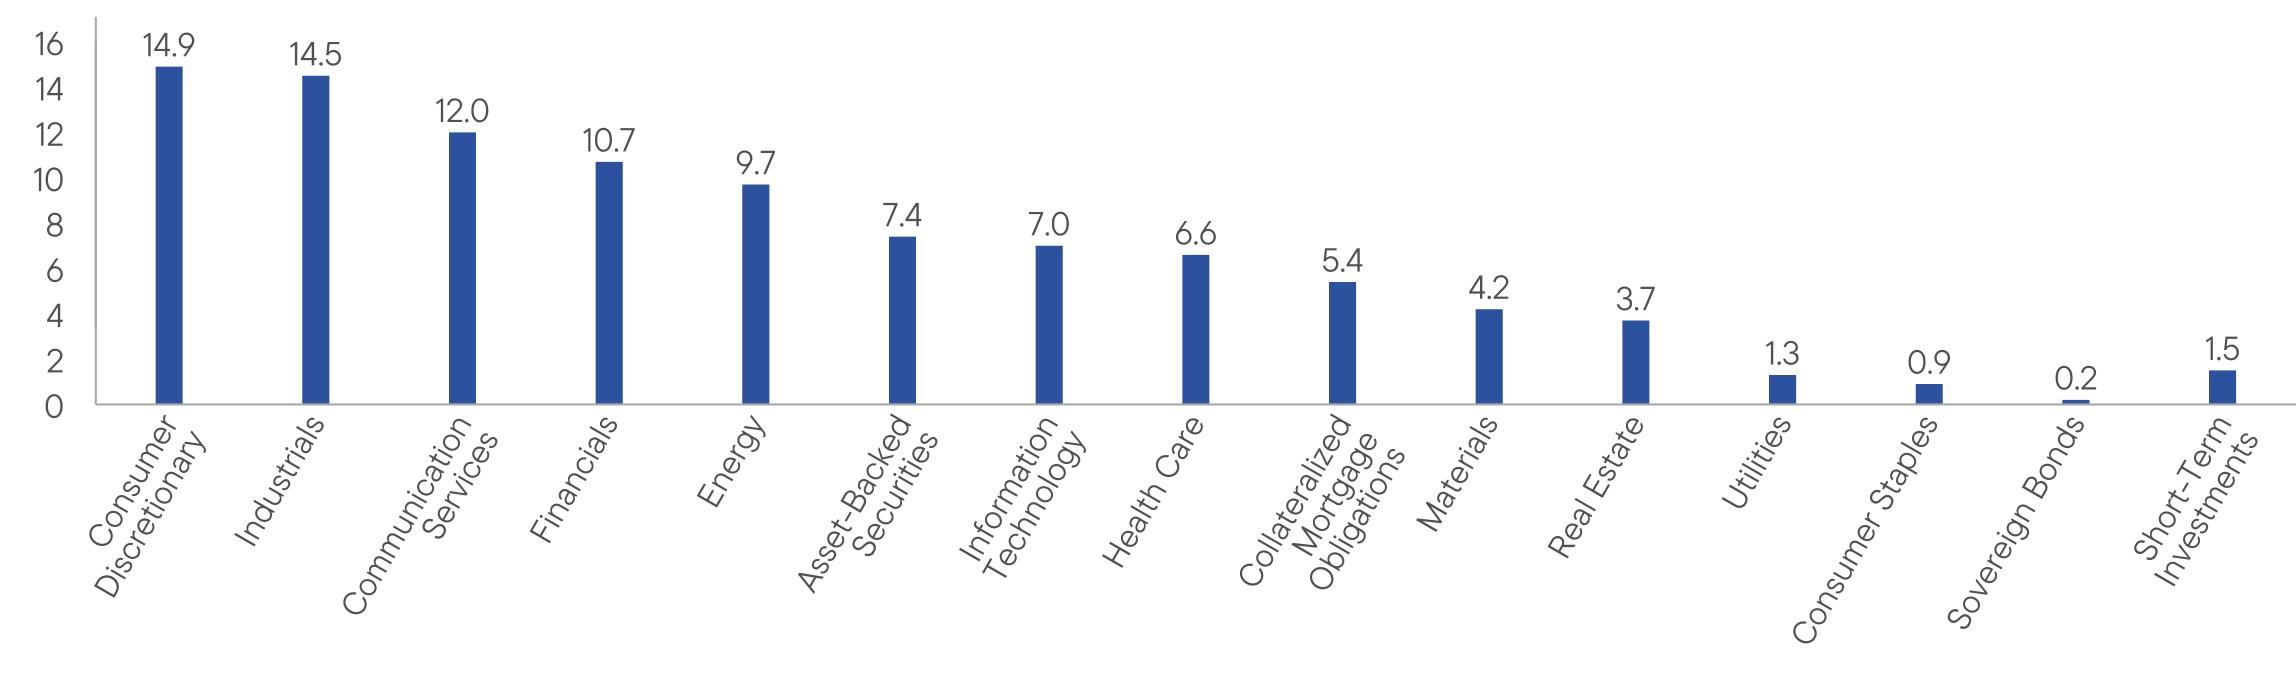
WHAT DID THE FUND INVEST IN? (as of July 31, 2026)
Portfolio Composition* (% of Total Investments)
WHAT WERE THE FUND COSTS FOR THE LAST YEAR? (based on a hypothetical $10,000 investment)
|
Class Name
|
Costs of a $10,000 investment
|
Costs paid as a percentage of a $10,000 investment*
|
|
Class I
|
$72
|
0.70%
|
HOW DID THE FUND PERFORM LAST YEAR AND WHAT AFFECTED ITS PERFORMANCE?
For the twelve months ended July 31, 2026, Class I shares of Western Asset Short Duration High Income Fund returned 5.72%. The Fund compares its performance to the Bloomberg U.S. High Yield 1-5 Year Cash Pay 2% Constrained Index, which returned 4.96% for the same period.
PERFORMANCE HIGHLIGHTS
|
Top contributors to performance:
|
|
|
↑
|
Issuer selection within multiple sectors, including technology, transportation and communications.
|
|
↑
|
Opportunistic allocation to structured products.
|
|
↑
|
Opportunistic allocation to emerging markets.
|
|
Top detractors from performance:
|
|
|
↓
|
Industry allocation, driven mainly by an overweight to transportation and an underweight to energy.
|
|
↓
|
Quality positioning contributed to relative performance, but the effect of credit derivatives resulted in an overall negative contribution during the reporting period.
|
|
↓
|
Issuer selection within multiple sectors, including real estate investment trusts (REITs), basic industry and banking.
|
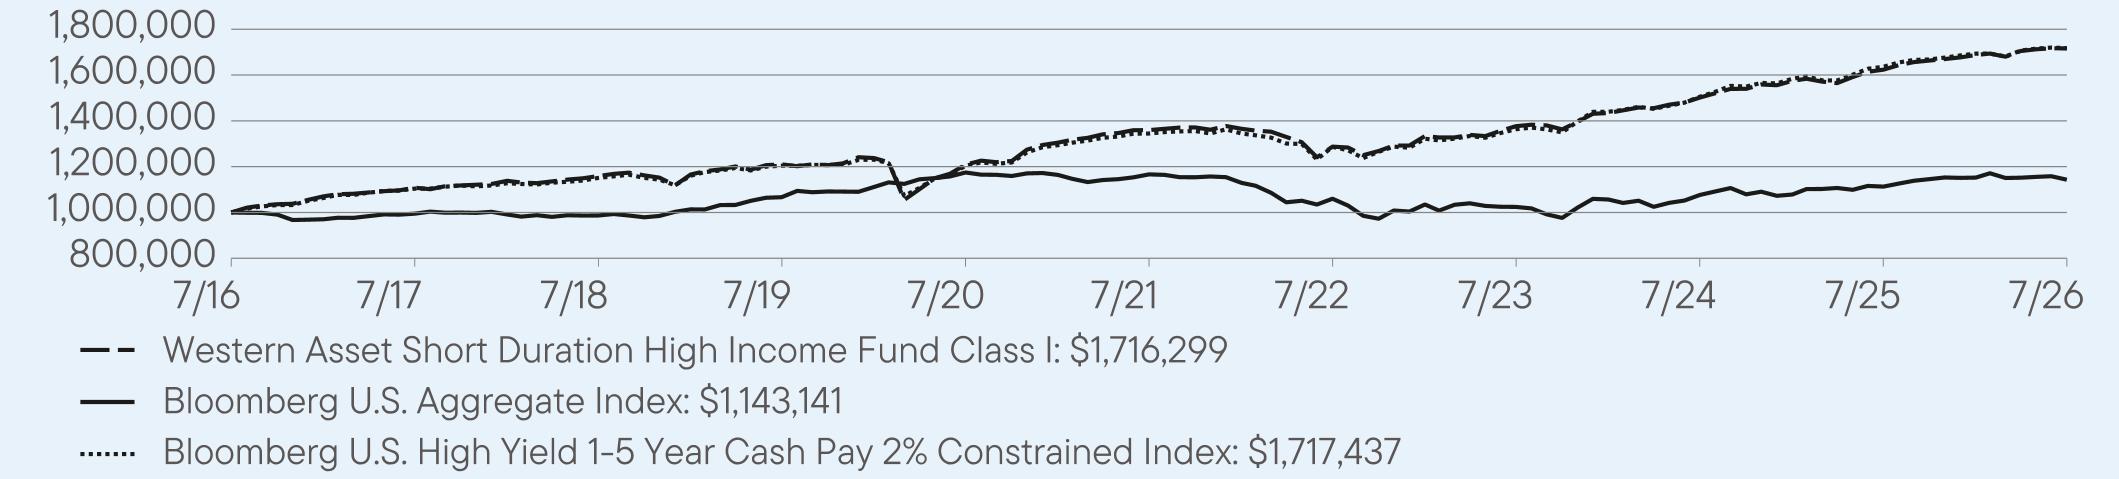
AVERAGE ANNUAL TOTAL RETURNS (%) Period Ended July 31, 2026
|
|
1 Year
|
5 Year
|
10 Year
|
|
Class I
|
5.72
|
4.77
|
5.55
|
|
Bloomberg U.S. Aggregate Index
|
2.71
|
-0.40
|
1.35
|
|
Bloomberg U.S. High Yield 1-5 Year Cash Pay 2% Constrained Index
|
4.96
|
5.02
|
5.56
|
For current month-end performance, please call Franklin Templeton at 877-6LM-FUND/656-3863 or visit
https://www.franklintempleton.com/investments/options/mutual-funds.
https://www.franklintempleton.com/investments/options/mutual-funds.
Important data provider notices and terms available at www.franklintempletondatasources.com.
KEY FUND STATISTICS (as of July 31, 2026)
|
Total Net Assets
|
$581,787,132
|
|
Total Number of Portfolio Holdings (excludes derivatives, except purchased options, if any)
|
411
|
|
Total Management Fee Paid
|
$2,967,308
|
|
Portfolio Turnover Rate
|
61%
|
WHAT DID THE FUND INVEST IN? (as of July 31, 2026)
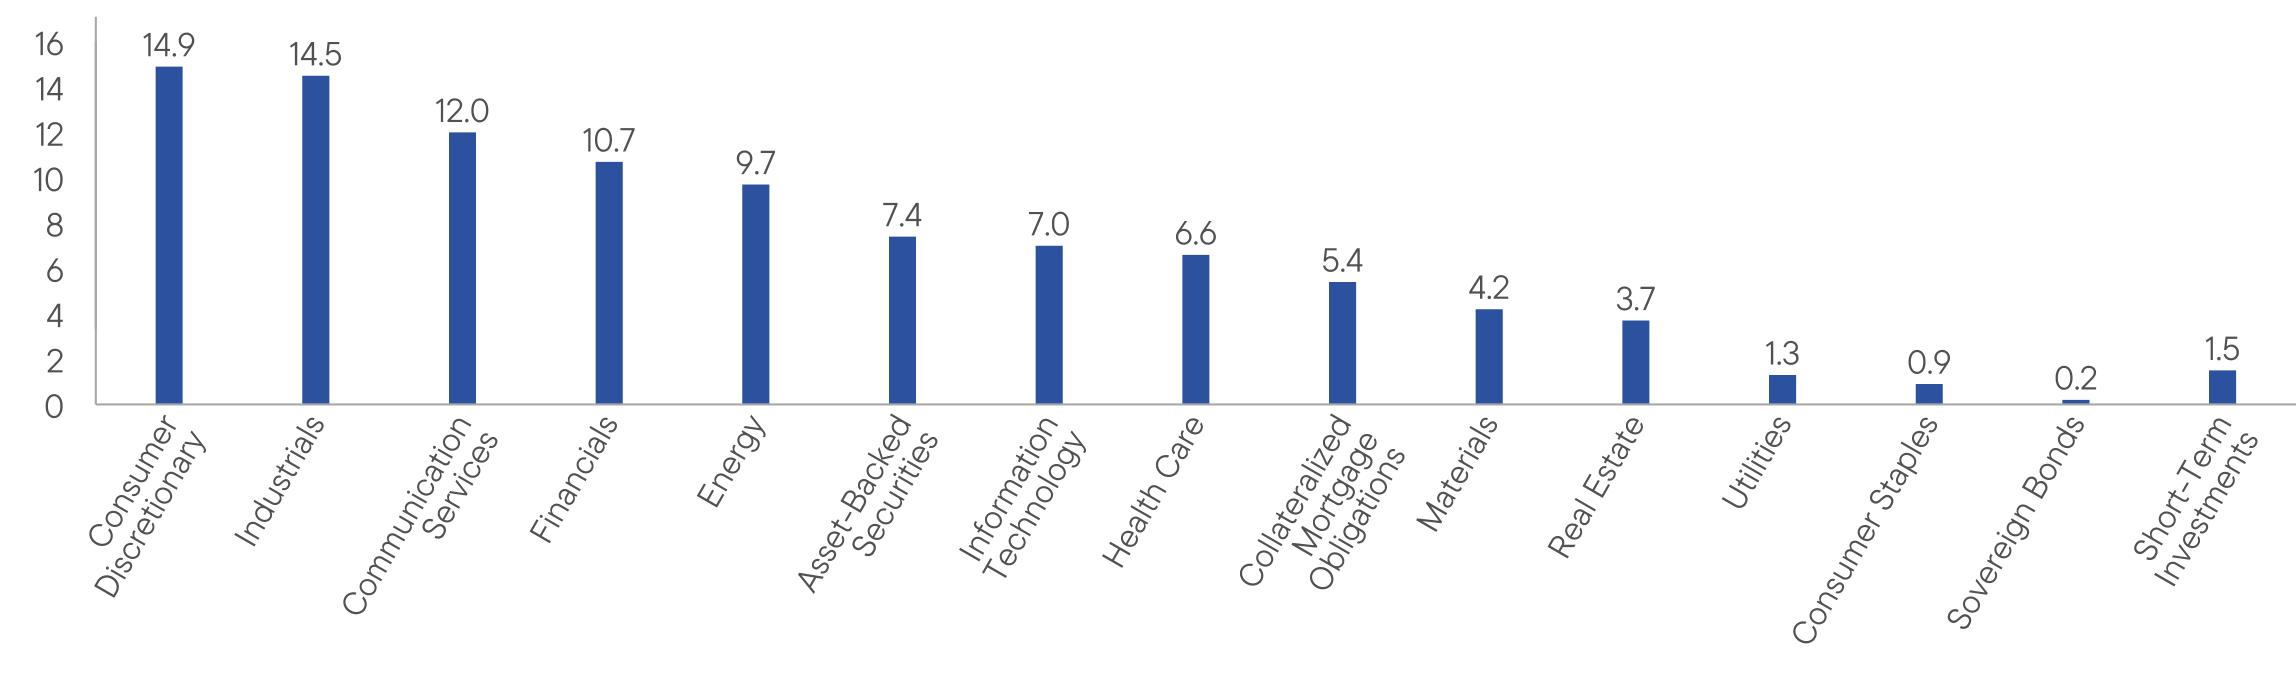
Portfolio Composition* (% of Total Investments)
| [1] |
|
||
| [2] |
|
||
| [3] |
|
||
| [4] |
|
||
| [5] |
|
||
| [6] |
|
||
| [7] |
|
||
| [8] |
|
||
| [9] |
|
||
| [10] |
|