Shareholder Report
Jul. 31, 2026
USD ($)
$ / shares
WHAT WERE THE FUND COSTS FOR THE LAST YEAR? (based on a hypothetical $10,000 investment)
|
Class Name
|
Costs of a $10,000 investment
|
Costs paid as a percentage of a $10,000 investment
|
|
Class A
|
$87
|
0.84%
|
HOW DID THE FUND PERFORM LAST YEAR AND WHAT AFFECTED ITS PERFORMANCE?
For the twelve months ended July 31, 2026, Class A shares of Western Asset Municipal High Income Fund returned 7.09%. The Fund compares its performance to the Bloomberg Municipal Bond Index, which returned 5.27% for the same period.
PERFORMANCE HIGHLIGHTS
|
Top contributors to performance:
|
|
|
↑
|
Rates positioning
|
|
↑
|
Overweight industrial revenue
|
|
↑
|
Issue selection within industrial revenue
|
|
Top detractors from performance:
|
|
|
↓
|
Overweight education
|
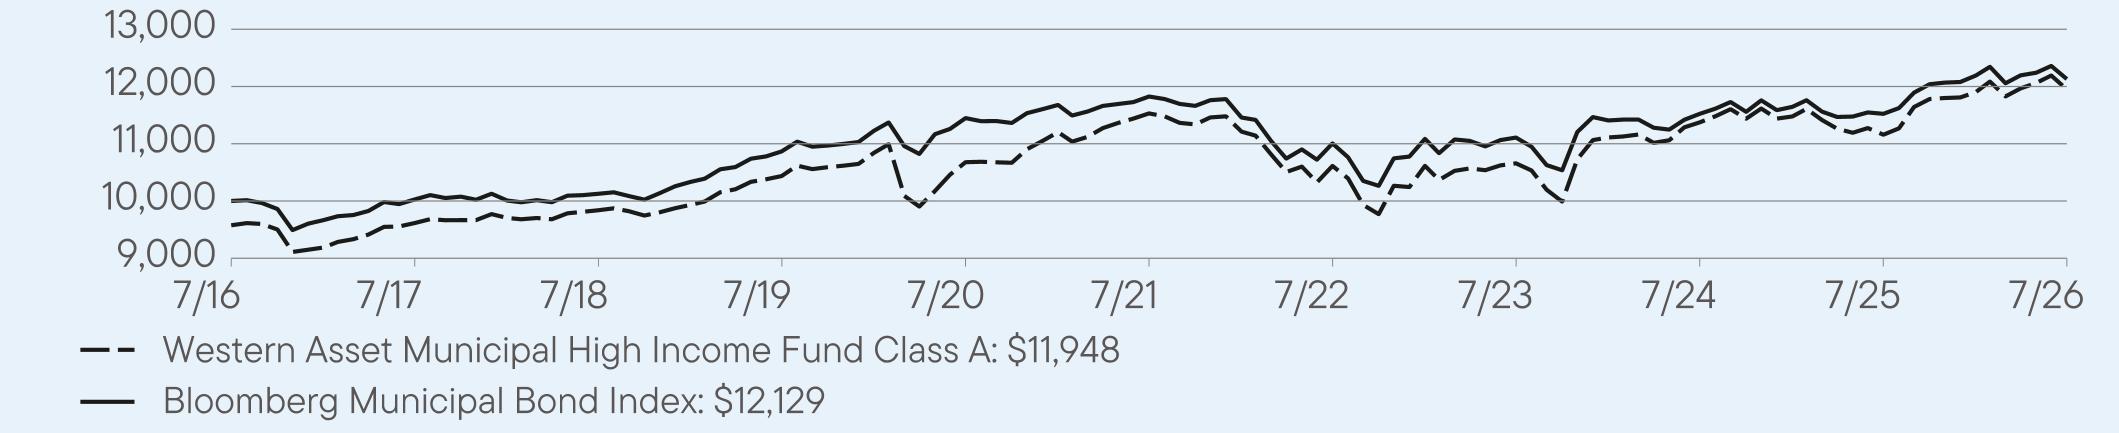
AVERAGE ANNUAL TOTAL RETURNS (%) Period Ended July 31, 2026
|
|
1 Year
|
5 Year
|
10 Year
|
|
Class A
|
7.09
|
0.72
|
2.24
|
|
Class A (with sales charge)
|
3.07
|
-0.15
|
1.80
|
|
Bloomberg Municipal Bond Index
|
5.27
|
0.51
|
1.95
|
For current month-end performance, please call Franklin Templeton at 877-6LM-FUND/656-3863 or visit
https://www.franklintempleton.com/investments/options/mutual-funds.
https://www.franklintempleton.com/investments/options/mutual-funds.
Important data provider notices and terms available at www.franklintempletondatasources.com.
KEY FUND STATISTICS (as of July 31, 2026)
|
Total Net Assets
|
$243,783,897
|
|
Total Number of Portfolio Holdings
|
206
|
|
Total Management Fee Paid
|
$1,112,713
|
|
Portfolio Turnover Rate
|
3%
|
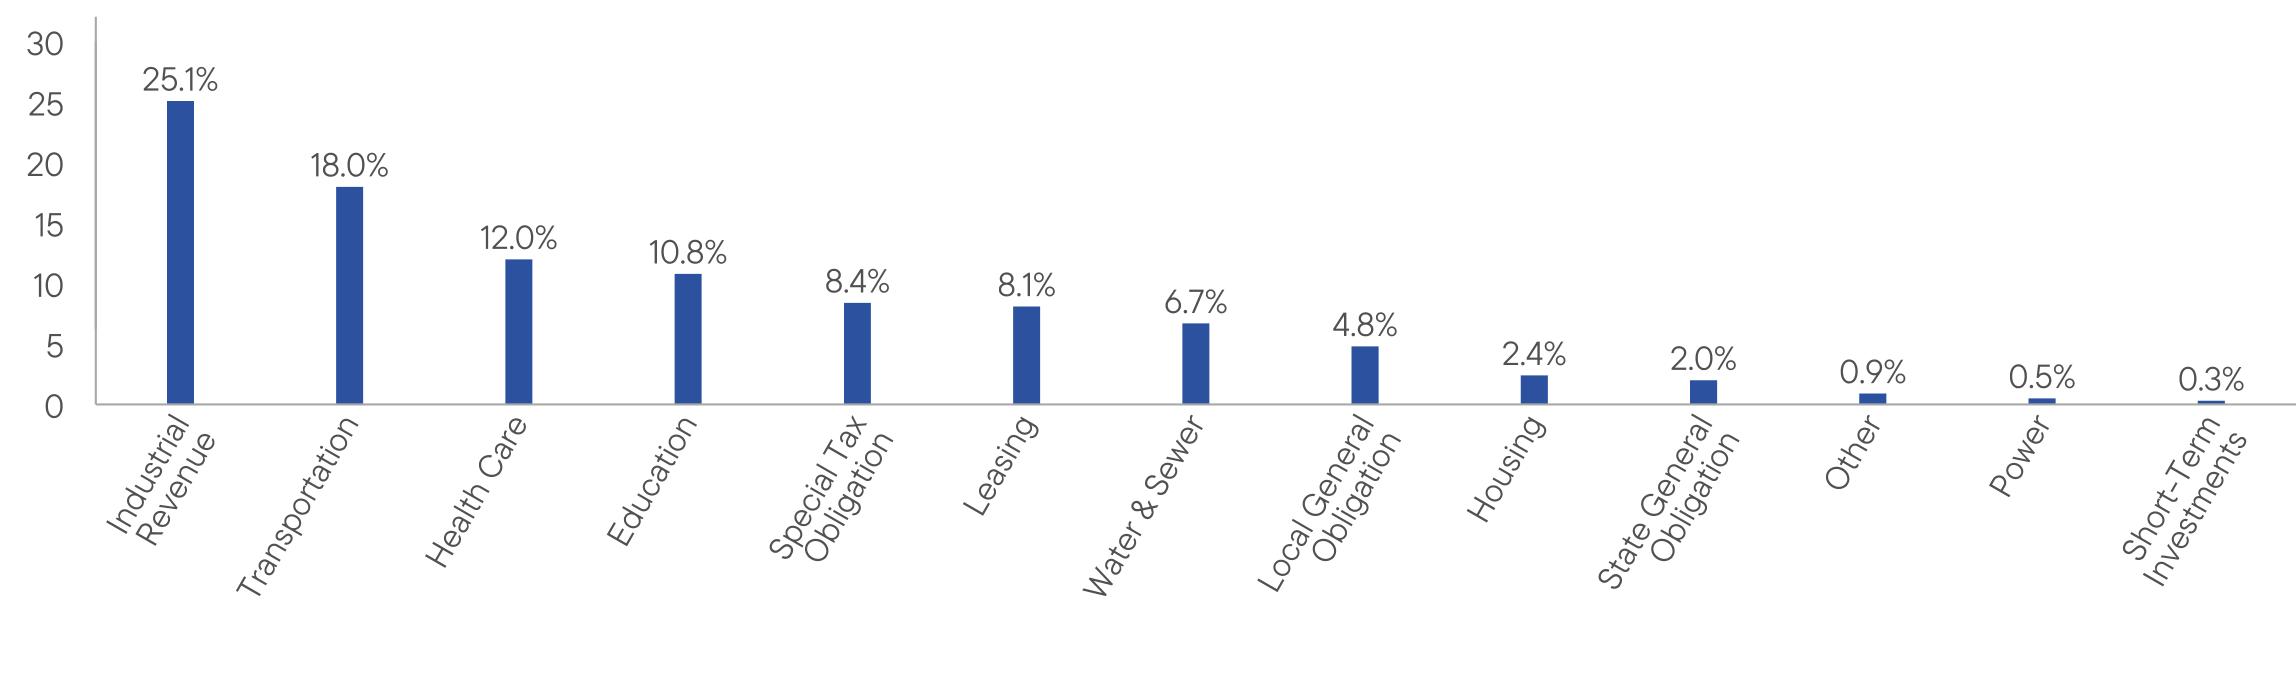
WHAT DID THE FUND INVEST IN? (as of July 31, 2026)
Portfolio Composition* (% of Total Investments)
WHAT WERE THE FUND COSTS FOR THE LAST YEAR? (based on a hypothetical $10,000 investment)
|
Class Name
|
Costs of a $10,000 investment
|
Costs paid as a percentage of a $10,000 investment
|
|
Class C
|
$142
|
1.37%
|
HOW DID THE FUND PERFORM LAST YEAR AND WHAT AFFECTED ITS PERFORMANCE?
For the twelve months ended July 31, 2026, Class C shares of Western Asset Municipal High Income Fund returned 6.63%. The Fund compares its performance to the Bloomberg Municipal Bond Index, which returned 5.27% for the same period.
PERFORMANCE HIGHLIGHTS
|
Top contributors to performance:
|
|
|
↑
|
Rates positioning
|
|
↑
|
Overweight industrial revenue
|
|
↑
|
Issue selection within industrial revenue
|
|
Top detractors from performance:
|
|
|
↓
|
Overweight education
|
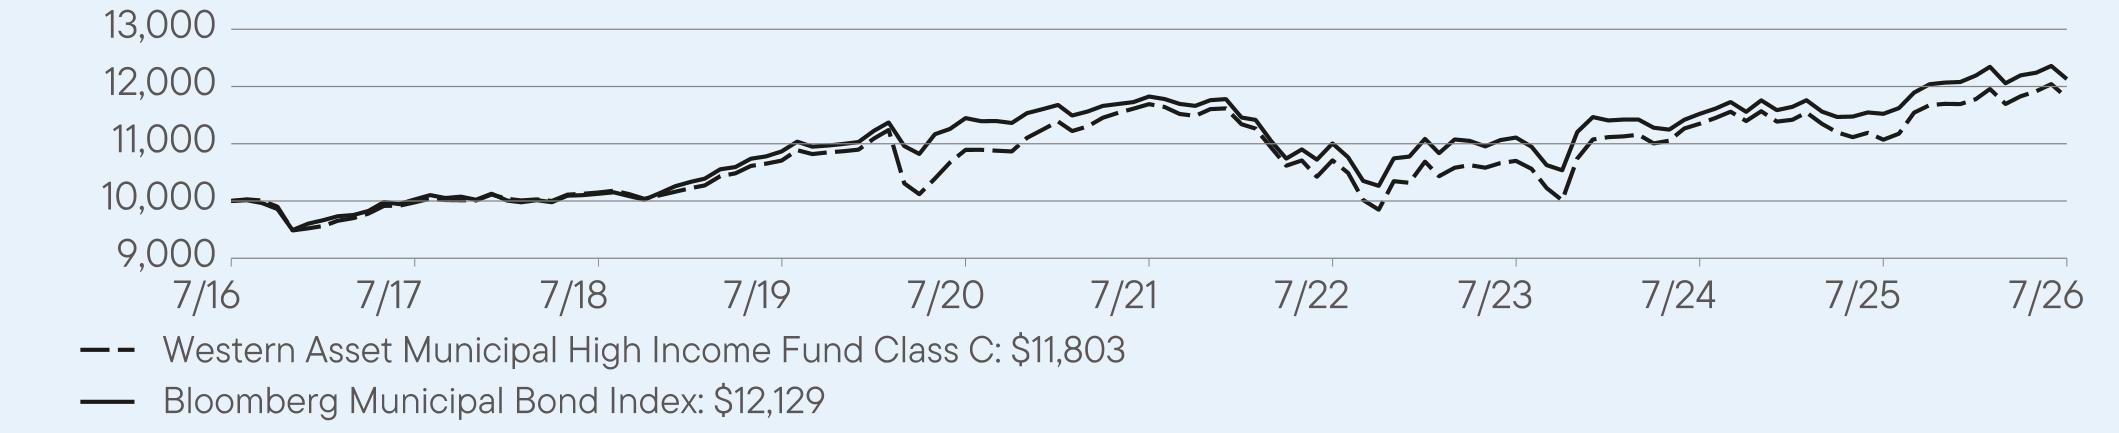
AVERAGE ANNUAL TOTAL RETURNS (%) Period Ended July 31, 2026
|
|
1 Year
|
5 Year
|
10 Year
|
|
Class C
|
6.63
|
0.19
|
1.67
|
|
Class C (with sales charge)
|
5.63
|
0.19
|
1.67
|
|
Bloomberg Municipal Bond Index
|
5.27
|
0.51
|
1.95
|
For current month-end performance, please call Franklin Templeton at 877-6LM-FUND/656-3863 or visit
https://www.franklintempleton.com/investments/options/mutual-funds.
https://www.franklintempleton.com/investments/options/mutual-funds.
Important data provider notices and terms available at www.franklintempletondatasources.com.
KEY FUND STATISTICS (as of July 31, 2026)
|
Total Net Assets
|
$243,783,897
|
|
Total Number of Portfolio Holdings
|
206
|
|
Total Management Fee Paid
|
$1,112,713
|
|
Portfolio Turnover Rate
|
3%
|
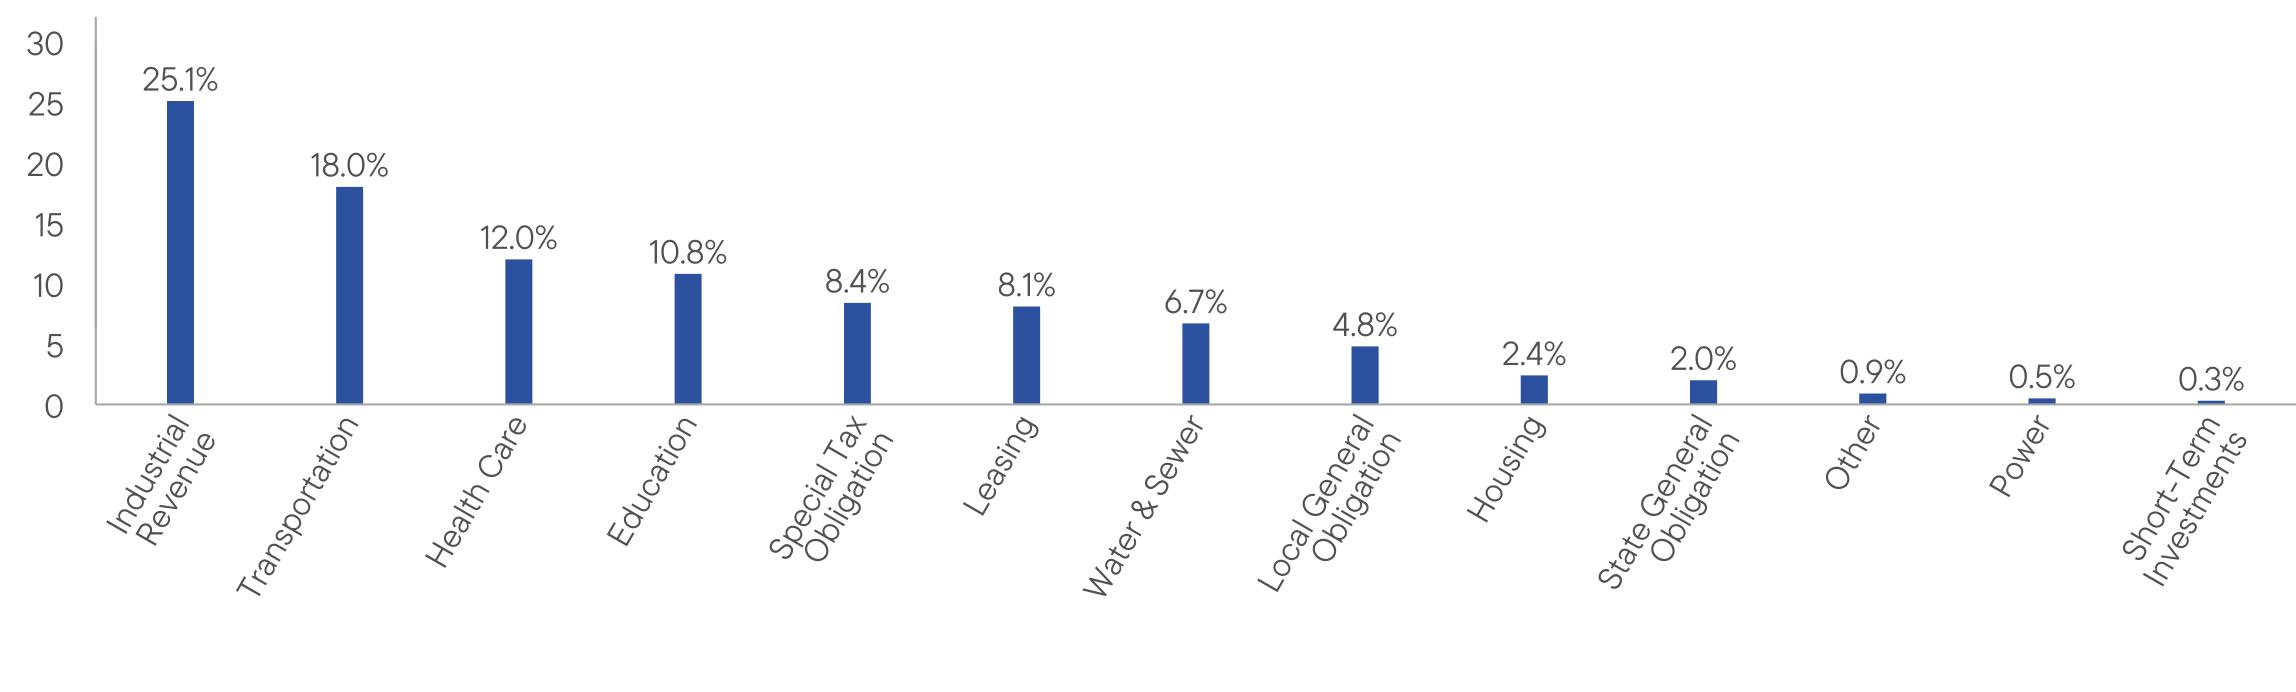
WHAT DID THE FUND INVEST IN? (as of July 31, 2026)
Portfolio Composition* (% of Total Investments)
WHAT WERE THE FUND COSTS FOR THE LAST YEAR? (based on a hypothetical $10,000 investment)
|
Class Name
|
Costs of a $10,000 investment
|
Costs paid as a percentage of a $10,000 investment*
|
|
Class I
|
$64
|
0.62%
|
HOW DID THE FUND PERFORM LAST YEAR AND WHAT AFFECTED ITS PERFORMANCE?
For the twelve months ended July 31, 2026, Class I shares of Western Asset Municipal High Income Fund returned 7.42%. The Fund compares its performance to the Bloomberg Municipal Bond Index, which returned 5.27% for the same period.
PERFORMANCE HIGHLIGHTS
|
Top contributors to performance:
|
|
|
↑
|
Rates positioning
|
|
↑
|
Overweight industrial revenue
|
|
↑
|
Issue selection within industrial revenue
|
|
Top detractors from performance:
|
|
|
↓
|
Overweight education
|
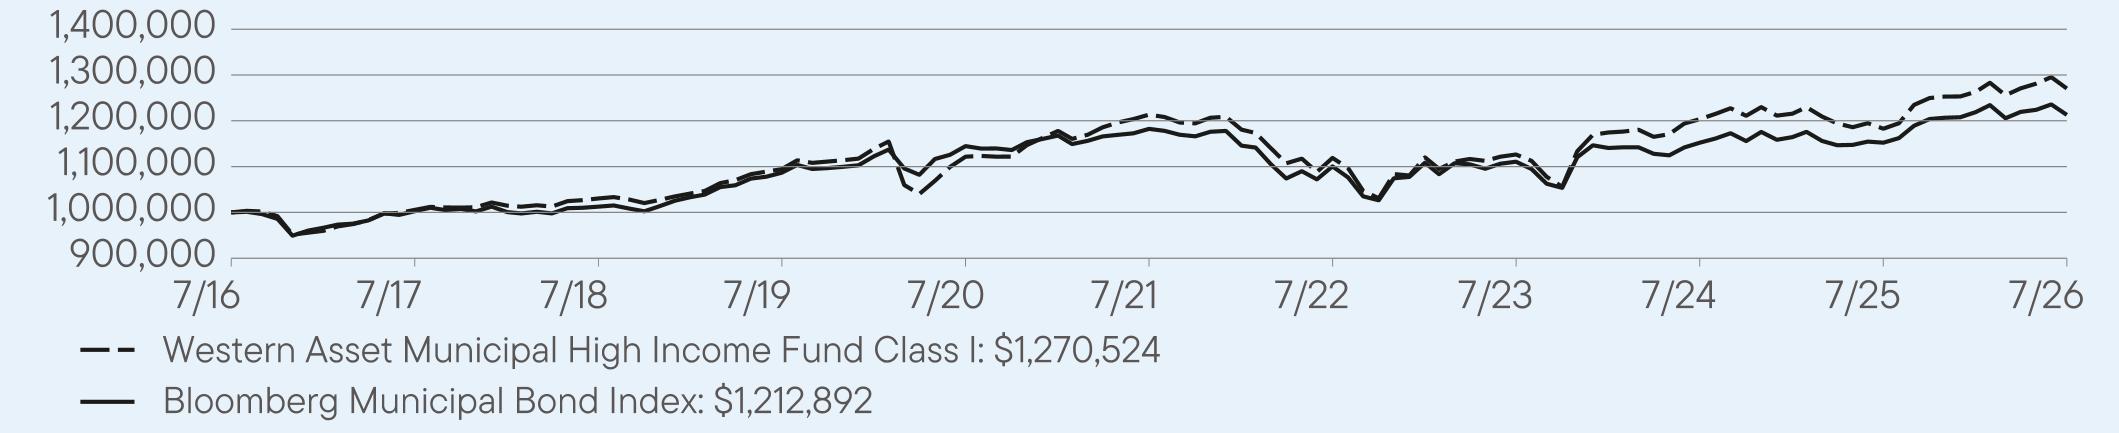
AVERAGE ANNUAL TOTAL RETURNS (%) Period Ended July 31, 2026
|
|
1 Year
|
5 Year
|
10 Year
|
|
Class I
|
7.42
|
0.92
|
2.42
|
|
Bloomberg Municipal Bond Index
|
5.27
|
0.51
|
1.95
|
For current month-end performance, please call Franklin Templeton at 877-6LM-FUND/656-3863 or visit
https://www.franklintempleton.com/investments/options/mutual-funds.
https://www.franklintempleton.com/investments/options/mutual-funds.
Important data provider notices and terms available at www.franklintempletondatasources.com.
KEY FUND STATISTICS (as of July 31, 2026)
|
Total Net Assets
|
$243,783,897
|
|
Total Number of Portfolio Holdings
|
206
|
|
Total Management Fee Paid
|
$1,112,713
|
|
Portfolio Turnover Rate
|
3%
|
WHAT DID THE FUND INVEST IN? (as of July 31, 2026)
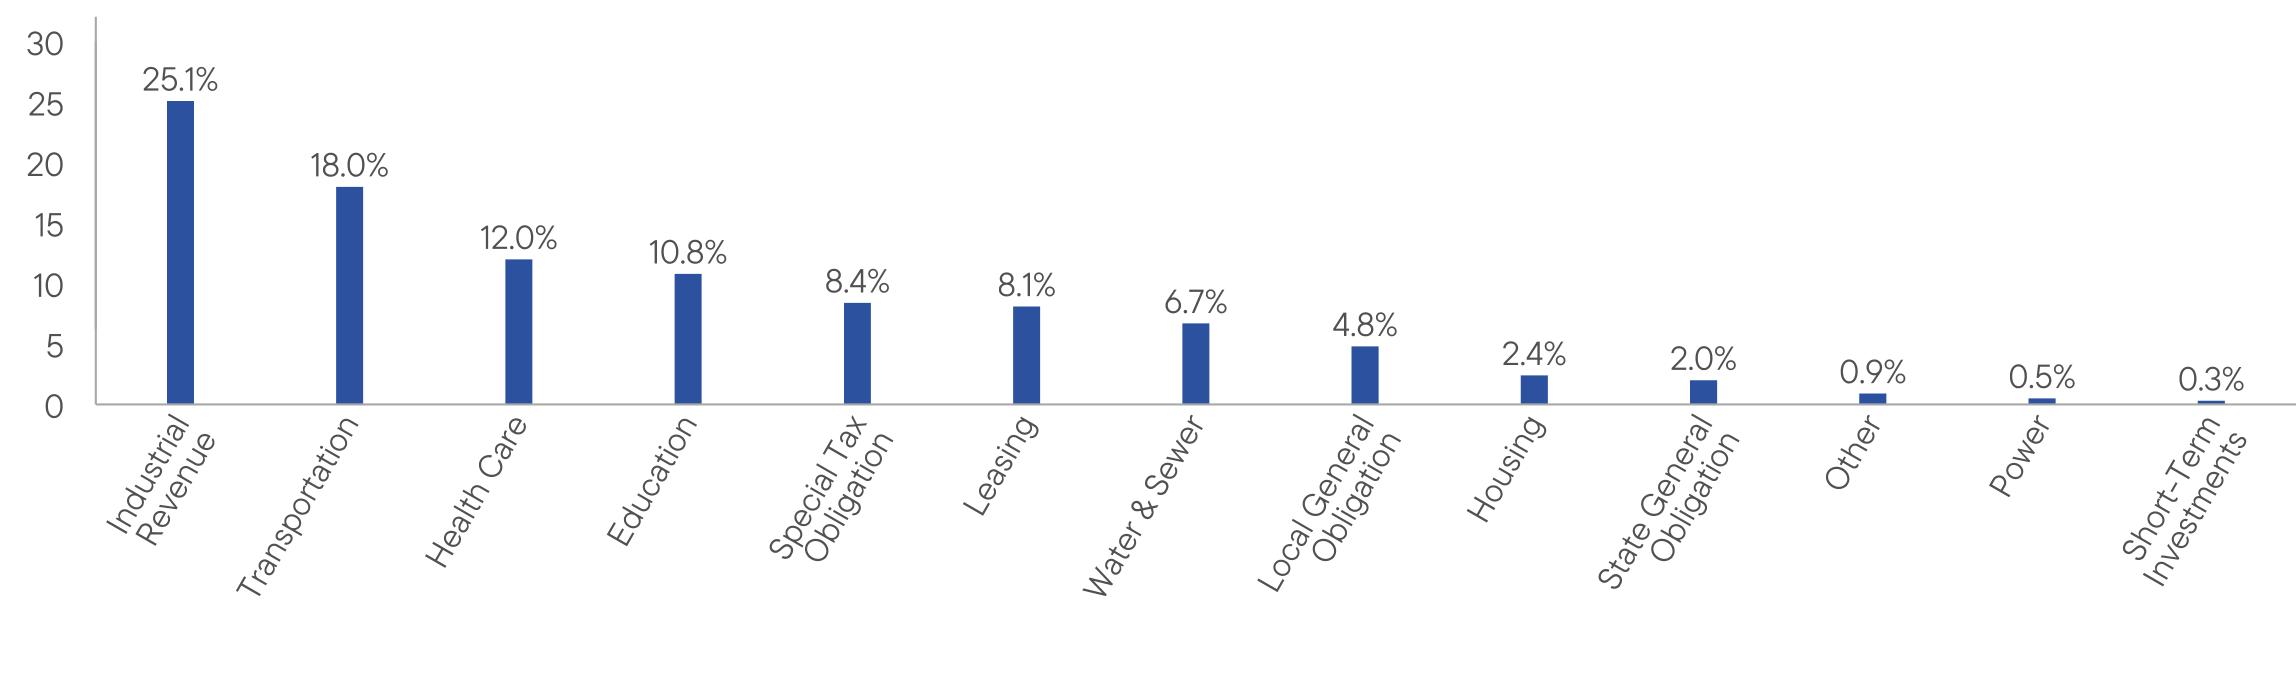
Portfolio Composition* (% of Total Investments)
| [1] |
|
||
| [2] |
|
||
| [3] |
|
||
| [4] |
|